Embed Size (px)
Citation preview
Investigation of Mediational ProcessesUsing Parallel Process Latent Growth
Curve Modeling
JeeWon CheongDepartment of Psychology
State University of New York at Albany
David P. MacKinnon and Siek Toon KhooDepartment of PsychologyArizona State University
This study investigated a method to evaluate mediational processes using latent growthcurve modeling. The mediator and the outcome measured across multiple time pointswere viewed as 2 separate parallel processes. The mediational process was defined asthe independent variable influencing the growth of the mediator, which, in turn, af-fected the growth of the outcome. To illustrate modeling procedures, empirical datafrom a longitudinal drug prevention program, Adolescents Training and Learning toAvoid Steroids, were used. The program effects on the growth of the mediator and thegrowth of the outcome were examined first in a 2-group structural equation model. Themediational process was then modeled and tested in a parallel process latent growthcurve model by relating the prevention program condition, the growth rate factor of themediator, and the growth rate factor of the outcome.
Most prevention studies are based on theories that specify causal variables that havean effect on the outcome, and the prevention programs include the components de-signedtomodify thesecausalvariables toobtain thedesiredoutcome.Forexample,adrug prevention program based on Social Learning Theory (Bandura, 1977) may in-clude program components to teach adolescents refusal skills and correct theirmisperception of the prevalence of drug use, aiming to reduce the social environ-mental influences. A drug prevention program based on the Health Belief Model(Janz&Becker,1984)mayseek to increaseadolescents’perceptionof susceptibilityto the negative effects of drugs. If the theory is correct, changing the causal variables,
STRUCTURAL EQUATION MODELING, 10(2), 238–262Copyright © 2003, Lawrence Erlbaum Associates, Inc.
Requests for reprints should be sent to David P. MacKinnon, Department of Psychology, ArizonaState University, Box 871104, Tempe, AZ 85287–1104. E-mail: [email protected]

such as social environmental influence for Social Learning Theory and perceivedsusceptibility for Health Behavior Theory, will prevent drug use.
Despite the theoretical basis of prevention programs, most evaluation studiesneglect the link between theory and evaluation (Judd & Kenny, 1981; MacKinnon& Dwyer, 1993). Until recently, the success of a prevention trial has been assessedonly by the change in the outcome; that is, whether the treatment program reducedthe harmful outcome or enhanced the desired outcome. Assessing a preventiontrial only by the change in the outcome variable may provide a gross assessment ofwhether or not a program works, but may fail to identify the underlying mecha-nisms concerning how the program achieved or failed to achieve its effects. Theevaluation of a program should involve more specific investigation by laying outprogram components and identifying causal links based on theory (Chen, 1990;Donaldson, Graham, & Hansen, 1994; MacKinnon, 1994).
Mediation analysis has been introduced as an appropriate method for the-ory-driven evaluation of prevention trials (MacKinnon & Dwyer, 1993;MacKinnon et al., 1991). Mediation analysis is important in that it allows research-ers not only to assess the success of the program, but also to obtain more specificinformation on how the program succeeded or failed. Through mediation analysis,researchers can obtain information on whether the prevention program success-fully changed the mediating variable and whether the change in the mediating vari-able was responsible for the change in the outcome (Baron & Kenny, 1986;MacKinnon & Dwyer, 1993). Furthermore, researchers can estimate and test thesignificance of the mediated effect (MacKinnon, 2000; MacKinnon & Dwyer,1993; MacKinnon, Warsi, & Dwyer, 1995). For example, if adolescent drug usedecreased in the group receiving a social influences based drug prevention pro-gram, researchers may want to explore whether the resistance skills enhanced bythe prevention program were responsible for the success of the program. Such in-formation may be more valuable when a prevention trial was not successful. If thetreatment program did not work as expected, findings about which componentswere successful and which were not can provide valuable information for the de-sign of future studies.
As the main goal of prevention trials is to change outcomes, using the appropri-ate methods to estimate the change has been a critical issue. Recently, researchershave pointed out the inadequacy of using pre- and postintervention measures to es-timate the longitudinal change (Rogosa, 1988; Rogosa, Brandt, & Zimowski,1982; Willett & Sayer, 1994). Measures at two time points contain only minimalinformation on individual change, and it may be misleading to specify individualchanges over time with two data points when the trajectory follows a shape otherthan a straight line (e.g., quadratic or exponential) or when there is a fluctuation ofscores between the two time points. Longitudinal growth modeling has been advo-cated as a better method for answering questions about individual change overtime and individual differences in change (Rogosa, 1988; Rogosa et al., 1982;
MEDIATION USING PARALLEL PROCESS LATENT GROWTH CURVE MODELING 239

Willett & Sayer, 1994). In particular, the investigation of how each constructchanges over time should precede the examination of the relation between the twoconstructs (Raudenbush, 2001; Rogosa, 1988), when the research question in-volves the long-term relation between two different constructs, such as a mediatorand an outcome.
The purpose of this study is to illustrate how to carry out mediation analysis us-ing latent growth modeling (LGM) in the case of longitudinal randomized preven-tion trials. Several studies (e.g., Muthén & Curran, 1997; Raudenbush, 2001;Willett & Sayer, 1994) have described methods for LGM, and studies evaluatingthe effect of prevention programs using LGM (e.g., Park et al., 2000; Taylor, Gra-ham, Cumsille, & Hansen, 2000) have started to appear in scholarly journals. Inthis study, we expand the application of the LGM approach to mediation analysis.The modeling procedures are demonstrated by estimating a series of latent growthmodels using a data set from a longitudinal drug prevention study designed to re-duce adolescent football players’ anabolic steroid use (Goldberg et al., 1996;Goldberg et al., 2000).
ESTIMATION AND TEST OF THE MEDIATED EFFECT
The basic single mediator causal model, on which the prevention trials are based, isillustrated in Figure 1. Here, the theory-based causal variables can be conceptual-ized as potential mediating variables (M) intervening in the relation between theprevention program (X) and the outcome variable (Y). The prevention program in-fluences the outcome directly and also indirectly through the mediator. Chen(1990) used the term action theory to refer to the link between the treatment pro-gram and the mediating variables and the term conceptual theory to refer to thelink between the mediating variables and the outcome variable.
One of the most commonly used methods to obtain the point estimate of themediated effect is the product of coefficients method (Aroian, 1947; Goodman,1960; MacKinnon & Dwyer, 1993; MacKinnon, Lockwood, Hoffman, West, &Sheets, 2002; MacKinnon et al., 1995; Sobel, 1982). In the product of coeffi-cients method, the following regression equations are estimated to obtain the me-diated effect:
In Equation 1, the potential mediator M is regressed on the prevention program X.In Equation 2, the outcome variable Y is regressed on the prevention program X andthe potential mediator M. The coefficient α represents the effect of the prevention
240 CHEONG, MACKINNON, KHOO
01 1 (1)M Xβ α ε� � �
02 2 (2)Y M Xβ β τ ε�� � � �

program on the potential mediator. The coefficient β denotes the effect of the po-tential mediator on the outcome after controlling for the effect of the preventionprogram. Similarly, the coefficient τ′ represents the effect of the prevention pro-gram on the outcome variable after controlling for the effect of the mediator. Theconstants β01 and β02 are the regression intercept terms and ε1 and ε2 are residualsin the two equations. The mediated effect is estimated by the product of the two re-gression coefficients for α and β, conveying that the mediated effect is determinedby the extent to which the treatment program changes the mediator (α) and the ex-tent to which the mediator, in turn, changes the outcome (β).
There are several ways to estimate the variance of the product of two coeffi-cients (αβ), any of which can be used for estimation of the standard error of themediated effect to conduct a significance test and to obtain confidence intervals(CIs) of the mediated effect (see MacKinnon, Lockwood, Hoffman, et al., 2002).One of the most commonly used formulas for the standard error of the product oftwo coefficients is based on the multivariate delta method (Sobel, 1982) or thefirst-order Taylor series as follows:
where α and σα are the regression coefficient and its standard error in Equation 1and β and σβ are the regression coefficient and its standard error in Equation 2. Forobserved data, sample estimates of α, σα, β, and σβ are inserted in Equation 3. Thesignificance test of the mediated effect is conducted by dividing the estimate of themediated effect (αβ) by the estimated standard error (σαβ), which is compared to astandard normal distribution. The first-order solution method (Sobel, 1982) is
MEDIATION USING PARALLEL PROCESS LATENT GROWTH CURVE MODELING 241
FIGURE 1 A single mediator model.
2 22 2 (3)αβ αβσ α σ β σ� �

widely used, being implemented in the SEM software programs such as LISRELand EQS; however, it was found to have low statistical power because the distribu-tion of the product of the two random variables is not always normally distributed(MacKinnon, Lockwood, & Williams, 2002).
In an alternative method called the asymmetric CI method (MacKinnon,Lockwood, Hoffman, et al., 2002), both α and β coefficients are converted to zscores (i.e., zα = α/σα and zβ = β/σβ) and the critical values for the two z scoresare found from the tables in Meeker et al. (1981) to construct the CI. Becausethe distribution of the product of αβ is often asymmetric, different values areused for the upper and lower critical values. Using these critical values, thelower confidence limits (LCLs) and upper confidence limits (UCLs) are com-puted by UCL = αβ + (upper critical value)*σαβ and LCL = αβ + (lower criticalvalue)*σαβ. When the CI does not include zero, the mediated effect is consid-ered statistically significant. According to an extensive simulation study(MacKinnon, Lockwood, Hoffman, et al., 2002), the asymmetric CI method hasgreater power compared to other methods for testing mediation.
LATENT GROWTH CURVE MODELING
Growth curve modeling is a way to investigate individual differences in changeover time and explore the predictors of these individual differences. A growthcurve model can be formulated in the multilevel modeling framework (Bryk &Raudenbush, 1992; Goldstein, 1995; Raudenbush, 2001) utilizing random coeffi-cients modeling (Longford, 1993) and also in the structural equation modeling(SEM) framework (Meredith & Tisak, 1990; Muthén & Curran, 1997; Willett &Sayer, 1994). When growth curve modeling is carried out in the conventional SEMframework, the growth of a measured variable can be modeled in the measurementmodel as follows:
where Yi is a T × 1 vector of repeated measures of the variable Y for individual iover the T time points (t = 0, 1, 2, �, T), νi is a T × 1 vector of the intercepts of therepeated measures, Λ is a T × J matrix of factor loadings on the growth factors, ηi isa J × 1 vector of J latent factors representing the growth parameters, and εi is a T × 1vector of measurement errors.
The distinctive feature of latent growth curve model is in the Ληi term, wherethe growth factors and the growth trajectory shape are defined. For example, for alinear growth across six time points (T = 6) at equal intervals, Equation 4 can be re-written in the following matrix form:
242 CHEONG, MACKINNON, KHOO
(4)i i i iY ν Λη ε� � �

The latent factor η1i is the status factor, representing the true level at T = 0. In thisexample, η1i denotes the initial status at the first measurement occasion. The latentfactor η2i is the growth rate factor, representing the rate of growth per unit time. Es-timation of the average initial status can be achieved either by estimating the com-mon intercept equated across six time points (ν1i = ν2i = ν3i = � = ν6i) while fixingthe mean of η1i to zero or, alternatively, fixing the common intercept νis to zerowhile estimating the mean of the status factor η1i (see Khoo, 2001, for more de-tails). The factor loadings on the growth rate factor, η2i, are specified to reflect thetime intervals between measurements and the growth trajectory shape. Setting theloadings on η2i as [0 1 2 3 4 5] reflects the linear trajectory across six time points atequal intervals.
Modeling various shapes of the growth trajectory is fairly easy when LGM iscarried out in the SEM framework (Du Toit & Cudek, 2001; Stoolmiller, 1995). Ifthe growth trajectory is assumed to be other than a linear trajectory, the factor load-ings on the growth rate factor can be specified accordingly. For example, when thegrowth trajectory is expected to show a positive growth at earlier measurement oc-casions followed by a stabilized plateau at later measurement occasions, the trajec-tory shape can be modeled by setting the loadings on the growth rate factor (η2i) tobe [0 1 1 1 1 1]. Furthermore, the factor loadings on the growth rate factor do nothave to be fixed across the measurement occasions. For example, when the trajec-tory is expected to depart from the stabilized level at a later time point (e.g., at Time3) the factor loadings on the growth rate factor can be specified as [0 1 * 1 1 1] tofreely estimate the growth at Time 3. The estimated loading smaller than 1 indi-cates a lower level at Time 3 than other posttest measurements. These specifica-tions will be utilized in our example for illustration.
Individual differences in growth are captured in the variances of the initial sta-tus factor and the growth rate factor. When the variances of the growth factors aresubstantial, the latent growth factors can be regressed on individual backgroundvariables such as Xi as in the following:
For example, the initial status and the growth rate of drinking alcohol among col-lege students might be related to how much the individuals were involved in prob-
MEDIATION USING PARALLEL PROCESS LATENT GROWTH CURVE MODELING 243
(6)i i iXη π Γ ζ� � �
1 1 1
2 2 2
3 3 1 3ti
4 4 2 4
5 5 5
6 6 6
1 0
1 1
1 2,
1 3
1 4
1 5
i i i
i i i
i i i i
i i i i
i i i
i i i
Y
Y
Y
Y
Y
Y
ν εν εν η ε
εν η εν εν ε
� � � � � � � �� � � � � � � �� � � � � � � �� � � � � � � �� � � � � � � �� �� � � � � � � �� �� � �� � � � � � � �� �� � � � � � � �� � � � � � � � �� � � � � � � �� � � � � � � �� � � � � � � �� � � � � � � �� � � �
t~ N (0, ). (5)σ

lem behaviors in the past. This can be studied by regressing the growth factors ofalcohol consumption on the problem behavior indicators (e.g., Harford & Muthén,2001). Program effects in random experiments can also be assessed in this way.For example, adolescent alcohol use might increase over time in general, but theindividuals in the treatment group might show a slower increase than those in thecontrol group. Then the growth rate factor can be regressed on the prevention pro-gram condition to explain the different growth trajectories in the two groups (e.g.,Taylor et al., 2000).
MEDIATION IN LGM
In a pretest–posttest situation, mediation is supported when the prevention pro-gram changes the level of the mediator and the change in the mediator, in turn, af-fects the level of the outcome. When both the outcome variable and the hypothe-sized mediating variable are measured repeatedly over time, the growth of themediator and the growth of the outcome can be viewed as two distinctive pro-cesses. In such situations, the mediational process can be modeled as the preven-tion program influencing the growth of the outcome indirectly through its effect onthe growth of the mediator. Mediation is supported when the prevention programsignificantly changes the trajectory of the mediator, which, in turn, affects the tra-jectory of the outcome.
Evaluation of the mediational process in longitudinal studies can be carried outusing the parallel process LGM. Figure 2 shows a parallel process growth curvemodel where the mediator and the outcome are measured across six time pointsand the growth of each process is modeled as linear. The upper half of Figure 2 rep-resents the mediator process and the lower half represents the outcome process.The mediational process is modeled by relating the prevention program X and thelatent growth factors of the two parallel processes.
In parallel process latent growth curve models, the growth of the mediator pro-cess and the growth of the outcome process are modeled in the measurementmodel. Examining the growth of the mediator and the growth of the outcome sepa-rately, each process can be written as follows:
where the superscript (m) denotes the mediator process, Mi is a 6 × 1 vector of therepeated measures of the mediator, νi(m) is a 6 × 1 vector of the common interceptsof the mediator, Λ(m) is a 6 × 2 matrix of factor loadings on the two growth factors,ηi(m) is a 2 × 1 vector of the latent growth factors for the mediator, and εi(m) is a 6 × 1vector of the measurement errors of the mediator.
244 CHEONG, MACKINNON, KHOO
( ) ( ) ( )( )Growth of Mediator Process: (7)m m mmi i i iM ν Λ η ε� � �

where the superscript (y) denotes the outcome process, Yi is a 6 × 1 vector of therepeated measures of the outcome, νi(y) is a 6 × 1 vector of the common interceptsof the outcome, Λ(y) is a 6 × 2 matrix of factor loadings on the two growth factors,ηi(y) is a 2 × 1 vector of the latent growth factors for the outcome, and εi(y) is a 6 × 1vector of the measurement errors of the outcome.
Once the growth of each process is satisfactorily modeled and the effects of theprevention program on the growth of each process is investigated, the two separategrowth curve models are combined into one parallel process growth curve model.The mediation is modeled in the structural model by relating the prevention pro-gram condition, the growth factors of the mediator process, and the growth factors
MEDIATION USING PARALLEL PROCESS LATENT GROWTH CURVE MODELING 245
FIGURE 2 A parallel process latent growth model for mediation. X = treatment program con-dition; Y = outcome; M = mediator; η1 = initial status factor of mediator; η2 = growth rate factorof mediator; η3 = initial status factor of outcome; η4 = growth rate factor of outcome.
( ) ( ) ( )( )Growth of Outcome Process: (8)y y yyi i i iY ν Λ η ε� � �

of the outcome process. The structural relations are expressed in terms of each la-tent factor (η1i, η2i, η3i, and η4i) as follows:
where η1i is the initial status factor of the mediator process, η2i is the growth ratefactor of the mediator process, η3i is the initial status factor of the outcome process,and η4i is the growth rate factor of the outcome process.
Equations 9 and 11 model the relations between the prevention program Xi andthe initial status factors (η1i and η3i) of the mediator process and the outcome pro-cess. In these equations, π0(m) and π0(y) denote the regression intercepts. The coeffi-cients γ1 and γ3 represent the difference between the treatment group and the con-trol group in the status factors of the mediator process and the outcome process,respectively. Equations 10 and 12 model the relations between the prevention pro-gram and the growth rate factors and the relations among the latent factors of thetwo processes. In these equations, π1(m) and π1(y) denote the regression intercepts.Equation 10 models the regression of the growth rate factor of the mediator process(η2i) on the prevention program condition (Xi) and the initial status factor of theoutcome process (η3i). The coefficient α represents the mean difference in the av-erage growth rate between the two groups and a significant α coefficient suggeststhat the prevention program is effective in changing the growth trajectory of themediator process. Similarly, Equation 12 models the regression of the growth ratefactor of the outcome process (η4i) on the prevention program (Xi), the initial statusof the mediator process (η1i), and, more important, the growth rate factor of themediator process (η2i). A significant β coefficient indicates a significant associa-tion between the growth rate of the mediator process and the growth rate of the out-come process.
The point estimate of the mediated effect can be obtained by taking the productof the coefficients (αβ). Testing the significance of the mediated effect and obtain-ing the CI can be conducted as described in the previous section using the first-or-der solution method (Sobel, 1982) or the asymmetric CI test (MacKinnon, Lock-wood, Hoffman, et al., 2002).
246 CHEONG, MACKINNON, KHOO
( )1 1 10 (9)mi i iXη π γ ζ� � �
( )2 2 3 21 (10)m
i i i iXη π α γ η ζ� � � �
( )3 3 30 (11)yi i iXη π γ ζ� � �
( )4 4 1 2 41 (12)y
i i i i iXη π τ γ η βη ζ�� � � � �

ILLUSTRATION OF LGM MEDIATION ANALYSIS
Adolescents Training and Learning to Avoid Steroids(ATLAS) Prevention Study
This study used part of the data from a longitudinal prevention study entitledATLAS (Goldberg et al., 1996; Goldberg et al., 2000). The goals of the ATLASproject were to reduce high school football players’ use of anabolic androgenicsteroids (AAS) and other drugs and to improve their health behaviors (e.g., eat-ing a nutritional diet and strength training). The ATLAS program was designedto change a number of potential mediators based on health behavior theories.Based on Social Learning Theory (Bandura, 1977), the ATLAS program tar-geted to change social environmental influences: The program sessions were de-livered by coaching staff and peer team leaders and the program activities con-sisted of small group projects and discussions. As suggested by Theory ofPlanned Behavior (Ajzen & Madden, 1986; Fishbein & Ajzen, 1975), theATLAS program included several components to change norms, beliefs, and atti-tudes about AAS: The treatment group students discussed the reasons to use andnot to use AAS, analyzed media advertisements on AAS effects, and developedan anti-AAS advertisement. The treatment group also received classroom ses-sions providing the alternatives to steroid use, such as nutrition and strengthtraining. Furthermore, as suggested by Health Belief Model (Janz & Becker,1984), the ATLAS program emphasized harmful effects of AAS and susceptibil-ity to these negative effects. More details regarding the ATLAS program and theprimary research findings can be found elsewhere (Goldberg et al., 1996;Goldberg et al., 2000; MacKinnon et al., 2001).
ATLAS design. The ATLAS project lasted for 4 years beginning in 1994. Atotal of 31 high school football teams in Oregon and Washington states were ran-domly assigned to the treatment group or the control group. The participants werefollowed until they graduated from high school and a new cohort of participantswas added in each study year.
The prevention program was delivered in full length in the first year and theshortened version of the booster program was delivered in the following years.There were a total of eight measurement occasions over the 4 project years. Thisstudy included the first six measurement occasions: baseline measurement (Time1), posttest after the initial full prevention program (Time 2), 1-year follow-up(Time 3), posttest after the first booster program (Time 4), 2-year follow-up (Time5), and posttest after the second booster program (Time 6). The intervals betweenthe two measurements before and after the program delivery (Time 1 and Time 2,Time 3 and Time 4, Time 5 and Time 6) were about 2 months, whereas the intervals
MEDIATION USING PARALLEL PROCESS LATENT GROWTH CURVE MODELING 247
between posttests and the 1- and 2-year follow-up measures (Time 2 and Time 3,Time 4 and Time 5) were about 10 months.
Measures. In this study, nutrition behaviors (Nutrit) was used as an outcomevariable. Perceived importance of team leaders as an information source(PerLeader) was used as a mediator. The high school football players in the treat-ment group participated in the discussions on drug prevention and healthy alterna-tives to drug use led by the team leaders. It was hypothesized that these programactivities would increase the perception of team leaders as a valid informationsource about diet, and this, in turn, would improve nutrition behaviors.
There were seven items measuring nutrition behaviors on 7-point Likert typescales that consisted of Over the last few months I have tried to improve my diet,I eat a diet that has no more than 30% calories from fat, I am aware of the calo-rie content of the foods I eat, I set goals for my nutrition, I keep track of the cal-ories I eat, I keep track of the protein I eat, and I choose healthy foods when Ieat at a fast food restaurant. The mean score of these seven items was used foranalyses. Higher scale scores reflected better nutrition behaviors. In the prioranalyses for the scale development, these seven items were found to constituteone factor in exploratory factor analysis. The Cronbach’s α at baseline measure-ment was .810.
Perceived importance of team leaders as an information source was measuredwith three items on 7-point Likert type scales: My team leaders help me learnabout drug prevention, My team leaders help me learn about sports nutrition, andMy team leaders help me learn about weight lifting. The mean score of these threeitems was used for analyses. Higher scores represented greater perception of peerteam leaders as a valid information source. The Cronbach’s α for these items mea-sured at baseline was .844.
A dummy variable was created to represent group membership. The treatmentgroup was coded as 1 and the control group as 0.
Sample. The participants included in this study were the first cohort ofhigh school football players who participated in the ATLAS study from 1994 to1996. There were 1,506 participants (Control N = 804; Treatment N = 702) atbaseline in 1994. Among those, 1,339 participants (Control N = 730; TreatmentN = 609), who were present at both baseline and at least one of the follow-up as-sessments, were included in the analysis. The main sources of missing data weregraduation, quitting the football team, injury during the football season, and ab-senteeism on the assessment day. The attrition rate was consistent with the esti-mated rate of students’ quitting the football team during the season (20%). Theattrition rate from the study was actually less than the nominal high school drop-out rate in the area (28%). The analyses in this study were conducted adjustingfor missing data.
248 CHEONG, MACKINNON, KHOO

General Steps of Modeling and Testing MediationalProcess in LGM Framework
Conducting mediation analysis using parallel process LGM method involvesseveral steps. First, the growth trajectory shape of each process is investigated.The main goals of this step are to test whether the hypothesized trajectory shapefits the data and to examine whether the growth rates are different in the treat-ment and the control groups. In the second step, the two latent growth curvemodels investigated in the first step are combined to one parallel process modeland the hypothesized relations among the prevention program and the growthfactors of the two processes are modeled. Finally, the estimates of the mediatedeffect and the estimated standard error are calculated to test the significance ofthe mediated effect and to construct the CI. The analyses were conducted usingthe Mplus 2.0 (Muthén & Muthén, 2001) SEM program. The programs used inthis article are available by writing to JeeWon Cheong or at the Web site(http://www.public.asu.edu/~davidpm/ripl).
Investigation of Growth Trajectory and Assessment ofProgram Effects
When the prevention program is effective, the growth of the mediator and thegrowth of the outcome are expected to be different in the treatment group and thecontrol group. In the ATLAS study, the initial full prevention program imple-mented in the first year was expected to increase the football players’ nutrition be-haviors (Nutrit) and perceived importance of team leaders as a valid informationsource (PerLeader). In addition, the booster programs delivered in the later yearswere expected to recover and maintain the program effect achieved by the full pre-vention program, when and if there was a decay of effects. Thus, the factor load-ings on the growth rate factor of the mediator and the outcome were specified as [01 * 1 1 1]. We specified the status factor to represent the initial status, the true levelat baseline. By setting the loadings on the growth rate factor for Time 2, Time 4,Time 5, and Time 6 to be 1, we hypothesized that the effects achieved by the initialfull prevention program would be recovered and maintained at the same level bythe booster programs. The factor loading of the Time 3 measure was freely esti-mated to examine the decay of program effect before the booster programs. If therewas a decay of program effect, this factor loading would be smaller than 1.
Because the significant shift in the mediator process and the outcome processwas expected only for the treatment group, it was examined whether the aforemen-tioned specification of the trajectory shape was appropriate for both groups. Thetrajectory of the mediator process and the trajectory of the outcome process wereexamined separately in a two-group model. The factor loadings on the latent fac-tors were specified to be equal across the two groups. The residual variances of the
MEDIATION USING PARALLEL PROCESS LATENT GROWTH CURVE MODELING 249

repeated measure at each measurement occasion were also equated across groups.The covariance between the initial status factor and the growth rate factor wasfreely estimated and allowed to be different across the two groups. The commonintercept was estimated and the status factor mean of the control group was set to 0to capture the mean difference in the initial status between the two groups in thestatus factor mean of the treatment group. Given the specification of the growthtrajectory, the overall model fit would indicate the appropriateness of using thecurrent specification for both groups and, thus, justify combining the two groupsand using the program group membership as a causal variable for the different tra-jectory shapes.
The program effects on the growth of the mediator process and the outcomeprocess were assessed by comparing the means of the growth rate factors betweenthe two groups. With the current data, the mean and the variance of the growth ratefactor for the control group were found to be nonsignificant for both perceived im-portance of team leaders and nutrition behaviors. In light of this, the means and thevariances of the growth factors were constrained to be 0 for the control group.Thus, the mean of the growth rate factor estimated for the treatment group was theestimated program effect (i.e., the shift of growth rate due to the ATLAS program).
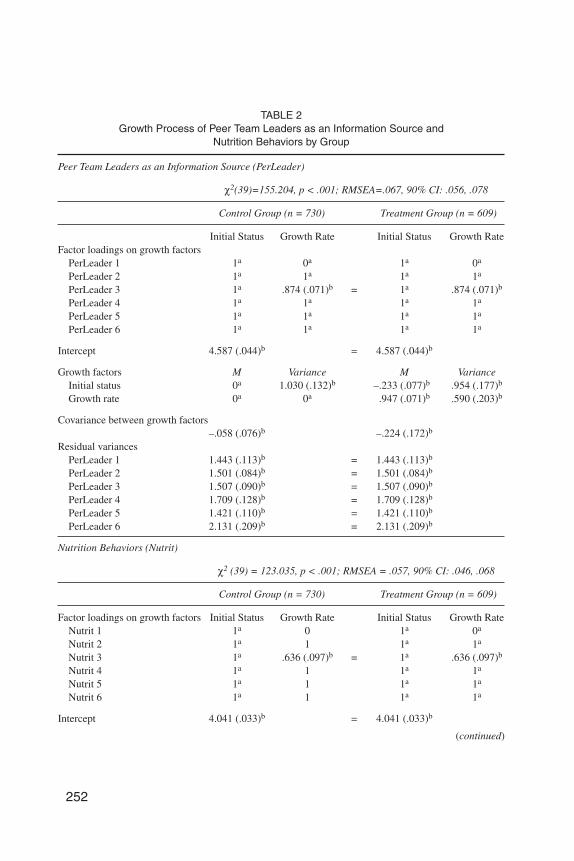
Table 1 shows the sample covariances and means by each group estimated withthe Maximum Likelihood (ML) method adjusting for missing data. The resultsfrom the two-group SEM are reported in Table 2. The overall fit of the two-groupmodel was reasonable. Due to the large sample size (N = 1,339), the χ2 statisticswere significant; however, root mean square error of approximation (RMSEA) es-timate was acceptable for both perceived importance of team leaders, χ2(39) =155.204, p < .001, RMSEA = .067 with 90% CI = (.056, .078), and nutrition behav-iors, χ2(39) = 123.035, p < .001; RMSEA = .057 with 90% CI = (.046, .069).
Comparing the average growth rates between the treatment and the controlgroups, the average growth rate for the treatment group was positive and statisti-cally significant for both perceived importance of team leaders and nutrition be-haviors, whereas the growth rates for the control group were not significant. Thedifference in the growth rate between the two groups was .947 (SEgrowth rate = .071,p < .001) for perceived importance of team leaders and .423 (SEgrowth rate = .044, p <.001) for nutrition behaviors. These results indicate that the treatment group’sgrowth trajectory of perceived importance of team leaders and growth trajectory ofnutrition behaviors were shifted upward due to the ATLAS prevention program,whereas the control group stayed at the same level as baseline. In addition, therewas a significant difference in the average initial status between the treatment andthe control groups. The initial status of the treatment group was lower than the con-trol group for both importance of team leaders (Mstatus = 4.354 for treatment group,Mstatus = 4.587 for control group; p < .01) and nutrition behaviors (Mstatus = 3.870for treatment group, Mstatus = 4.041 for control group; p < .01). However, the differ-ence in the initial status is unlikely to be attributable to the different treatment con-
250 CHEONG, MACKINNON, KHOO

ditions because the initial status was the true level at baseline, which took place be-fore the delivery of the program.
The variance of the growth rate factor for the treatment group was significantfor importance of team leaders, Var (Growth RatePerLeader) = .590, SE = .203, p <.01, indicating that although the treatment program increased the perceived impor-tance of peer team leaders on average, the increment was different across individu-als. The variance of the growth rate factor for nutrition behaviors was not signifi-cant for the treatment group, Var (Growth RateNutrit) = .108, SE = .079, ns. Thecovariance between the initial status and the growth rate factors was negative butwas not statistically significant for both groups for both processes. Figures 3 and 4
MEDIATION USING PARALLEL PROCESS LATENT GROWTH CURVE MODELING 251
TABLE 1Estimated Covariances and Means by Group
Perceived Importance of Team Leaders as an Information Source
PerLeader1 PerLeader2 PerLeader3 PerLeader4 PerLeader5 PerLeader6
PerLeader1 1.196 .882 .683 .705 .541PerLeader2 .839 .894 .772 .618 .329PerLeader3 .835 1.085 1.141 1.063 1.253PerLeader4 .330 .565 1.227 .942 .916PerLeader5 .550 .848 1.399 .925 1.486PerLeader6 .796 .807 .892 1.140 1.383Variance 2.381 2.563 2.698 2.464 2.658 3.119
2.464 2.350 2.493 2.529 2.167 3.071M 4.357 5.398 5.135 5.286 5.178 5.269
4.566 4.427 4.586 4.916 4.794 4.948
Nutrition Behaviors
Nutrit1 Nutrit2 Nutrit3 Nutrit4 Nutrit5 Nutrit6
Nutrit1 .658 .633 .622 .480 .560Nutrit2 .714 .594 .589 .482 .532Nutrit3 .659 .848 .819 .742 .781Nutrit4 .642 .750 .803 .708 .792Nutrit5 .607 .776 .947 .861 .941Nutrit6 .752 .635 .996 .734 1.097Variance 1.328 1.354 1.435 1.433 1.636 1.850
1.260 1.064 1.220 1.259 1.367 1.491M 3.878 4.367 4.092 4.227 4.195 4.121
4.049 4.029 4.075 4.094 3.944 4.030
Note. Treatment group in regular font; control group in italic. The covariances and the means arethe estimates of the sample covariances and means estimated using the Maximum Likelihood methodto adjust for the missing data. Nutrit1–Nutrit6 = Nutrition behaviors measured from Time 1 to Time 6;PerLeader1–PerLeader6 = Perceived importance of peer team leaders as an information source mea-sured from Time 1 to Time 6.
252
TABLE 2Growth Process of Peer Team Leaders as an Information Source and
Nutrition Behaviors by Group
Peer Team Leaders as an Information Source (PerLeader)
χ2(39)=155.204, p < .001; RMSEA=.067, 90% CI: .056, .078
Control Group (n = 730) Treatment Group (n = 609)
Initial Status Growth Rate Initial Status Growth RateFactor loadings on growth factors
PerLeader 1 1a 0a 1a 0a
PerLeader 2 1a 1a 1a 1a
PerLeader 3 1a .874 (.071)b = 1a .874 (.071)b
PerLeader 4 1a 1a 1a 1a
PerLeader 5 1a 1a 1a 1a
PerLeader 6 1a 1a 1a 1a
Intercept 4.587 (.044)b = 4.587 (.044)b
Growth factors M Variance M VarianceInitial status 0a 1.030 (.132)b –.233 (.077)b .954 (.177)b
Growth rate 0a 0a .947 (.071)b .590 (.203)b
Covariance between growth factors–.058 (.076)b –.224 (.172)b
Residual variancesPerLeader 1 1.443 (.113)b = 1.443 (.113)b
PerLeader 2 1.501 (.084)b = 1.501 (.084)b
PerLeader 3 1.507 (.090)b = 1.507 (.090)b
PerLeader 4 1.709 (.128)b = 1.709 (.128)b
PerLeader 5 1.421 (.110)b = 1.421 (.110)b
PerLeader 6 2.131 (.209)b = 2.131 (.209)b
Nutrition Behaviors (Nutrit)
χ2 (39) = 123.035, p < .001; RMSEA = .057, 90% CI: .046, .068
Control Group (n = 730) Treatment Group (n = 609)
Factor loadings on growth factors Initial Status Growth Rate Initial Status Growth RateNutrit 1 1a 0 1a 0a
Nutrit 2 1a 1 1a 1a
Nutrit 3 1a .636 (.097)b = 1a .636 (.097)b
Nutrit 4 1a 1 1a 1a
Nutrit 5 1a 1 1a 1a
Nutrit 6 1a 1 1a 1a
Intercept 4.041 (.033)b = 4.041 (.033)b
(continued)

253
TABLE 2 (Continued)
Growth factors M Variance M VarianceInitial status 0a .632 (.065)b –.171 (.058)b .667 (.084)b
Growth rate 0a 0a .423 (.044)b .108 (.079)b
Covariance between growth factors–.008 (.037)b .039 (.069)b
Residual variancesNutrit 1 .662 (.045)b = .662 (.045)b
Nutrit 2 .516 (.032)b = .516 (.032)b
Nutrit 3 .563 (.035)b = .563 (.035)b
Nutrit 4 .584 (.046)b = .584 (.046)b
Nutrit 5 .753 (.056)b = .753 (.056)b
Nutrit 6 .852 (.085)b = .852 (.085)b
Note. = parameter equated across groups.aParameter fixed in the model. bParameter estimate with the standard error of estimate in parentheses.
FIGURE 3 Model-based change in peer team leaders as an information source over six mea-surement time points.

show the estimated means of perceived importance of team leaders and nutritionbehaviors across time for the treatment and control groups.
As expected, there was a slight decay of program effect at Time 3 (1-year fol-low-up). The factor loading of Time 3 on the growth rate factor was slightlysmaller than 1 but significantly different from 0 for both importance of team lead-ers, λ32(m) = .874, SE = .071, p < .001, and nutrition behaviors, λ32(y) = .636, SE =.097, p < .001. These results suggest that the program effect achieved by the initialfull prevention program could deteriorate in time without the booster programs.
Assessment of Mediation
The latent growth model for the mediator process and the latent growth model forthe outcome process were combined into one parallel process latent growth model.The trajectory shape was specified as in the previous step. Now that the treatmentand the control groups were found to be different in their average growth rates, thevariable coding the group membership was introduced as a covariate to explain thegroup differences in growth trajectory.
As an intermediate step, the two growth curve models for the mediator and theoutcome processes were combined as parallel processes influenced only by thetreatment program and the relations among growth factors of the two processeswere not estimated. The model fit of this intermediate model yielded a χ2 of487.427 with 76 df (p < .001) and the RMSEA estimate of .064 with 90% CI =
254 CHEONG, MACKINNON, KHOO
FIGURE 4 Model-based change in nutrition behaviors over six measurement time points.

(.058, .069). Following the estimation of the intermediate model, the relation be-tween the growth factors of the two processes was added (Figure 5). The modelshown in Figure 5 fits the data well, χ2(72) = 317.298, p < .001; RMSEA = .050with 90% CI = (.045, .056). The chi-square difference between the intermediatemodel and the final model was statistically significant, ∆χ2(4) = 170.131, p < .001,indicating that modeling the relations among the latent growth factors improvesthe model fit significantly and thus justifies inclusion of the mediational process inthe model.
The main interest in the parallel process growth curve model in Figure 5 is in therelations among the prevention program and the growth rate factors of the two pro-cesses. The estimates of these relations are shown in Figure 5 and the more detailedresults are reported in Table 3. The effect of the treatment program on the growthrate factor of importance of team leaders was significant (α = .859, SE = .089, p <.001) and the effect of the growth rate factor of importance of team leaders on thegrowth rate factor of nutrition behaviors was also significant (β = .891, SE = .226, p< .001). This implies a mediational process in such a way that the exposure to theATLAS program led to positive change in perceived importance of team leadersover time, which, in turn, led to positive change in nutrition behaviors over time.The estimated mediated effect (αβ) was .765 and the estimated standard error ofthe mediated effect (σαβ) based on the first-order solution was .210, indicating asignificant mediated effect (zαβ = 3.643, p < .001). The mediated effect testedbased on the asymmetric CI method was also significant, 95% CI = (.372, 1.196).
DISCUSSION
Procedures for applying latent growth curve modeling to the examination of pro-gram effects and mediation effects were outlined in this study. An example from aprevention study, entitled ATLAS, was used to illustrate the method. First, thegrowth trajectory of the mediator process and the growth trajectory of the outcomeprocess were investigated, followed by assessing the program effect on the growthtrajectories. The growth trajectory across six measurement occasions was modeledto reflect the program effect achieved by the full prevention program, a slight de-cay of effect, and a program effect recovered and maintained by the booster pro-grams. Because the prevention programs were delivered only to the treatmentgroup, it was examined whether this specification was appropriate to describe thedata from both groups. Using the two-group SEM technique, the appropriatenessof the specification of the growth trajectory was assessed by the overall model fitand the program effect on the growth trajectory was evaluated by comparing themeans of the growth rate factors between the treatment and the control groups. Al-ternatively, the investigation of different trajectory shapes between the two groupscan be carried out by examining each group’s trajectory separately. When the tra-
MEDIATION USING PARALLEL PROCESS LATENT GROWTH CURVE MODELING 255

256
FIGURE 5 A parallel process latent growth model for mediation: Program effect on thegrowth of nutrition behaviors via the growth of perceived importance of peer team leaders as aninformation source. Program = prevention program condition; Nutrit = nutrition behaviors(outcome); PerLeader = team leaders as an information source (mediator); η1 = initial statusfactor of PerLeader; η2 = growth rate factor of PerLeader; η3 = initial status factor of Nutrit; η4
= growth rate factor of Nutrit.

257
TABLE 3Parameter Estimates in the Parallel Process Latent Growth Curve Model
for Mediation
χ2 (38) = 122.648, p < .001; RMSEA = .058, 90% CI: .046, .069
Mediator process: Peer team leaders as an information source (PerLeader)
Factor loadings on growth factors Initial Status Growth Rate Residual VariancesPerLeader 1 1a 0a 1.421 (.077)b
PerLeader 2 1a 1a 1.472 (.088)b
PerLeader 3 1a .894 (.068)b 1.504 (.084)b
PerLeader 4 1a 1a 1.718 (.128)b
PerLeader 5 1a 1a 1.430 (.110)b
PerLeader 6 1a 1a 2.078 (.204)b
InterceptsPerLeader 1–6 4.564 (.058)b
Initial status(p) 0a .997 (.069)b
Growth rate(p) .033 (.060)b .224 (.069)b
Outcome process: Nutrition behaviors (Nutrit)
Factor loadings on growth factors Initial Status Growth Rate Residual VariancesNutrit 1 1a 0a .430 (.069)b
Nutrit 2 1a 1a .583 (.036)b
Nutrit 3 1a .848 (.074)b .507 (.032)b
Nutrit 4 1a 1a .578 (.045)b
Nutrit 5 1a 1a .759 (.057)b
Nutrit 6 1a 1a .843 (.084)b
InterceptsNutrit 1–6 4.052 (.042)b
Initial status(n) 0a .868 (.077)b
Growth rate(n) –.049 (.061)b .067 (.041)b
Group M .455 (.014)b Variance .248 (.010)b
Mediational processGroup → Growth rate(p) .859 (.089)b
Growth Rate(p) → Growth rate(n) .891 (.226)b
Group → Growth rate(n) –.393 (.221)b
Initial Status(p) →Growth rate(n) .022 (.043)b
Initial Status(n) → Growth rate(p) –.301 (.048)b
Group → Initial status(n) –.181 (.063)b
Group → Initial status(p) –.213 (.086)b
Note. Initial status(p) = status factor of PerLeader; Growth rate(p) = growth rate factor ofPerLeader; Initial status(n) = status factor of Nutrit; Growth rate(n) = growth rate factor of Nutrit.
aParameter fixed in the model. bParameter estimate with the standard error of estimate in paren-theses.

jectory form is found to be appropriate for both treatment and control groups, twogroups can be combined and the latent growth factors can be regressed on thegroup membership to account for the trajectory differences between the groups.The coefficient of the growth rate factor on the group membership represents theprogram effect; that is, the mean shift in the growth rate due to the prevention pro-gram.
It appears that the ATLAS prevention program shifted the growth trajectory ofthe mediator and the growth trajectory of the outcome upward. Perceived impor-tance of team leaders increased and nutrition behaviors improved for the treatmentgroup after the full prevention program was implemented in the first year. A slightdecay of the program effect was found during the long period between the full pre-vention program and the 1-year follow-up assessment; however, this decay was re-covered and maintained by the booster programs delivered in the later years. Theseresults suggest not only the effectiveness of the ATLAS prevention program butalso the importance of booster programs. The program effect achieved by the fullprevention program could deteriorate in time and the booster programs may beneeded to maintain the program effects.
The mediation was modeled and estimated using the parallel process LGMmethod. In this approach, mediation is defined such that the treatment program in-fluences the growth of the outcome process indirectly by influencing the growth ofthe mediator process. Thus, the presence of significant mediation depends onwhether the treatment program changes the growth trajectory of the mediator andwhether the change of the growth trajectory of the mediator, in turn, is related tothe change in the growth trajectory of the outcome variable. In this study, it wasfound that the ATLAS prevention program significantly increased both perceivedimportance of the team leaders (mediator) and nutrition behaviors (outcome) overtime. Furthermore, the growth trajectory of perceived importance of team leaderswas significantly related to the growth trajectory of nutrition behaviors such thatthe greater the increase in perceived importance of team leaders over time, thegreater the improvement in nutrition behaviors over time. The test of mediation in-dicates that the ATLAS program shifted the growth trajectory of the nutrition be-haviors upward by changing the growth trajectory of the positive peer influence(i.e., perceiving that the team leaders are a valuable information source abouthealthy diet, strength training, and drug prevention).
Although growth curve modeling is beginning to appear in the context of medi-ation analysis (e.g., Muthén & Curran, 1997), parallel process latent growth curvemodeling has been applied in only a few studies investigating mediation (e.g.,Cheong, MacKinnon, & Khoo, 2001; Sandler, Tein, Mehta, Wolchik, & Ayers,2000). In our previous study (Cheong et al., 2001), we investigated the possibilityof applying the parallel process LGM to mediation analysis for randomized pre-vention trials. Sandler et al. (2000) modeled three latent growth processes and ex-amined the relations among the growth process of independent variable, the
258 CHEONG, MACKINNON, KHOO
growth process of the mediator, and the growth process of the outcome. However,Sandler et al. (2000) did not include a randomized treatment group situation.
There are several advantages of the parallel process LGM method for mediationanalysis. This approach allows for estimation of the individual differences ingrowth over time. In real life situations, there are considerable individual differ-ences in development and modeling the individual differences is more representa-tive of the reality. Another advantage of the parallel process LGM method is thatthe growth of the mediator and the growth of the outcome can be modeled simulta-neously and the change in the mediator can be related to the change in the outcomevariable in the structural model. This provides a superior method for investigatingmediational processes in longitudinal studies. Furthermore, the flexibility of SEMis allowed in the parallel process LGM method for assessing mediation. For exam-ple, the growth curve of the mediator and the outcome can be modeled to reflectvarious trajectory shapes, including a linear or a curvilinear trajectory. Also, thetrajectory shape of the mediator can be modeled differently from the trajectory ofthe outcome. The growth curve of the mediator can be a straight line, whereas thegrowth curve of the outcome is a stabilized plateau after the initial shift, as mod-eled in this study.
When the group membership variable represents random assignment to treat-ment or control groups, the interpretability of the mediation model is improved be-cause the effect of the program on the growth of the mediator and the growth of theoutcome can be attributed more confidently to the program assignment. Under ran-dom assignment, the counterfactual trajectory, the trajectory that would have beenobtained if the individuals had been assigned to the other condition, is missingcompletely at random. Thus, the difference in the mean trajectories of the twogroups can be used as an unbiased estimate of the average treatment effect(Raudenbush, 2001). On the other hand, the relation between the growth of the me-diator process and the growth of the outcome process is more complicated. Al-though the explicit modeling of longitudinal growth in the mediator and the out-come makes it a better test of this relation than the cross-sectional data becausemultiple measurements are used to estimate true long-term change, a causal state-ment regarding the relation between the growth rate factors of the two processesshould be based on strong theory. Without strong theory, the relation between thegrowth rate factors of the two processes may only be interpreted as correlationalbecause the mediator and the outcome variables were measured simultaneously oneach occasion and levels on the mediator were not randomly assigned.
As the number of measurement occasions increases, more complex models canbe estimated. For example, the growth across time can be evaluated in two differ-ent phases by using piecewise growth models (e.g., Khoo, 2001). In the two-phasepiecewise models, the growth at the earlier phase and the growth at the later phasecan be modeled simultaneously in one model. One of the benefits of the two-phaseparallel process model is that the change in one process at the earlier phase can be
MEDIATION USING PARALLEL PROCESS LATENT GROWTH CURVE MODELING 259

modeled to predict the change in the other process at the later phase. This wouldprovide a more convincing test of the mediational hypothesis because the changein the mediator preceding the change in the outcome may be investigated.
There are a few issues to be considered in the present study. One issue is the in-fluence of attrition. In the ATLAS study, participants who graduated from highschool or quit the football team were no longer available for follow-up measure-ments. To adjust for the missing data, we used the ML method. The ML estimatesadjusting for missing data are less biased than the estimates obtained by pairwiseor listwise deletion, even when the assumption of missing at random is not strictlysatisfied (Arbuckle, 1996; Little & Rubin, 1989; Muthén, Kaplan, & Hollis, 1987).Also, the ML estimates are slightly more efficient than the estimates obtained byMultiple Imputation when the sample size is reasonably large (Schafer & Olsen,1998). However, it is not clear how the use of these methods and the amount of at-trition affect the accuracy of growth curve models. Another issue is the nesting ofindividuals within school teams. In this study, data were analyzed at the individuallevel because the theories on which the ATLAS prevention program was basedwere conceptualized at the individual level and the intraclass correlations (ICC) atthe baseline assessment were small (ICC = .03 for nutrition behavior; ICC = .02 forperceived importance of team leaders). However, other nonparametric methodssuch as the bootstrapping method can be used to estimate the standard errors andconstruct CIs or multilevel modeling can be incorporated when the magnitude ofthe ICCs is substantial.
There are at least two future directions for this research. First, simulation stud-ies can be conducted. Although applications of parallel process LGM have begunto appear in the substantive research, little is known about how accurately the pa-rameters are recovered. Researchers can set the parameter values of the populationmodel for the parallel process and investigate the conditions under which an accu-rate representation of the true population model is reproduced. In addition, Type Ierror rates and statistical power can be investigated. Second, more applications ofthe parallel process growth model are needed to understand practical issues. Forexample, researchers can probe questions such as whether the mediated effect esti-mated with this approach is statistically significant or how accurately the growthtrajectories can be identified across different substantive areas. In any case, latentgrowth curve models for the investigation of the mediational process show consid-erable promise.
ACKNOWLEDGMENTS
This project was supported by Grants R01–DA07356 and R01–DA09757–04 fromthe National Institute on Drug Abuse.
260 CHEONG, MACKINNON, KHOO

REFERENCES
Ajzen, I., & Madden, T. J. (1986). Prediction of goal-directed behavior: Attitudes, intentions, and per-ceived behavioral control. Journal of Experimental Social Psychology, 22, 453–474.
Arbuckle, J. L. (1996). Full information estimation in the presence of incomplete data. In G. A.Marcoulides & R. E. Schumacker (Eds.), Advanced structural equation modeling: Issues and tech-niques (pp. 243–277). Mahwah, NJ: Lawrence Erlbaum Associates, Inc.
Aroian, L. A. (1947). The probability function of the product of two normally distributed variables. An-nals of Mathematical Statistics, 18, 265–271.
Bandura, A. (1977). Social learning theory. Englewood Cliffs, NJ: Prentice Hall.Baron, R. M., & Kenny, D. A. (1986). The moderator–mediator distinction in social psychological re-
search: Conceptual, strategic, and statistical considerations. Journal of Personality and Social Psy-chology, 51, 1173–1182.
Bryk, A. S., & Raudenbush, S. W. (1992). Hierarchical linear models for social and behavioral re-search: Applications and data analysis methods. Newbury Park, CA: Sage.
Chen, H.-T. (1990). Theory-driven evaluations. Newbury Park, CA: Sage.Cheong, J., MacKinnon, D. P., & Khoo, S. T. (2001). A latent growth modeling approach to mediation
analysis [Abstract]. In L. Collins & A. Sayer (Eds.), New methods for the analysis of change (pp.390–392). Washington, DC: American Psychological Association.
Donaldson, S. I., Graham, J. W., & Hansen, W. B. (1994). Testing the generalizability of interveningmechanism theories: Understanding the effects of adolescent drug use prevention interventions.Journal of Behavioral Medicine, 17, 195–216.
Du Toit, S. H. C., & Cudeck, R. (2001). The analysis of nonlinear random coefficient regression modelswith LISREL using constraints. In R. Cudeck, S. H. C. Du Toit, & D. Sörbom (Eds.), Structural equa-tionmodeling:Presentandfuture (pp.259–278).Lincolnwood, IL:ScientificSoftwareInternational.
Fishbein, M., & Ajzen, I. (1975). Beliefs, attitude, intention, and behavior: An introduction to theoryand research. Reading, MA: Addison-Wesley.
Goldberg,L.,Elliot,D.,Clarke,G.N.,MacKinnon,D.P.,Moe,E.,Zoref,L., etal. (1996).Effectsofamul-tidimensional anabolic steroid prevention intervention: The Adolescents Training and Learning toAvoid Steroids (ATLAS) program. Journal of the American Medical Association, 276, 1555–1562.
Goldberg, L., MacKinnon, D., Elliot, D., Moe, E., Clarke, G., & Cheong, J. (2000). The ATLAS pro-gram: Preventing drug use and promoting health behaviors. Archives of Pediatric and AdolescentMedicine, 154, 332–338.
Goldstein, H. (1995). Multilevel statistical models (2nd ed.). New York: Wiley.Goodman, L. A. (1960). On the exact variance of products. Journal of the American Statistical Associa-
tion, 55, 708–713.Harford, T. C., & Muthén, B. O. (2001). Alcohol use among college students: The effects of prior prob-
lem behaviors and change of residence. Journal of Studies of Alcohol, 62, 306–312.Janz, N. K., & Becker, M. H. (1984). The health belief model: A decade later. Health Education Quar-
terly, 11, 1–47.Judd, C. M., & Kenny, D. A. (1981). Process analysis: Estimating mediation in treatment evaluations.
Evaluation Review, 5, 602–619.Khoo, S. T. (2001). Assessing program effects in the presence of treatment–baseline interactions: A la-
tent curve approach. Psychological Methods, 6, 234–257.Little, R. J. A., & Rubin, D. B. (1989). The analysis of social science data with missing values. Socio-
logical Methods and Research, 18, 292–326.Longford, N. (1993). Random coefficient models. Oxford, England: Clarendon.MacKinnon, D. P. (1994). Analysis of mediating variables in prevention intervention studies. In A.
Cazares & L. A. Beatty (Eds.), Scientific methods for prevention intervention research. NIDA re-
MEDIATION USING PARALLEL PROCESS LATENT GROWTH CURVE MODELING 261

search monograph 139 (DHHS Pub. Number 94-3631, pp. 127–153). Washington, DC: U.S. Gov-ernment Printing Office.
MacKinnon, D. P. (2001). Mediating variable. In N. J. Smelser & P. B. Baltes (Eds.), International en-cyclopedia of the social and behavioral sciences (pp. 9503–9507). New York: Elsevier.
MacKinnon, D. P., & Dwyer, J. H. (1993). Estimating mediated effects in prevention studies. Evalua-tion Review, 17, 144–158.
MacKinnon, D. P., Goldberg, L., Clarke, G. N., Elliot, D. L., Cheong, J., Lapin, A., et al. (2001). Medi-ating mechanisms in a program to reduce intentions to use anabolic steroids and improve exerciseself-efficacy and dietary behavior. Prevention Science, 2, 15–28.
MacKinnon, D. P., Johnson, C. A., Pentz, M. A., Dwyer, J. H., Hansen, W. B., Flay, B. R., et al. (1991).Mediating mechanisms in a school-based drug prevention program: First-year effects of the Mid-western prevention project. Health Psychology, 10, 164–172.
MacKinnon, D. P., Lockwood, C. M., Hoffman, J. M., West, S. G., & Sheets, V. (2002). A comparison ofmethods to testmediationandother interveningvariableeffects.PsychologicalMethods,7,83–104.
MacKinnon, D. P., Lockwood, C. M., & Williams, J. (2002). Confidence limits for the indirect effect:Distribution of the product and resampling methods. Manuscript submitted for publication.
MacKinnon, D. P., Warsi, G., & Dwyer, J. H. (1995). A simulation study of mediated effect measures.Multivariate Behavioral Research, 30, 41–62.
Meredith, W., & Tisak, J. (1990). Latent curve analysis. Psychometrika, 55, 107–122.Muthén, B. O., & Curran, P. J. (1997). General longitudinal modeling of individual differences in experi-
mental designs: A latent variable framework for analysis and power estimation. PsychologicalMethods, 2, 371–402.
Muthén, B. O., Kaplan, D., & Hollis, M. (1987). On structural equation modeling with data that are notmissing completely at random. Psychometrika, 52, 431–462.
Muthén, B. O., & Muthén, L. (2001). Mplus user’s guide. Los Angeles: Author.Park, J., Kosterman, R., Hawkins, J. D., Haggerty, K. P., Duncan, T. E., Duncan, S. C., et al. (2000). Ef-
fects of the “preparing for the drug free years” curriculum on growth in alcohol use and risk for alco-hol use in early adolescence. Prevention Science, 1, 125–138.
Raudenbush, S. W. (2001). Comparing personal trajectories and drawing causal inferences from longi-tudinal data. Annual Reviews of Psychology, 52, 501–525.
Rogosa, D. (1988). Myths about longitudinal research. In K. W. Schaie, R. T. Campbell, W. Meredith, &S.C.Rawlings(Eds.),Methodological issues inagingresearch (pp.171–205).NewYork:Springer.
Rogosa, D., Brandt, D., & Zimowski, M. (1982). A growth curve approach to the measurement ofchange. Psychological Bulletin, 90, 726–748.
Sandler, I. N., Tein, J-Y., Mehta, P., Wolchik, S., & Ayers, T. (2000). Coping efficacy and psychologicalproblems of children of divorce. Child Development, 71, 1099–1118.
Schafer, J. L., & Olsen, M. K. (1998). Multiple imputation of multivariate missing-data problems: Adata analyst’s perspective. Multivariate Behavioral Research, 33, 545–571.
Sobel, M. E. (1982). Asymptotic confidence intervals for indirect effects in structural equation models.In S. Leinhard (Ed.), Sociological methodology 1982 (pp. 290–312). Washington, DC: American So-ciological Association.
Stoolmiller, M. (1995). Using latent growth curve models to study developmental processes. In J. M.Gottman (Ed.), The analysis of change (pp. 103–138). Mahwah, NJ: Lawrence Erlbaum Associates, Inc.
Taylor, B. J., Graham, J. W., Cumsille, P., & Hansen, W. B. (2000). Modeling prevention program ef-fects on growth in substance use: Analysis of five years of data from the adolescent alcohol preven-tion trial. Prevention Science, 1, 183–197.
Willett, J. B., & Sayer, A. G. (1994). Using covariance structure analysis to detect correlates and predic-tors of individual change over time. Psychological Bulletin, 116, 363–381.
262 CHEONG, MACKINNON, KHOO