Embed Size (px)
Citation preview
INVESTIGATION OF LIQUID TRAPPING
FOLLOWING SUPERCRITICAL FLUID EXTRACTION
by
Lori H. McDaniel
Dissertation submitted to the Faculty of the
Virginia Polytechnic Institute and State University
in partial fulfillment of the requirements for the degree of
DOCTOR OF PHILOSOPHY
in
Chemistry
Approved:Larry T. Taylor, Chairman
Harold M. McNairGary L. Long
Harold M. BellJames O. Glanville
September 17, 1999Blacksburg, Virginia
Keywords: supercritical fluid extraction, fat-soluble vitamins, liquid trapping,collection solvent modification, in-situ methylation, wood pulp
Copyright 1999 Lori H. McDaniel
INVESTIGATION OF LIQUID TRAPPINGFOLLOWING SUPERCRITICAL FLUID EXTRACTION
by
Lori H. McDaniel
Chairman: Larry T. Taylor
Department of Chemistry
ABSTRACT
Supercritical fluid extraction (SFE) is an alternative to traditional
extractions with organic solvents. SFE consists of removing the analyte(s) from
the matrix, solubilizing them, moving the analyte(s) into the bulk fluid, and
sweeping the fluid containing the analyte(s) out of the extraction vessel.
As the fluid leaves the extraction vessel, decompression of the fluid
occurs, changing its volume and temperature which can lead to analyte loss.
This work focussed on the trapping process with the restrictor immersed
in a liquid after SFE. Experiments compared the effects of trapping parameters
on the collection efficiencies of fat-soluble vitamins of similar polarities and
structures. The most important variable was the selection of collection solvent
and its physical properties, such as viscosity, surface tension and density were
found to be important.
Additionally, adding a modifier to the collection solvent in an attempt to
change its physical properties and influence collection efficiencies for a polarity
test mix was studied. Addition of a modifier can improve collection efficiencies
and allow higher collection temperature to be used, but the modifier did not
increase trapping recoveries to the extent that collection pressurization did.
The occurrence of a methylation reaction of decanoic acid during the
SFE and collection processes, using a methanol modified fluid or collection
solvent was investigated. The majority of the reaction occurred during the

ii
collection process and the degree of methylation was found to be dependent
on temperature, but not on static or dynamic extraction time. When no
additional acidic catalyst other than carbon dioxide in the presence of water
was present, conversion was limited to about 2%, but was quantitative with an
added acidic catalyst.
The last portion of this work involved the application of the SFE process
to the extraction and analysis of extractable material in eight hardwood and
softwood pulp samples. Grinding the samples increased extractable fatty acid
methyl esters (FAMEs) by ten-fold, and in-situ derivatizations resulted in higher
FAME recoveries than derivatization after SFE. Liquid trapping enhanced
recoveries of lower FAMEs when compared to tandem (solid/liquid) trapping.
In-situ acetylations sometimes yielded acetylated glucoses. Large differences
in FAMEs concentrations were seen for hardwood samples, but lesser
differences were seen for the softwood pulp samples.

iii
DEDICATION
This work is dedicated to the people who have sacrificed their time to
make this dissertation a reality. My husband, Carl T. McDaniel, has endured
many days and nights of little or no help with the normal tasks of running a
household and raising three extremely energetic children. His patience,
motivation and encouragement have given me the will to continue during those
times that I lacked the confidence and energy necessary. My children,
Shannon, Matthew and Eric, have patiently waited for the time that I, along with
the “good” computer would be a little more available to them. To these four
people I offer a humble thank you and lovingly dedicate this dissertation to you.

iv
ACKNOWLEDGEMENTS
It is difficult to acknowledge all the individuals that have given guidance,
advice and encouragement over not only the last five years, but also the last
eighteen years, since first beginning graduate school. Foremost, I must thank
Dr. Larry Taylor for his extraordinary patience and unfailing guidance. I am
grateful for the opportunity to have worked with not only an accomplished
scientist, but a fine and just person who allowed me to march to the beat of a
different, much slower, and often erratic drummer. I would also like to thank Dr.
Harold McNair for his willingness to allow me to remain active in teaching
chromatography shortcourses, and to let bygones be bygones. I must also
thank the other members of my committee, Dr. Gary Long, who kept me in
touch with the “normal” distributions, Dr. Harold Bell, and Dr. James O.
Glanville, who have always been available and very helpful.
A special debt of gratitude goes to Dr. Mehdi Ashraf-Khorassani, my
roommate in the geriatric ward, who provided direction, encouragement and
friendship, with an uncanny sense of timing. The conversations with the other
members of the Taylor group, both past and present, have helped me to make
my way through this process. Specifically, I would like to thank Dr. Mike
Combs, Dr. Bill Moore, Dr. Phyllis Eckard, and Dan Brannegan.
Additionally, I would like to thank the members of the McNair group,
including Dr. Yuri Kazakevich, Dr. Marissa Bonilla, and Donna Blankenship, as
well as Fred Blair in the Physics Shop. I don’t think that I ever would have
survived without the friendship, understanding, and help of Karey O’Leary and
Beth Bullock, both of whom have held my hand through the most difficult of
times. Lastly, I would like to acknowledge Victoria Johnson for teaching me a
lot about life, and unfortunately, too much about death, and Dr. L. P. Shea, for
helping me to make sense of it all, keep it in perspective and keep trying, even
when I thought I couldn’t.
v
CREDITS
I would like to acknowledge the support of various companies who have
made this research possible. The loan of the SFX 3560 extractor from the
Isco/Suprex Corporation, as well as the donation of consumables was greatly
appreciated. Additionally, the support given by the service department,
including Andy, Steve, Stan, Jeff and Greg, was invaluable. I would also like to
acknowledge the gift of the SFE/SFC grade carbon dioxide from Air Products
and Co., Inc. Finally, I would like to thank Buckeye Cellulose Co. for the
financial support and wood pulp samples for the final portion of this work.
vi
TABLE OF CONTENTSDEDICATION ................................................................................................................IIIACKNOWLEDGEMENTS............................................................................................IVCREDITS........................................................................................................................VTABLE OF CONTENTS...............................................................................................VI
LIST OF FIGURES .......................................................................................................IX
LIST OF TABLES..........................................................................................................XI
CHAPTER ONE.................................................................................................................. 1
TRAPPING FOLLOWING SUPERCRITICAL FLUID EXTRACTION .................... 11.0 Introduction....................................................................................................... 11.1 Solid Phase Trapping ..................................................................................... 21.2 Novel Trapping Methods ................................................................................ 31.3 Liquid Trapping................................................................................................ 41.4 Research Objective......................................................................................... 9
CHAPTER TWO ..............................................................................................................11
THE ROLE OF COLLECTION SOLVENT PHYSICAL PROPERTIES ONLIQUID TRAPPING EFFICIENCIES........................................................................11
2.0 Introduction.....................................................................................................112.1 Experimental ..................................................................................................132.1.1 Extraction.....................................................................................................132.1.2 Extract Analysis..........................................................................................152.1.3 Data Analysis..............................................................................................172.2.1 Effect of Collection Pressure....................................................................272.2.2 Effect of Collection Temperature ............................................................292.2.3 Effect of Extraction Flow Rate ..................................................................312.2.4 Effect of Restrictor Temperature .............................................................332.3 Conclusions..................................................Error! Bookmark not defined.
CHAPTER THREE ...........................................................................................................36
MODIFICATION OF THE COLLECTION SOLVENT TO ENHANCE LIQUIDTRAPPING EFFICIENCIES ......................................................................................36
3.0 Introduction.....................................................................................................363.1 Experimental ..................................................................................................383.1.1 Extraction.....................................................................................................383.1.2 Extract Analysis..........................................................................................393.2 Results and Discussion................................................................................403.2.1 Effect of Collection Temperature ............................................................403.2.2 Effect of Collection Pressurization..........................................................453.2.3 Effect of Modifier Identity...........................................................................47
vii
3.2.4 Effect of Collection Solvent Identity........................................................493.3 Conclusions....................................................................................................49
CHAPTER FOUR .............................................................................................................52
ESTERIFICATION OF DECANOIC ACID DURING SUPERCRITICAL FLUIDEXTRACTION EMPLOYING EITHER METHANOL-MODIFIED CARBONDIOXIDE OR A METHANOL TRAP ..........................................................................52
4.0 Introduction.....................................................................................................524.1 Experimental ..................................................................................................564.1.1 Extraction.....................................................................................................564.1.2 Extract Analysis..........................................................................................574.2 Results and Discussion................................................................................584.2.1 Effect of Collection Solvent ......................................................................594.2.2 Effect of Extraction Fluid ...........................................................................614.2.3 Effect of Static Extraction Time when Using Methanol-ModifiedCarbon Dioxide......................................................................................................614.2.4 Effect of Dynamic Extraction Time..........................................................634.2.5 Effect of Adding Hydrochloric Acid (HCl) to the Collection Vessel...674.3 Conclusions....................................................................................................70
CHAPTER FIVE................................................................................................................73
SUPERCRITICAL FLUID EXTRACTION OF WOOD PULP ................................735.0 Introduction.....................................................................................................735.1 Experimental ..................................................................................................765.1.1 Sample Preparation..................................................................................765.1.2 Standards Preparation..............................................................................775.1.3 Soxhlet Extraction......................................................................................775.1.6 Derivatizations ...........................................................................................795.1.7 Gas Chromatography ...............................................................................805.1.8 Moisture Determination ............................................................................815.1.9 Infrared (IR) Spectroscopy.......................................................................815.1.10 Supercritical Fluid Extraction (Extraction Profile Determination)......815.2 Results and Discussion................................................................................825.2.1 Determination Of Optimum Extraction Conditions..............................825.2.2 Determination Of Percent Extractives....................................................895.2.3 Identification of Extracted Components ................................................915.2.5 Effect of Sample Preparation Method ..................................................1005.2.6 Comparison of Trapping Methods........................................................1005.2.7 Acetylation of Wood Pulp Extract..........................................................1035.2.8 Quantitation of FAMEs in Various Wood Pulp Samples...................1075.3 Conclusions..................................................................................................109
CHAPTER SIX ...............................................................................................................111
CONCLUSIONS AND FUTURE WORK...............................................................111

viii
6.0 Introduction...................................................................................................1116.1 The Influence of Collection Solvent Physical Properties .....................1116.2 The Influence of Collection Solvent Modifiers........................................1126.3 Methylation Reactions during the Liquid Trapping Process................1136.4 The Analysis of Wood Pulp........................................................................1146.5 Future Work ..................................................................................................115
APPENDIX ONE ............................................................................................................117
STATISTICAL CALCULATIONS.............................................................................1171. Analysis of Variance (ANOVA)..................................................................1172. Paired t-testing .............................................................................................119
VITA.............................................................................................................................121
ix
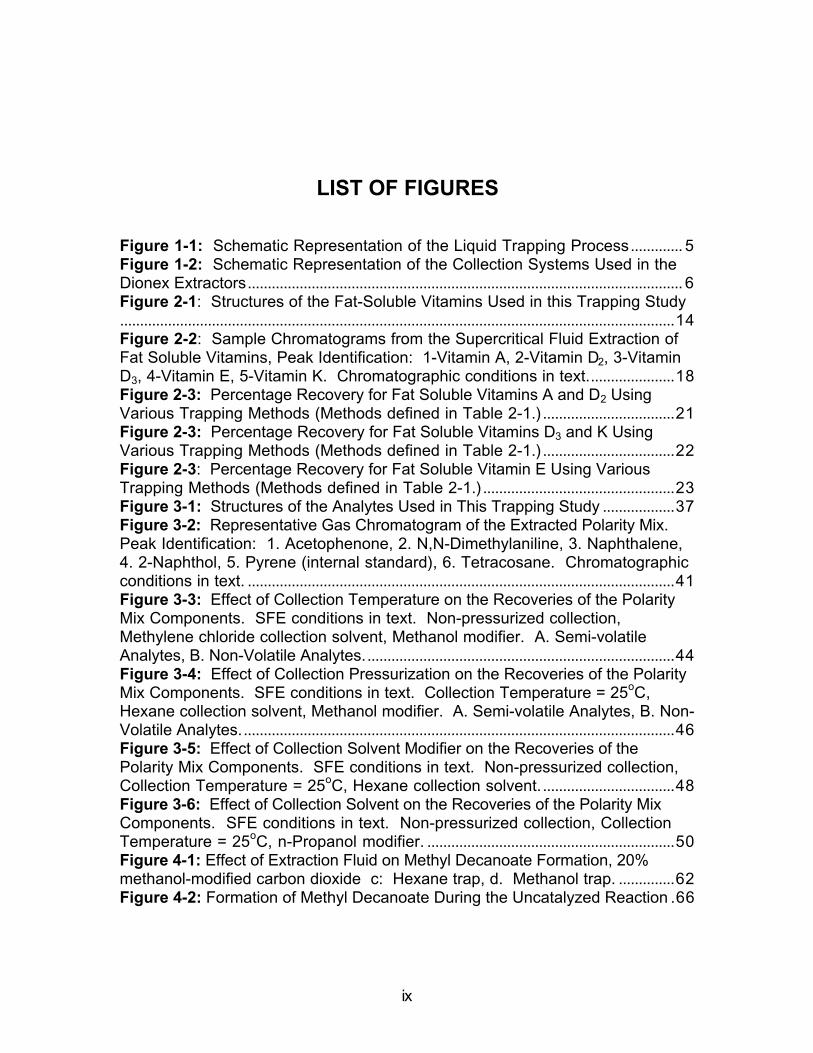
LIST OF FIGURES
Figure 1-1: Schematic Representation of the Liquid Trapping Process............. 5Figure 1-2: Schematic Representation of the Collection Systems Used in theDionex Extractors............................................................................................................. 6Figure 2-1: Structures of the Fat-Soluble Vitamins Used in this Trapping Study...........................................................................................................................................14Figure 2-2: Sample Chromatograms from the Supercritical Fluid Extraction ofFat Soluble Vitamins, Peak Identification: 1-Vitamin A, 2-Vitamin D2, 3-VitaminD3, 4-Vitamin E, 5-Vitamin K. Chromatographic conditions in text......................18Figure 2-3: Percentage Recovery for Fat Soluble Vitamins A and D2 UsingVarious Trapping Methods (Methods defined in Table 2-1.).................................21Figure 2-3: Percentage Recovery for Fat Soluble Vitamins D3 and K UsingVarious Trapping Methods (Methods defined in Table 2-1.).................................22Figure 2-3: Percentage Recovery for Fat Soluble Vitamin E Using VariousTrapping Methods (Methods defined in Table 2-1.)................................................23Figure 3-1: Structures of the Analytes Used in This Trapping Study ..................37Figure 3-2: Representative Gas Chromatogram of the Extracted Polarity Mix.Peak Identification: 1. Acetophenone, 2. N,N-Dimethylaniline, 3. Naphthalene,4. 2-Naphthol, 5. Pyrene (internal standard), 6. Tetracosane. Chromatographicconditions in text. ...........................................................................................................41Figure 3-3: Effect of Collection Temperature on the Recoveries of the PolarityMix Components. SFE conditions in text. Non-pressurized collection,Methylene chloride collection solvent, Methanol modifier. A. Semi-volatileAnalytes, B. Non-Volatile Analytes..............................................................................44Figure 3-4: Effect of Collection Pressurization on the Recoveries of the PolarityMix Components. SFE conditions in text. Collection Temperature = 25oC,Hexane collection solvent, Methanol modifier. A. Semi-volatile Analytes, B. Non-Volatile Analytes.............................................................................................................46Figure 3-5: Effect of Collection Solvent Modifier on the Recoveries of thePolarity Mix Components. SFE conditions in text. Non-pressurized collection,Collection Temperature = 25oC, Hexane collection solvent..................................48Figure 3-6: Effect of Collection Solvent on the Recoveries of the Polarity MixComponents. SFE conditions in text. Non-pressurized collection, CollectionTemperature = 25oC, n-Propanol modifier. ..............................................................50Figure 4-1: Effect of Extraction Fluid on Methyl Decanoate Formation, 20%methanol-modified carbon dioxide c: Hexane trap, d. Methanol trap. ..............62Figure 4-2: Formation of Methyl Decanoate During the Uncatalyzed Reaction .66
x
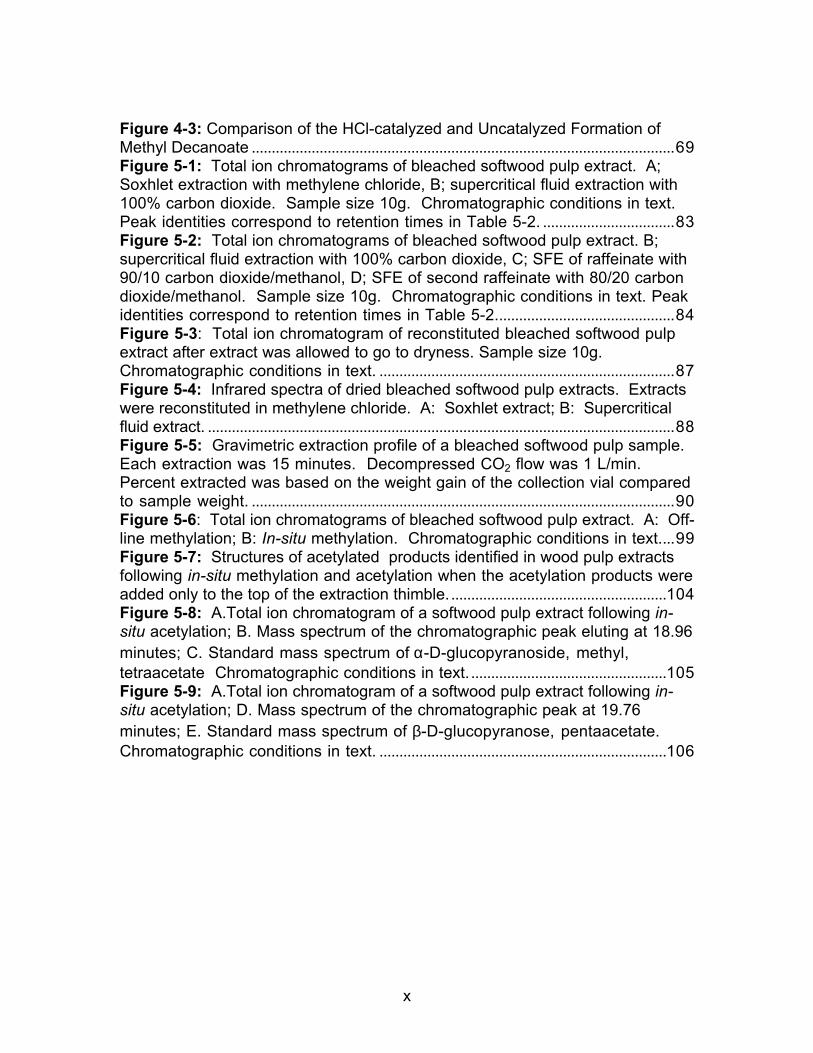
Figure 4-3: Comparison of the HCl-catalyzed and Uncatalyzed Formation ofMethyl Decanoate ..........................................................................................................69Figure 5-1: Total ion chromatograms of bleached softwood pulp extract. A;Soxhlet extraction with methylene chloride, B; supercritical fluid extraction with100% carbon dioxide. Sample size 10g. Chromatographic conditions in text.Peak identities correspond to retention times in Table 5-2. .................................83Figure 5-2: Total ion chromatograms of bleached softwood pulp extract. B;supercritical fluid extraction with 100% carbon dioxide, C; SFE of raffeinate with90/10 carbon dioxide/methanol, D; SFE of second raffeinate with 80/20 carbondioxide/methanol. Sample size 10g. Chromatographic conditions in text. Peakidentities correspond to retention times in Table 5-2.............................................84Figure 5-3: Total ion chromatogram of reconstituted bleached softwood pulpextract after extract was allowed to go to dryness. Sample size 10g.Chromatographic conditions in text. ..........................................................................87Figure 5-4: Infrared spectra of dried bleached softwood pulp extracts. Extractswere reconstituted in methylene chloride. A: Soxhlet extract; B: Supercriticalfluid extract. .....................................................................................................................88Figure 5-5: Gravimetric extraction profile of a bleached softwood pulp sample.Each extraction was 15 minutes. Decompressed CO2 flow was 1 L/min.Percent extracted was based on the weight gain of the collection vial comparedto sample weight. ..........................................................................................................90Figure 5-6: Total ion chromatograms of bleached softwood pulp extract. A: Off-line methylation; B: In-situ methylation. Chromatographic conditions in text....99Figure 5-7: Structures of acetylated products identified in wood pulp extractsfollowing in-situ methylation and acetylation when the acetylation products wereadded only to the top of the extraction thimble.......................................................104Figure 5-8: A.Total ion chromatogram of a softwood pulp extract following in-situ acetylation; B. Mass spectrum of the chromatographic peak eluting at 18.96minutes; C. Standard mass spectrum of α-D-glucopyranoside, methyl,tetraacetate Chromatographic conditions in text. .................................................105Figure 5-9: A.Total ion chromatogram of a softwood pulp extract following in-situ acetylation; D. Mass spectrum of the chromatographic peak at 19.76minutes; E. Standard mass spectrum of β-D-glucopyranose, pentaacetate.Chromatographic conditions in text. ........................................................................106
xi
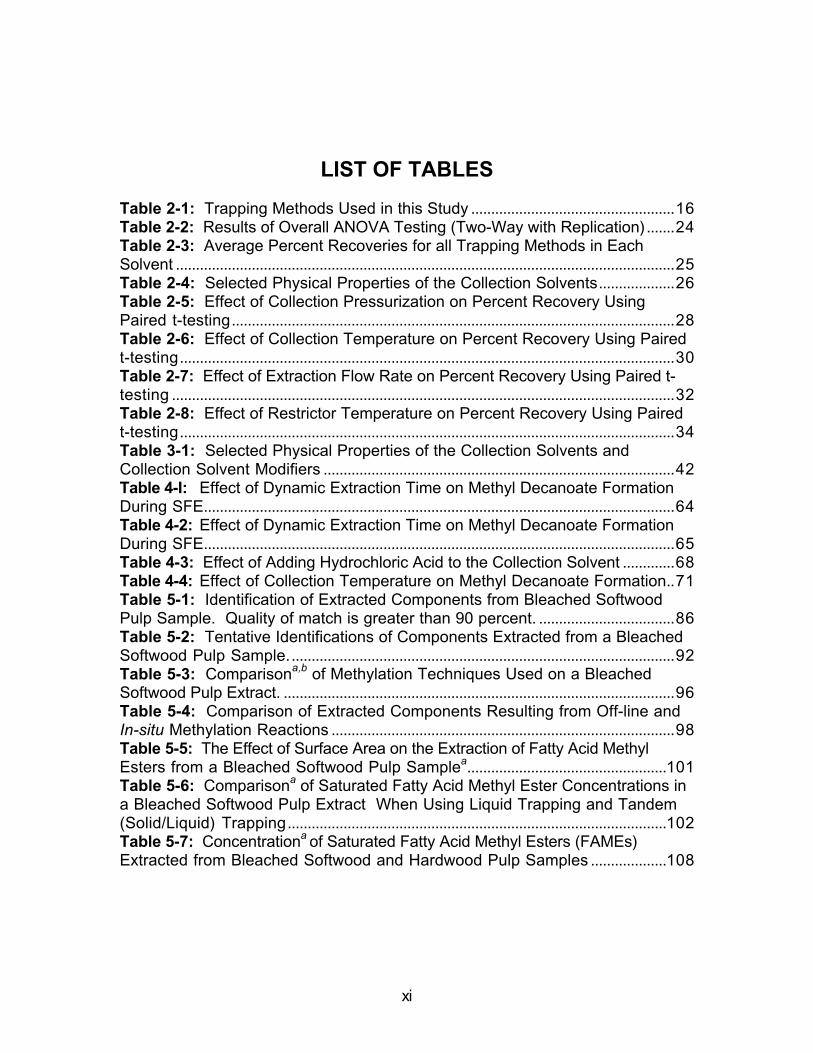
LIST OF TABLES
Table 2-1: Trapping Methods Used in this Study ...................................................16Table 2-2: Results of Overall ANOVA Testing (Two-Way with Replication).......24Table 2-3: Average Percent Recoveries for all Trapping Methods in EachSolvent .............................................................................................................................25Table 2-4: Selected Physical Properties of the Collection Solvents...................26Table 2-5: Effect of Collection Pressurization on Percent Recovery UsingPaired t-testing...............................................................................................................28Table 2-6: Effect of Collection Temperature on Percent Recovery Using Pairedt-testing............................................................................................................................30Table 2-7: Effect of Extraction Flow Rate on Percent Recovery Using Paired t-testing ..............................................................................................................................32Table 2-8: Effect of Restrictor Temperature on Percent Recovery Using Pairedt-testing............................................................................................................................34Table 3-1: Selected Physical Properties of the Collection Solvents andCollection Solvent Modifiers ........................................................................................42Table 4-I: Effect of Dynamic Extraction Time on Methyl Decanoate FormationDuring SFE......................................................................................................................64Table 4-2: Effect of Dynamic Extraction Time on Methyl Decanoate FormationDuring SFE......................................................................................................................65Table 4-3: Effect of Adding Hydrochloric Acid to the Collection Solvent .............68Table 4-4: Effect of Collection Temperature on Methyl Decanoate Formation..71Table 5-1: Identification of Extracted Components from Bleached SoftwoodPulp Sample. Quality of match is greater than 90 percent. ..................................86Table 5-2: Tentative Identifications of Components Extracted from a BleachedSoftwood Pulp Sample.................................................................................................92Table 5-3: Comparisona,b of Methylation Techniques Used on a BleachedSoftwood Pulp Extract. ..................................................................................................96Table 5-4: Comparison of Extracted Components Resulting from Off-line andIn-situ Methylation Reactions ......................................................................................98Table 5-5: The Effect of Surface Area on the Extraction of Fatty Acid MethylEsters from a Bleached Softwood Pulp Samplea..................................................101Table 5-6: Comparisona of Saturated Fatty Acid Methyl Ester Concentrations ina Bleached Softwood Pulp Extract When Using Liquid Trapping and Tandem(Solid/Liquid) Trapping...............................................................................................102Table 5-7: Concentrationa of Saturated Fatty Acid Methyl Esters (FAMEs)Extracted from Bleached Softwood and Hardwood Pulp Samples ...................108

1
CHAPTER ONE
TRAPPING FOLLOWING SUPERCRITICAL FLUIDEXTRACTION
1.0 Introduction
Supercritical fluid extraction (SFE) offers an attractive alternative to liquid-
liquid and liquid-solid extractions for many reasons.1 Carbon dioxide (CO2) is
the most commonly used fluid for SFE and presents very little environmental or
toxicological hazards, in direct contrast to the most commonly employed liquid
solvents. In addition, carbon dioxide is non-reactive with most analytes, and
allows successful extraction of light or air sensitive compounds. A fluid passes
into the supercritical state as it exceeds its critical temperature and critical
pressure, and the resulting supercritical fluid (SF) has both gas-like and liquid-
like properties. The densities of SFs are generally high like those of liquids
and offer the ability to solubilize many materials. Additionally, the diffusivity of
the SF will be higher than the material in the corresponding liquid state. This
higher diffusivity allows faster penetration into a matrix and thus the extraction
of an analyte with a SF occurs at a much faster rate than a corresponding liquid
or gaseous extraction.
For successful SFE, the process can be considered to occur in at least
two steps. In the first step, the analyte is extracted from the bulk matrix after
being solubilized by the supercritical fluid. Many references exist concerning

2
the optimization of the extraction step.2,3,4,5,6,7,8,9,10After this extraction step is
complete, it is necessary to trap the analytes prior to identification and
quantitative analysis. It is during this trapping step that the SF decompresses
to atmospheric pressure. The resultant expansion offers a great chance for the
loss of analytes, since each milliliter of supercritical CO2 expands to about 500
mL gas.
1.1 Solid Phase Trapping
Several different trapping methods are used in SFE. One of the most
commonly employed methods of trapping is onto an inert solid substrate or
solid sorbent, followed by subsequent rinsing of the analyte from the trap with a
suitable solvent. These traps can be stainless steel balls, or more frequently a
chromatographic packing material, such as octadecyl bonded silica (ODS) or
underivatized silica. Mulcahey and Taylor11 conducted a study with non-modified
CO2 to determine the best solid phase trap composition and trapping
conditions for a test mixture of analytes representing a wide range of polarities.
Mulcahey, Hedrick, and Taylor12 continued the work with a wider assortment of
solid phase sorbent traps. They found that a single trap composition may not
effectively trap a wide range of analyte polarities. Furthermore, the addition of a
modifier to the extraction fluid caused a decrease in trapping efficiencies.
1 S. B. Hawthorne, Anal. Chem. 62, (1990) 633a-642a.2 K. Li, C. P. Ong, and S. F. Y. Li, J. Chromatogr. Sci.,32 (1994) 53-56.3 M. K. L. Bicking, J. Chromatogr. Sci., 30 (1992) 358-360.4 A. Meyer and W. Kleiböhmer, J. Chromatogr. A, 657 (1993) 327-335.5 G. Maio, C. von Holst, B. W. Wenclawiak, and R. Darskus, Anal. Chem., 69 (1997) 601-606.6 V. Lopez-Avila, N. S. Dodhiwala, and W. F. Beckert, EPA/600/S4-90/026, 1991.7 J. R. Barnabas, J. R. Dean, W. R. Tomlinson, and S. P. Owen, Anal. Chem., 67 (1995)2064-2069.8 M. Kane, J. R. Dean, S. M. Hitchen, C. J. Dowle, and R. L. Tranter, Anal. Chim. Acta, 271(1993) 83-90.9 M. K. L. Bicking, T. G. Hayes, J. C. Kiley and S. N. Deming, J. Chromatogr. Sci., 31 (1993)170-176.10 I. Fernandez, J Dachs, and J. M. Bayona, J. Chromatogr. A, 719 (1996) 77-85.11 L. J. Mulcahey and L. T. Taylor, Anal. Chem., 64 (1992) 2352-2358.
3
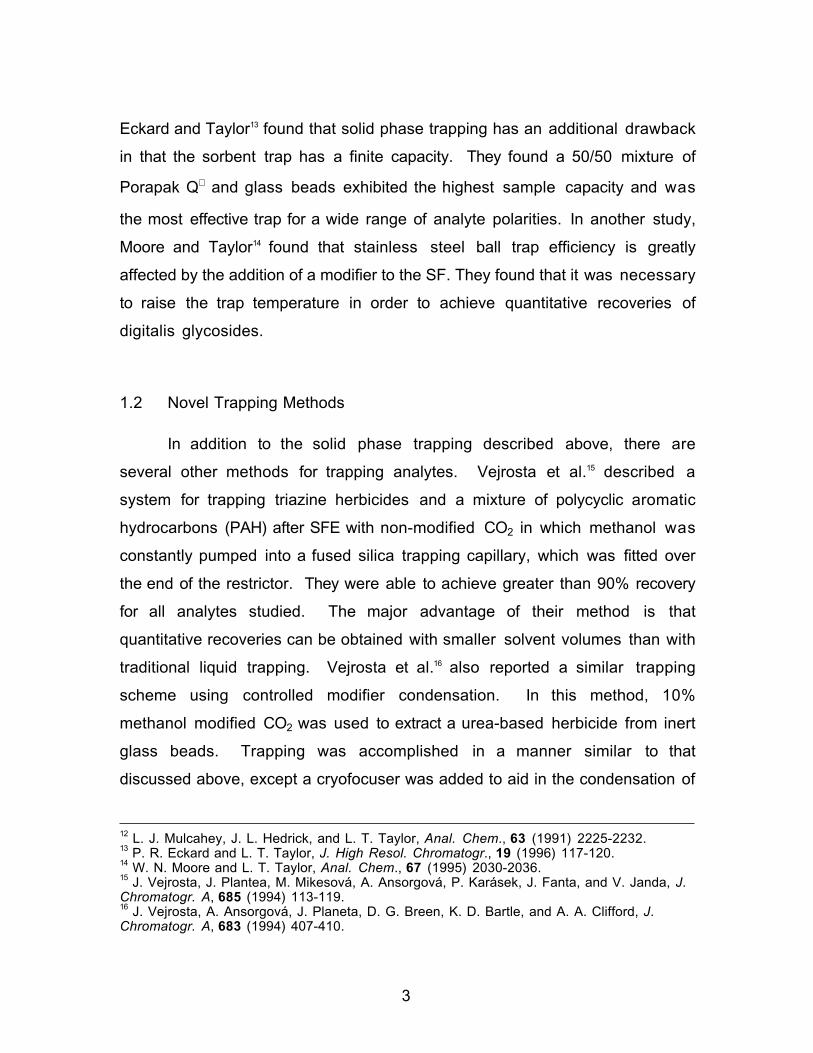
Eckard and Taylor13 found that solid phase trapping has an additional drawback
in that the sorbent trap has a finite capacity. They found a 50/50 mixture of
Porapak Q and glass beads exhibited the highest sample capacity and was
the most effective trap for a wide range of analyte polarities. In another study,
Moore and Taylor14 found that stainless steel ball trap efficiency is greatly
affected by the addition of a modifier to the SF. They found that it was necessary
to raise the trap temperature in order to achieve quantitative recoveries of
digitalis glycosides.
1.2 Novel Trapping Methods
In addition to the solid phase trapping described above, there are
several other methods for trapping analytes. Vejrosta et al.15 described a
system for trapping triazine herbicides and a mixture of polycyclic aromatic
hydrocarbons (PAH) after SFE with non-modified CO2 in which methanol was
constantly pumped into a fused silica trapping capillary, which was fitted over
the end of the restrictor. They were able to achieve greater than 90% recovery
for all analytes studied. The major advantage of their method is that
quantitative recoveries can be obtained with smaller solvent volumes than with
traditional liquid trapping. Vejrosta et al.16 also reported a similar trapping
scheme using controlled modifier condensation. In this method, 10%
methanol modified CO2 was used to extract a urea-based herbicide from inert
glass beads. Trapping was accomplished in a manner similar to that
discussed above, except a cryofocuser was added to aid in the condensation of
12 L. J. Mulcahey, J. L. Hedrick, and L. T. Taylor, Anal. Chem., 63 (1991) 2225-2232.13 P. R. Eckard and L. T. Taylor, J. High Resol. Chromatogr., 19 (1996) 117-120.14 W. N. Moore and L. T. Taylor, Anal. Chem., 67 (1995) 2030-2036.15 J. Vejrosta, J. Plantea, M. Mikesová, A. Ansorgová, P. Karásek, J. Fanta, and V. Janda, J.Chromatogr. A, 685 (1994) 113-119.16 J. Vejrosta, A. Ansorgová, J. Planeta, D. G. Breen, K. D. Bartle, and A. A. Clifford, J.Chromatogr. A, 683 (1994) 407-410.

4
the methanol modifier after decompression. They found that 75-83% of the
analyte recovery occurred in the condensed modifier, with roughly 10% being in
the rinse solvent. They also found that lower recoveries resulted when higher
flow rates were used for extraction.
Vejrosta et al.17 have also recently reported another method for analyte
collection based on mixing the expanding supercritical fluid with overheated
organic vapor. The assumed trapping mechanism involves the supercritical
effluent leaving the restrictor and entering a fused silica capillary filled with the
solvent vapor. The solvent vapor condenses on the active sites of the capillary
resulting in microdrops (solvent only) or microparticles (solvent and analyte).
These then recombine to from droplets of liquid, finally resulting in the creation
of a moving liquid film at the inner capillary surface. They were able to
quantitatively trap n-alkanes, selected PAHs, and a mixture of acetophenone,
N,N-dimethylaniline and naphthalene under various conditions. They explored
the use of different organic solvents and differing CO2 flow rates. They found
the method to use approximately one-tenth the solvent volume generally used,
and to reduce the need for preconcentration after SFE.
1.3 Liquid Trapping
Various articles in the literature report the use of “liquid trapping.” One
version of liquid trapping involves immersion of the restrictor into a liquid, as
illustrated in Figure 1-1, while a second version concerns an inert solid surface
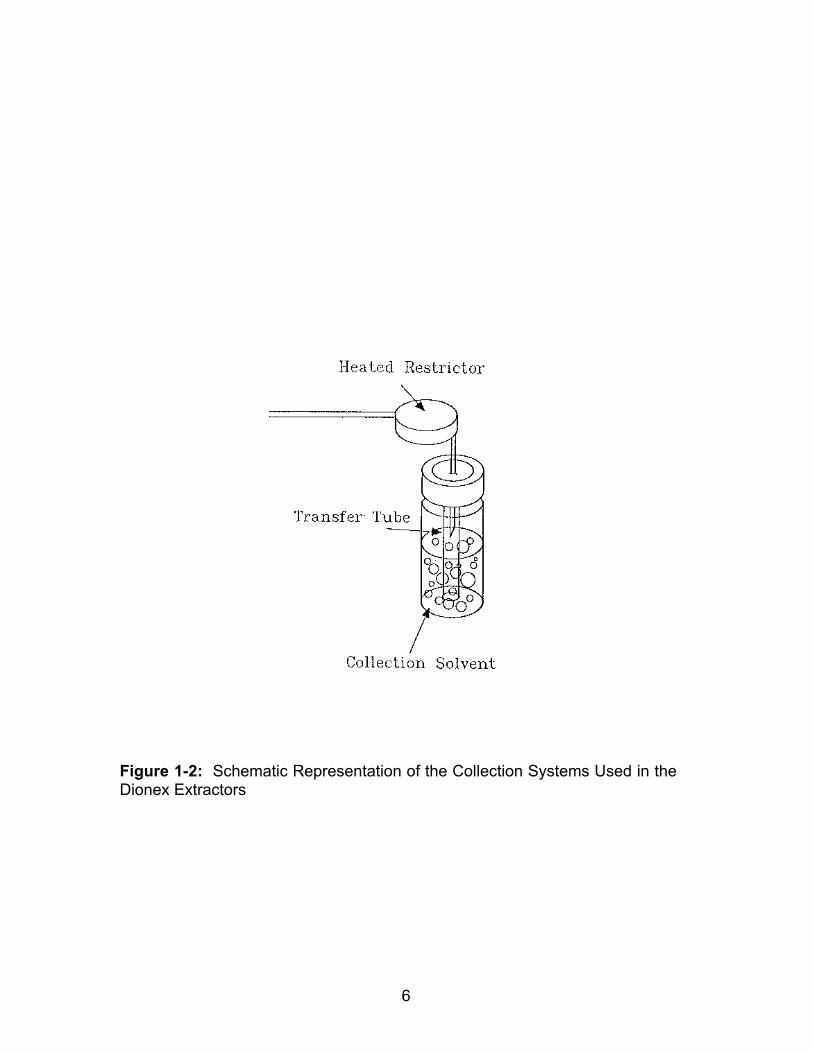
in tandem with a liquid trap. In the Dionex 703 model for example, non-volatile
analytes are thought to deposit on a hang-down tube (solid surface) while the
more volatile analytes partition into the collection liquid after decompression. A
schematic of this type of trapping device is shown in Figure 1-2.
17 J. Vejrosta, P. Karasek and J. Paneta, Anal. Chem., 71 (1999) 905-909.

5
Figure 1-1: Schematic Representation of the Liquid Trapping Process
(Coaxially heated stainlesssteel needle valve)
6
Figure 1-2: Schematic Representation of the Collection Systems Used in theDionex Extractors

7
Yang et al.18 compared solvent and sorbent trapping of volatile petroleum
hydrocarbons after being extracted from soil. They found that both systems
could effectively trap BTEX (benzene, toluene, ethylbenzene and xylenes) at
greater than 90% recovery. They also found solid sorbents could quantitatively
trap normal hydrocarbons of lower molecular weight (hexane) better than
solvent trapping (heptane for pressurized collection, octane for non-
pressurized). They used an Isco system with the restrictor immersed in the
collection solvent. Approximately half the solvent volume (7 mL) was required
with the trap pressurization as was required (15 mL) without trap pressurization
for similar recoveries.
Ashraf-Khorassani et al.19 compared collection efficiencies in: (a) an
empty vial, (b) liquid filled collection vessel, and (c) cryogenically cooled
adsorbent trap for several PAHs. Recoveries into the empty collection vial were
no greater than 23%, while the liquid collection method resulted in recoveries
no
greater than 38%. Reduction of the liquid carbon dioxide flow rate to less than
1 mL/min did not improve the recoveries for the empty vial, but resulted in
quantitative (>90%) recovery in the liquid trap. Only methylene chloride was
investigated for the solvent trap, and only two flow rates, 0.9 and 2.0 mL/min,
were used.
Langenfeld et al.20 performed an extensive study on the effects of
collection solvent parameters and extraction cell geometries on SFE
efficiencies. A mixture of 66 compounds of a wide range of polarities were
extracted and trapped into one of five organic solvents (methylene chloride,
chloroform, acetone, methanol, or hexane). Height of the collection solvent,
volume of the solvent, and effect of collection temperature on trapping
18 Y. Yang, S. B. Hawthorne and D. J. Miller, J. Chromatogr. A, 699 (1995) 265-267.19 M. Ashraf-Khorassani, R. K. Houck, and J. M. Levy, J. Chrom. Sci., 30 (1992) 361-366.20 J. J. Langenfeld, Mark D. Burford, S. B. Hawthorne and D. J. Miller, J. Chromatogr., 594(1992) 297-307.

8
efficiencies were all investigated. They found temperature control of the
collection vessel at 5oC provided the best recoveries. When addressing the
effect of the collection solvents, they concluded that the boiling point of the
solvents did not appear to be important, and that methylene chloride was the
best solvent while hexane was the worst for these analytes and conditions.
Maio et al.21 used the Dionex 703M system for the extraction of some
chlorinated benzenes and cyclohexanes from soil. They found the behavior of
their extracted compounds in the trapping solvent difficult to predict. They
recommended that the collection process be thoroughly examined for any new
set of analytes prior to optimization of the extraction conditions. Extraction
efficiencies were optimized using a factorial design. Porter et al.22, using a
Dionex system, found that the addition of inert bodies such as steel shot,
plastic beads or glass wool, and the use of a stirring bar during trapping gave
lower recoveries than simply trapping in the liquid.
Wenclawiak et al.23 using a similar system to that of Porter22 found that
trapping was analyte dependent, and that they were unable to improve the
collection efficiency of hexachlorocyclohexane by extending the collection of
analyte over a longer period of time, or changing the trapping solvent to different
binary mixtures. They found adding glass beads improved recoveries, but the
most significant effect was the increase in precision when compared to solvent
trapping alone. They also found that by adding a sintered frit and glass fiber
filter, along with the glass beads and the solvent, both recoveries and
precisions were improved, in direct contrast to Porter’s work.
21 G. Maio, C. von Holst, B. W. Wenclawiak, and R. Darskus, Anal. Chem., 69 (1997) 601-606.22 N. L. Porter, A. F. Rynaski, E. R. Campbell, M. Saunders, B. E. Richter, J. T. Swanson, R.B. Nielsen and B. J. Murphy, J. Chromatogr. Sci., 30 (1992) 367-373.23 B. W. Wenclawiak, G. Maio, Ch. v. Holst, and R. Darskus, Anal. Chem., 66 (1994) 3581-3586.

9
Thompson et al.24 found, using the Dionex system and non-modified
CO2, that a polarity test mix could not be quantitatively (above 90%) trapped
when using a single pure collection solvent. They were only able to
quantitatively recover all analytes by using mixed collection solvents. They were
unable to correlate any of the solvents’ physical properties, such as boiling
point, density, viscosity, surface tension, or Hildebrand solubility parameter with
collection efficiency. Thompson and Taylor25 continued this work with
acetonitrile-, methanol-, and toulene- modified CO2, and found that the highest
recoveries were achieved not with the mixed collection solvents, but instead
with pure collection solvents. Hexane proved to be the best overall solvent with
poor recoveries seen only when 8% toluene was the extraction fluid modifier.
From this body of work it can be seen that the liquid trapping process,
especially in which the restrictor tip is immersed in a liquid, is not well
understood, and warrants further study.
1.4 Research Objective
It is the objective of this work to attempt to elucidate the process of liquid
trapping with direct restrictor immersion. Chapter 2 presents a study of the role
of the physical properties of pure collection solvents upon the trapping
efficiency of several fat-soluble vitamins of similar solubilities and polarities.
Chapter 3 involves a study of the effect of adding modifiers to the collection
solvent in order to modify its physical properties. This work uses a test mixture
of differing polarities similar to that commonly reported in the literature. The
focus of Chapter 4 shifts to the potential reactivity of liquid solvent traps. This
phenomenon is illustrated via the formation of fatty acid methyl esters from their
24 P. G. Thompson, L. T. Taylor, B. E. Richter, N. L. Porter, and J. L. Ezzell, J. High Resol.Chromatogr., 16 (1993) 713-716.25 P. G. Thompson and L. T. Taylor, J. High Resol. Chromatogr., 17 (1994) 759-764.

10
corresponding fatty acids, both during the supercritical fluid extraction and
trapping processes. Chapter 5 presents the application of the previous three
chapters for the successful SFE and trapping of extractable fatty acids from
wood pulp samples. In this Chapter a comparison of solid/liquid (tandem)
trapping and liquid trapping alone is presented, as well as a comparison of
fatty acid derivatization methods. This work concludes with Chapter 6, which
summarizes the findings of the four previous chapters.
11
CHAPTER TWO
THE ROLE OF COLLECTION SOLVENT PHYSICALPROPERTIES ON LIQUID TRAPPING EFFICIENCIES
2.0 Introduction
As a supercritical fluid, carbon dioxide (CO2) is non-reactive with most
analytes and allows successful supercritical fluid extraction of light or air
sensitive compounds such as fat soluble vitamins. Because of these
properties the extraction of these vitamins from a variety of food matrices has
recently received a good deal of attention.26,27,28,29 Traditionally, these vitamins
were extracted from pharmaceutical and food matrices with an organic solvent
following a saponification step to remove interfering lipids, and then the
resulting solution was subjected to a solvent reduction step before subsequent
analysis.26,27 These methods are long, labor intensive, tedious, and afford
ample opportunity for oxidation of the analytes to occur. The use of supercritical
carbon dioxide to extract these analytes should decrease the likelihood of
analyte losses during sample preparation and may prove very advantageous.
Several published reports describe the extraction of fat-soluble vitamins
from various matrices with differing fat contents.27,28,29 Schneiderman et al.28
extracted Vitamin K from a powdered infant formula with non-modified CO2 and
analyzed the extracts with high performance liquid chromatography with
26 AOAC. Official Methods of the Association of Official Analytical Chemists, 13th ed., AOAC:Washington, D.C., 1992.27 U. S. Pharmacopeia, 22nd Revision, U. S. Pharmacopeia Convention: Rockville, MD,1990.28 M. A. Schneiderman, A. K. Sharma, K. R. R. Mahanama and D. C. Locke, J. Assoc. Off.Anal. Chem., 71, (1988) 815-817.29 S. Scalia, G. Ruberto, and F. Bonina, J. Pharm. Sci., 84 (1995) 433-436.
12
electrochemical detection. They were able to achieve quantitative recoveries in
just 15 minutes at an extraction vessel pressure of 8000 psi (545 atm) and
temperature of 60oC. Only a static extraction step was used, without a defined
dynamic step. The analytes were trapped onto a silica gel solid phase.
Scalia, Ruberto, and Bonina29 extracted Vitamins A and E, along with their
esters from tablet preparations using non-modified CO2 at 250 atm and 40oC at
a decompressed flow of 190-220 mL/min in 15 minutes. They achieved
vitamin recoveries of over 95%. Analytes were trapped into a liquid collection
vial containing tetrahydrofuran (THF) at 0oC, wherein the fixed restrictor tip was
just above the surface of the THF. Masuda et al.30 extracted retinol palmitate
and tocopherol acetate from a hydrophobic ointment using non-modified CO2 at
200kg/cm2 (194 atm) and 40oC. They used a liquid flow rate of 4 mL/min for 4
minutes and trapped onto a solid support of deactivated silica gel, prior to on-
line supercritical fluid chromatography. Quantitative recoveries of 102% were
observed for both analytes using these rather gentle extraction conditions. Prior
to extraction, it was necessary to mix the ointment with diatomaceous earth
powder.
Decompression of a supercritical fluid (SF) in a liquid can be considered
to be analogous to the formation of a bubble at a submerged, wetted orifice,
under constant flow conditions. Using fluid dynamics models, the factors
affecting the size or volume of the bubble formed at the restrictor tip may be
considered to be the: (a) restrictor internal diameter, (b) SF superficial velocity
through the orifice, (c) gravitational acceleration, as well as the (d) density,
viscosity, and surface tension of the trapping liquid.31 If the analyte molecule is
surrounded by extraction fluid molecules, it becomes obvious that smaller
bubbles offer greater likelihood for the analyte molecule to pass more quickly
30 M. Masuda, S. Koike, M. Handa, K. Sagara, and T. Mizutani, Analytical Sciences, 9(1993) 29-32.31 Encyclopedia of Fluid Mechanics, Volume 3: Gas-Liquid Flows, Gulf Publishing Co.:Houston, TX, 1986.
13
and efficiently into the liquid trap, due to the increased relative surface area of
the bubble. The restrictor internal diameter is directly related to the velocity of
the SF through the restrictor at fixed pressure, and can be adequately
represented by flow rate (measured as a liquid at the pump). This allows
factors a and b to be combined and leaves the factors affecting bubble volume
to be considered the physical properties of the liquid in which the analyte is to
be trapped as well as the flow rate through the restrictor.
Though several manuscripts have dealt with the optimization of a liquid
trapping step none has suggested a trapping mechanism for predictive use.
Since limited data are available concerning the mechanisms involved in liquid
trapping, the goal of this study was to investigate the effect of five trapping
parameters on the collection efficiencies of several fat-soluble vitamins, shown
in Figure 2-1, given a fixed set of (non-optimized) extraction conditions. By
using these vitamins, differences in polarity and solubility in the collection
solvents should not account for much of the variation noted in collection
efficiency. This study should allow for the identification of the most important
trapping parameters for analytes of similar structure.
2.1 Experimental
2.1.1 Extraction
All extractions were performed using an Isco SFX 3560 (Lincoln, NE)
supercritical fluid extraction system. Carbon dioxide with helium headspace
from Air Products and Chemicals, Inc. (Allentown, PA) was used as the
extraction fluid, since the instrument was not configured for cooling of the pump

14
Figure 2-1: Structures of the Fat-Soluble Vitamins Used in this Trapping Study
CH2OH
Vitamin A1
all-trans retinol
HO
Vitamin D2ergocalciferol
HO
Vitamin D3cholecalciferol
CH3
CH2CH2CH2CH CH3
CH3
3Vitamin K
HO
O
O
O
CH2CH=C
Vitamin Ealpha-tocopherol
15
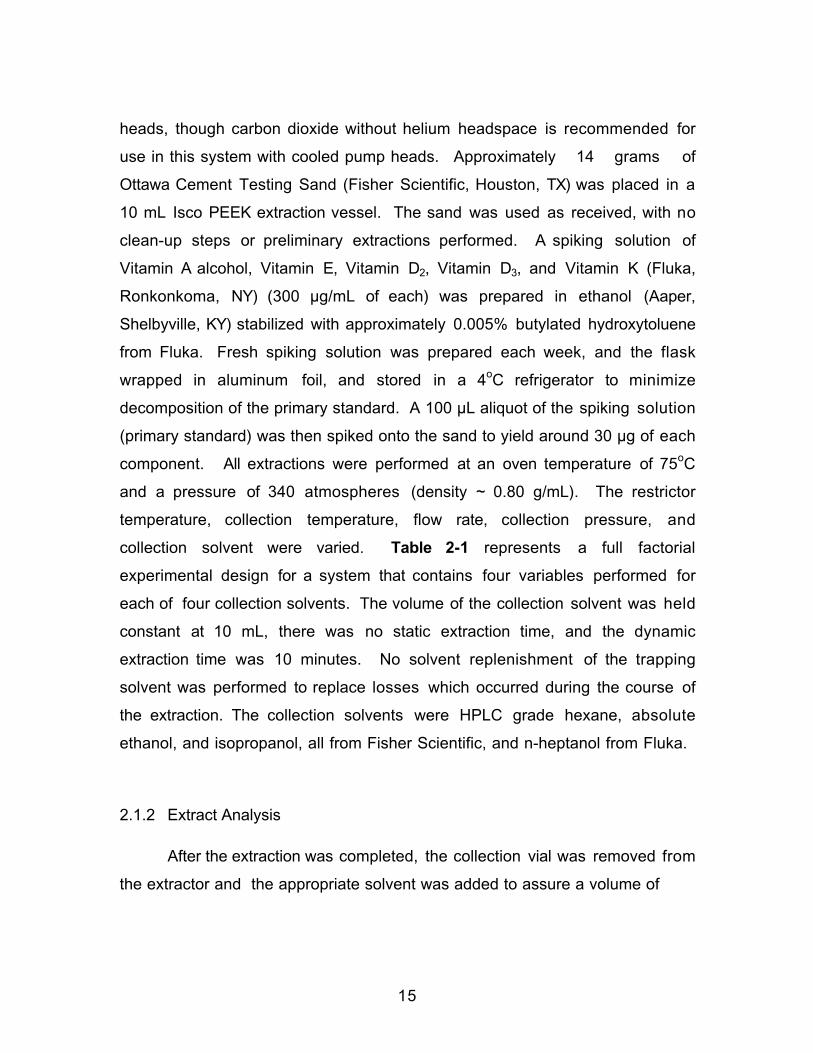
heads, though carbon dioxide without helium headspace is recommended for
use in this system with cooled pump heads. Approximately 14 grams of
Ottawa Cement Testing Sand (Fisher Scientific, Houston, TX) was placed in a
10 mL Isco PEEK extraction vessel. The sand was used as received, with no
clean-up steps or preliminary extractions performed. A spiking solution of
Vitamin A alcohol, Vitamin E, Vitamin D2, Vitamin D3, and Vitamin K (Fluka,
Ronkonkoma, NY) (300 µg/mL of each) was prepared in ethanol (Aaper,
Shelbyville, KY) stabilized with approximately 0.005% butylated hydroxytoluene
from Fluka. Fresh spiking solution was prepared each week, and the flask
wrapped in aluminum foil, and stored in a 4oC refrigerator to minimize
decomposition of the primary standard. A 100 µL aliquot of the spiking solution
(primary standard) was then spiked onto the sand to yield around 30 µg of each
component. All extractions were performed at an oven temperature of 75oC
and a pressure of 340 atmospheres (density ~ 0.80 g/mL). The restrictor
temperature, collection temperature, flow rate, collection pressure, and
collection solvent were varied. Table 2-1 represents a full factorial
experimental design for a system that contains four variables performed for
each of four collection solvents. The volume of the collection solvent was held
constant at 10 mL, there was no static extraction time, and the dynamic
extraction time was 10 minutes. No solvent replenishment of the trapping
solvent was performed to replace losses which occurred during the course of
the extraction. The collection solvents were HPLC grade hexane, absolute
ethanol, and isopropanol, all from Fisher Scientific, and n-heptanol from Fluka.
2.1.2 Extract Analysis
After the extraction was completed, the collection vial was removed from
the extractor and the appropriate solvent was added to assure a volume of
16
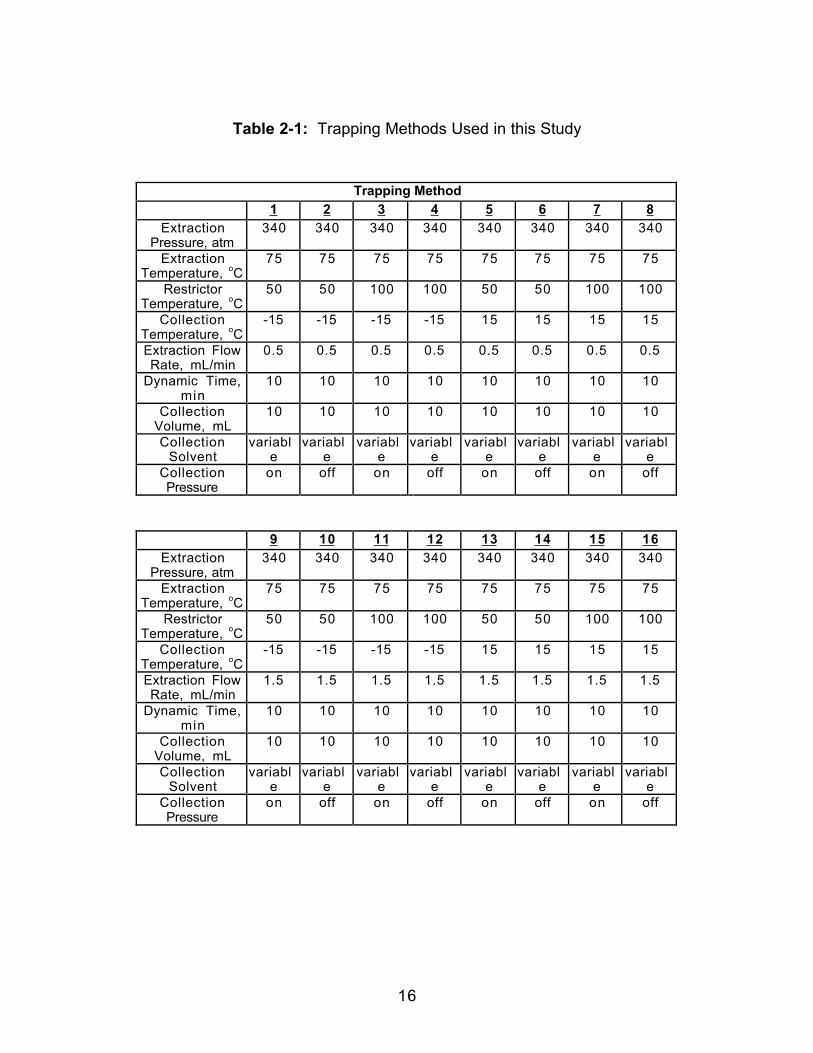
Table 2-1: Trapping Methods Used in this Study
Trapping Method1 2 3 4 5 6 7 8
ExtractionPressure, atm
340 340 340 340 340 340 340 340
ExtractionTemperature, oC
75 75 75 75 75 75 75 75
RestrictorTemperature, oC
50 50 100 100 50 50 100 100
CollectionTemperature, oC
-15 -15 -15 -15 15 15 15 15
Extraction FlowRate, mL/min
0.5 0.5 0.5 0.5 0.5 0.5 0.5 0.5
Dynamic Time,min
10 10 10 10 10 10 10 10
CollectionVolume, mL
10 10 10 10 10 10 10 10
CollectionSolvent
variable
variable
variable
variable
variable
variable
variable
variable
CollectionPressure
on off on off on off on off
9 10 11 12 13 14 15 16Extraction
Pressure, atm340 340 340 340 340 340 340 340
ExtractionTemperature, oC
75 75 75 75 75 75 75 75
RestrictorTemperature, oC
50 50 100 100 50 50 100 100
CollectionTemperature, oC
-15 -15 -15 -15 15 15 15 15
Extraction FlowRate, mL/min
1.5 1.5 1.5 1.5 1.5 1.5 1.5 1.5
Dynamic Time,min
10 10 10 10 10 10 10 10
CollectionVolume, mL
10 10 10 10 10 10 10 10
CollectionSolvent
variable
variable
variable
variable
variable
variable
variable
variable
CollectionPressure
on off on off on off on off
17
10 mL. To establish an equivalent 100% recovery, 100 µL of the same spiking
solution was added to an empty collection vessel, and the volume was
adjusted
to 10 mL. A portion of the solution was transferred to an amber autosampler
vial for analysis. Each standard was injected four times and the areas were
averaged to calculate recovery.
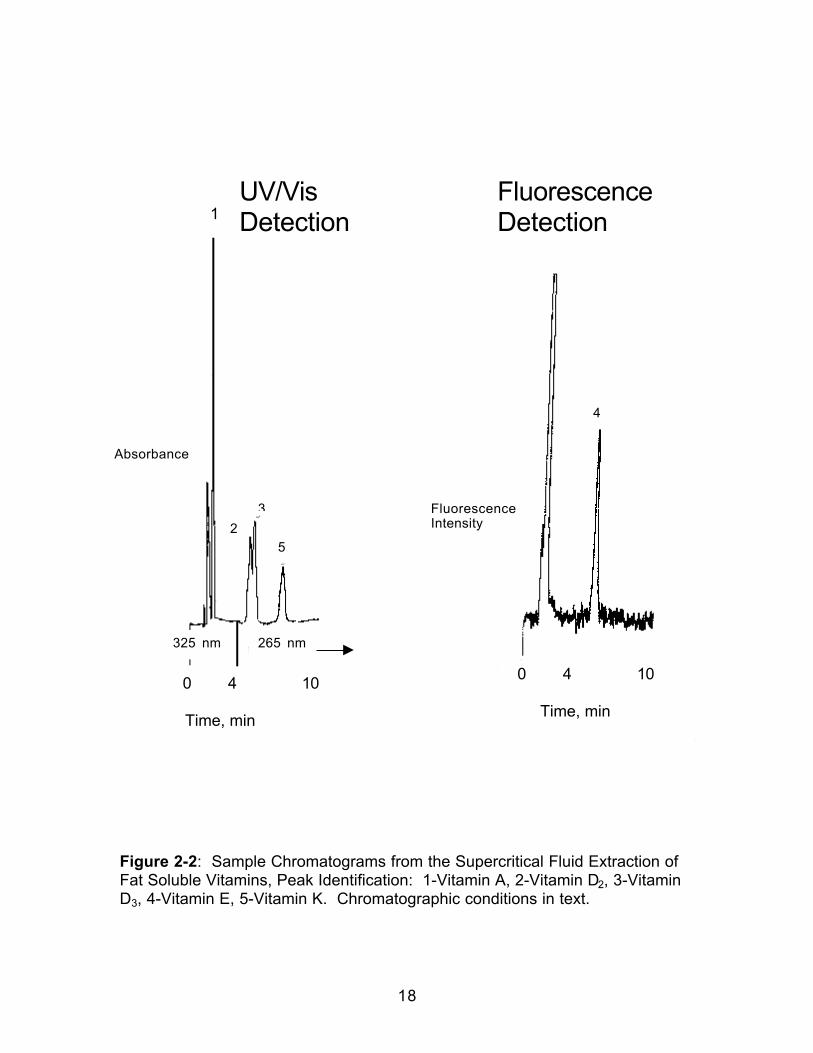
The extracts were analyzed by high performance liquid chromatography
using a Hewlett-Packard (Little Falls, DE) Series 1050 Liquid Chromatograph,
Autosampler, and Ultraviolet/Visible detector, and a Hitachi (Middlebury, CT) F-
1000 Fluorescence detector. An isocratic mobile phase of 75/25 HPLC grade
Acetonitrile/Methanol (Fisher Scientific) flowed at 2.0 mL/min through a 250 x
4.6
mm Lichrosorb(Hewlett Packard) ODS column (5µm particles). The UV/Vis
detector was operated at 325 nm for 4 min for the detection of Vitamin A, and
265 nm for the remaining 10 min to detect the D vitamins and Vitamin K. The
fluorescence detector was operated with an excitation wavelength of 294 nm
and an emission wavelength of 325 nm for the detection of Vitamin E. A
sample of the chromatograms is shown in Figure 2-2.
2.1.3 Data Analysis
Analysis of the generated data consisted of graphing to determine
preliminary trends, and analysis of variance (ANOVA) and paired t-tests for
differences in means. All graphing, ANOVA, and paired t-tests were performed
using Microsoft (Redmond, WA) Excel version 5 software. Additional analysis
of the data was performed using the student edition of Minitab (State College,
PA) Extra, version 10.
18
Figure 2-2: Sample Chromatograms from the Supercritical Fluid Extraction ofFat Soluble Vitamins, Peak Identification: 1-Vitamin A, 2-Vitamin D2, 3-VitaminD3, 4-Vitamin E, 5-Vitamin K. Chromatographic conditions in text.
Absorbance
0 4 10
Time, min
0 4 10
Time, min
265 nm325 nm
UV/VisDetection1
2
FluorescenceIntensity
4
5
3
FluorescenceDetection

19
2.2 Results And Discussion
Since the objectives of this work were to determine the effect of the
collection solvent, liquid CO2 flow rate during the extraction, collection
temperature, collection pressurization and restrictor temperature on the
collection efficiencies, a statistical analysis of the data was performed after the
extractions were completed. This was accomplished by performing either one-
way or two-way ANOVA testing and calculating the F statistic. This allowed the
separation of the error associated with the measurements into: (a) inherent,
random error associated with replication of the measurement and (b) error
associated with the change (or changes) in the trapping parameters. The
resulting F statistic indicated that either there was or was not a statistically
significant difference in the variances between the tested methods. If there
was a difference this could indicate either that the treatment had changed the
mean value of the measurements, or that the variability of the measurements
was statistically different. Since this work used four full factorial experimental
designs, paired t-testing was also used to determine if there was any
significant change in the mean value.
The first step in the data analysis was to plot the data in order to
determine if any trends were apparent. This was accomplished by using the
mean values of the percent recovery for the given methods and collection
solvents. After this, it was necessary to perform two-way ANOVA (with
replication) testing to determine the effect of changing the collection solvent
and/or the trapping method. The variances resulting from changing solvents
were calculated as were the variances for changing trapping methods. These
variances were then compared to the variance (reproducibility) of the
measurement at the given trapping method and solvent to give an F value. This
statistical testing was performed for each vitamin, and in every case it was
found that the choice of trapping solvent played a significant role in the trapping
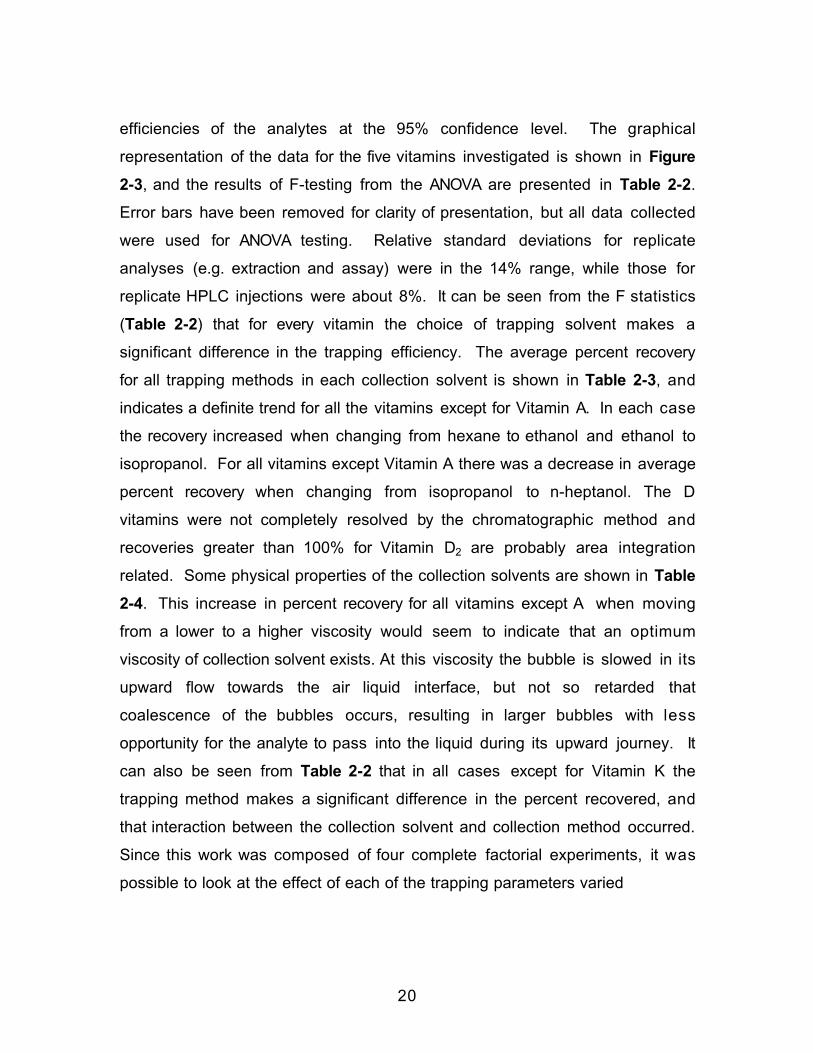
20
efficiencies of the analytes at the 95% confidence level. The graphical
representation of the data for the five vitamins investigated is shown in Figure
2-3, and the results of F-testing from the ANOVA are presented in Table 2-2.
Error bars have been removed for clarity of presentation, but all data collected
were used for ANOVA testing. Relative standard deviations for replicate
analyses (e.g. extraction and assay) were in the 14% range, while those for
replicate HPLC injections were about 8%. It can be seen from the F statistics
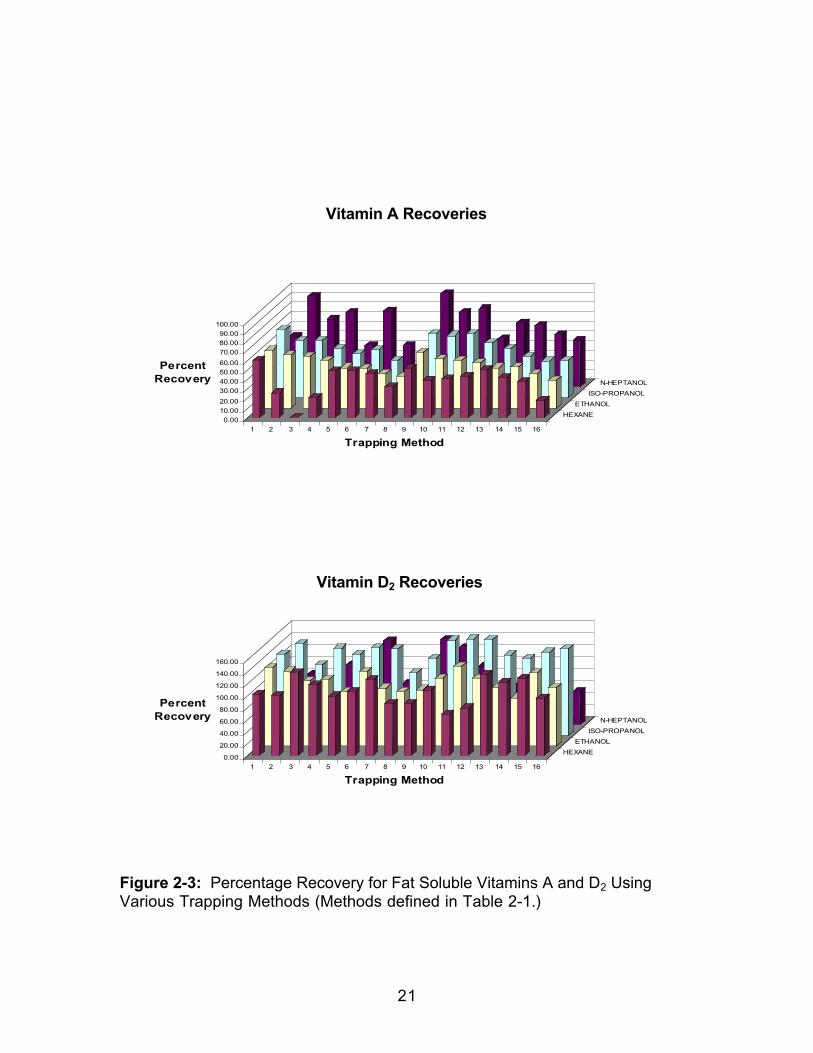
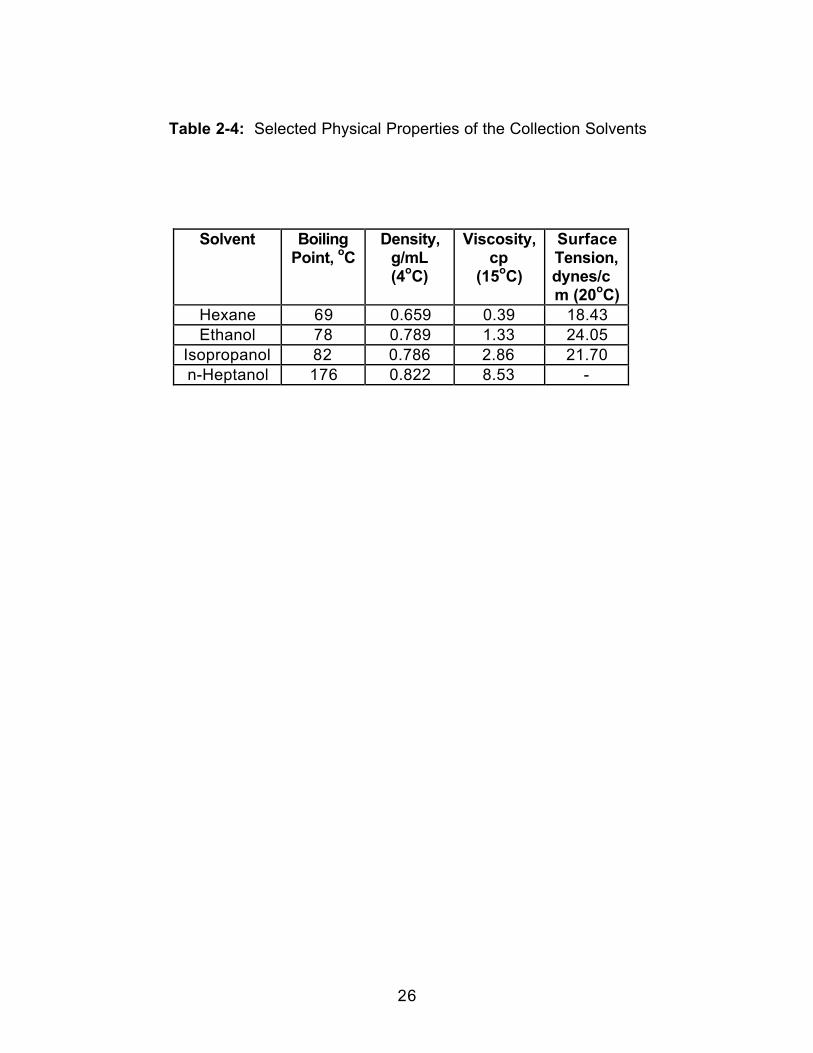
(Table 2-2) that for every vitamin the choice of trapping solvent makes a
significant difference in the trapping efficiency. The average percent recovery
for all trapping methods in each collection solvent is shown in Table 2-3, and
indicates a definite trend for all the vitamins except for Vitamin A. In each case
the recovery increased when changing from hexane to ethanol and ethanol to
isopropanol. For all vitamins except Vitamin A there was a decrease in average
percent recovery when changing from isopropanol to n-heptanol. The D
vitamins were not completely resolved by the chromatographic method and
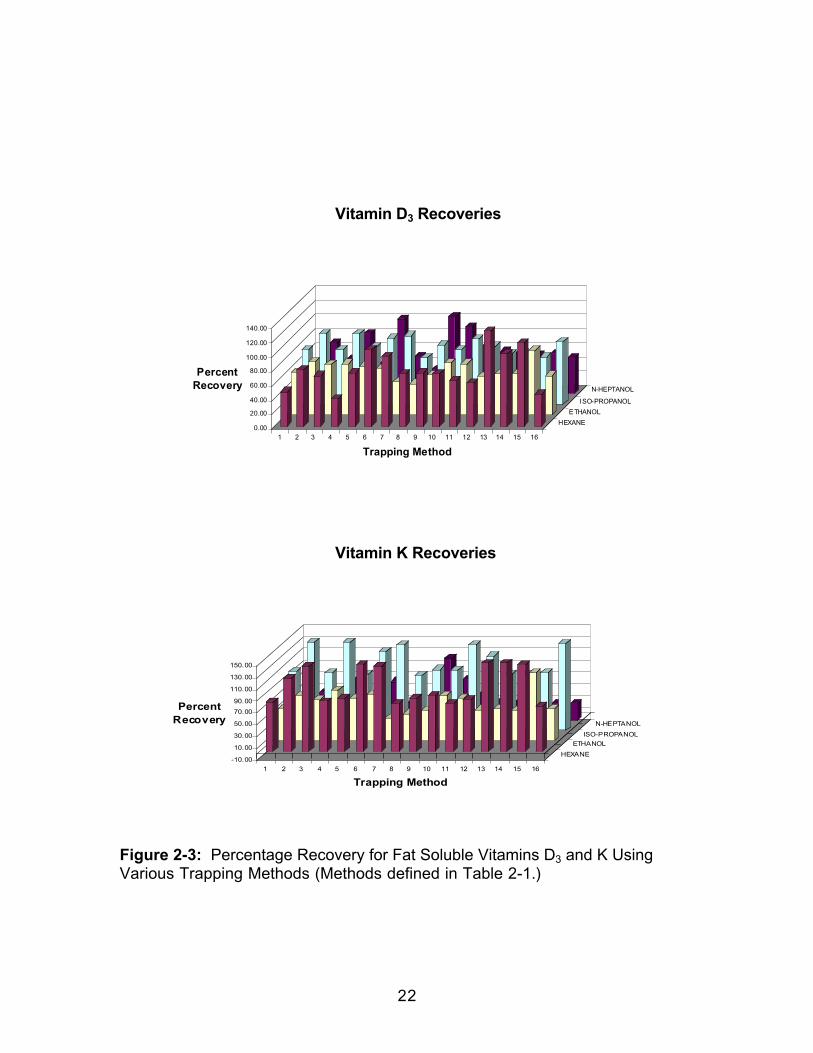
recoveries greater than 100% for Vitamin D2 are probably area integration
related. Some physical properties of the collection solvents are shown in Table
2-4. This increase in percent recovery for all vitamins except A when moving
from a lower to a higher viscosity would seem to indicate that an optimum
viscosity of collection solvent exists. At this viscosity the bubble is slowed in its
upward flow towards the air liquid interface, but not so retarded that
coalescence of the bubbles occurs, resulting in larger bubbles with less
opportunity for the analyte to pass into the liquid during its upward journey. It
can also be seen from Table 2-2 that in all cases except for Vitamin K the
trapping method makes a significant difference in the percent recovered, and
that interaction between the collection solvent and collection method occurred.
Since this work was composed of four complete factorial experiments, it was
possible to look at the effect of each of the trapping parameters varied
21
Figure 2-3: Percentage Recovery for Fat Soluble Vitamins A and D2 UsingVarious Trapping Methods (Methods defined in Table 2-1.)
0.00
10.00
20.00
30.00
40.00
50.00
60.00
70.00
80.00
90.00
100.00
Percent Recovery
1 2 3 4 5 6 7 8 9 10 11 12 13 14 15 16
HEXANE
ETHANOL
ISO-PROPANOL
N-HEPTANOL
Trapping Method
0.00
20.00
40.00
60.00
80.00
100.00
120.00
140.00
160.00
Percent Recovery
1 2 3 4 5 6 7 8 9 10 11 12 13 14 15 16
HEXANE
ETHANOL
ISO-PROPANOL
N-HEPTANOL
Trapping Method
Vitamin A Recoveries
Vitamin D2 Recoveries
22
Figure 2-3: Percentage Recovery for Fat Soluble Vitamins D3 and K UsingVarious Trapping Methods (Methods defined in Table 2-1.)
0.00
20.00
40.00
60.00
80.00
100.00
120.00
140.00
Percent Recovery
1 2 3 4 5 6 7 8 9 10 11 12 13 14 15 16
HEXANE
ETHANOL
ISO-PROPANOL
N-HEPTANOL
Trapping Method
-10.00
10.00
30.00
50.00
70.00
90.00
110.00
130.00
150.00
Percent Recovery
1 2 3 4 5 6 7 8 9 10 11 12 13 14 15 16
HEXANE
ETHANOL
ISO-PROPANOL
N-HEPTANOL
Trapping Method
Vitamin D3 Recoveries
Vitamin K Recoveries

23
Figure 2-3: Percentage Recovery for Fat Soluble Vitamin E Using VariousTrapping Methods (Methods defined in Table 2-1.)
0.00
20.00
40.00
60.00
80.00
100.00
120.00
140.00
160.00
Percent Recovery
1 2 3 4 5 6 7 8 9 10 11 12 13 14 15 16
HEXANE
ETHANOL
ISO-PROPANOL
N-HEPTANOL
Trapping Method
Vitamin E Recoveries

24
Table 2-2: Results of Overall ANOVA Testing (Two-Way with Replication)
F StatisticSource ofVariation
VitaminA
VitaminD2
VitaminD3
VitaminK
VitaminE
Fcritical
TrappingMethod
7.49 2.27 1.78 1.23 2.02 1.70
TrappingSolvent
37.82 38.19 5.93 35.59 9.16 2.63
Interaction 2.66 1.88 1.41 1.30 1.46 1.41
The null hypothesis was that there was no difference in average recoveries orreproducibilities when changing trapping method or solvent. The alternatehypothesis was that changing trapping method or solvent changed recoveriesand/or reproducibilities.

25
Table 2-3: Average Percent Recoveries for all Trapping Methods in EachSolvent
Trapping SolventAnalyte Hexane Ethanol Isopropanol n-Heptanol
Vitamin A 38.0 44.9 51.2 64.1Vitamin D2 106.5 106.6 138.0 78.0Vitamin D3 78.3 63.6 81.3 63.0Vitamin K 116.1 66.3 118.4 41.9Vitamin E 33.7 64.5 77.6 54.7
26
Table 2-4: Selected Physical Properties of the Collection Solvents
Solvent BoilingPoint, oC
Density,g/mL(4oC)
Viscosity,cp
(15oC)
SurfaceTension,dynes/cm (20oC)
Hexane 69 0.659 0.39 18.43Ethanol 78 0.789 1.33 24.05
Isopropanol 82 0.786 2.86 21.70n-Heptanol 176 0.822 8.53 -
27
individually by performing paired t-testing. Paired t-testing compares the
values obtained for each method varying only by the change of a specific
parameter. For instance, all even numbered methods differed only from
the
previous odd numbered method by pressurization of the collection vial.
A paired t-test was performed by comparing recoveries for the odd
numbered methods to recoveries from the corresponding even numbered
methods to test for the significance of the four studied factors. A positive value
for the calculated t value indicated that the first value for the parameter
(pressurization off or 50oC restrictor temperature or -15oC collection
temperature or 0.5 mL/min flow rate) resulted in higher recoveries. A negative
value indicated that the other level of parameter yielded the higher recoveries.
2.2.1 Effect of Collection Pressure
The SFX 3560 has the ability to pressurize the collection vial with an
additional approximately 30 psi of carbon dioxide. It is theorized that this
additional pressure would decrease trapping loss due to analyte volatility. In
this work, all the analytes investigated were relatively non-volatile, and the
results of testing, shown in Table 2-5, indicated that pressurization of the
collection vial had little effect for these analytes. Only in the case of Vitamin A
was any significant difference noted when the collection vial was pressurized,
and then only for the solvents ethanol and isopropanol. Though not statistically
significant, a generally similar trend was evident for the other two collection
solvents. Since Vitamin A was the most volatile analyte of this group, it would
appear that pressurization did, indeed, increase percent recoveries. For the
other less volatile analytes there appears to be no advantage for pressurizing
the collection vessel.

28
Table 2-5: Effect of Collection Pressurization on Percent Recovery UsingPaired t-testing
t StatisticAnalyte All
SolventsHexane Ethanol i-Propanol n-Heptanol
Vitamin A -1.32 -1.37 -3.55 -2.76 0.29Vitamin D2 0.28 -1.11 -0.37 0.74 0.77Vitamin D3 -0.19 -1.04 -0.52 0.44 0.90Vitamin K 0.08 -1.04 -0.05 1.14 0.56Vitamin E -0.11 -0.49 -1.11 -0.55 0.37
[tcritical] 2.04 2.36 2.36 2.36 2.36
The null hypothesis was that pressurization of the collection vial did not resultin a change in average percent recovery, while the alternate hypothesis wasthat pressurization affects recoveries. A positive t value indicates non-pressurized collection resulted in higher recoveries, while a negative t valueindicates higher recoveries with pressurized collection.
29
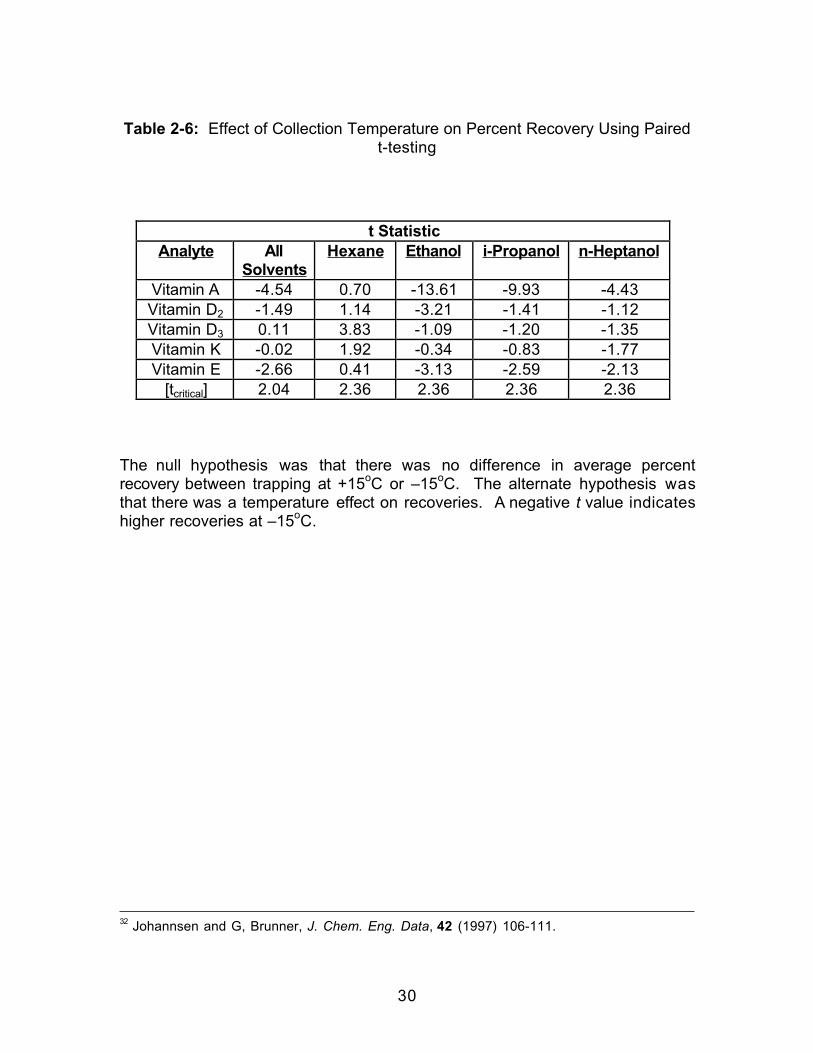
2.2.2 Effect of Collection Temperature
There are at least two reasons why the temperature of the collection
solvent may play a role in trapping efficiency. The first is that an increase in
solvent temperature generally leads to an increase in the solvating power,
which could lead to more efficient transfer of the analyte molecules into the
collection solvent. The second reason is that a decrease in collection
temperature may increase recoveries if there were losses due to either solvent
or analyte volatility. Thus, selection of a collection temperature becomes a
complex issue. For the trapping methods studied here, collection temperature
was maintained at either +15oC or –15oC. The results of this testing (Table 2-
6) indicated that for Vitamins A and E there was a significant increase in the
percent recovered at a temperature of –15oC as compared to +15oC for all of
the collection solvents taken together. For both of these vitamins (A and E)
there was no difference when hexane was the collection solvent, but Vitamin D3
actually showed higher recoveries at the higher collection temperature with
hexane as the collection solvent. This increase for Vitamin D3 could be a
solubility factor, since it had the lowest solubility of any of the vitamins studied
in supercritical CO2 under a given set of conditions.32 Solubility in hexane is
often taken as an indication of solubility in non-modified supercritical CO2. In
ethanol, Vitamins A, D2, and E all showed a significant increase in recoveries at
the lower temperatures. This could be related to either of two phenomena, or a
combination of the two. The first involves a decrease in the volatility of the
solvent resulting in less collection solvent loss during the course of the
extraction (higher level in the collection vial), and therefore a greater residence
time in the solvent, with the resultant greater chance for analyte transfer. The
30
Table 2-6: Effect of Collection Temperature on Percent Recovery Using Pairedt-testing
t StatisticAnalyte All
SolventsHexane Ethanol i-Propanol n-Heptanol
Vitamin A -4.54 0.70 -13.61 -9.93 -4.43Vitamin D2 -1.49 1.14 -3.21 -1.41 -1.12Vitamin D3 0.11 3.83 -1.09 -1.20 -1.35Vitamin K -0.02 1.92 -0.34 -0.83 -1.77Vitamin E -2.66 0.41 -3.13 -2.59 -2.13
[tcritical] 2.04 2.36 2.36 2.36 2.36
The null hypothesis was that there was no difference in average percentrecovery between trapping at +15oC or –15oC. The alternate hypothesis wasthat there was a temperature effect on recoveries. A negative t value indicateshigher recoveries at –15oC.
32 Johannsen and G, Brunner, J. Chem. Eng. Data, 42 (1997) 106-111.

31
second involves an increase in the viscosity of the solvents at lower
temperatures. Again, this would presumably result in a longer residence time
in the collection solvent, unless coalescence of the bubbles occurs. Moving
toward the more viscous solvents of isopropanol and n-heptanol, a decrease in
the t values for these vitamins is noted, so that for n-heptanol, only Vitamin A
recoveries are significantly improved by the lower temperature. Vitamin K was
not effected by the collection temperature, which was consistent with the
results of the overall ANOVA testing.
2.2.3 Effect of Extraction Flow Rate
The liquid CO2 flow rate for these experiments was either 0.5 mL/min or
1.5 mL/min. The time of extraction remained constant at 10 minutes, so it is
obvious that a greater mass of CO2 would be used for the extractions at the
higher flow rates. Therefore, if incomplete extraction was occurring, since the
extraction conditions were not optimized, use of the higher flow rates should
result in increased recoveries. Since the SFX 3560 has a linear variable
restrictor, an increase in flow rate will be directly proportional to the increase in
the restrictor opening. As discussed previously, this should increase bubble
size6 resulting in less chance for analyte transfer to the liquid phase. However,
when looking at the results shown in Table 2-7, the sign of the t statistics for all
of the solvents combined (first column), the trend was in the opposite direction,
suggesting that the extraction may be incomplete with the lesser mass of CO2.
The negative value of the t statistic indicated that the higher flow rate resulted in
higher recoveries. In the case of Vitamin A, there was a significant difference
favoring the low flow rate for ethanol alone. This may be explained by the
higher surface tension of ethanol along with the greater volatility of Vitamin A
than the other vitamins. Applying the LaPlace equation, the higher surface

32
Table 2-7: Effect of Extraction Flow Rate on Percent Recovery Using Paired t-testing
t StatisticAnalyte All
SolventsHexane Ethanol i-Propanol n-Heptanol
Vitamin A -1.04 -0.76 2.72 -1.15 -0.65Vitamin D2 -0.36 0.54 0.39 -1.17 -0.50Vitamin D3 -0.70 -1.01 -0.28 1.10 -0.70Vitamin K -0.32 -0.36 -0.07 0.59 -0.69Vitamin E -3.18 -7.33 -0.03 0.92 -2.46
[tcritical] 2.04 2.36 2.36 2.36 2.36
The null hypothesis was that changing the liquid flow rate from 0.5 mL/min to1.5 mL/min would not affect average percent recoveries. The alternatehypothesis was that change in flow rate would affect recoveries. A negative tvalue indicates higher recoveries at 1.5 mL/min.
33
tension of ethanol would cause the bubbles produced by the same flow rate
(from the same amount of pressure) to be larger than in the case of the other
solvents. This would mean that bubbles produced in ethanol would be larger
at every flow rate, and that increasing the flow from 0.5 to 1.5 mL/min could
make the bubble so large that analyte efficient transfer is not favored and the
most volatile of the analytes would be swept out of the collection vessel with
excess CO2.
2.2.4 Effect of Restrictor Temperature
The temperature of the restrictor was varied by only 50 degrees, from
50oC to 100oC. Since a variable restrictor was employed for the extractions,
temperature control is not as much of an issue as with a fixed linear restrictor
where a relatively high temperature is used to ensure that the analytes or co-
extractives will not precipitate from the solution and clog the restrictor. It is
observed from Table 2-8 that the lower restrictor temperature significantly
improved recoveries of Vitamin A in ethanol and isopropanol. Though not
significant at the 95% confidence level, improvement in recovery was noted for
the other two solvents also. Restrictor temperature did not significantly affect
the recoveries of any of the other vitamins. An explanation for this behavior
could be that Vitamin A is known to degrade at higher temperatures and in
acidic environments. Since any residual moisture present in the CO2 would
lead to an acidic fluid, it is highly plausible that this degradation could take
place within the restrictor itself, prior to decompression into the liquid trap.

34
Table 2-8: Effect of Restrictor Temperature on Percent Recovery Using Pairedt-testing
t StatisticAnalyte All
SolventsHexane Ethanol i-Propanol n-Heptanol
Vitamin A 4.86 2.29 7.79 4.33 2.27Vitamin D2 1.24 0.30 -0.16 0.04 1.70Vitamin D3 1.67 1.55 0.11 -0.45 1.37Vitamin K 0.48 1.06 -0.17 -1.58 1.04Vitamin E 0.67 1.17 1.59 0.80 -0.29
[tcritical] 2.04 2.36 2.36 2.36 2.36
The null hypothesis was that changing the restrictor temperature from 50oC to100oC would not affect average percent recoveries. The alternate hypothesiswas that changing the restrictor temperature influenced recoveries. A positive tvalue indicates higher recoveries at the lower restrictor temperature (50oC).

35
2.3 Conclusions
The major conclusion to be drawn from this work is that the physical
properties of a collection solvent used after supercritical fluid extraction greatly
influence trapping efficiency. In the case of these fat soluble vitamins of similar
polarities and solubilities changing the trapping parameters of extraction flow
rate, restrictor temperature, collection temperature and collection
pressurization had less effect on the trapping efficiencies than did changing the
solvent. The major physical properties that influence trapping efficiencies
appeared to be the viscosity and surface tension as predicted by gas-fluid
dynamics.

36
CHAPTER THREE
MODIFICATION OF THE COLLECTION SOLVENT TOENHANCE LIQUID TRAPPING EFFICIENCIES
3.0 Introduction
As seen in the previous chapter, the choice of pure collection solvent had
a greater impact on collection efficiencies than the collection temperature,
collection pressurization, restrictor temperature or extraction flow rate when
trapping fat-soluble vitamins. By choosing relatively similar analytes any
differences due to polarity or volatility were minimized. In this work the goal was
to investigate the effect of the addition of a modifier to the collection solvent on
the collection efficiencies of compounds of varying polarities and volatilities,
given a fixed set of (non-optimized) extraction conditions. The selected polarity
test mixture is shown in Figure 3-1. Addition of a modifier to the collection
solvent induces small changes in the physical properties of the solvent, and
allows prediction of trapping differences that would result from the use of non-
modified CO2 versus modified CO2. It was hoped that the addition of the
collection solvent modifier could also help to overcome some common
instrumental constraints, such as lack of collection pressurization or collection
temperature control.
37
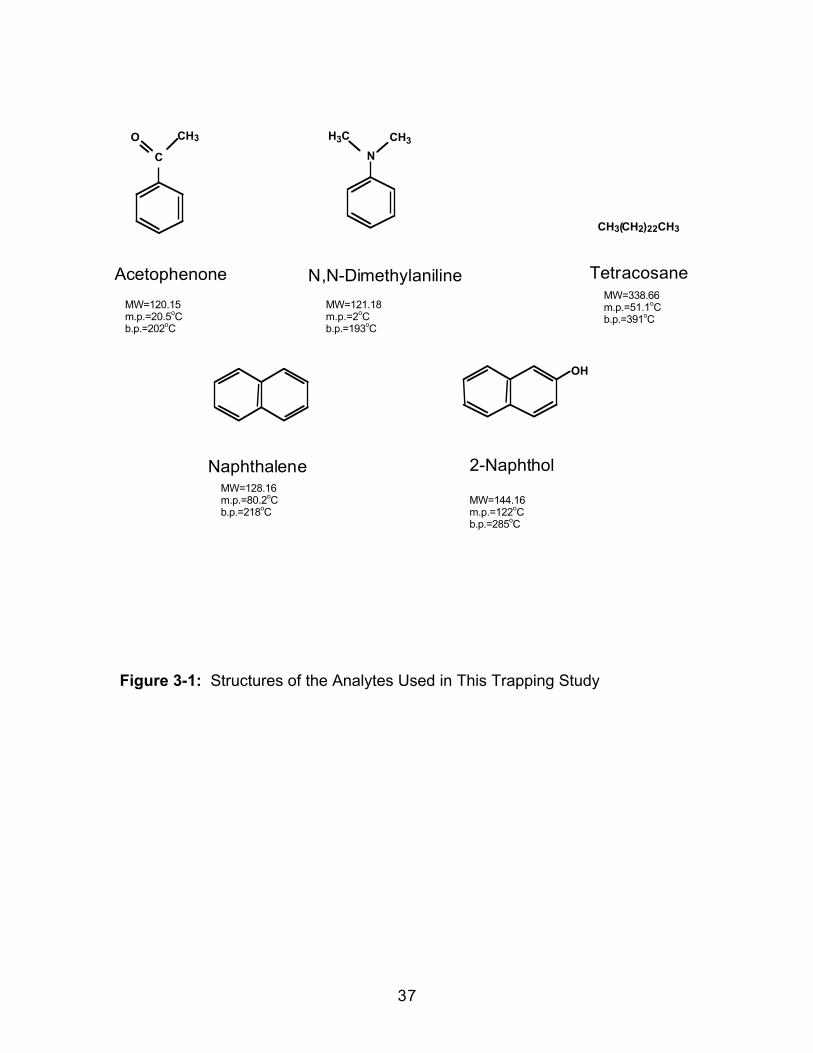
Figure 3-1: Structures of the Analytes Used in This Trapping Study
MW=128.16m.p.=80.2oCb.p.=218oC
MW=144.16m.p.=122oCb.p.=285oC
C
CH3O
N
CH3H3C
OH
Acetophenone N,N-Dimethylaniline
Naphthalene 2-Naphthol
CH3(CH2)22CH3
Tetracosane
MW=120.15m.p.=20.5oCb.p.=202oC
MW=121.18m.p.=2oCb.p.=193oC
MW=338.66m.p.=51.1oCb.p.=391oC
38
3.1 Experimental
3.1.1 Extraction
All extractions were performed using an Isco SFX 3560 (Lincoln, NE)
supercritical fluid extraction system. Carbon dioxide with helium headspace
(2000 psi) from Air Products and Chemicals, Inc. (Allentown, PA) was used as
the extraction fluid. Approximately 14 grams of Ottawa Cement Testing Sand
(Fisher Scientific, Houston, TX) was placed in a 10 mL Isco high crystalline
polymer extraction vessel. The sand was used as received, with no clean-up
steps or preliminary extractions performed. A spiking solution of
acetophenone, N,N-dimethylaniline, tetracosane, naphthalene, and 2-naphthol
(Fisher Scientific, Fairlawn, NJ) (~10 mg/mL of each) was prepared in HPLC
grade methylene chloride from Fisher Scientific. A fresh spiking solution was
prepared each week, wrapped in aluminum foil, and stored in a 4oC refrigerator
to minimize decomposition of the primary standard. A 100 µL aliquot of the
spiking solution was then spiked onto the sand to yield around 1 mg of each
component. The methylene chloride was allowed to evaporate under ambient
conditions prior to SFE. An internal standard solution of pyrene (~10 mg/mL)
from Fisher Scientific was also prepared in methylene chloride.
All extractions were performed at an extraction chamber temperature of
80oC and a pressure of 340 atmospheres, corresponding to a density of 0.88
g/mL. The restrictor temperature was held at 80°C and the liquid flow rate at
1.5 mL/min. The collection temperature, collection pressure, and collection
solvent composition were varied. The volume of the collection solvent was held
constant at 10 mL, there was no static extraction time, and the dynamic
extraction time was 15 minutes. No solvent replenishment of the trapping
solvent was performed to replace losses which occurred during the course of
39
the extraction. The collection solvents were made by volume percent with HPLC
grade methylene chloride, hexane, methanol and n-propanol, all from Fisher
Scientific.
3.1.2 Extract Analysis
After the extraction was completed, the collection vial was removed from
the extractor and collection solvent was added to approximate a volume of 10
mL. A 100 µL aliquot of the internal standard solution was added and the
solution was thoroughly mixed. To establish an equivalent 100% recovery, 100
µL of the same spiking solution was added to an empty collection vessel, the
volume was adjusted to 10 mL with the specific collection solvent being
studied, and 100 µL of the internal standard solution was added. A portion of
the solution was transferred to an amber autosampler vial for analysis. Each
standard was injected four times to determine response factors. The extracts
were injected and response factors compared to that for the standard to
calculate recoveries.
All extracts were analyzed using a Hewlett Packard (Little Falls, DE) HP
5890 gas chromatograph equipped with a split/splitless capillary column inlet
system which was maintained at 275oC. A 30 m, 0.25 mm i.d., 0.25 µm df DB-
5 (J & W Scientific, Folsom, CA) fused silica capillary column was used for the
separation. Ultra High Purity helium (Air Products and Chemicals, Inc.,
Allentown, PA) was used as the carrier gas at a flow rate of ~2.5 mL/min (22 psi
head pressure) and the flame ionization detector was maintained at 325oC.
The temperature program employed contained a 1 min initial temperature of
50oC, followed by a ramp of 15oC/min to a temperature of 140oC, which was
maintained for 1 min. A second ramp of 30oC/min was then used to raise the
temperature from 140 to 300oC. The final temperature (300oC) was maintained
for 3 min. For all of the extracts, 1 µL was injected using a HP 7673 (Hewlett
40
Packard) automatic injector in the splitless mode. A representative
chromatogram of the extracted polarity mix components is presented in Figure
3-2.
3.2 Results and Discussion
This work was conducted in two phases, using methylene chloride and
hexane as the collection solvents. The modifier added was either methanol or
n-propanol. Some physical properties of both the collection solvents and
modifiers
are shown in Table 3-1. The first phase of this work focussed on determining
whether the addition of a modifier to the collection solvent could overcome the
effect of lowered collection temperature or collection pressurization. Though
the Isco SFX 3560 system used for these extractions is capable of pressurizing
the collection vessel and of collection temperature control down to –20oC
through the use of an auxiliary coolant, it was recognized that many instruments
available, especially the more basic models, do not present such advantages
to the user.
3.2.1 Effect of Collection Temperature
For volatile and semi-volatile analytes, lowering the temperature lowers
the volatility of the analyte directly leading to less loss of the compound33. For
the more non-volatile analytes, a decrease in the collection temperature will
usually result in a decrease in the solubility of the analyte in the fluid. Since the
33 M. Ashraf-Khorassani, R. K. Houk, and J. M. Levy, J. Chromatogr. Sci., 30 (1992) 361-366.

41
Figure 3-2: Representative Gas Chromatogram of the Extracted Polarity Mix.Peak Identification: 1. Acetophenone, 2. N,N-Dimethylaniline, 3. Naphthalene,4. 2-Naphthol, 5. Pyrene (internal standard), 6. Tetracosane. Chromatographicconditions in text.
FIDResponse
0 5 10 15
Time, minutes
1 2 3 4 5 6
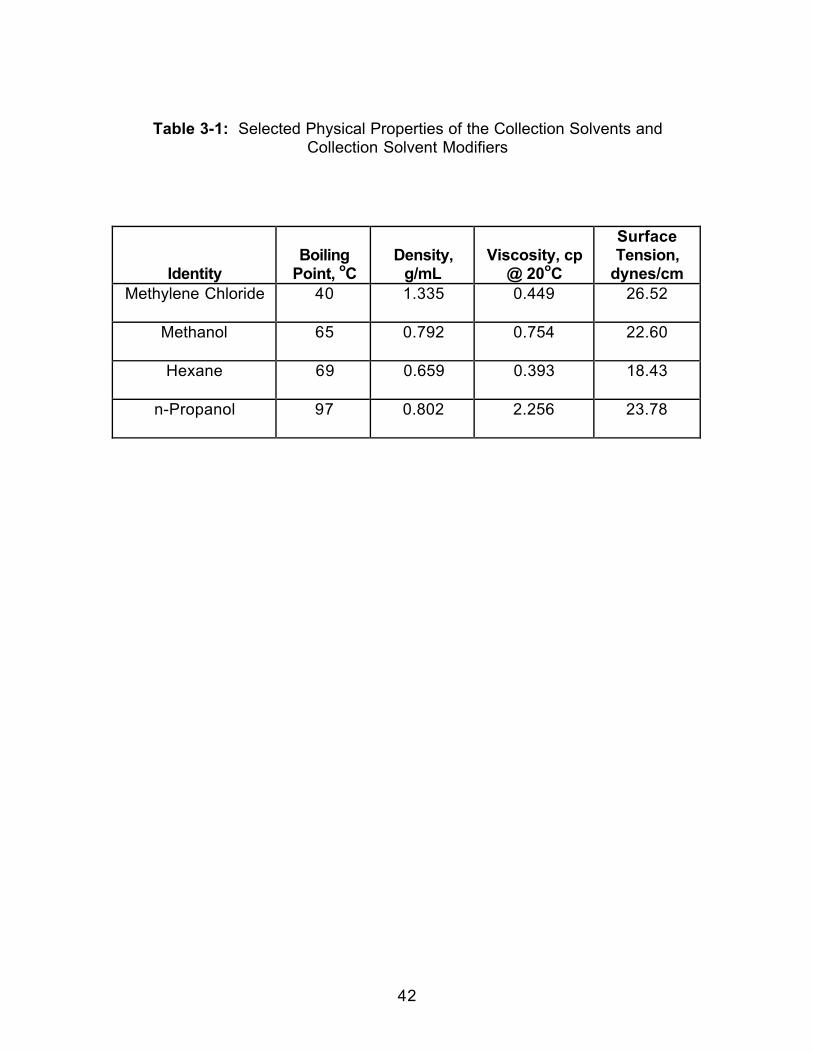
42
Table 3-1: Selected Physical Properties of the Collection Solvents andCollection Solvent Modifiers
IdentityBoiling
Point, oCDensity,
g/mLViscosity, cp
@ 20oC
SurfaceTension,
dynes/cmMethylene Chloride 40 1.335 0.449 26.52
Methanol 65 0.792 0.754 22.60
Hexane 69 0.659 0.393 18.43
n-Propanol 97 0.802 2.256 23.78
43
collection conditions in most extractions do not approach the solubility limit for
the analytes, temperature is normally reduced to as low as instrumentally
possible. In this work we chose to look at 25oC, relatively close to room
temperature, and 0oC, easily obtainable with an ice bath. In both cases, the
collection vial was not pressurized. The target compounds were arbitrarily
divided into semi-volatile (acetophenone and N,N-dimethylaniline) and non-
volatile (naphthalene, 2-naphthol and tetracosane) groups. Figures 3-3a and
3-3b compare the recoveries of the analytes at 0o and 25oC, when methylene
chloride was the collection solvent and methanol was the modifier. As seen in
both of the figures, the addition of higher volumes of methanol to the methylene
chloride allows the collection efficiencies obtained at 25oC to approach those
obtained at 0oC. Upon initial addition of the methanol (5%), the recoveries
decrease at 25o, versus change very little for the 0o collection. This can be
attributed to two competing phenomena: a) the solubility of the CO2 in the
collection fluid, and b) the volatility of the collection solvent. Higher recoveries
are obtained at the lower temperature because the CO2, carrying the analyte, is
more soluble in the collection solvent than at higher temperatures. The lower
temperature also minimizes collection solvent (and analyte) loss due to simple
volatilization. Once higher levels of methanol (20%) are present in the
collection solvent, the losses due to volatility are comparable to those seen at
lower temperature. Simply decreasing the volatility of the collection solvent
alone will not account for the observed behavior, since recoveries for both the
volatile and non-volatile compounds in the test mix are comparable.

44
Figure 3-3: Effect of Collection Temperature on the Recoveries of the PolarityMix Components. SFE conditions in text. Non-pressurized collection,Methylene chloride collection solvent, Methanol modifier. A. Semi-volatileAnalytes, B. Non-Volatile Analytes.
A
B
0.00
20.00
40.00
60.00
80.00
100.00
120.00
0 5 10 15 20 25
Percent Methanol in Methylene Chloride
Per
cen
t R
eco
very
Acetophenone 0 C
N,N-Dimethylanil ine 0 C
Acetophenone 25 C
N,N-Dimethylanil ine 25 C
0.00
20.00
40.00
60.00
80.00
100.00
120.00
0 5 10 15 20 25
Percent Methanol in Methylene Chloride
Per
cen
t R
eco
very
Naphthalene 0 C
2-Naphthol 0 C
Tet racosane 0 C
Naphthalene 25 C
2-Naphthol 25 C
Tet racosane 25 C
45
The same effect is seen at 25oC for hexane with n-propanol modifier, but
no increase in collection efficiencies is seen when using hexane with the
methanol modifier or methylene chloride with n-propanol modifier. When
hexane is modified with methanol there is very little change in the overall
volatility of the solution due to the similarity of the boiling points of the two
liquids, and it affords no advantages during the trapping process. The case of
methylene chloride modified with n-propanol is not explicable in terms of the
decreased volatility of the collection solvent.
It can be seen that in some cases increased collection temperatures
can be used, if the collection solvent is modified to decrease its overall volatility,
and enhance collection efficiencies.
3.2.2 Effect of Collection Pressurization
In order to determine the effect of pressurizing the collection vessel, the
collection temperature was fixed at 25oC, which would actually favor analyte
loss. For the cases in which hexane was the collection solvent, the
reproducibility of the data for non-pressurized collection was much worse than
when pressurized. This makes direct statistical comparison of the mean
values difficult, due to the unequal variances, but in both cases (methanol and
n-propanol as modifier) pressurization of the collection vial results in higher
recoveries for each analyte in the test mix. When n-propanol is the modifier,
collection efficiencies are improved as the modifier is added. This increase is
seen for both the pressurized and non-pressurized collection, as shown in
Figures 3-4a and 3-4b.
For the cases in which methylene chloride was the collection solvent,
again lower reproducibility was seen for the non-pressurized collection. The
pressurized collection proved to be superior with both methanol and n-
propanol
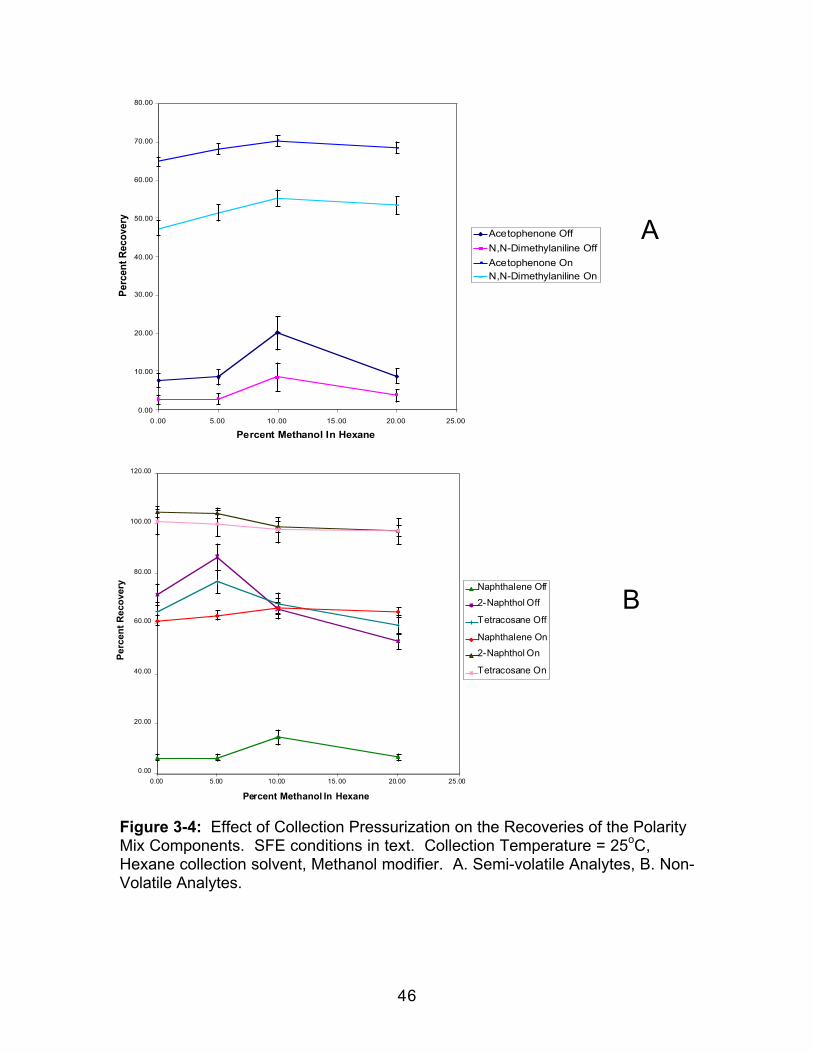
46
Figure 3-4: Effect of Collection Pressurization on the Recoveries of the PolarityMix Components. SFE conditions in text. Collection Temperature = 25oC,Hexane collection solvent, Methanol modifier. A. Semi-volatile Analytes, B. Non-Volatile Analytes.
A
B
0.00
10.00
20.00
30.00
40.00
50.00
60.00
70.00
80.00
0 .00 5.00 10 .00 15 .00 20.00 25.00
Percent Methanol In Hexane
Per
cen
t R
eco
very
Acetophenone Off
N,N-Dimethylaniline Off
Acetophenone OnN,N-Dimethylaniline On
0.00
20.00
40.00
60.00
80.00
100.00
120.00
0.00 5.00 10.00 15.00 20.00 25.00
Percent Methanol In Hexane
Per
cen
t R
eco
very Naphthalene Off
2-Naphthol Off
Tetracosane Off
Naphthalene On
2-Naphthol On
Tetracosane On

47
modifiers. In the case of n-propanol, addition of the modifier had no significant
effect on the recoveries of any of the analytes. With methanol, however, though
the pressurized collection gave higher recoveries, addition of the methanol to
the methylene chloride, at 20 volume percent, resulted in higher recoveries
than without modifier. These data are shown in the 25oC recoveries in Figures
3-3a and 3-3b.
In all instances investigated in this work, collection pressurization
improves not only collection efficiencies for both semi-volatile and non-volatile
analytes, but the reproducibilities for replicate trials, and it appears that addition
of a modifier to the collection solvent is unable to overcome these advantages.
3.2.3 Effect of Modifier Identity
For this determination, we used the worst case scenarios with a
collection temperature of 25oC and no collection pressurization. For the hexane
based collection solvents, addition of methanol to the solvent did not
statistically enhance recoveries for any of the analytes. However, when n-
propanol was the collection solvent modifier recoveries were greatly enhanced
as seen in Figure 3-5. Though neither methanol or n-propanol is soluble in
hexane at the 20 volume percent level, a two phase collection system did not
diminish analyte recoveries, and even increased them in the case of n-
propanol. (Recoveries were determined based on a spiked standard treated in
the same manner as the extracted samples. In these cases only the hexane or
methylene chloride phase was injected into the chromatograph, but any
partitioning effect between the two liquids would be the same for the standard
and samples.) The excess alcohol after the hexane was saturated would tend
to act in much the same manner as an inert solid particle, in that it would
increase residence time in the collection solvent. Enhancement of the
recoveries when n-propanol is the modifier is
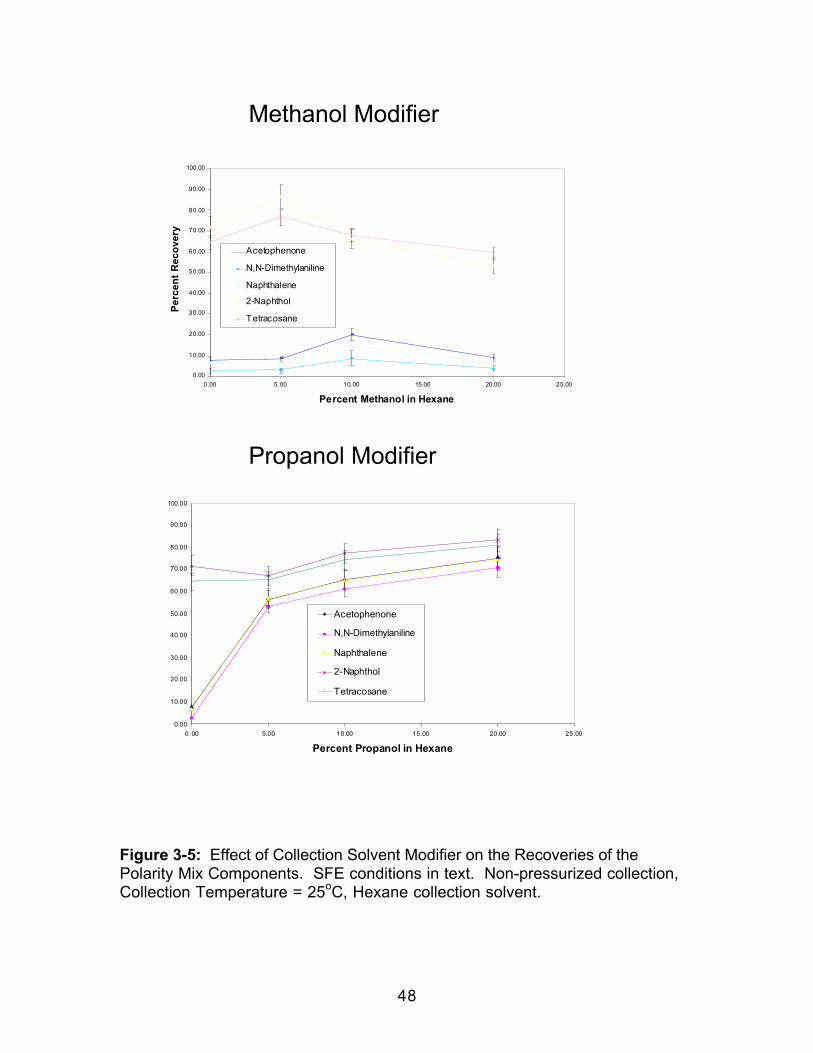
48
Figure 3-5: Effect of Collection Solvent Modifier on the Recoveries of thePolarity Mix Components. SFE conditions in text. Non-pressurized collection,Collection Temperature = 25oC, Hexane collection solvent.
Methanol Modifier
0.00
10.00
20.00
30.00
40.00
50.00
60.00
70.00
80.00
90.00
100.00
0.00 5.00 10.00 15.00 20.00 25.00
Percent Methanol in Hexane
Per
cen
t R
eco
very
Acetophenone
N,N-Dimethylaniline
Naphthalene
2-Naphthol
Tetracosane
0.00
10.00
20.00
30.00
40.00
50.00
60.00
70.00
80.00
90.00
100.00
0.00 5.00 10.00 15.00 20.00 25.00
Percent Propanol in Hexane
Acetophenone
N,N-Dimethylaniline
Naphthalene
2-Naphthol
Tetracosane
Propanol Modifier
49
thought to be due to the increase viscosity of the solution ( in comparison to
hexane alone, or hexane with methanol modifier) and the inclusion of the
additional (immiscible) n-propanol in the collection vial. Both of these
situations cause an increase in the time the CO2-analyte bubbles spend in the
collection solvent.
For the methylene chloride based solvents the addition of n-propanol
resulted in no significant change (increase or decrease) in the collection
efficiencies for any of the analytes. The addition of methanol resulted in
significantly improved recoveries only for tetracosane and 2-naphthol, and only
at the 20% level. The reason(s) for this occurrence are unclear at this time.
3.2.4 Effect of Collection Solvent Identity
Finally if the collection solvent itself is considered, when the modifier is
the same, we see a much more pronounced effect with hexane than with
methylene chloride when n-propanol is the modifier. These data are illustrated
is Figure 3-6, and the results can be attributed to the ability of the n-propanol to
function in several ways to modify the collection fluid. The volatility of the
collection fluid is decreased, the viscosity is increased, and the immiscible n-
propanol droplets act to change the flow path, increasing residence time of the
analytes. Apparently an increase in fluid polarity is not important since the
same general trend is seen for all of the analytes, regardless of their polarity.
3.3 Conclusions
In agreement with the previous work from Chapter 2, we have found the
choice of the collection solvent is immensely important in achieving effective
liquid trapping (with direct restrictor immersion) of analytes. The addition of a

50
Figure 3-6: Effect of Collection Solvent on the Recoveries of the Polarity MixComponents. SFE conditions in text. Non-pressurized collection, CollectionTemperature = 25oC, n-Propanol modifier.
HexaneCollectionSolvent
MethyleneChlorideCollectionSolvent
0.00
10.00
20.00
30.00
40.00
50.00
60.00
70.00
80.00
90.00
100.00
0.00 5.00 10.00 15.00 20.00 25.00
Percent n-Propanol in Hexane
Acetophenone
N,N-Dimethylaniline
Naphthalene
2-Na phthol
Tetracosane
0.00
20.00
40.00
60.00
80.00
100.00
120.00
0.00 5.00 10.00 15.00 2 0.00 25.00
Percent n-Propanol in Methylene Chloride
Acetophenone
N,N-Dimethylaniline
Naphthalene
2-Naphthol
Tetracosane
PercentRecovery
PercentRecovery
51
modifier to the collection solvent allowed for the use of higher trapping
temperatures to trap semi-volatile and non-volatile analytes. This should allow
trapping systems to be operated under ambient conditions instead of sub-
ambient temperatures. Collection pressurization makes a significant
difference at higher collection temperatures, which is most profound when
trapping more volatile analytes in a more volatile solvent. This effect
unfortunately cannot be overcome by the addition of a collection solvent
modifier, and thus pressurization is highly recommended.
Changing the viscosity and surface tension of the collection solvent can
also change trapping efficiencies. This is an important point that must be
considered when trapping in a pure collection solvent after extraction has been
performed with a modified fluid. The collection efficiency will change with the
addition of the modifier, which can either be beneficial or detrimental to the
collection process. This indicates that the choice of SFE trapping parameters
can be as important as the choice of extraction parameters. The previous two
chapters have described the importance of the choice of collection solvent with
emphasis on the ability of the solvent to trap the analytes. In the next chapter,
the role of the collection solvent in chemical reactions occurring during the
trapping process will be explored.

52
CHAPTER FOUR
ESTERIFICATION OF DECANOIC ACID DURINGSUPERCRITICAL FLUID EXTRACTION EMPLOYING
EITHER METHANOL-MODIFIED CARBON DIOXIDE OR AMETHANOL TRAP
4.0 Introduction
Fatty acids are an important class of compounds found in a wide variety
of matrices. Because of their appreciable polarity, it is quite common for
analysis of the free fatty acids by gas chromatography (GC) to be troublesome,
due to the interaction between the polar carboxylic acid functionality and the
chromatographic stationary phase. Though analysis of free fatty acids is
possible with highly deactivated stationary phases34, the most common method
of GC analysis involves forming a more volatile, less polar derivative of the acid.
One of the more popular methods involves the formation of the methyl ester of
the fatty acid. This is generally accomplished by reaction of the acid(s) with
methanol in the presence of an acid catalyst, such as boron trifluoride, at
elevated temperature. This reaction results in the methyl ester formation, but
the ester must be separated from the acid catalyst to avoid column degradation
during chromatographic analysis. This is usually done via a liquid-liquid
extraction with a chromatographically amenable solvent such as hexane35.
34 A. Nomurs, J. Yasmada, K. Tasunoda, K. Sakaki, and T. Yokochi, Anal. Chem., 61 (1989)2076-2078.35 AOAC, Official Methods of the Association of Official Analytical Chemists, 13th ed.,AOAC: Washington, D.C., 1992.
53
Supercritical fluid extraction (SFE) is one method of removing fatty acids
from a matrix. SFE with carbon dioxide offers the advantages of using a non-
toxic extraction fluid, in direct contrast to many liquid-solid or liquid-liquid
extraction fluids, and the ability to control the temperature, pressure, and
density of the fluid, thus allowing selection of its solvating power. Carbon
dioxide is generally regarded as a non-reactive fluid when used for SFE. An
additional advantage of SFE involves the ability to perform derivatization
reactions during the extraction. Various reports appear in the literature
discussing the derivatization of polar compounds during SFE.
Field36 has published an excellent review of derivatization reactions
coupled with SFE, which includes a discussion of the theories and approaches
to derivatization with SFE, as well as many applications. In addition to
organics, organometals have also been determined using coupled
techniques37,38. Hawthorne et al.39 used trimethylphenylammonium hydroxide
and boron trifluoride to enhance the extraction of polar species from solid
samples. They reported immediate GC analysis and a large time savings.
However, they did find that multiple derivatization/extraction steps were
necessary to achieve quantitative recoveries (>90%) for some samples which
contained high levels of reactive matrix components. The samples they
investigated included microbial phospholipid fatty acids from whole cells and
wastewater phenolics from water, both as their methyl esters.
Rochette, Harsh, and Hill40 investigated a variety of sample preparation
methods to improve extraction recoveries of 2,4-dichlorophenoxy acetic acid
(2,4-D) from soils. They used silylation, ion-pairing, methyl esterification and
ionic displacement, finding the methyl esterification and ionic displacement to
be the most promising for quantitative SFE work. Though they abandoned in-
36 J. Field, J. Chromatogr. A, 785 (1997) 239-249.37 Y. Cai, R. Alzaga and J. Bayona, Anal. Chem., 66 (1994) 1161-1167.38 B. Wenclawiak and M. Krah, Fresnius J. Anal. Chem., 351 (1995) 134-138.39 S. Hawthorne, D. Miller, D. Nivens, and D. White, Anal. Chem., 64 (1992) 405-412.

54
situ methylation (using BF3/methanol) because of the appearance of holes at
unions made of PEEK material, they reported a 90% recovery of 2,4-D as its
methyl ester for a single (non-optimized) extraction. They also found it
necessary to destroy the BF3 with aqueous sodium chloride, and to partition the
methyl ester into a non-polar solvent such as benzene for gas chromatographic
analysis. Prior to initiating destruction of the BF3, they found chromatographic
deterioration leading to substantially broadened chromatographic peaks.
Meyer and Kleiböhmer41 developed a rapid efficient method for the
extraction of pentachlorophenol (PCP) from wood and leather products based
on an in-situ derivatization method (acetylation with triethylamine and acetic
anhydride). They found comparable results with conventional methods and
SFE reduced analysis times from about 2 days to less than 3 hours. They did
find a large matrix effect when the extraction of PCP from leather and wood was
compared to that from soils42. They also found that sample clean-up conditions
sometimes needed to be adjusted because of problems with co-extracted
material43. Lee, Peart, and Hong-You44 also developed an in-situ derivatization
method for determining PCP in soils. They acetylated with acetic anhydride
and triethylamine, and were able to achieve quantitative recoveries of the di-, tri-
, tetra- and penta- chlorophenols.
Hills, Hill and Maeda45 used a silylation reagent, tri-sil concentrate, to
derivatize samples of roasted coffee beans, roasted Japanese tea and marine
sediment. They stated that the extracts were GC-ready, resulting in not only
time savings, but also improved extraction yields of both the derivatized and
underivatized species. They postulated that the derivatizing reagent not only
made the compounds more soluble in the supercritical extraction fluid, but that
40 E. Rochette, J. Harsh and H. Hill, Jr., Talanta, 40 (1993) 147-155.41 A. Meyer and W. Kleibohmer, J. Chromatogr. Sci., 35 (1997) 165-168.42 A. Meyer and W. Kleibohmer, J. Chromatogr. A, 718 (1995) 131-139.43 A. Meyer and W. Kleibohmer, J. High Resol. Chromatogr., 19 (1996) 267-271.44 H. Lee, T. Peart and R. Hong-You, J. Chromatogr., 605 (1992) 109-113.45 J. Hills, H. Hill, Jr. and T. Maeda, Anal. Chem., 63 (1991) 2152-2155.
55
it was involved in a competition for active matrix sites, resulting in displacement
of the analyte from the matrix. King, France and Snyder46 have reported the on-
line derivatization of triglycerides under supercritical conditions. They used a
solid catalyst, alumina pretreated with methanol, for the in-situ trans-
esterification of the triglycerides. The methyl esters were then preferentailly
eluted via ASFC from the alumina catalyst. They applied this technique to the
analysis of a single soybean, evening primrose and peanut seeds, and found
results to be comparable with the much more time consuming and labor
intensive conventional method.
All of these papers have involved the derivatization reaction as a result of
the addition of materials to the extraction chamber. Kawakura and Hiata47 have
recently reported the methylation of carboxylic acids in methanol-modified
supercritical fluid carbon dioxide using a flow through system. They
investigated the methylation of substitiuted benzoic acids and the use of a
cation exchanger as a catalyst for the reaction. They also looked at the
uncatalyzed reaction and found conversion to the methyl esters in the
uncatalyzed reaction increased with increasing temperature and decreasing
pressure. They were able to achieve a maximum conversion of just under 60%
for p-nitrobenzoic acid. However, when using the cation exchanger as catalyst,
quantitative conversions were obtained for all the investigated substituted
benzoic acids. They also reported the transesterification of myristic acid,
originally present as the ethyl ester, to its corresponding methyl ester. They
were able to apply this technique to phenoxy acids retained on a solid phase
extraction (SPE) disk, although under the investigated conditions, recoveries
were not quantitative (less than 50%). All of this work used methanol-modified
carbon dioxide and a liquid trap of methylene chloride.
46 J. King, J. France and J. Snyder, Fresnius J. Anal. Chem., 344 (1992) 474-478.47 H. Kawakura and Y. Hirata, J. Chromatogr. A, 815 (1998) 225-230.
56
The objective of this work was to investigate the methylation (with no
derivatization agent) of decanoic acid that occurs during the supercritical fluid
extraction process, and to determine the effects of both extraction and collection
parameters on the reaction. Factors such as the chemical nature of the
extraction fluid, collection fluid, collection temperature, and the presence of a
catalyst in the collection vessel were all considered.
4.1 Experimental
4.1.1 Extraction
All extractions were performed using an Isco SFX 3560 (Lincoln, NE)
supercritical fluid extraction system. Carbon dioxide with helium headspace
(2000 psi) from Air Products and Chemicals (Allentown, PA) was used as the
extraction fluid, and HPLC grade methanol (Fisher Scientific, Fairlawn, NJ) was
used as the extraction fluid modifier.
Approximately 14 grams of Ottawa Cement Testing Sand (Fisher
Scientific, Houston, TX) was placed in a 10 mL Isco special high crystalline
polymer extraction vessel. The sand was used as-received, with no clean-up
steps or preliminary extractions performed. A solution of approximately 10
mg/mL decanoic acid (Fisher Scientific) in HPLC grade methylene chloride
(Fisher Scientific) was made, and 100 µL of the solution was spiked onto the
Ottawa sand. The sand was allowed to air dry prior to extraction. The volume
of the collection solvent was held constant at 10 mL, there was no static
extraction time, and the dynamic extraction time was 10 minutes. No solvent
replenishment of the trapping solvent was performed to replace losses which
occurred during the course of the extraction. The collection solvents were HPLC
grade hexane, methanol, and methylene chloride, all from Fisher Scientific.

57
The SFE conditions used for this study were a fluid pressure of 340 atm,
an extraction temperature of 40oC, a restrictor temperature of 80oC, a liquid flow
rate of 1.0 mL/min, along with variable dynamic and static extraction times and
collection temperatures. A pressurized (~30 psi) collection mode was used for
all experiments.
4.1.2 Extract Analysis
After the extraction was completed, the collection vial was removed from
the extractor, solvent was added to a volume of 10 mL. Then 100 µL of an
internal standard solution (5 mg/mL tetradecane in methylene chloride (Fisher
Scientific)) was added. To establish an equivalent 100% recovery, 100 µL of
the same spiking solution and 100 µL of the internal standard solution were
added to an empty collection vessel, and the volume was adjusted to 10 mL. A
portion of the solution was transferred to an amber autosampler vial for
analysis. Each standard was injected four times and the response factors
were averaged in order to calculate recoveries by the internal standard method.
In those cases where actual SFE was not performed, 100 µL of the
spiking solution was deposited into a collection vial containing 10 mL of the
collection solvent. The SFE program was then run on an empty extraction
thimble, and the decompression of the fluid occurred in the spiked collection
solvent.
All extracts were analyzed using a Hewlett Packard (Little Falls, DE) HP
5890 GC equipped with a split/splitless capillary column inlet system which
was maintained at 275oC. A 30 m, 0.25 mm i.d., 0.25 µm df DB-5 (J & W
Scientific, Folsom, CA) fused silica capillary column was used for the
separation. Grade
58
5.0 helium (BOC, Murray Hill, NJ) was used as the carrier gas and the flame
ionization detector was maintained at 325oC. The GC temperature program
contained a 2 min initial temperature of 80oC, followed by a ramp of 10oC/min to
a final temperature of 180oC which was maintained for 3 min. For all of the
samples, 1 µL was injected using a HP 7673 (Hewlett Packard) automatic
injector in the splitless mode.
Identification of the eluted chromatographic peaks was also performed
for several samples using GC with mass spectrometric detection. These
samples were analyzed using a Hewlett Packard (Little Falls, DE) HP 5890
Series II GC equipped with a split/splitless capillary column inlet system which
was maintained at 280oC. A 30 m, 0.25 mm i.d., 0.25 µm df DB-5-MS (J & W
Scientific, Folsom, CA) fused silica capillary column was used for the
separation. Mass spectra were obtained by directly interfacing the GC with a
HP 5972 (Hewlett Packard) mass selective detector (MSD). Grade 5.0 helium
(BOC, Murray Hill, NJ) was used as the carrier gas and the transfer line was
maintained at 280oC. The GC temperature program employed a 3 min initial
temperature of 60oC, followed by a ramp of 10oC/min to a final temperature of
300oC which was maintained for 10 min. For all of the extract solutions, 1 µL
was injected using a HP 7673 (Hewlett Packard) automatic injector in the
splitless mode. The mass spectra were obtained by electron impact (EI)
ionization at 70 eV. The ion source temperature was set at 280oC and the
masses scanned were from 30 to 550 amu. All data were analyzed using a
Hewlett Packard ChemStation equipped with the Wiley library of mass spectral
data.
4.2 Results and Discussion
This work was divided into preliminary scouting experiments to
determine whether the majority of the methylation reaction was occurring

59
during the supercritical fluid extraction, collection, or the chromatographic
process, and specific experiments to determine the effects of various
parameters on the methylation. During the scouting experiments no internal
standard was added to the collection vials, as only qualitative data were
desired.
4.2.1 Effect of Collection Solvent
The first experiment involved the formation of the methyl ester of
decanoic acid during SFE with non-modified carbon dioxide. After spiking the
extraction vessel with decanoic acid, the SFE was performed and collection
occurred in either methanol or hexane, during a 12 min extraction period.
Obviously, hexane lacks the ability to provide the methylating agent necessary
to from the methyl ester, and the presence of the fatty acid methyl ester (FAME)
was not seen in the chromatograms resulting from these extractions, as seen
in Figure 4-1a. It should be noted that there is no evidence of a
chromatographic peak for decanoic acid either, due to the activity of the
chromatographic system itself. However, when methanol was used as the
collection solvent a well shaped peak appeared in the chromatogram, as seen
in Figure 4-1b, indicating the formation of the methyl ester of decanoic acid, as
confirmed by GC with mass spectrometric detection. This indicated that the
FAME formation took place during the collection step, since no methylating
agent was available during the extraction step.

60
Hexane Trap
Methanol Trap
A
B
Figure 4-1: Effect of Extraction Fluid on Methyl Decanoate Formation, non-modified carbon dioxide a: Hexane trap, b. Methanol trap.
61
4.2.2 Effect of Extraction Fluid
The next preliminary experiment was designed to investigate if the
methylation occurred more readily under favorable extraction or collection
conditions. The same experiment as above was repeated using 20%
methanol-modified CO2 as the extraction fluid, and the resultant
chromatograms are shown
in Figures 4-1c and 4-1d. These chromatograms indicate that some formation
of the methyl ester has occurred even when using hexane as a collection
solvent, but it must be remembered that methanol was continually being added
to the liquid trap during the course of the extraction, so that formation of the
FAME could have occurred during either the extraction or collection step. Figure
4-1d indicates that the majority of the methylation took place during the
collection step. Though this work was done at a qualitative level it was obvious
that a higher amount of the FAME was obtained when using methanol instead
of hexane as a collection solvent, although it was not obvious if there was a
greater amount of the FAME formed when using methanol-modified CO2.
4.2.3 Effect of Static Extraction Time when Using Methanol-Modified CarbonDioxide
If the FAME was being formed during the SFE, in addition to the
collection step, it would follow that an increase in static extraction time; the
period that decanoic acid and methanol are in contact with one another under
supercritical conditions, should increase the amount of FAME formed. (For this
experiment, a 3 min dynamic extraction was followed by the static extraction
time period. This initial short dynamic extraction was performed to assure a
reproducible extraction fluid composition. The static extraction time was always
followed by a 30 min dynamic extraction.) Results of these experiments,
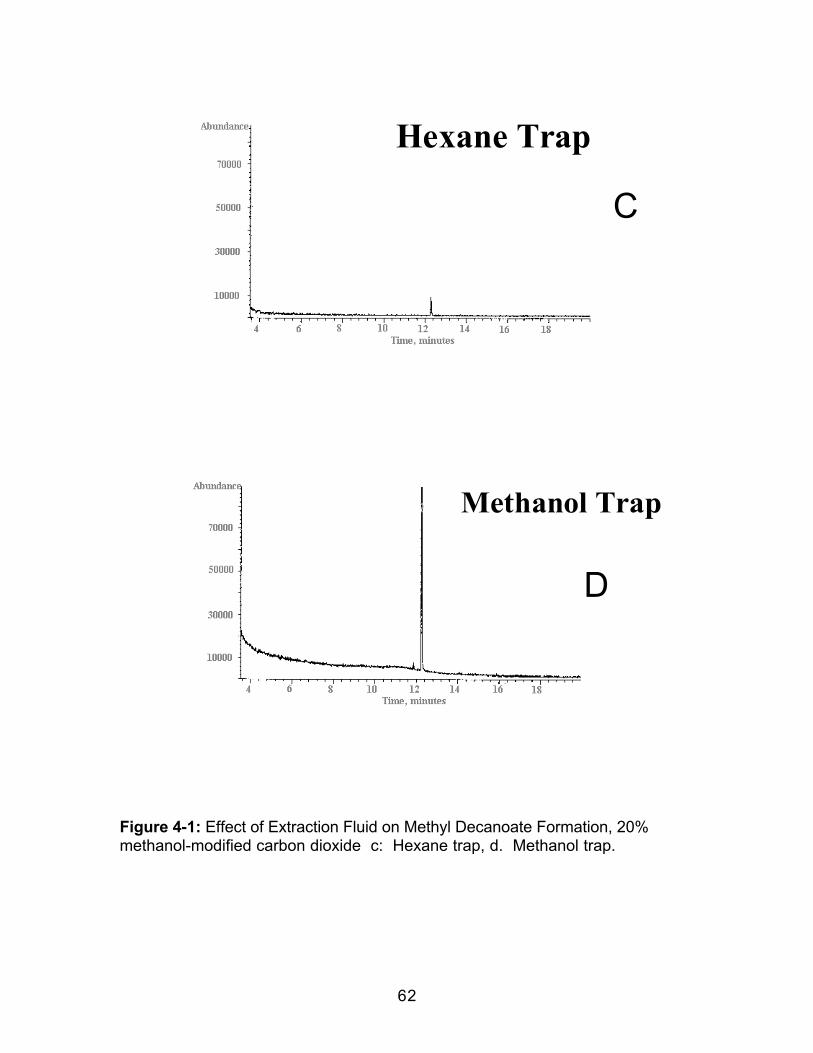
62
Figure 4-1: Effect of Extraction Fluid on Methyl Decanoate Formation, 20%methanol-modified carbon dioxide c: Hexane trap, d. Methanol trap.
Hexane Trap
Methanol Trap
C
D

63
shown in Table 4-1, indicated that there was no statistical increase or
decrease (at the 95% confidence level) in FAME formation with increasing static
time.
The clear indication at this point was that the majority of the reaction
occurred during the collection step. To accomplish the separation of FAME
formation during extraction from FAME formation during collection, subsequent
experiments involved spiking the decanoic acid into the collection vessel, thus
bypassing the extraction vessel completely. The CO2 passed into the collection
solvent after depressurization, at near atmospheric conditions.
4.2.4 Effect of Dynamic Extraction Time
In order to determine the effect of dynamic extraction time on the
formation of methyl decanoate, dynamic extraction time was varied from 0 to 60
minutes, in 15 minute increments. A small amount of methyl decanoate was
seen in the 0 minute samples, probably formed during the injection of the
trapping solvent into the gas chromatograph. The length of the blank extraction
could affect the methyl ester formation in two ways. First, the reaction could be
ongoing, and the increase in time would result in an increase in product
formed. The second effect could be based on the fact that the addition of the
carbon dioxide to the collection vessel results in a more acidic solution in the
presence of residual water, serving to catalyze the reaction. There were no
special precautions taken to remove water from either the SF carbon dioxide or
the methanol prior to use. The results of these experiments are shown in
Table 4-2 and Figure 4-2 and indicate that over the course of a 60 minute
extraction, the amount of methyl ester present is about twice that present at the
beginning of the experiment. A plot of the natural logarithm of the methyl
decanoate concentration versus time (Figure 4-2) for the suspected pseudo-
first order reversible reaction yielded a reaction rate of 0.011 min-1 or 0.69 sec-1.
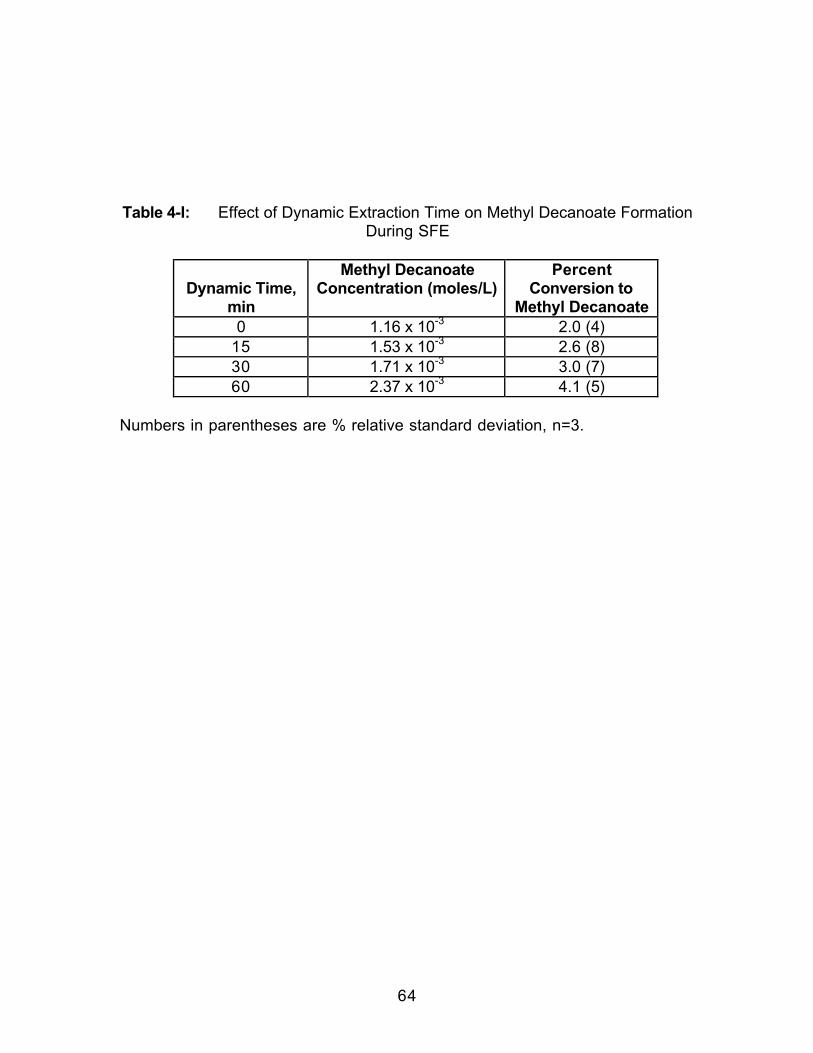
64
Table 4-I: Effect of Dynamic Extraction Time on Methyl Decanoate FormationDuring SFE
Dynamic Time,min
Methyl DecanoateConcentration (moles/L)
PercentConversion to
Methyl Decanoate0 1.16 x 10⁻³ 2.0 (4)
15 1.53 x 10⁻³ 2.6 (8)30 1.71 x 10⁻³ 3.0 (7)60 2.37 x 10⁻³ 4.1 (5)
Numbers in parentheses are % relative standard deviation, n=3.

65
Table 4-2: Effect of Dynamic Extraction Time on Methyl Decanoate FormationDuring SFE
Dynamic Time,min
Methyl DecanoateConcentration (moles/L)
PercentConversion to
Methyl Decanoate0 1.16 x 10⁻³ 2.0 (4)
15 1.53 x 10⁻³ 2.6 (8)
30 1.71 x 10⁻³ 3.0 (7)
60 2.37 x 10⁻³ 4.1 (5)
Numbers in parentheses are % relative standard deviation, n=3.

66
Figure 4-2: Formation of Methyl Decanoate During the Uncatalyzed Reaction
y = 0.0114x - 6.7139
R2 = 0.9773
-6.8
-6.7
-6.6
-6.5
-6.4
-6.3
-6.2
-6.1
-6
-5.9
0 10 20 30 40 50 60 70
Time, minutes
ln [Methyl Decanoate]

67
Determination of the methyl ester concentrations indicated that there was 2%
conversion (from acid to ester) at 0 minutes, which increased to 4.1% at 60
minutes.
4.2.5 Effect of Adding Hydrochloric Acid (HCl) to the Collection Vessel
The objectives of this experiment were to determine if it was possible to
add small amounts of the mineral acid, HCl, to the collection vessel to catalyze
the methylation reaction, and determine if the acid catalysis was more
important than a longer reaction time with the weaker acid, resulting from the
CO2 and water present. Varying amounts of HCl were added to the collection
vessel, with the dynamic extraction time being held constant at 30 minutes.
The results, shown in Table 4-3 and Figure 4-3, indicate that addition of the HCl
greatly enhanced the amount of methyl ester formed and that larger changes in
HCl concentration do not appreciably change the amount of ester formation. In
Table 4-3, the second column indicates the amount of methyl ester present
compared to a standard prepared in methanol (100 µL of 10 mg/mL decanoic
acid in methylene chloride). The third column indicates the amount of methyl
ester formed when compared with a standard prepared in a similar manner,
except that the prescribed amount of HCl was added to the standard prior to
chromatography. These columns indicate that the presence of HCl greatly
enhanced methyl ester formation, but that the dynamic extraction time had little
effect in comparison. Figure 4-3 shows the comparison of the conversion to
the methyl ester for the uncatalyzed versus catalyzed reaction, and indicates
that the reaction rate (when calculated for 0 and 30 minute data) increases
from 0.013 min-1 to 0.126 min-1, or roughly a ten-fold increase. Conversion of
the acid to the ester went from 3% for the uncatalyzed to 88% for the HCl
catalyzed reaction. It should be noted that there was no evident deterioration in
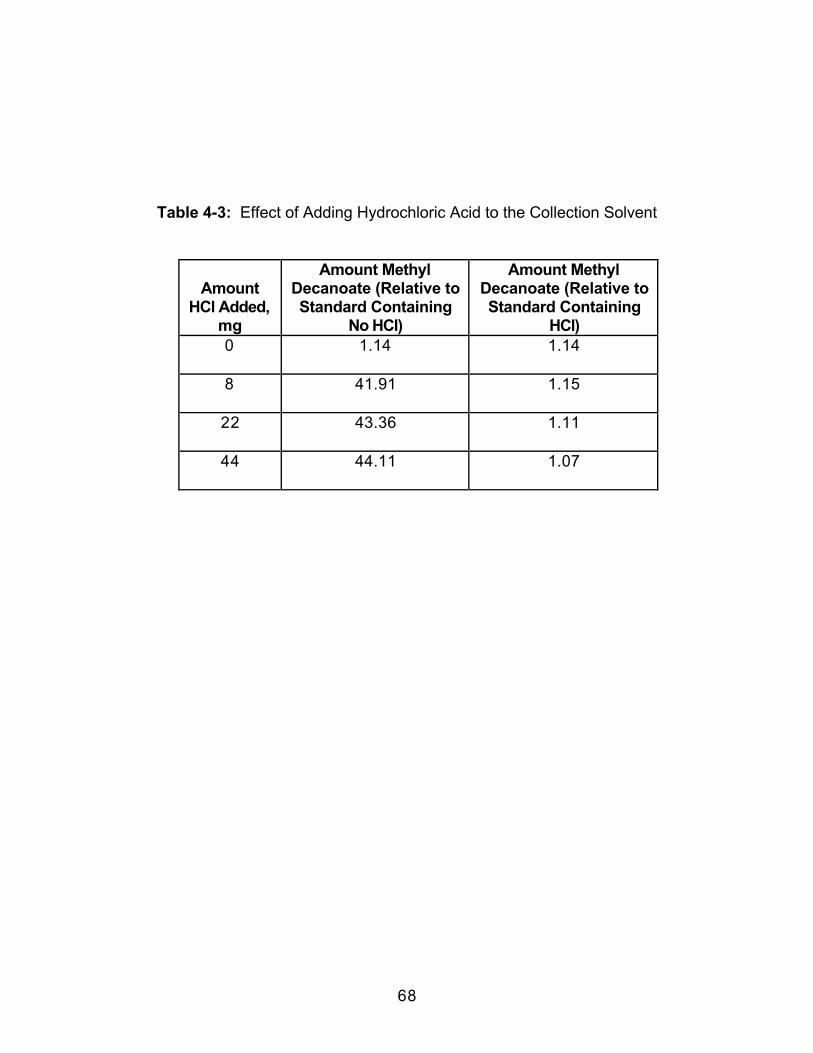
68
Table 4-3: Effect of Adding Hydrochloric Acid to the Collection Solvent
AmountHCl Added,
mg
Amount MethylDecanoate (Relative toStandard Containing
No HCl)
Amount MethylDecanoate (Relative toStandard Containing
HCl)0 1.14 1.14
8 41.91 1.15
22 43.36 1.11
44 44.11 1.07

69
Figure 4-3: Comparison of the HCl-catalyzed and Uncatalyzed Formation ofMethyl Decanoate
y = 0.1261x - 6.7593
y = 0.0129x - 6.7593
-8
-7
-6
-5
-4
-3
-2
-1
0
0 5 10 15 20 25 30 35
Time, minutes
ln [Methyl Decanoate]
uncatalyzed
HCl catalyzed
Linear (HClcatalyzed)
Linear(uncatalyzed)
70
the chromatographic column when injecting the acid containing samples,
though only a limited number of injections were made.
4.2.6 Effect of Collection Temperature
The last collection variable to be investigated was the collection
temperature. The objective of this experiment was to determine if an increase
in collection temperature would result in an increase in conversion to the
methyl ester. Table 4-4 shows the results for this experiment, which indicate
that the effect of collection temperature is difficult to discern. Though it appears
that the amount of methyl ester decreased with increasing temperature (2nd
column), the amount of fatty acid also decreased (3rd column), which indicated
that the fatty acid was somehow being lost in the reaction. The methyl
ester/acid ratio (4th column) indicated a greater amount of methyl ester was
present for the amount of acid present. Though these ratios are based in part
on the fatty acid determinations, which have a large amount of error due to
quantitative chromatographic problems, they do show a clear trend toward
increasing conversion at higher collection temperature. It is quite possible that
the methyl ester was being preferentially lost at the higher collection
temperatures, due to its increased volatility.
4.3 Conclusions
The objective of this work was to investigate the methylation of
decanoic acid occurring during the supercritical fluid extraction process. The
methylation was found to occur primarily during the collection process and was
greatly enhanced (reaction rate increased almost ten-fold) by the presence of
an acid catalyst (i.e. additional to any carbonic acid formed from the CO2 and
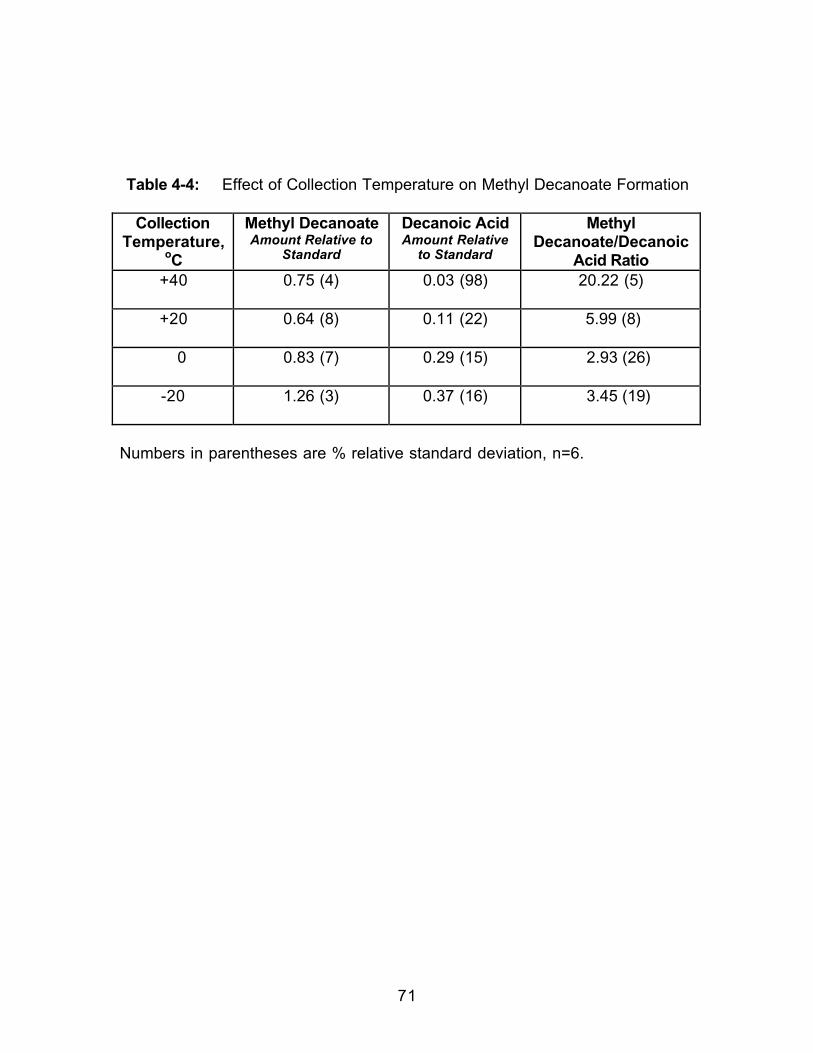
71
Table 4-4: Effect of Collection Temperature on Methyl Decanoate Formation
CollectionTemperature,
oC
Methyl DecanoateAmount Relative to
Standard
Decanoic AcidAmount Relative
to Standard
MethylDecanoate/Decanoic
Acid Ratio+40 0.75 (4) 0.03 (98) 20.22 (5)
+20 0.64 (8) 0.11 (22) 5.99 (8)
0 0.83 (7) 0.29 (15) 2.93 (26)
-20 1.26 (3) 0.37 (16) 3.45 (19)
Numbers in parentheses are % relative standard deviation, n=6.

72
residual water.) Increasing reaction time and collection temperature also
increased the conversion rate to the methyl ester, but very little in comparison to
the catalyzed reaction. This work indicates that extraction and derivatization can
be performed simultaneously for subsequent chromatographic analysis.
In the following Chapter the knowledge acquired from the previous three
chapters will be used to develop a method for the determination of extractable
material in wood pulp samples. The collection solvent will be chosen not only
for its ability to enhance collection efficiencies, but to allow methylation to occur
during collection. Additionally, two in-situ (within the SFE cell) derivatization
reactions will be investigated.
73
CHAPTER FIVE
SUPERCRITICAL FLUID EXTRACTION OF WOOD PULPWITH ANALYSIS BY CAPILLARY GAS
CHROMATOGRAPHY-MASS SPECTROMETRY
5.0 Introduction
Wood pulp is an important raw material used in the manufacture of
many economically important products, including paper and paper products,
cellulose nitrate and cellulose acetate. The amount of extractive material
remaining after the pulping and bleaching processes may influence additional
processing of the pulp, or be of health or environmental concern. Extractives
are commonly defined as the material that can be removed from the pulp or
paper sample by a particular solvent system during Soxhlet extraction.
The purpose of most of the extractives produced by a tree is to provide
protection from predators that wish to consume the structural components of
the cell wall48. The amounts and types of extractives produced are quite
variable within individual species, and are also site specific. Because they
appear to have no metabolic function in a tree, they are classified as secondary
metabolites, and were, until recently, considered to be waste products of the
plants’ metabolism. Extractives are most concentrated in the bark of the tree,
which is removed prior to pulping, and fall into the categories of volatile oils,
48 Wood Chemistry: Fundamentals and Applications; E. Sjostrom; Academic Press; NewYork; (1993) 2nd Edition.

74
wood resins, fats and waxes, tannins, lignins, and carbohydrates. The recovery
of wood extractives for further use is, therefore, in itself a lucrative industry49.
However, extractive material present in the debarked, soaked and
chipped wood can be detrimental during the pulping process. It can cause
excessive chemical consumption, pitch problems, and pulp yellowing50.
Additionally, after pulping, these extractives may influence the processing of the
cellulose or cellulose derivatives in a subsequent manufacturing process.
Because of the ability of the extractives to influence cellulose or cellulose
derivative processing, extractive content is commonly determined. The current
TAPPI (Technical Association of the Pulp and Paper Industry) method involves
Soxhlet extraction of the pulp sample with either methylene chloride, 2:1
benzene/ethanol, or 2:1 toluene/ethanol. The sample is air-dried prior to
extraction, extracted for not less than 24 solvent cycles over a four to five hour
period, transferred to a tared weighing dish, and the solvent removed by
heating. The weighing dish is dried in a 110oC oven and the extractive matter is
taken as the weight gain of the dish after correction for the blank51.
Supercritical fluid extraction (SFE) presents an attractive alternative to
Soxhlet extractions for many reasons52. SFE is commonly performed with
carbon dioxide, a relatively inert and nontoxic solvent. Since the solvating
power (density) of the fluid can be changed as a function of pressure and
temperature, the extraction can be fine-tuned to selectively extract certain
analytes while leaving others behind. The solvating power of the fluid can then
be increased to remove the remaining analytes. Because of the higher
diffusivity (faster mass transfer) of a supercritical fluid compared to a liquid,
extraction rates are generally much higher than with corresponding liquid/solid
49 Handbook for Pulp and Paper Technologists; G. A. Smook; Angus Wilde Publications;Vancouver; (1992); 2nd Edition.50 Handbook of Pulping and Papermaking; C. J. Biermann; Academic Press; New York;(1996).51 Tappi Test Methods, Volume 1 (1989) Method T204 om-88.52 S. B. Hawthorne, Anal. Chem., 62 (1990) 633a-642a.
75
extractions. One of the more important advantages to using carbon dioxide for
SFE is that removal of extraction solvent and waste disposal are neither a
major problem or expense.
Various articles can be found in the literature in which supercritical fluids
were used in the liquefaction of wood53,54,55 and of the use of SFE to determine
extractives in wood, pulp, paper and pitch56-60. McDonald et al.56 used
supercritical acetone and methanol to convert wood to liquid fuels, and found a
maximum yield of 74%. They also were able to extract resin and fatty acids
from southern pine and waxes from Douglas Fir bark using either supercritical
carbon dioxide, nitrous oxide, propane, or ethylene. They found that propane
and nitrous oxide produced higher yields than the other fluids studied.
Demirbas57 found that extraction of beech wood samples with supercritical
acetone gave approximately four times greater extracted masses than Soxhlet
extraction with the same solvent. Fatty acids were analyzed and linoleic acid
was found to be the major constituent in both extracts.
Lee et al.58 investigated the extraction of chlorinated phenolics in
sediments collected downstream of a chlorine-bleaching mill using carbon
dioxide with an in-situ derivatization process. They found that under moderate
extraction conditions the SFE-derivatization method gave comparable results to
conventional techniques, with great time and solvent savings. Lee and Peart 59
developed an SFE method using supercritical CO2 for the extraction of resin
and fatty acids from sediments downstream from pulp mills that provided
recoveries equal to or greater than Soxhlet extraction, again with great savings
in time and solvent consumption. Sequeira and Taylor60 also found SFE to be a
53 J. Jezko and J. Howard, Can. Bioenergy R&D Semin. 398 (1984).54 C. McDonald, B. Bennett, and J. Howard, Can. Bioenergy R&D Semin., 393 (1984).55 T. Reyes, S. Bandyopadhyay and B. McCoy, J. of Supercritical Fluids, 2 (1989) 80.56 C. McDonald, J. Howard, and B. Bennett, Fluid Phase Equilibria, 10 (1983) 337.57 A. Demirbas, Wood Sci. Technol., 25 (1991) 365.58 H. Lee, T. E. Peart, and R. L. Hong-You, J. Chromatogr., 636 (1993) 263.59 H. Lee and T. Peart, J. Chromatogr., 594 (1992) 309.60 A. Sequeira and L. T. Taylor, J. Chromatogr. Sci., 30 (1992) 405.
76
comparable sample preparation technique for the analysis of several bleached
wood pulps that had been treated by different methods.
The objectives of this work were to compare the amount and type of
materials extracted via SFE with those obtained from a standard Soxhlet
extraction with methylene chloride. In addition, the extracted material was to be
separated (chromatographed) and as many extracted components as possible
identified by capillary gas chromatography/mass spectrometry. A comparison
of off-line and in-situ methylation reactions and determination of acetylation
products was to be performed. Certain identified components were then to be
quantified by an internal standard method.
5.1 Experimental
5.1.1 Sample Preparation
The wood pulp samples were received from Buckeye Cellulose
Corporation (Memphis, TN) as sheets wrapped in aluminum foil inside a kraft
envelope. (Earlier extractions had determined that storing the samples in
plastic bags resulted in contamination of the extracts with plasticizers (esters of
adipic and phthalic acids) from the plastic.) Two methods of sample
preparation were used. In the first method, sheets of wood pulp were cut into
strips approximately 0.5 x 3 cm using scissors previously washed in HPLC
grade methanol and methylene chloride (EM Science, Gibbstown, NJ). In the
second method, the wood pulp was cut into small pieces (~1 cm2) which were
then ground to the consistency of a cotton ball in a Mr. Coffee (Deerfield, IL)
Model IDS-50 coffee mill. In either case, care was taken to avoid contamination
of the pulp sample with any skin oils by wearing gloves. The strips or ground
samples were then thoroughly mixed.
77
5.1.2 Standards Preparation
For quantitative determinations, a stock caffeine (Sigma Chemical Co.,
St. Louis, MO) internal standard solution containing 320 mg in 100 mL
methylene chloride was prepared. Fatty acid, fatty acid methyl ester (FAME), and
alkane standards were obtained from PolyScience (Niles, IL). Multicomponent
standard mixtures were dissolved in 50/50 methylene chloride/methanol.
5.1.3 Soxhlet Extraction
A sample containing approximately 10 g of wood pulp was placed in a
glass thimble equipped with a fritted disk, after which the thimble was placed in
the Soxhlet extractor. The round bottom extraction flask was filled with 200 mL
of methylene chloride, and extraction at the boiling point was allowed to
proceed for 24 hours. The extraction flask was then fitted on a Kuderna-Danish
concentrator (Supelco, Bellefonte, PA). The extractor was then rinsed into the
concentrator with an additional 25 mL of solvent. The concentrator was kept in
a water bath until the solvent volume was less than 1 mL. For quantitative
determinations, 100 µL of a stock 320 µg/mL caffeine internal standard was
added to the concentrated extract solution and the total volume subsequently
was adjusted to approximately 1 mL. Blank determinations were performed
using an empty extraction thimble and identical extraction procedures.
5.1.4 Supercritical Fluid Extraction (Liquid Trapping)
Approximately 3.5 g of wood pulp were placed into each of three 10 mL
high temperature crystalline polymer extraction thimbles (ISCO, Lincoln, NE).
All extractions were performed with an ISCO SFX 3560 dual syringe pump
78
system. Extraction fluids were composed of SFE Grade Carbon Dioxide (Air
Products and Chemicals Inc., Allentown, PA) and CO2 modified with HPLC
grade methanol. The modified CO2 was prepared by addition of methanol to
liquid CO2 by volume percentage, with mixing and equilibration occurring
downstream, prior to the extraction thimble. All extractions were performed at
80oC and 516 bar (density = ~0.89 g/mL for 100% CO2; ~0.90 g/mL for 10%
methanol modified CO2; ~0.90 g/mL for 20% methanol modified CO2), with an
electronically controlled automatic variable restrictor temperature at 80oC. The
flow rate was 1.5 mL/min (liquid flow measured at the pump) and the time of
extraction was 20 min, unless otherwise stated. The extracted components
were collected in 10 mL of 50/50 HPLC grade methylene chloride/methanol
contained in an ISCO pressure resistant collection vial fitted with a cap and
Teflon septa. The vial was pressurized with an additional approximately 30 psi
of CO2. In addition, a solvent replenishment routine to replace collection
solvent lost during trapping of the extract was available and used as noted.
The solvent volume was reduced in a warm water bath to approximately 1 mL
and 100 µL of the internal standard solution was added prior to analysis by
GC/MS.
5.1.5 Supercritical Fluid Extraction (Tandem Trapping)
Approximately 10 g of wood pulp were placed into a 50 mL stainless
steel extraction vessel. All extractions were performed with an ISCO/Suprex
Prepmaster supercritical fluid extractor (ISCO, Lincoln, NE). The extraction
fluid was composed of SFE Grade Carbon Dioxide (Air Products and
Chemicals Inc., Allentown, PA) modified with HPLC grade methanol. The 95/5
methanol modified CO2 was prepared by addition of methanol by volume
percentage (of liquid), with mixing and equilibration occurring downstream,
prior to the extraction vessel. All extractions were performed at 80oC and 450
79
atm with an electronically controlled automatic variable restrictor temperature of
80oC. The flow rate was 2.0 mL/min (liquid flow measured at the pumps) and
the static time was 30 min, followed by a 45 min dynamic extraction. The
extracted components were collected on an ODS solid phase trap, held at 40oC
during the course of the extraction. The trap temperature was held at 25oC as 8
mL of 50/50 HPLC grade methylene chloride/methanol was used to rinse the
trap. A second (tandem) trap containing 5 mL of methanol at room temperature
was also used. The trap rinse and tandem trap liquid were combined prior to
concentrating the extract. The solvent volume was reduced in a warm water
bath to approximately 5 mL for the hardwood samples and 2 mL for the
softwood samples. Internal standard solution (100 µL) was added prior to
each analysis by GC/MS.
5.1.6 Derivatizations
Wood pulp extracts containing free fatty acids were derivatized using
14% BF3 in methanol obtained from Alltech Associates (Naperville, IL) to form
methyl esters. Acetic anhydride and pyridine, both obtained from Alltech, were
used for acetylation of hydroxy acids. For in-situ methylations when liquid
trapping was performed, 60 µL of the BF3/methanol solution was added directly
to each extraction thimble immediately prior to extraction. Approximately 20 µL
was placed at the top, bottom, and middle of the wood pulp sample in each
extraction thimble. For in-situ methylations when tandem trapping was
performed, 1-1.5 mL of the BF3/methanol solution was added directly to each
extraction thimble immediately prior to extraction, again distributed evenly
throughout the sample. For in-situ acetylations 60 µL of acetic anhydride and
120 µL of pyridine were added to each extraction thimble, in the same fashion
as the BF3/methanol, except where noted. Acetylations were only conducted
80
when using liquid trapping. For off-line methylations, the esters were formed
using 5 mL of the BF3/methanol reagent, with the products then being extracted
into OPTIMA grade hexane (Fisher Scientific, Fairlawn, NJ) for GC/MS analysis.
The off-line acetylations were carried out upon the previously esterified
samples using 10 mL of pyridine followed by 5 mL of acetic anhydride. The
products of these reactions were also extracted into hexane prior to GC/MS.
5.1.7 Gas Chromatography
All extracts were analyzed using a Hewlett Packard (Little Falls, DE) HP
5890 Series II GC equipped with a split/splitless capillary column inlet system,
which was maintained at 280oC. A 30 m, 0.25 mm i.d., 0.25 µm df DB-5-MS (J
& W Scientific, Folsom, CA) fused silica capillary column was used for the
separation. Mass spectra were obtained by directly interfacing the GC with a
HP 5972 (Hewlett Packard) mass selective detector (MSD). Grade 5.0 helium
(BOC, Murray Hill, NJ) was used as the carrier gas and the transfer line was
maintained at 280oC. The temperature program employed contained a 3 min
initial temperature of 60oC, followed by a ramp of 10oC/min to a final
temperature of 300oC, which was maintained for 10 min. For all of the extracts,
1 µL was injected using a HP 7673 (Hewlett Packard) automatic injector in the
splitless mode. The mass spectra were obtained by electron impact (EI)
ionization at 70 eV. The ion source temperature was set at 280oC and the
masses scanned were from 30 to 550 amu. All data were analyzed using a
Hewlett Packard ChemStation equipped with the Wiley library of mass spectral
data.
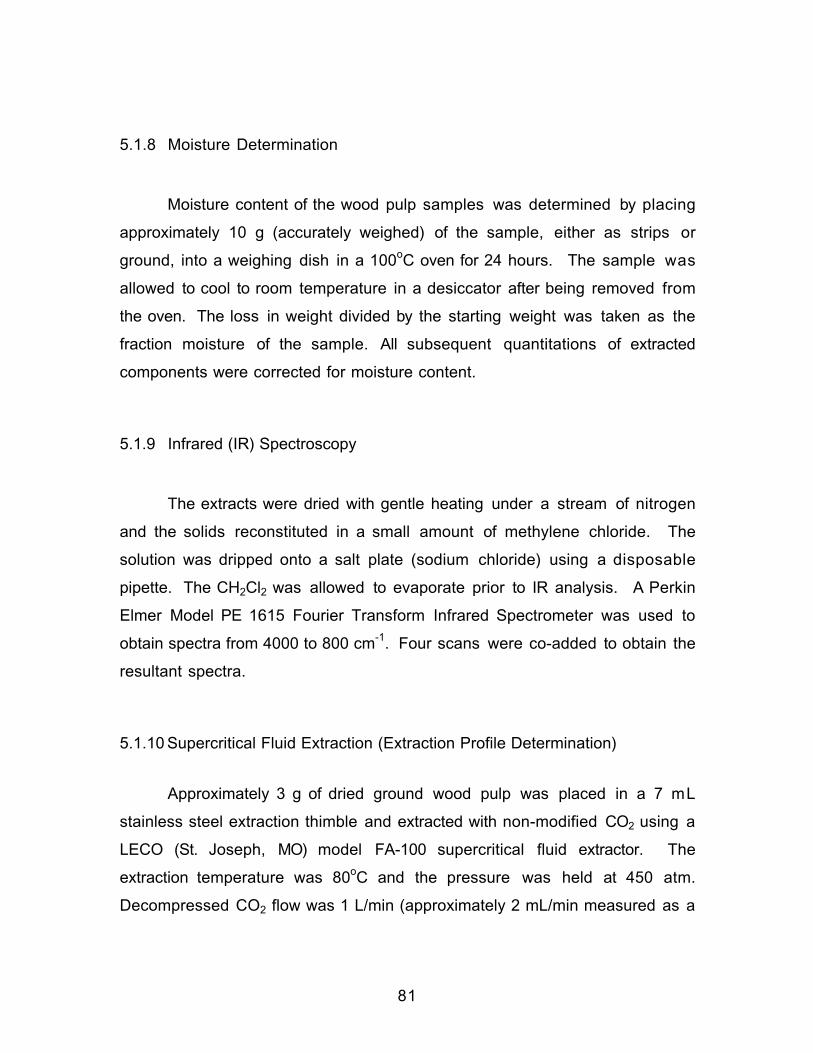
81
5.1.8 Moisture Determination
Moisture content of the wood pulp samples was determined by placing
approximately 10 g (accurately weighed) of the sample, either as strips or
ground, into a weighing dish in a 100oC oven for 24 hours. The sample was
allowed to cool to room temperature in a desiccator after being removed from
the oven. The loss in weight divided by the starting weight was taken as the
fraction moisture of the sample. All subsequent quantitations of extracted
components were corrected for moisture content.
5.1.9 Infrared (IR) Spectroscopy
The extracts were dried with gentle heating under a stream of nitrogen
and the solids reconstituted in a small amount of methylene chloride. The
solution was dripped onto a salt plate (sodium chloride) using a disposable
pipette. The CH2Cl2 was allowed to evaporate prior to IR analysis. A Perkin
Elmer Model PE 1615 Fourier Transform Infrared Spectrometer was used to
obtain spectra from 4000 to 800 cm-1. Four scans were co-added to obtain the
resultant spectra.
5.1.10 Supercritical Fluid Extraction (Extraction Profile Determination)
Approximately 3 g of dried ground wood pulp was placed in a 7 mL
stainless steel extraction thimble and extracted with non-modified CO2 using a
LECO (St. Joseph, MO) model FA-100 supercritical fluid extractor. The
extraction temperature was 80oC and the pressure was held at 450 atm.
Decompressed CO2 flow was 1 L/min (approximately 2 mL/min measured as a

82
liquid) and dynamic extraction time was 15 minutes. The restrictor temperature
was 110oC, and the extracted material was trapped onto glass wool in a
preweighed collection vial. This instrument was designed for gravimetric fat
determinations, and results were automatically reported as percent extracted
based on the weight gain of the collection vial.
5.2 Results and Discussion
5.2.1 Determination Of Optimum Extraction Conditions
In the initial phase of this study the objective was to qualitatively
determine if SFE presented a viable alternative to Soxhlet extraction with
CH2Cl2, and if so, what extraction parameters would allow for maximum
removal of extractives. A 48 hour Soxhlet extraction was used as a basis for
comparison, as shown in Figure 5-1a. Figure 5-1b and Figure 5-2b present the
results from a 30 mL extraction (20 min at 1.5 mL/min) with pure CO2, and
Figure 5-2c shows a second 30 mL extraction of the same (previously
extracted by SFE with 100% CO2) sample with 10% methanol modified CO2.
Figure 5-2d is a subsequent extraction of the same sample (extracted with 30
mL 100% CO2 and 30 mL 10% methanol modified CO2) with an additional 30
mL of 20% methanol modified CO2. The purpose of these series of extractions
was to determine what differences exist in the nature of the analytes extracted
by Soxhlet extraction with methylene chloride and those extracted by modified or
non-modified CO2. From examination of the total ion chromatograms, it can be
seen that the Soxhlet extraction appeared to extract more earlier eluting
material than the SFE and that some late eluting peaks (around 23-26 min)
appeared in the Soxhlet extract, but not in any of the SFEs. It is also obvious
that increasing the methanol modifier concentration does not allow the
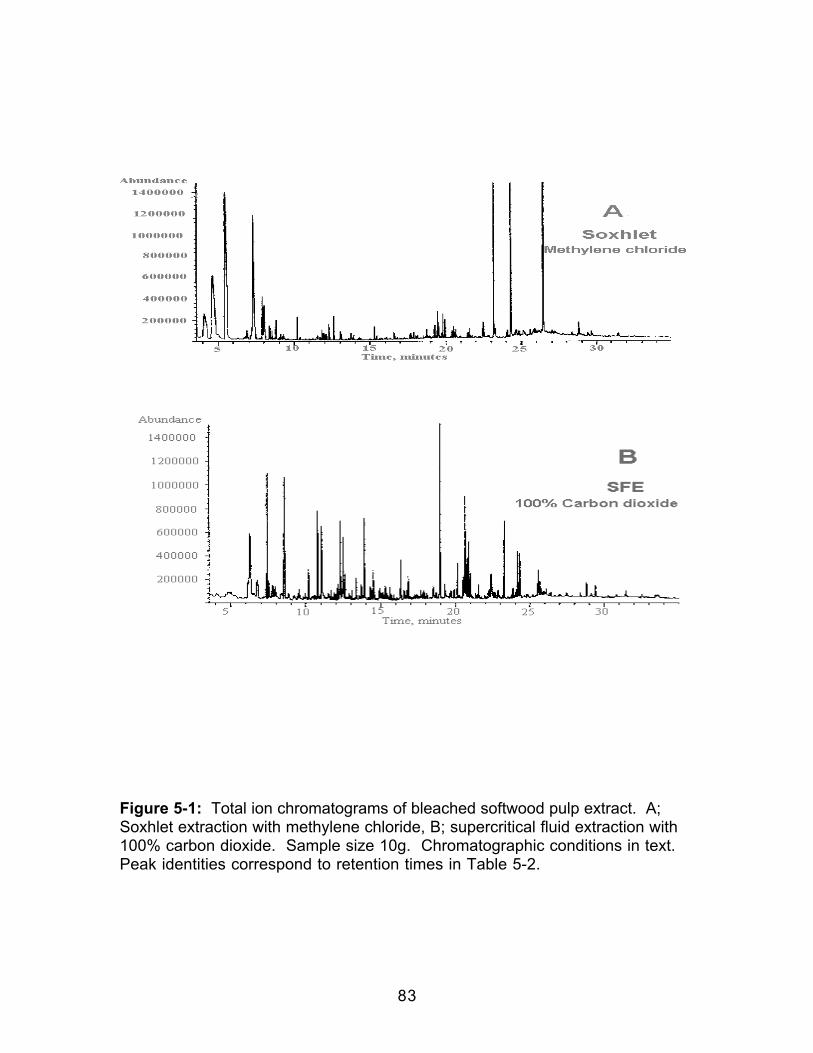
83
Figure 5-1: Total ion chromatograms of bleached softwood pulp extract. A;Soxhlet extraction with methylene chloride, B; supercritical fluid extraction with100% carbon dioxide. Sample size 10g. Chromatographic conditions in text.Peak identities correspond to retention times in Table 5-2.
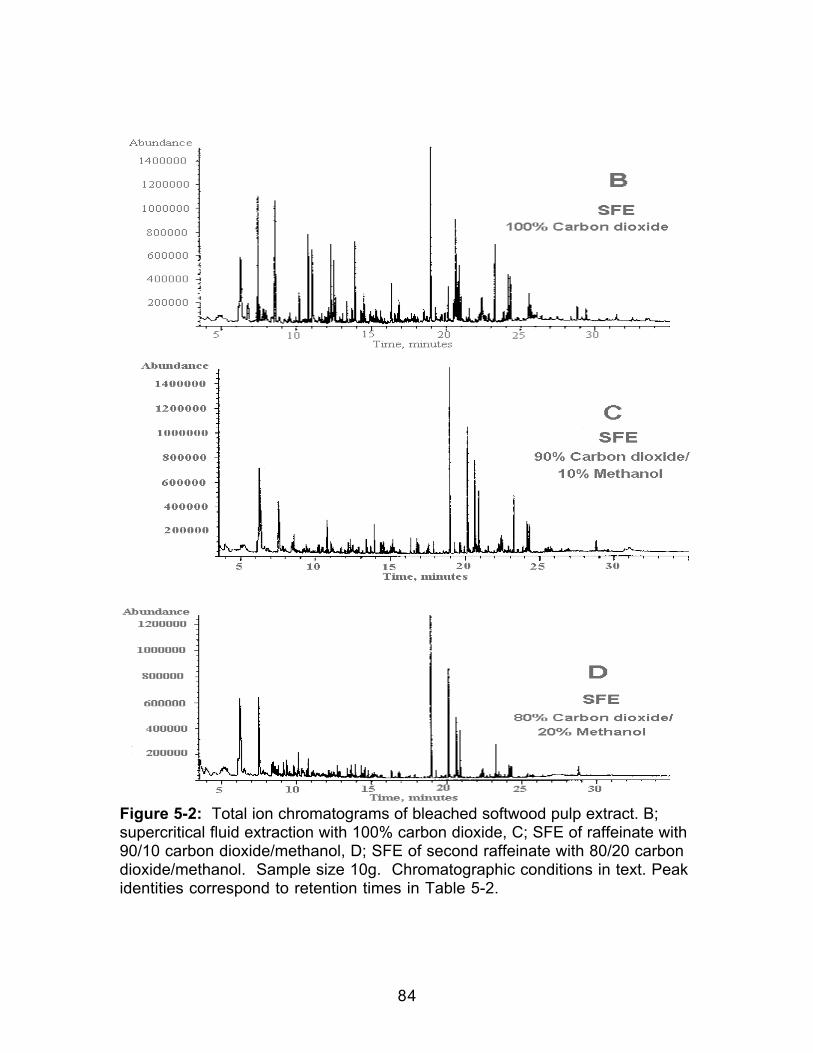
84
Figure 5-2: Total ion chromatograms of bleached softwood pulp extract. B;supercritical fluid extraction with 100% carbon dioxide, C; SFE of raffeinate with90/10 carbon dioxide/methanol, D; SFE of second raffeinate with 80/20 carbondioxide/methanol. Sample size 10g. Chromatographic conditions in text. Peakidentities correspond to retention times in Table 5-2.
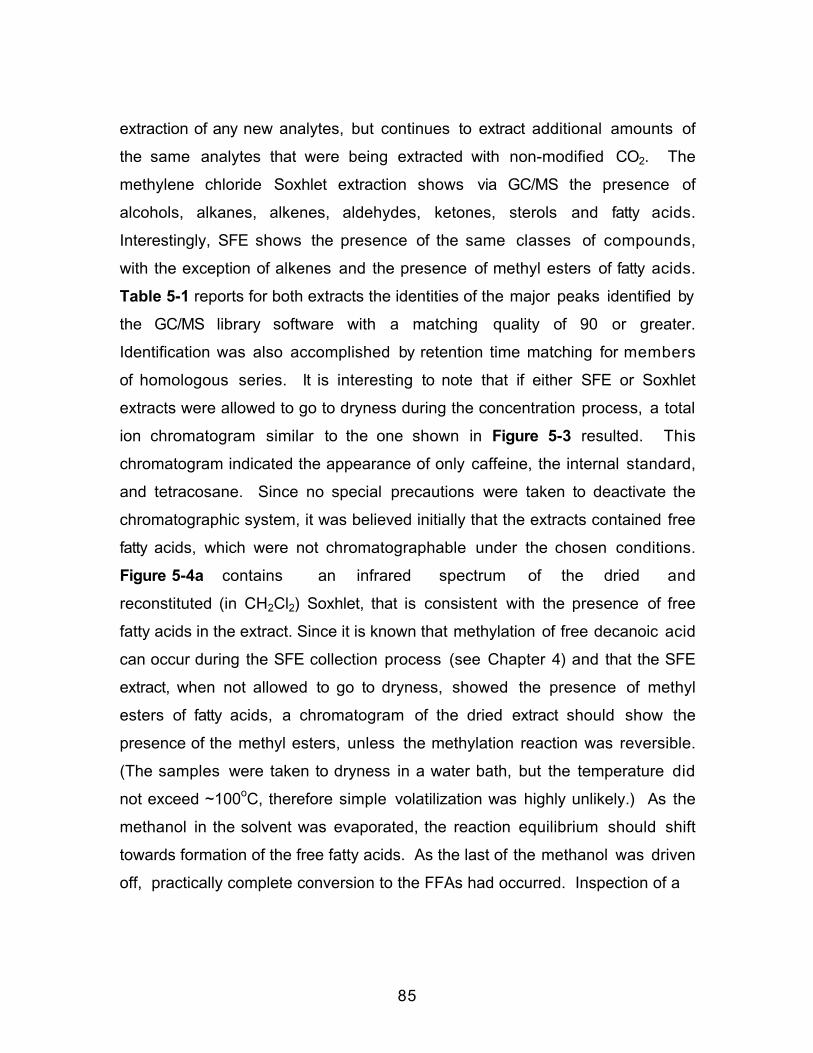
85
extraction of any new analytes, but continues to extract additional amounts of
the same analytes that were being extracted with non-modified CO2. The
methylene chloride Soxhlet extraction shows via GC/MS the presence of
alcohols, alkanes, alkenes, aldehydes, ketones, sterols and fatty acids.
Interestingly, SFE shows the presence of the same classes of compounds,
with the exception of alkenes and the presence of methyl esters of fatty acids.
Table 5-1 reports for both extracts the identities of the major peaks identified by
the GC/MS library software with a matching quality of 90 or greater.
Identification was also accomplished by retention time matching for members
of homologous series. It is interesting to note that if either SFE or Soxhlet
extracts were allowed to go to dryness during the concentration process, a total
ion chromatogram similar to the one shown in Figure 5-3 resulted. This
chromatogram indicated the appearance of only caffeine, the internal standard,
and tetracosane. Since no special precautions were taken to deactivate the
chromatographic system, it was believed initially that the extracts contained free
fatty acids, which were not chromatographable under the chosen conditions.
Figure 5-4a contains an infrared spectrum of the dried and
reconstituted (in CH2Cl2) Soxhlet, that is consistent with the presence of free
fatty acids in the extract. Since it is known that methylation of free decanoic acid
can occur during the SFE collection process (see Chapter 4) and that the SFE
extract, when not allowed to go to dryness, showed the presence of methyl
esters of fatty acids, a chromatogram of the dried extract should show the
presence of the methyl esters, unless the methylation reaction was reversible.
(The samples were taken to dryness in a water bath, but the temperature did
not exceed ~100oC, therefore simple volatilization was highly unlikely.) As the
methanol in the solvent was evaporated, the reaction equilibrium should shift
towards formation of the free fatty acids. As the last of the methanol was driven
off, practically complete conversion to the FFAs had occurred. Inspection of a
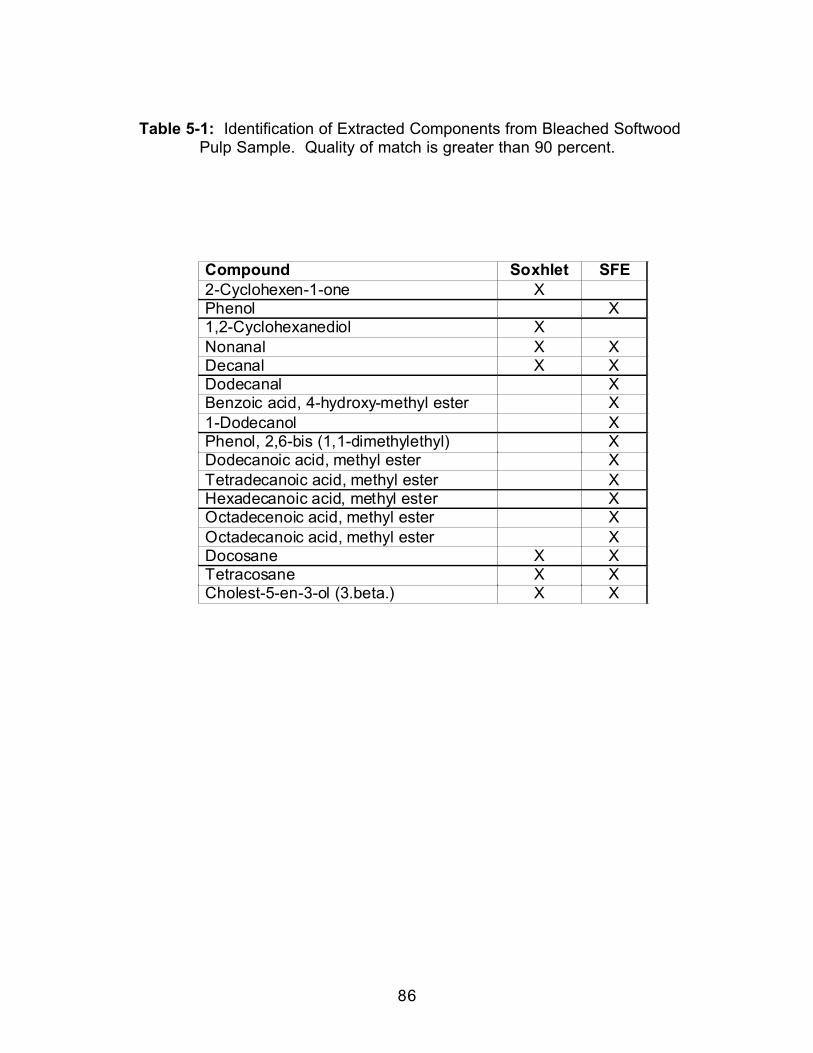
86
Table 5-1: Identification of Extracted Components from Bleached SoftwoodPulp Sample. Quality of match is greater than 90 percent.
Compound Soxhlet SFE2-Cyclohexen-1-one XPhenol X1,2-Cyclohexanediol XNonanal X XDecanal X XDodecanal XBenzoic acid, 4-hydroxy-methyl ester X1-Dodecanol XPhenol, 2,6-bis (1,1-dimethylethyl) XDodecanoic acid, methyl ester XTetradecanoic acid, methyl ester XHexadecanoic acid, methyl ester XOctadecenoic acid, methyl ester XOctadecanoic acid, methyl ester XDocosane X XTetracosane X XCholest-5-en-3-ol (3.beta.) X X
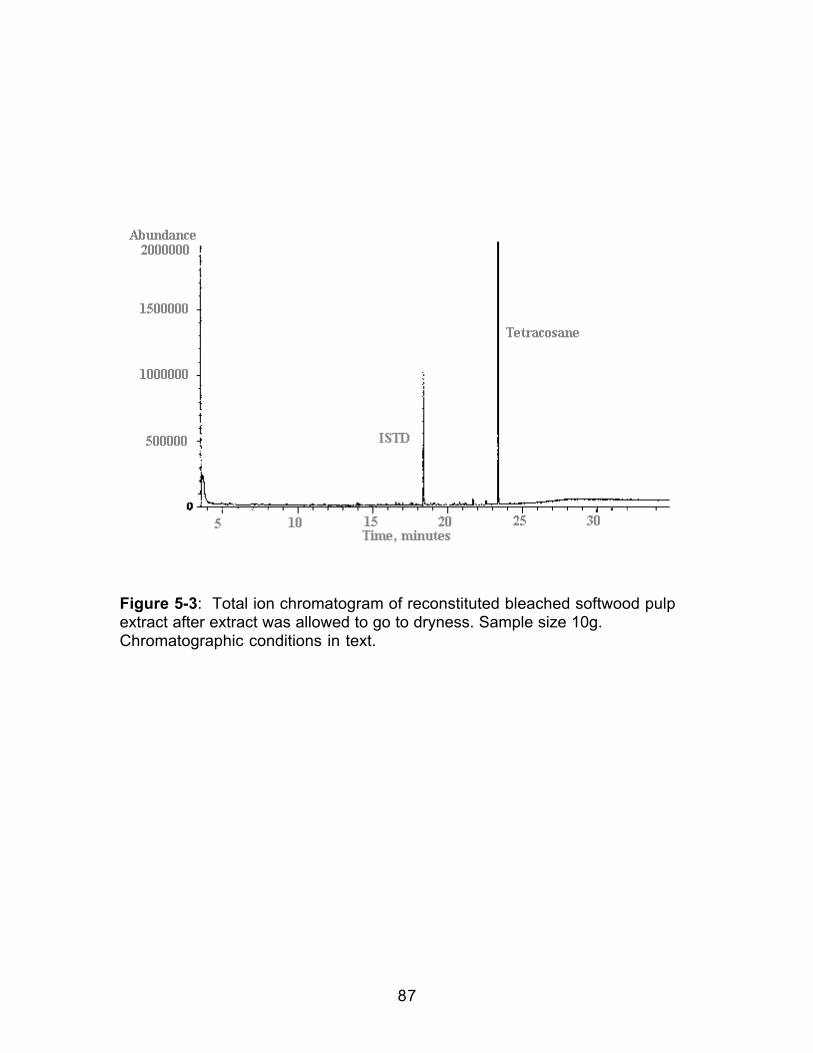
87
Figure 5-3: Total ion chromatogram of reconstituted bleached softwood pulpextract after extract was allowed to go to dryness. Sample size 10g.Chromatographic conditions in text.
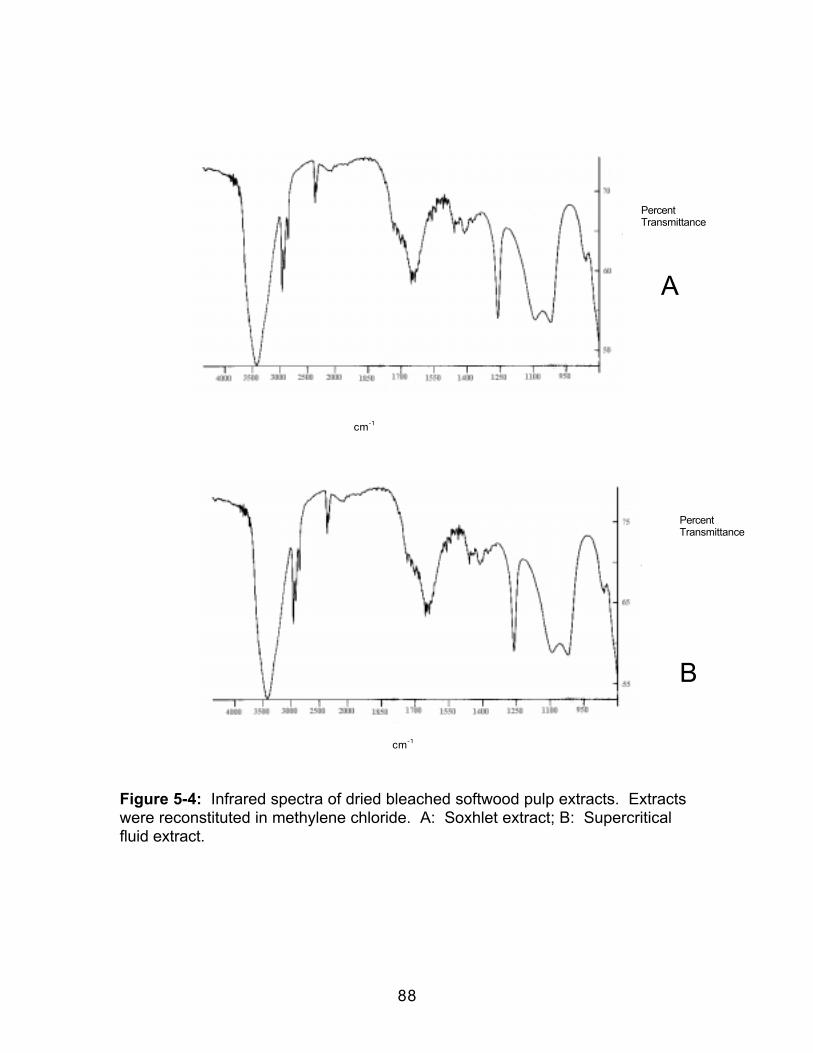
88
Figure 5-4: Infrared spectra of dried bleached softwood pulp extracts. Extractswere reconstituted in methylene chloride. A: Soxhlet extract; B: Supercriticalfluid extract.
PercentTransmittance
cm-1
A
PercentTransmittance
B
cm-1
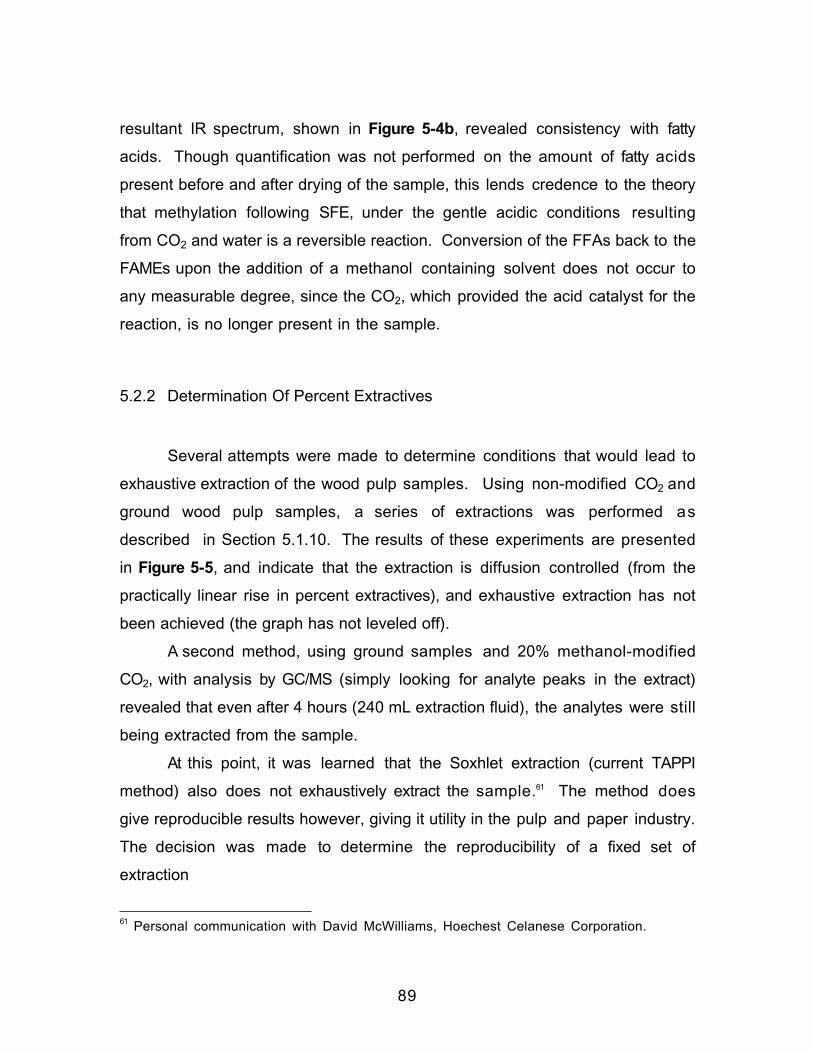
89
resultant IR spectrum, shown in Figure 5-4b, revealed consistency with fatty
acids. Though quantification was not performed on the amount of fatty acids
present before and after drying of the sample, this lends credence to the theory
that methylation following SFE, under the gentle acidic conditions resulting
from CO2 and water is a reversible reaction. Conversion of the FFAs back to the
FAMEs upon the addition of a methanol containing solvent does not occur to
any measurable degree, since the CO2, which provided the acid catalyst for the
reaction, is no longer present in the sample.
5.2.2 Determination Of Percent Extractives
Several attempts were made to determine conditions that would lead to
exhaustive extraction of the wood pulp samples. Using non-modified CO2 and
ground wood pulp samples, a series of extractions was performed as
described in Section 5.1.10. The results of these experiments are presented
in Figure 5-5, and indicate that the extraction is diffusion controlled (from the
practically linear rise in percent extractives), and exhaustive extraction has not
been achieved (the graph has not leveled off).
A second method, using ground samples and 20% methanol-modified
CO2, with analysis by GC/MS (simply looking for analyte peaks in the extract)
revealed that even after 4 hours (240 mL extraction fluid), the analytes were still
being extracted from the sample.
At this point, it was learned that the Soxhlet extraction (current TAPPI
method) also does not exhaustively extract the sample.61 The method does
give reproducible results however, giving it utility in the pulp and paper industry.
The decision was made to determine the reproducibility of a fixed set of
extraction
61 Personal communication with David McWilliams, Hoechest Celanese Corporation.

90
Figure 5-5: Gravimetric extraction profile of a bleached softwood pulp sample.Each extraction was 15 minutes. Decompressed CO2 flow was 1 L/min.Percent extracted was based on the weight gain of the collection vial comparedto sample weight.
0.00
0.05
0.10
0.15
0.20
0.25
0.30
0 2 4 6 8 10
Number of Extractions
Cum
ulat
ive
Ave
rage
Wei
ght
Per
cent
of
Sam
ple
Ext
ract
ed

91
conditions, to determine if SFE would be a viable alternative to the Soxhlet
method. This was accomplished by determining the weight lost during
extraction of a previously dried sample. The results of these analyses indicate
for 6 determinations, an average of 1.26% by weight on a dry basis (3.2% RSD)
was extracted from the softwood sample used for method development.
Though the data obtained were reproducible, it was approximately 100 times
higher than the
values reported when using the TAPPI method (0.01%). The task at this point
then became to identify the extracted components and quantitate as much as
possible in an attempt to determine a mass balance with the weight lost upon
extraction.
5.2.3 Identification of Extracted Components
After the extractions described in Section 5.2.1 were performed, only a
limited number of components (Table 5-1) were identified with a 90% or
greater quality of match by the GC/MS identification algorithm. However, many
more compounds eluted from the chromatographic column, as was evident
after inspection of the chromatograms in Figures 5-1 and 5-2. Extensive
searching of the mass spectral library tentatively identified many more
components, with lesser qualities of match. (The mass spectrometer software
used a standard tuning file, which rates all mass ranges fairly equally when
comparing to standard spectra.62 ) The results of these tentative identifications,
when the quality of the library match was greater than 40, are presented in
Table 5-2. Though the actual identities of the extracted compounds may be
incorrect, the chemical class (aldehyde, ketone, etc.) is usually reliable.
62 Hewlett Packard 5971 MS ChemStation G1034 Version C.01.05, Hewlett Packard Co.,1989-93.


![Review Analytical-scale supercritical fluid extraction: a ...quimica.udea.edu.co/~carlopez/cromatogc/sfe polluntants... · Analytical-scale supercritical fluid extraction ... [lo],](https://img.pdfslide.us/doc/110x75/5ab139fa7f8b9a6b468c4025/review-analytical-scale-supercritical-fluid-extraction-a-carlopezcromatogcsfe.jpg)