Embed Size (px)
Citation preview

See discussions, stats, and author profiles for this publication at: https://www.researchgate.net/publication/273766524
Investigation of installation damage of some geogrids using laboratory
tests
Article in Geosynthetics International · February 2006
CITATIONS
8
READS
82
2 authors, including:
Some of the authors of this publication are also working on these related projects:
Dynamic behavior of reinforced soil walls using shaking table tests View project
Ching-Chuan Huang
National Cheng Kung University
80 PUBLICATIONS 1,387 CITATIONS
SEE PROFILE
All content following this page was uploaded by Ching-Chuan Huang on 21 September 2015.
The user has requested enhancement of the downloaded file.

Investigation of installation damage of some geogridsusing laboratory tests
Huang Ching-Chuan1 and Chiou Shuay-Luen2
1Professor, Department of Civil Engineering, National Cheng Kung University, No. 1, Ta-Hsueh
Road, Tainan, Taiwan 70101, Telephone: +886 6 2757575, Telefax: +886 6 2358542,
E-mail: [email protected] student, Department of Civil Engineering, National Cheng Kung University, No. 1,
Ta-Hsueh Road, Tainan, Taiwan 70101, Telephone: +886 6 2757575, Telefax: +886 6 2358542,
E-mail: [email protected]
Received 7 December 2004, revised 25 September 2005, accepted 19 October 2005
ABSTRACT: A series of laboratory tests simulating installation damage was carried out on four
types of woven geogrid. Relationships between index properties of the geogrids and the loss in
ultimate tensile strength, strain at failure and tensile stiffness of the geogrids are presented. For the
geogrids investigated, the ratio of volume of coating material to the mass of yarn (V-M ratio)
plays a major role in evaluating the loss of ultimate tensile strength: that is, the amount of
ultimate strength loss decreases with an increase in V-M ratio. The V-M ratio also plays a part in
the stress–strain characteristics of the damaged geogrids: for a regularly coated geogrid (PET yarn
+ PVC coating with a relatively low V-M ratio), similar amounts of ultimate strength and strain
losses were found; for a similar geogrid with a relatively high V-M ratio, the amount of ultimate
strain loss was only about 50% of the ultimate strength loss. The experimental results also indicate
that the losses of tensile stiffness at 2% and 5% strains seem to be governed by the types of yarn
and coating material, regardless of their V-M ratio.
KEYWORDS: Geosynthetics, Installation damage, Geogrid, Laboratory tests, Reduction factor,
Ultimate tensile strength, Tensile strain, Tensile stiffness
REFERENCE: Huang, C.-C. & Chiou, S.-L. (2006). Investigation of installation damage of some
geogrids using laboratory tests. Geosynthetics International, 13, No. 1, 23–35
1. INTRODUCTION
Geogrid durability is gaining increasing attention because
of new engineering and environmental applications of
geogrids. The resistance of geogrids to installation damage
has been investigated using full-scale field trials since
1980s. Full-scale field tests have been suggested by the
American Society for Testing and Materials (ASTM 5818)
and the British Standards Institution (BS 8006).
Table 1 summarises the results of various full-scale
trials on the installation damage of geogrids subjected to
compaction. From the results of these trials design guide-
lines have been developed for the use of a reduction
factor, FID, for deriving the design value of ultimate tensile
strength of the geogrid against installation damage:
FID ¼ Tf
Tfd
(1)
where Tf is the ultimate tensile strength of the intact
geogrid, and Tfd is the ultimate tensile strength of the
damaged geogrid.
In the design guidelines of the Federal Highway Admin-
istration (FHWA; Elias 2001), design values of FID are
also suggested according to the above–mentioned full-
scale field tests (see Table 2). In these guidelines the
particle size is taken as a major factor in determining the
design values of FID . The high values of FID (1.30 to
1.85) suggested by FHWA in Table 2 seem to be
supported by the data shown in Table 1. Higher values of
FID were obtained when coarse aggregates were used: FID
¼ 2.17 (Troost and Ploeg 1990); FID ¼ 1.48–1.88 and
1.54–1.81 (Rainey and Barksdale 1993); FID ¼ 2.01 and
1.78 (Muller-Rochholz and Mannsbart 2004); and FID ¼1.81 (Pinho-Lopes et al. 2000, 2002) Smaller values of
FID were obtained by Hufenus et al. (2005): FID ¼ 1.05–
1.10 for a sandy soil with D50 � 0.35 mm and FID ¼1.05–1.56 for coarse aggregates with D50 � 3–6 mm.
This was due to the smaller compaction energy (10 kN
vibratory roller) compared with those used in other full-
scale trials as summarised in Table 1.
Hufenus et al. (2005) performed a comprehensive study
on the resistance of geosynthetics to installation damage
using 470 test results obtained in 16 field installation
Geosynthetics International, 2006, 13, No. 1
231072-6349 # 2006 Thomas Telford Ltd

Table1.Comparisonoftest
conditionsand
reduction
factors
forinstallation
damageobtained
infull-scale
and
laboratory
tests
Author(date)
Geogridtype
Compactionequipment
Liftthickness
Particletypes
Geogridultim
ate
strength
inmachine
direction(kN/m
)
FID
(2%)
FID
(5%)or
FID
(6%)
FID
Troost
andPloeg
PETyarn(b)
Vibratingplate
compactor
200mm
SW
(well-graded
sand)
150
–FID
(6%)¼
1.04
1.17
(1990)
Dmax:2mm
200
–FID
(6%)¼
1.11
1.16
D50about0.7mm
400
–FID
(6%)¼
0.96
1.09
600
–FID
(6%)¼
0.93
1.08
Dual
Bomag
vibratingroller
200mm
GS
(sandygravel)
150
–FID
(6%)¼
1.05
1.34
(22kN/m
)Gap-graded
200
––
–
Dmax:100mm
400
–FID
(6%)¼
0.86
1.14
D50about0.3mm
600
–FID
(6%)¼
0.91
1.10
GP
(basaltstone)
150
–FID
(6%)¼
1.18
2.17
Dmax:200mm
200
––
–
D50about40mm
400
–FID
(6%)¼
1.11
1.54
600
–FID
(6%)¼
1.06
1.33
PETyarn+
PVC
Vibratingplate
compactor
200mm
SW
(well-graded
sand)
35
–FID
(6%)¼
1.03
1.09
coating(a)
Dmax:2mm
55
–FID
(6%)¼
1.07
1.02
D50about0.7mm
80
–FID
(6%)¼
0.99
1.00
Dual
Bomag
vibratingroller
200mm
GS
(sandygravel)
35
–FID
(6%)¼
0.91
1.15
(22kN/m
)Gap-graded
55
–FID
(6%)¼
1.08
1.03
Dmax:100mm
D50about0.3mm
80
–FID
(6%)¼
1.14
1.02
GP
(basaltstone)
35
–FID
(6%)¼
0.97
1.18
Dmax:200mm
55
–FID
(6%)¼
0.97
1.22
D50about40mm
80
–FID
(6%)¼
1.09
1.03
Rainey
and
PETyarn+
AL
Lightvibratory
roller
orheavy
150mm
or
SG
(gravelly
sand)
32.5
––
1.15–1.29
Barksdale(1993)
coating(b)
vibratory
roller
250mm
Dmax:8mm
D50about0.8mm
109.9
––
1.33–1.37
GP
(crushed
stone)
32.5
––
1.50–2.02
Uniform
-graded
Dmax:50mm
D50about30mm
109.9
––
1.48–1.88
SM
(silty
sand)
32.5
––
1.05
Dmax:20mm
D50about0.2mm
109.9
––
1.13–1.15
PETyarn+
PVC
Lightvibratory
roller
orheavy
150mm
or
SG
(gravelly
sand)
68.3
––
1.07–1.20
coating(a)
vibratory
roller
250mm
Dmax:8mm
94.7
––
1.16–1.22
D50about0.8mm
196.9
––
1.22–1.30
GP
(crushed
stone)
|68.3
––
1.35–1.85
Uniform
-graded
Dmax:50mm
94.7
––
1.26–1.65
D50about30mm
196.9
––
1.54–1.81
SM
(silty
sand)
68.3
––
0.95–1.02
Dmax:20mm
94.7
––
1.14–1.14
D50about0.2mm
196.9
––
1.06–1.09
Sandri
etal.(1993)PETyarn+
Caterpillarsheepsfootroller
or
230mm
GP
(rock
fill
material)
29.2
––
–
AL
coating(b)
100kN
static
smooth
drum
roller
Dmax:75mm
52.5
––
1.08–1.18
D50about3.5mm
93.4
––
1.05
24 Huang and Chiou
Geosynthetics International, 2006, 13, No. 1

124.0
––
–
GP
(slopedrain
material)
29.2
––
1.17
Dmax:75mm
52.5
––
1.11–1.13
D50about3.5mm
93.4
––
1.08–1.11
124.0
––
1.13–1.15
Hsieh
andWu
PETyarn+
PVC
Vibratory
steelwheelcompactor
150mm
GW
(crushed
stone)
60
–FID
(5%)¼
1.08
1.32
(2001)
coating(a)
(43kN/m
)and
Dmax:80mm
100
–FID
(5%)¼
1.70
1.19
300mm
D50about30mm
150
–FID
(5%)¼
1.19
1.18
200
–FID
(5%)¼
0.83
1.20
GC
60
–FID
(5%)¼
1.17
1.10
Dmax:80mm
100
–FID
(5%)¼
1.74
1.09
D50about7mm
150
–FID
(5%)¼
1.28
1.12
200
–FID
(5%)¼
1.04
1.10
GP–GM
60
–FID
(5%)¼
1.09
1.33
Dmax:50mm
|100
–FID
(5%)¼
1.38
1.20
D50about11mm
150
–FID
(5%)¼
1.22
1.17
200
–FID
(5%)¼
1.03
1.21
Pinho-Lopes
etal.
(2000,2002)
Woven
PETyarn
–200mm
Well-graded
aggregates
usedin
road
construction
60
––
–
D50:10mm
55
––
1.81
Residual
soil
ofgranite,
60
––
1.13
D50:0.3
mm
55
––
1.34
Muller-Rochholz
KnittedPETyarn
65kN
roller
compactor
300–500mm
Fourtypes
ofaggregate,
30
1.02(d)
–2.01(d)
andMannsbart
includingcrushed
limestone
50
1.03(d)
–1.78(d)
(2004)
(Dmax
�100mm)andriver
gravel
120
1.12(d)
–1.36(d)
(Dmax
�65mm)
200
1.06(d)
–1.07(d)
Hufenuset
al.
KnittedPETyarn
10kN
vibratory
roller
230mm
Well-graded
sand(0–4mm)
38
––
1.05
(2005)
+PVC
coating
(D50�
0.35mm)
52
––
1.10
160
––
1.10
Well-graded
rounded
gravel
(0–60mm)
38
––
1.32
(D50�
3mm)
52
––
1.10
160
––
1.02
Well-graded
crushed
stone
(0–22mm)
38
––
1.56
(D50�
6mm)
52
––
1.05
160
––
1.13
This
study
PVA
yarn+
PP
coating(c)
Load
intensity
q>5kPaand
q<900kPa
30mm
Sinteredaluminium
dioxide
Particlesize
¼5–10mm
and
19–25mm
60(G
RID
1)
0.98–1.06
FID
(5%)¼
0.99–1.07
0.99–1.14
PETyarn+
PVC
coating(a)
Load
intensity
q>5kPaand
q<900kPa
30mm
Sinteredaluminium
dioxide
Particlesize
¼5–10mm
and
19–25mm
60(G
RID
2)
0.99–1.05
FID
(5%)¼
0.98–1.03
1.03–1.37
60(G
RID
3)
1.00–1.06
FID
(5%)¼
0.99–1.04
0.99–1.16
150(G
RID
4)
0.99–1.04
FID
(5%)¼
0.97–1.03
1.00–1.29
(a) PET
¼polyester,
PVC
¼poly(vinylchloride).
(b) PET
¼polyester,AL
¼acryliclatex.
(c) PVA
¼poly(vinylalcohol),PP¼
polypropylene.
(d) Averagevalueforfourdifferenttypes
ofaggregate.
Investigation of installation damage of some geogrids using laboratory tests 25
Geosynthetics International, 2006, 13, No. 1

damage tests. Values of FID for PVC-coated PET geogrids
suggested by Hufenus et al. (2005) are shown in Table 2.
It can be seen that the main factors controlling the values
of FID are the aggressiveness of aggregates (in terms of
particle size and sharpness) and the compaction energy (in
terms of ground pressure and number of passes). It is also
seen in Table 2 that for compaction using higher ground
pressure (.55 kPa) and coarse aggregates the suggested
range of FID ¼ 1.3–2.1 is larger than that suggested by
FHWA (FID ¼ 1.30–1.85).
Allen and Bathurst (1994) found that the percentage of
tensile stiffness reductions at 2% and 5% strain is
significantly smaller than the percentage of ultimate
strength reduction for damaged geogrids based on full-
scale field compaction tests on flexible geogrids reported
by Troost and Ploeg (1990), Rainey and Barksdale (1993)
and Sandri et al. (1993). It can be seen in Table 1 that the
values of FID(5%) and FID(6%) (reduction factors for tensile
stiffness reduction at 5% and 6% strain) are generally less
than those of FID, with minor exceptions for the tests
performed by Troost and Ploeg (1990). However, in the
case reported by Hsieh and Wu (2001), more than half the
tests gave FID(5%) > FID . This discrepancy is investigated
in detail by using laboratory simulations in the present
study.
Another controversial issue revealed in Table 1 is the
dependence of Tf on the value of FID . In the tests
performed by Troost and Ploeg (1990) and Muller-
Rochholz and Mannsbart (2004) FID decreased with in-
crease in Tf, but the tests by Rainey and Barksdale (1993),
Sandri et al. (1993) and Hsieh and Wu (2001) showed no
such clear dependence. This issue is also investigated in
the present study.
Up to now, both full-scale field tests and laboratory
simulation tests have used commercially available geogrid
products with a range of yarns and coatings. The effect
of the amount and types of yarn and coating material on
the strength loss of geogrids has rarely been studied. In
the geogrid industry it is well known that the cost of the
coating material constitutes a substantial part of the total
cost of flexible geogrids. When geogrids are applied to
harsh environments, such as the ground consisting of
crushed stones or gravelly soils, the use of a coating
layer with enhanced damage resistance to reduce the
design value of FID may be of practical significance. The
present study aims to give an insight into the relation-
ships between the amount (and type) of coating and the
strength loss of woven geogrids via a series of laboratory
installation damage tests.
2. TEST SET-UP
A hydraulic cyclic loading system with a maximum
capacity of 80 kN and a maximum loading rate of 3 Hz
was used in the present study (Figure 1). Two rigid steel
boxes 300 mm long, 300 mm wide and 150 mm high were
used to contain aggregates and geogrids for the tests.
Figure 2 shows a loading plate, made of a steel plate
200 mm long, 100 mm wide and 50 mm thick placed at
the centre of the rigid box. Figure 3 shows a typical
Table 2. Suggested values of FID
Organisations Type of geogrid Particle types FID
FHWA
(Elias, 2001)
PET yarn + PVC
coating
Backfill
Max. particle size:100 mm
D50 about 30 mm
1.30–1.85
Backfill
Max. particle size: 20 mm
D50 about 0.7 mm
1.10–1.30
Hufenus et al.
(2005)
PET yarn +
PVC coating
Fine-grained soils
(clay, silt, sand)
1.1–1.4(a)
Rounded coarse-grained soil
, 150 mm
1.1–1.5(a)
Angular coarse-grained soil
, 150 mm
1.2–1.8(a)
Fine-grained soils (clay, silt, sand) 1.2–1.7(b)
Rounded coarse-grained soil
, 150 mm
1.2–1.8(b)
Angular coarse-grained soil
, 150 mm
1.3–2.1(b)
*For ground pressure , 55 kPa; multiply by 1.19 when number of passes . 8.(b)For ground pressure . 55 kPa; multiply by 1.19 when number of passes .8.
Figure 1. Servo-controlled cyclic loading system and test box
for simulating installation damage of geogrids
26 Huang and Chiou
Geosynthetics International, 2006, 13, No. 1

example of the relationship of load intensity against time
obtained in the tests. The total time is considerably
shortened in this figure for the sake of simplicity. For all
tests, the load intensities were controlled within �5% of
the desired values. A local displacement transducer was
used to measure the local elongation of the wide geogrid
specimens (Figure 4), modified as follows:
• It covered the full width (200 mm) of the geogrid
specimen, in order to measure the average elongation
induced by all strands of the specimen and hence
eliminate possible errors in strain measurement
caused by non-uniformly damaged strands.
• A gauge length of 200 mm (instead of the conven-
tional 100 mm) was used, so that possible damage
induced by load spread from the 100 mm-wide
loading plate could be measured.
The test medium used was sintered aluminium dioxide. In
order to investigate the effect of particle size on geogrid
damage, two particle sizes were used (Figure 5). Figure 6
shows the particle size distribution curves for the aggre-
gates used in the present study. Particle 4 (P4), with
particle sizes ranging between 5 mm and 10 mm, is
specified in DD ENV ISO 10722-1 as a standard particle
size. The similarity between the chemical composition of
the aggregates used in this study and those specified in
DD ENV ISO 10722-1 is shown in Table 3. The methods
Figure 2. Split test box and loading plate
�
���
���
���
���
����
����
�������� ��������������������������������
����� !
����
����������!
� �� �� "�
Figure 3. Example of load intensity against time. Targeted load intensity is 900 kPa under frequency of 1.0 Hz. For simplicity,
only a duration of 30 s is shown
Investigation of installation damage of some geogrids using laboratory tests 27
Geosynthetics International, 2006, 13, No. 1

used to prepare the geogrid specimens and place the
aggregates, geogrids and loading plate were identical to
those specified in DD ENV ISO 10722-1.
3. PROPERTIES OF GEOGRIDS
Figures 7a to 7d show the four types of flexible geogrid
used in this study, and their physical properties are listed
in Table 4:
• GRID 1: poly(vinyl alcohol) (PVA) yarn coated
with regular amount of polypropylene (PP, about
177 g/m2;
• GRID 2: polyester (PET) yarn coated with regular
amount of poly(vinyl chloride) (PVC, about 155
g/m2;
• GRID 3: PET yarn heavily coated with PVC (about
289 g/m2; and
• GRID 4: PET yarn coated with regular amount of
PVC (about 232 g/m2.
������
Figure 4. Modified local strain meter used in this study
� �� �� "� ���!
��! �#!
$%&���'��(�
� �� �� "� ���!
Figure 5. Two groups of sintered aluminium dioxide used in this study: (a) Particle 1, 19–25 mm; (b) Particle 4, 5–10 mm
�
��
��
��
��
���
���)��� �������!
����
�)�*���
��#�
�+���,
)��-!
.%� )������� ��/�����#��
�0'1�0
"1�021�0
�1�0'1��0
����
"1�021��0
�1�02��
��� �� �
���)�����23�����!�2������2���
���)���"���3�"���!�2�����������
���)������"3�����!�2�����2�����
���)�������3�2���!�2�����"�����
Figure 6. Particle size distribution curves for two groups of
aggregate used in this study
Table 3. Chemical components of sintered aluminium diox-
ide used in the standard test and this study
DD ENV ISO 0722-1 This study
Component % Component %
Al2O3 94.0 Al2O3 95.0
TiO2 3.2 TiO2 2.8
Fe2O3 1 Fe2O3 0.5
SiO2 1 SiO2 0.6
C 0 C 0.2
28 Huang and Chiou
Geosynthetics International, 2006, 13, No. 1

GRID 4 has a higher nominal ultimate strength (Tf ) of
about 150 kN/m in the machine direction (MD) than
GRID 1, GRID 2 and GRID 3, which have a nominal Tf¼ 60 kN/m in that direction. Although GRID 4 has a
greater mass of PVC coating than GRID 2, the ratio
between the volume of coating and the mass of yarn (V-M
ratio) is slightly lower than that for GRID 2, as shown in
Table 4. Therefore the coating for GRID 4 is also
classified as ‘regular’, as for GRID 2. It can be seen in
Table 4 that GRID 4 has the highest mass per unit area
(554 g/m2), and GRID 1 has the greatest thickness of
strands (2.45 mm) and junction (2.55 mm) among the
geogrids with Tf ¼ 60 kN/m. These values are even
greater than those for GRID 3, which has been classified
as heavily coated. This is attributable to their different
coating material and processes. PP has a smaller density
(r ¼ 900 kg/m3) than PVC (r ¼ 1300 kg/m3). Therefore
the volume of PP for a unit area of geogrid is greater than
that of PVC when equal weights of them are used.
Furthermore, GRID 1 is produced by pre-coating the PVA
yarn with PP before the weaving and heat-melting pro-
cesses, whereas GRID 4 is manufactured by dipping the
woven PET yarn in the heat-melted PVC.
Figure 8 shows the results of wide-width tensile test
results for all types of geogrid tested in this study. It can
be seen that five tests were performed for each geogrid,
and there are consistent ultimate tensile strength, strains at
breakage, and tensile stiffness at 2% and 5% for each
geogrid, with small variations.
4. TEST RESULTS AND DISCUSSION
Figure 9 shows a typical example of the relationship of
percentage of ultimate strength reduction (PSR) to cyclic
load intensity q for GRID 1 using Particle 1 (P1),
frequency F ¼ 1.0 Hz and loading cycles N ¼ 200. For
each average value, as denoted by a solid mark in this and
��! �#! �! ��!
� 2� ��� �2� ���
���!� 2� ��� �2� ���
���!
� 2� ��� �2� ���
���!
� 2� ��� �2� ���
���!
Figure 7. Geogrids used in this study: (a) GRID 1 (60/30 kN/m), PVA yarn + PP regular coating; (b) GRID 2 (60/30 kN/m), PET
yarn + PVC regular coating; (c) GRID 3 (60/30 kN/m), PET yarn + PVC heavy coating; (d) GRID 4 (150/30 kN/m), PET yarn +
PVC regular coating
Table 4. Physical properties of woven geogrid used in this study
Unit Geogrid type
GRID 1 GRID 2 GRID 3 GRID 4
Wide-width tensile strength, Tf (kN/m) 60 3 30 60 3 30 60 3 30 150 3 30
Mass of yarn (g/m2) 156 167 178 327
Mass of coating (g/m2) 177 155 289 231
Volume of coating material cm3/m2 197 119 222 178
Volume of coating/Mass of yarn (V-M ratio) (cm3/g) 1.26 0.71 1.24 0.54
Nominal thickness (under surcharge of 2 kPa) (mm) 2.4 1.5 2.1 1.9
Rib thickness (mm) Machine 1.9 1.1 1.4 1.3
Cross-machine 1.2 0.7 1.4 1.1
Thickness of junction (mm) 2.5 1.4 2.1 1.7
Rib width (mm) Machine 3.1 5.8 5.8 9.4
Cross-machine 5.2 3.8 4.9 3.2
Aperture size (mm) 22 3 21 23 3 28 24 3 27 20 3 22
Number of strands/m 40 35 35 35
Material PVA+PP PET+PVC
Investigation of installation damage of some geogrids using laboratory tests 29
Geosynthetics International, 2006, 13, No. 1

all subsequent figures, five tests were performed under
identical test conditions.
Figures 10a to 10d show PSR against q for GRIDs 1, 2,
3 and 4, respectively. Figure 10a shows that for GRID 1
PSR increases with the increase in q when P1 (19–
25 mm) is used. However, this is not true for the tests
using P4 (5–10 mm). The extremely small values of PSR
for P4 suggest that the use of a smaller particle size (P4)
in the standard test (DD ENV ISO 10722-1) may under-
estimate the damage of GRID 1 when the site is
dominated by larger particles. A similar conclusion has
been drawn by Schroer et al. (2000) based on a compara-
tive study on a PVC-coated woven PET geogrid with Tf�78 kN/m using laboratory damage simulation tests as
used in this study and an on-site simulation test suggested
by Watts and Brady (1994).
Figure 10b shows test results for GRID 2 obtained
under identical test conditions to those shown in Figure
10a. The values of PSR increase with increase in q, and
are significantly greater than those shown in Figure 10a.
An important factor contributing to this difference is the
volume of coating material, as indicated in Table 4.
Although similar masses of coating material are used for
GRID 1 and GRID 2, their volumes are significantly
different, because PP and PVC have somewhat different
densities, as mentioned in Section 3. The PSR–q relation-
ships for GRID 3 (Figure 10c) are similar to those for
GRID 1. This is attributable to their similar volumes of
coating material, as indicated in Table 4.
These observations suggest that GRID 1 can be referred
to as heavily coated in terms of the volume of coating
material, although it has a relatively small weight of
coating material. It is conceivable that the thickness of the
coating layer is a function of the volume of the coating
material applied and the diameter of the bundle of the
yarns. Therefore the ratio of the volume of coating to the
mass of yarn (V-M ratio) for a unit area of geogrid may be
used as a quantitative indicator of the geogrid’s robustness
against installation damage. To verify this conclusion, all
the data shown in Figures 10a to 10d are summarised in
Figure 11. For a given loading condition, most of the
values of PSR tend to decrease with an increase in V-M
ratio, except a minor portion of the points for GRID 2
using a large particle (P1). A relatively large degree of
variation in PSR when using P1 as the test medium may
account for this discrepancy. More tests in the future using
geogrid specimens under carefully controlled coating
processes are necessary to clarify this issue.
Figure 12a shows the relationship of PLR (percentage
of ultimate strain reduction) to PSR for GRID 1 obtained
using various test conditions. The values of PLR are
smaller than those of PSR. This is different from the
results reported by Allen and Bathurst (1994). They
summarised the data obtained in full-scale installation
damage tests on flexible geogrids by Troost and Ploeg
(1990), Rainey and Barksdale (1993) and Sandri et al.
(1993), and found similar percentages of ultimate strength
and strain losses for the exhumed PET woven geogrids.
The difference between the PLR–PSR relationships be-
tween GRID 1 in this study and those reported by Allen
and Bathurst (1994) may reflect differences in the types of
yarn used for the geogrids. In this figure and subsequent
figures, instead of averaged values for five identical tests,
all individual test results are presented in order to show
the possible uncertainties of the damage evaluation. In all
the cases investigated, a linear regression line is used to
show the approximate trend of the data. We shall focus on
the slope of these regression lines. The intercept with the
y-axis will not be discussed because it is relatively small,
and is possibly induced and/or affected by the inevitable
experimental errors.
Figures 12b and 12c show, respectively, the percentage
of strength (or stiffness) reduction at 2% tensile strain,
PSR(2%), and at 5% tensile strain, PSR(5%), against PSR
�
��
��
���
���
���45$6��
45$6��
45$6�"
45$6��
45$6��
45$6�"
45$6��
45$6��
� 2 �� �2 ��7 ���)� ���-!
8���(+��),�)�
� ��
� )���
�),���91�
!
Figure 8. Stress–strain curves for geogrids obtained in wide-
width tensile tests
�
��
��
��
2��2����'""!
��������2�2!
���������'"�!
45$6������1"���91�!���)��������3�2��!������������������������
:/������;����)��� � *�������
<��� �* ����,��������� ;�����
����
�"��
"�"
����
��"
���� =�>����
:/������ �**����)� * �/����)� � !
=������
�%5��-!
���� ��?�������!
��� ��� ��� ��� ���� ���� ����
Figure 9. Typical example of averaged and original test
results of in-lab installation damage tests
30 Huang and Chiou
Geosynthetics International, 2006, 13, No. 1

for GRID 1. Similar to that shown in Figure 12a, the
geogrid is subjected to some degree of damage, but the
PLR and the degree of damage are less than those for
PSR. In addition, the scattering of data points is greater
than that shown in Figure 12a, indicating that a greater
degree of uncertainty may be associated with the evalua-
tion of PSR(2%) and PSR(5%) than with that of PSR.
Figures 13a to 13c show the test results for GRID 2.
The test conditions are the same as those shown in Figures
12a to 12c. The differences between Figure 12 and Figure
13 reflect the differing physical properties between GRID
1 and GRID 2, which include the type of polymeric yarn,
the type and quantity of coating material, and the coating
method.
Figure 13a shows that, for GRID 2, PLR is approxi-
mately equal to PSR. This is different from GRID 1 as
shown in Figure 12a. Figures 13b and 13c show smaller
decreases in tensile strength (or modulus) at 2% and 5%
strains, compared with those shown in Figures 12b and
12c for GRID 1.
Figures 14a to 14c show test results similar to those
shown in Figures 13a to 13c, except that GRID 3 is used.
The differences between Figure 14 and Figure 13 reflect
���
�
��
��
"�
�%5��-!
���� ��?�������!
45$6������1"���91�!������������������������
���)��������3�2���!���)������23�����!
��� ��� ��� ����
��!
2��2����'""!
��������2�2!
���������'"�!
���'����"'�!
��'��������! ����"
������!
���
�
��
��
"�
�%5��-!
���� ��?�������!
45$6������1"���91�!������������������������
���)��������3�2���!���)������23�����!
��� ��� ��� ����
�#!
��������''�!
'�������"��!
�'��"����"��!
"��'�������!
������������!
���'2�����""!
���
�
��
��
"�
�%5��-!
���� ��?�������!
45$6�"����1"���91�!������������������������
���)��������3�2���!���)������23�����!
��� ��� ��� ����
�!
"��"����"'�! ����
�������!
�"����������!
���22�������!
�����������"! ��"�
������"!
���
�
��
��
"�
�%5��-!
���� ��?�������!
45$6�����2�1"���91�!������������������������
���)��������3�2���!���)������23�����!
��� ��� ��� ����
��!
��""�������!
����"����"2�!
������������!
����'������2!
���2�������'!
����2����2��!
Figure 10. PSR against cyclic load intensity q for: (a) GRID 1; (b) GRID 2; (c) GRID 3; (d) GRID 4
�
��
��
"�
��
2�
��
45$6��45$6��
45$6�"45$6��
��?��������������?��������������?��������������?��������������?��������������?������������
�%5��-!
< ���� *� �)���1=� � *����� ��<(=���)� !���1�"!
��� ��� ��� � ��� ���
Figure 11. PSR against V-M ratio for all tests performed in
this study
Investigation of installation damage of some geogrids using laboratory tests 31
Geosynthetics International, 2006, 13, No. 1

the different physical properties between GRID 3 and
GRID 2, i.e. the difference in the volume of coating (or
V-M ratio). Figure 14a shows that the values of PSR for
GRID 3 are generally less than those for GRID 2 shown
in Figure 13a. Figure 14a also shows that the values of
PLR are smaller than those of PSR when P1 is used. In
general, the results shown in Figures 13a and 14a reveal
the merit of using a greater volume of PVC coating in
���
�
��
��
"�45$6������1"���91�!���������������������������)��������3�2���!���)������23����!
�@5
��-!
��� � �� �� "�
�@5�����2'�������%5!�������"��
�%5��-!
��!
���
�
��
��
"�45$6������1"���91�!���������������������������)��������3�2���!���)������23����!
�%5
��-!��-!
��� � �� �� "�
�%5��-!������'�'���%5!�����������
�%5��-!
�#!
���
�
��
��
"�45$6������1"���91�!���������������������������)��������3�2���!���)������23����!
�%5
�2-!��-!
��� � �� �� "�
�%5�2-!����������2���%5!���������"�
�%5��-!
�!
Figure 12. Characteristics of damaged geogrid (GRID 1) expressed by: (a) PLR against PSR; (b) PSR(2%) against PSR;
(c) PSR(5%) against PSR
���
�
��
��
��
�%5��-!��!
�@5
��-!
45$6������1"���91�!���������������������������)��������3�2��!���)������23����!
�@5������������%5!�������2���
���
�
��
��
��
�%5
��-!��-!
45$6������1"���91�!
�%5��-!�����������%5!�������"���
���
�
��
��
��
�%5
�2-!��-!
45$6������1"���91�!
�%5�2-!������22���%5!������2����
��� � �� �� ��
���������������������������)��������3�2��!���)������23����!
���������������������������)��������3�2��!���)������23����!
�%5��-!�#!
��� � �� �� ��
�%5��-!�!
��� � �� �� ��
Figure 13. Characteristics of damaged geogrid (GRID 2) expressed by: (a) PLR against PSR; (b) PSR(2%) against PSR;
(c) PSR(5%) against PSR
���
�
��
��
"�
�%5��-!��!
�@5
��-!
45$6�"����1"���91�!������������������������
�@5�-!������22"2'��%5!�����������
���
�
��
��
"�
�%5
��-!��-!
45$6�"����1"���91�!
�%5��-!��������"2��%5!����������2
���
�
��
��
"�
�%5
�2-!��-!
45$6�"����1"���91�!
�%5�2-!������������%5!������'���"
��� � �� �� "�
������������������������
������������������������
�%5��-!�#!
��� � �� �� "�
�%5��-!�!
��� � �� �� "�
���)��������3�2��!���)������23����!
���)��������3�2��!���)������23����!
���)��������3�2��!���)������23����!
Figure 14. Characteristics of damaged geogrid (GRID 3) expressed by: (a) PLR against PSR; (b) PSR(2%) against PSR;
(c) PSR(5%) against PSR
32 Huang and Chiou
Geosynthetics International, 2006, 13, No. 1

reducing the degree of damage (in terms of PLR and
PSR). Figures 14b and 14c show that the tendencies of the
relationships between PSR(2%) and PSR, and between
PSR(5%) and PSR, are very similar to those shown in
Figures 13b and 13c. The relationship between PSR(2%)
(or PSR(5%)) and PSR seems to be insusceptible to the
change in the volume of coating (or the V-M ratio) when
we compare Figures 13b and 13c with Figures 14b and
14c.
Figures 15a to 15c show the test results for GRID 4.
The stress–strain characteristics of the damaged GRID 4
are similar to those of GRID 2 (Figure 13), which
indicates that the stress–strain characteristics of damaged
geogrids can be closely related to the V-M ratio rather
than the volume of coating when geogrids with different
values of Tf are compared.
Figure 16 summarises the slope (a:1 ¼ V:H) of the
regression lines shown in Figures 12 to 15. The following
two points can be inferred:
• Similar values of a for the PLR–PSR relationship
can be obtained for GRID 1 and GRID 3, which
have similarly large V-M ratios.
• GRID 2, GRID 3 and GRID 4 have similar values of
a for the PSR(2%) –PSR and PSR(5%) –PSR relation-
ships despite their largely different V-M ratios. This
indicates that the characteristics of PSR(2%) and
PSR(5%) may be controlled uniquely by the yarn and
coating used (PET yarn + PVC coating, in this case)
rather than by the V-M ratios. This is supported by
the observation for GRID 1 (PVA yarn + PP coating),
for which the a values for PSR(2%) and PSR(5%) are
substantially higher than those for GRID 2, GRID 3
and GRID 4 (PET yarn + PVC coating).
Suggested values of FID(5%) for the various geogrids
obtained in the present study are summarised in Table 1.
The values of FID(5%) for the ranges of load intensity and
particle size used in the present study fall within a narrow
range. When we comparing the values of FID(5%) for GRID
2 and GRID 4, no clear dependence of FID and FID(5%) on
the value of Tf can be detected.
Note, however, that the V-M ratio has been used
throughout this study, where all types of yarn have similar
values of r (¼ 1.3 g/cm3). When comparing yarns with
various r values, the ratio of volume of yarn to volume of
coating (V-V ratio) may be of more physical significance.
This issue is beyond the scope of the present study.
5. CONCLUSIONS
The present study comprised a series of laboratory cyclic
loading tests to simulate installation damage on four types
of woven geogrid. The following conclusions can be
drawn:
• The ratio of volume of coating material to mass of
yarn ratio (V-M ratio) has a major influence on the
ultimate strength loss of flexible geogrids. The extent
of ultimate tensile strength loss decreases with
increase in the V-M ratio of the geogrid regardless of
the different types of yarn and coating material used.
• The characteristics of ultimate strain loss (i.e. the
PLR–PSR relationships) are also governed by the
V-M ratio of the geogrid, regardless of the types of
yarn and coating material used. Test results show
���
�
��
��
�%5��-!��!
�@5
��-!
45$6�����2�1"���91�!������������������������
�@5�-!������2'��%5!�����������
�%5
��-!��-!
45$6�����2�1"���91�!
�%5��-!�������"'���%5!��������'2�
�%5
�2-!��-!
45$6�����2�1"���91�!
�%5�2-!���������"��%5!������'22��
��� � �� �� "�
������������������������
������������������������
�%5��-!�#!
��� � �� �� "�
�%5��-!�!
��� � �� �� "��� ��
"�
��
���
�
��
��
"�
��
���
�
��
��
"�
��
���)��������3�2��!���)������23����!
���)��������3�2��!���)������23����!
���)��������3�2��!���)������23����!
Figure 15. Characteristics of damaged geogrid (GRID 4) expressed by: (a) PLR against PSR; (b) PSR(2%) against PSR;
(c) PSR(5%) against PSR
��2'2���'�
�����
�����
�����
�����
���22
����������
�����
���������2
�
���
���
���
���
���* ���@53�%5
��* ���%5��-!3�%5
��* ���%5�2-!3�%5
45$6���<(=���)� ��������1�"!�
45$6�� 45$6�" 45$6��
�
�<(=���)� ����'���1�"!
�<(=���)� ��������1�"!
�<(=���)� ����2���1�"!
4� �����)�;�
Figure 16. Characteristics of damaged geogrids illustrated by
using a values for slope of regression lines
Investigation of installation damage of some geogrids using laboratory tests 33
Geosynthetics International, 2006, 13, No. 1
that, for the geogrids using higher V-M ratios (GRID
1 and GRID 3), the loss of ultimate strain (PLR) is
about 45–57% of the loss of ultimate strength
(PSR); for those using lower V-M ratios (GRID 2
and GRID 4), the ratios between PLR and PSR are
approximately 1.0 (or 0.9–1.1).
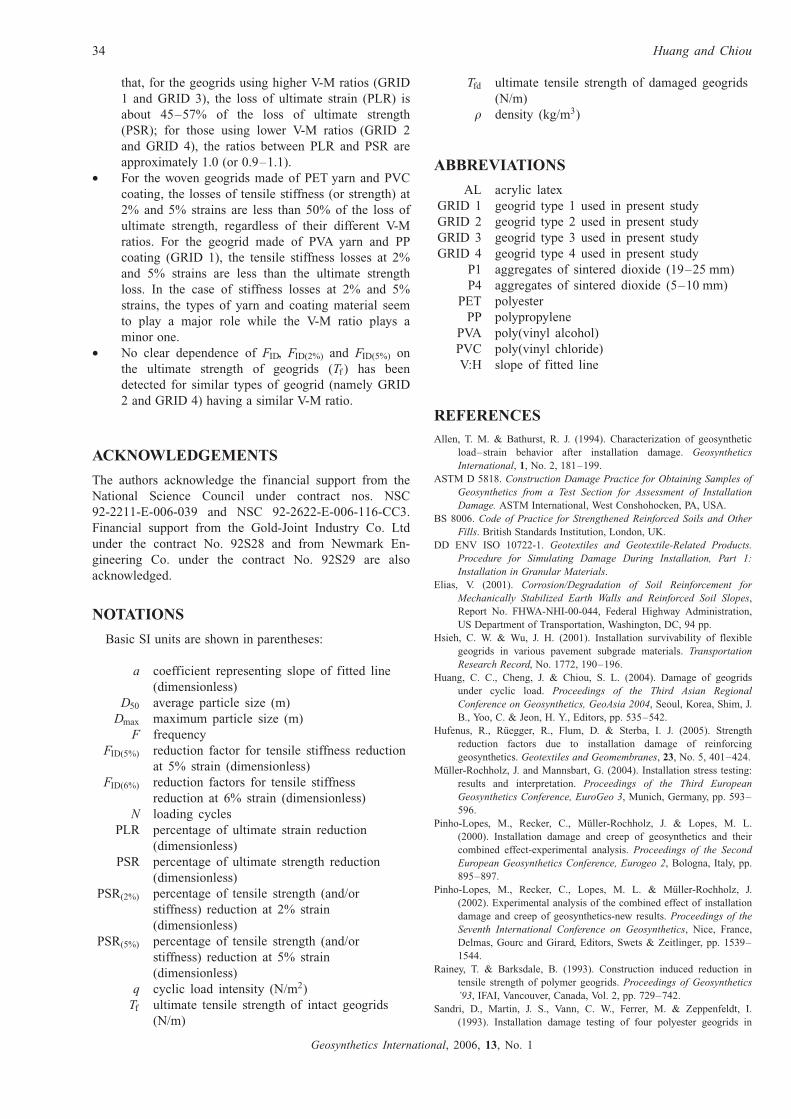
• For the woven geogrids made of PET yarn and PVC
coating, the losses of tensile stiffness (or strength) at
2% and 5% strains are less than 50% of the loss of
ultimate strength, regardless of their different V-M
ratios. For the geogrid made of PVA yarn and PP
coating (GRID 1), the tensile stiffness losses at 2%
and 5% strains are less than the ultimate strength
loss. In the case of stiffness losses at 2% and 5%
strains, the types of yarn and coating material seem
to play a major role while the V-M ratio plays a
minor one.
• No clear dependence of FID, FID(2%) and FID(5%) on
the ultimate strength of geogrids (Tf ) has been
detected for similar types of geogrid (namely GRID
2 and GRID 4) having a similar V-M ratio.
ACKNOWLEDGEMENTS
The authors acknowledge the financial support from the
National Science Council under contract nos. NSC
92-2211-E-006-039 and NSC 92-2622-E-006-116-CC3.
Financial support from the Gold-Joint Industry Co. Ltd
under the contract No. 92S28 and from Newmark En-
gineering Co. under the contract No. 92S29 are also
acknowledged.
NOTATIONS
Basic SI units are shown in parentheses:
a coefficient representing slope of fitted line
(dimensionless)
D50 average particle size (m)
Dmax maximum particle size (m)
F frequency
FID(5%) reduction factor for tensile stiffness reduction
at 5% strain (dimensionless)
FID(6%) reduction factors for tensile stiffness
reduction at 6% strain (dimensionless)
N loading cycles
PLR percentage of ultimate strain reduction
(dimensionless)
PSR percentage of ultimate strength reduction
(dimensionless)
PSR(2%) percentage of tensile strength (and/or
stiffness) reduction at 2% strain
(dimensionless)
PSR(5%) percentage of tensile strength (and/or
stiffness) reduction at 5% strain
(dimensionless)
q cyclic load intensity (N/m2)
Tf ultimate tensile strength of intact geogrids
(N/m)
Tfd ultimate tensile strength of damaged geogrids
(N/m)
r density (kg/m3)
ABBREVIATIONS
AL acrylic latex
GRID 1 geogrid type 1 used in present study
GRID 2 geogrid type 2 used in present study
GRID 3 geogrid type 3 used in present study
GRID 4 geogrid type 4 used in present study
P1 aggregates of sintered dioxide (19–25 mm)
P4 aggregates of sintered dioxide (5–10 mm)
PET polyester
PP polypropylene
PVA poly(vinyl alcohol)
PVC poly(vinyl chloride)
V:H slope of fitted line
REFERENCES
Allen, T. M. & Bathurst, R. J. (1994). Characterization of geosynthetic
load–strain behavior after installation damage. Geosynthetics
International, 1, No. 2, 181–199.
ASTM D 5818. Construction Damage Practice for Obtaining Samples of
Geosynthetics from a Test Section for Assessment of Installation
Damage. ASTM International, West Conshohocken, PA, USA.
BS 8006. Code of Practice for Strengthened Reinforced Soils and Other
Fills. British Standards Institution, London, UK.
DD ENV ISO 10722-1. Geotextiles and Geotextile-Related Products.
Procedure for Simulating Damage During Installation, Part 1:
Installation in Granular Materials.
Elias, V. (2001). Corrosion/Degradation of Soil Reinforcement for
Mechanically Stabilized Earth Walls and Reinforced Soil Slopes,
Report No. FHWA-NHI-00-044, Federal Highway Administration,
US Department of Transportation, Washington, DC, 94 pp.
Hsieh, C. W. & Wu, J. H. (2001). Installation survivability of flexible
geogrids in various pavement subgrade materials. Transportation
Research Record, No. 1772, 190–196.
Huang, C. C., Cheng, J. & Chiou, S. L. (2004). Damage of geogrids
under cyclic load. Proceedings of the Third Asian Regional
Conference on Geosynthetics, GeoAsia 2004, Seoul, Korea, Shim, J.
B., Yoo, C. & Jeon, H. Y., Editors, pp. 535–542.
Hufenus, R., Ruegger, R., Flum, D. & Sterba, I. J. (2005). Strength
reduction factors due to installation damage of reinforcing
geosynthetics. Geotextiles and Geomembranes, 23, No. 5, 401–424.
Muller-Rochholz, J. and Mannsbart, G. (2004). Installation stress testing:
results and interpretation. Proceedings of the Third European
Geosynthetics Conference, EuroGeo 3, Munich, Germany, pp. 593–
596.
Pinho-Lopes, M., Recker, C., Muller-Rochholz, J. & Lopes, M. L.
(2000). Installation damage and creep of geosynthetics and their
combined effect-experimental analysis. Proceedings of the Second
European Geosynthetics Conference, Eurogeo 2, Bologna, Italy, pp.
895–897.
Pinho-Lopes, M., Recker, C., Lopes, M. L. & Muller-Rochholz, J.
(2002). Experimental analysis of the combined effect of installation
damage and creep of geosynthetics-new results. Proceedings of the
Seventh International Conference on Geosynthetics, Nice, France,
Delmas, Gourc and Girard, Editors, Swets & Zeitlinger, pp. 1539–
1544.
Rainey, T. & Barksdale, B. (1993). Construction induced reduction in
tensile strength of polymer geogrids. Proceedings of Geosynthetics
’93, IFAI, Vancouver, Canada, Vol. 2, pp. 729–742.
Sandri, D., Martin, J. S., Vann, C. W., Ferrer, M. & Zeppenfeldt, I.
(1993). Installation damage testing of four polyester geogrids in
34 Huang and Chiou
Geosynthetics International, 2006, 13, No. 1

three soil types. Proceedings of Geosynthetics’93, IFAI, Vancouver,
Canada, Vol. 2, pp. 743–755.
Schroer, S., Thornton, J. S., Muller-Rochholz, J. and Recker, C. (2000).
Stepped isothermal method to determine a combined reduction
factor for creep and installation damage. Proceedings of the Second
European Geosynthetics Conference, EuroGeo 2, Bologna, Italy, pp.
351–355.
Troost, G. H. & Ploeg, N. A. (1990). Influence of weaving structure and
coating on the degree of mechanical damage of reinforcing mats
and woven geogrids, caused by different fills, during installation.
Proceedings of the Fourth International Conference on Geotextiles,
Geomembranes and Related Products, The Hague, The Netherlands,
Den Hoedt, G., Editor, Balkema, Rotterdam, pp. 609–614.
Watts, G. R. A. & Brady, K. C. (1994). Geosynthetics: installation
damage and the measurement of tensile strength. Proceedings of
the Fifth International Conference on Geotextiles, Geomembranes
and Related Products, Singapore, Karunaratne, G. P., Chew, S. H.
and Wong, K. S., Editors, pp. 1159–1164.
The Editors welcome discussion on all papers published in Geosynthetics International. Please email your contribution to
[email protected] by 15 August 2006.
Investigation of installation damage of some geogrids using laboratory tests 35
Geosynthetics International, 2006, 13, No. 1
View publication statsView publication stats