Embed Size (px)
Citation preview
lable at ScienceDirect
Energy 77 (2014) 42e48
Contents lists avai
Energy
journal homepage: www.elsevier .com/locate/energy
Investigation of indoor and outdoor air quality of the classrooms at aschool in Serbia
Marina Jovanovi�c*, Biljana Vu�ci�cevi�c, Valentina Turanjanin, Marija �Zivkovi�c,Vuk Spasojevi�cUniversity of Belgrade, Institute of Nuclear Sciences ‘Vin�ca’, Laboratory for Thermal Engineering and Energy, P.O. BOX 522, 11001 Belgrade, Serbia
a r t i c l e i n f o
Article history:Received 4 December 2013Received in revised form29 January 2014Accepted 19 March 2014Available online 16 April 2014
Keywords:Classroom air qualityKey indoor air pollutantsSchool
* Corresponding author. Tel.: þ381 11 34 08 250; faE-mail addresses: [email protected] (M. Jovanovi�c)
[email protected] (V. Turanjanin), [email protected] (vinca.rs (V. Spasojevi�c).
http://dx.doi.org/10.1016/j.energy.2014.03.0800360-5442/� 2014 Elsevier Ltd. All rights reserved.
a b s t r a c t
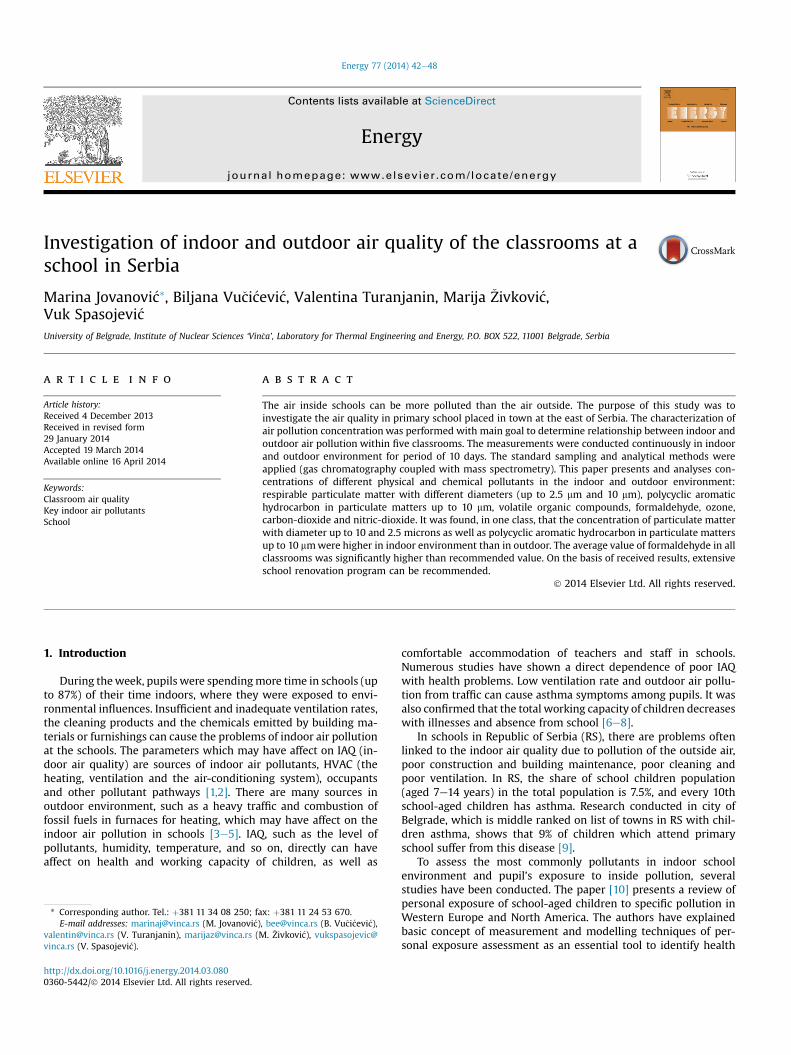
The air inside schools can be more polluted than the air outside. The purpose of this study was toinvestigate the air quality in primary school placed in town at the east of Serbia. The characterization ofair pollution concentration was performed with main goal to determine relationship between indoor andoutdoor air pollution within five classrooms. The measurements were conducted continuously in indoorand outdoor environment for period of 10 days. The standard sampling and analytical methods wereapplied (gas chromatography coupled with mass spectrometry). This paper presents and analyses con-centrations of different physical and chemical pollutants in the indoor and outdoor environment:respirable particulate matter with different diameters (up to 2.5 mm and 10 mm), polycyclic aromatichydrocarbon in particulate matters up to 10 mm, volatile organic compounds, formaldehyde, ozone,carbon-dioxide and nitric-dioxide. It was found, in one class, that the concentration of particulate matterwith diameter up to 10 and 2.5 microns as well as polycyclic aromatic hydrocarbon in particulate mattersup to 10 mmwere higher in indoor environment than in outdoor. The average value of formaldehyde in allclassrooms was significantly higher than recommended value. On the basis of received results, extensiveschool renovation program can be recommended.
� 2014 Elsevier Ltd. All rights reserved.
1. Introduction
During theweek, pupils were spendingmore time in schools (upto 87%) of their time indoors, where they were exposed to envi-ronmental influences. Insufficient and inadequate ventilation rates,the cleaning products and the chemicals emitted by building ma-terials or furnishings can cause the problems of indoor air pollutionat the schools. The parameters which may have affect on IAQ (in-door air quality) are sources of indoor air pollutants, HVAC (theheating, ventilation and the air-conditioning system), occupantsand other pollutant pathways [1,2]. There are many sources inoutdoor environment, such as a heavy traffic and combustion offossil fuels in furnaces for heating, which may have affect on theindoor air pollution in schools [3e5]. IAQ, such as the level ofpollutants, humidity, temperature, and so on, directly can haveaffect on health and working capacity of children, as well as
x: þ381 11 24 53 670., [email protected] (B. Vu�ci�cevi�c),M. �Zivkovi�c), vukspasojevic@
comfortable accommodation of teachers and staff in schools.Numerous studies have shown a direct dependence of poor IAQwith health problems. Low ventilation rate and outdoor air pollu-tion from traffic can cause asthma symptoms among pupils. It wasalso confirmed that the total working capacity of children decreaseswith illnesses and absence from school [6e8].
In schools in Republic of Serbia (RS), there are problems oftenlinked to the indoor air quality due to pollution of the outside air,poor construction and building maintenance, poor cleaning andpoor ventilation. In RS, the share of school children population(aged 7e14 years) in the total population is 7.5%, and every 10thschool-aged children has asthma. Research conducted in city ofBelgrade, which is middle ranked on list of towns in RS with chil-dren asthma, shows that 9% of children which attend primaryschool suffer from this disease [9].
To assess the most commonly pollutants in indoor schoolenvironment and pupil’s exposure to inside pollution, severalstudies have been conducted. The paper [10] presents a review ofpersonal exposure of school-aged children to specific pollution inWestern Europe and North America. The authors have explainedbasic concept of measurement and modelling techniques of per-sonal exposure assessment as an essential tool to identify health
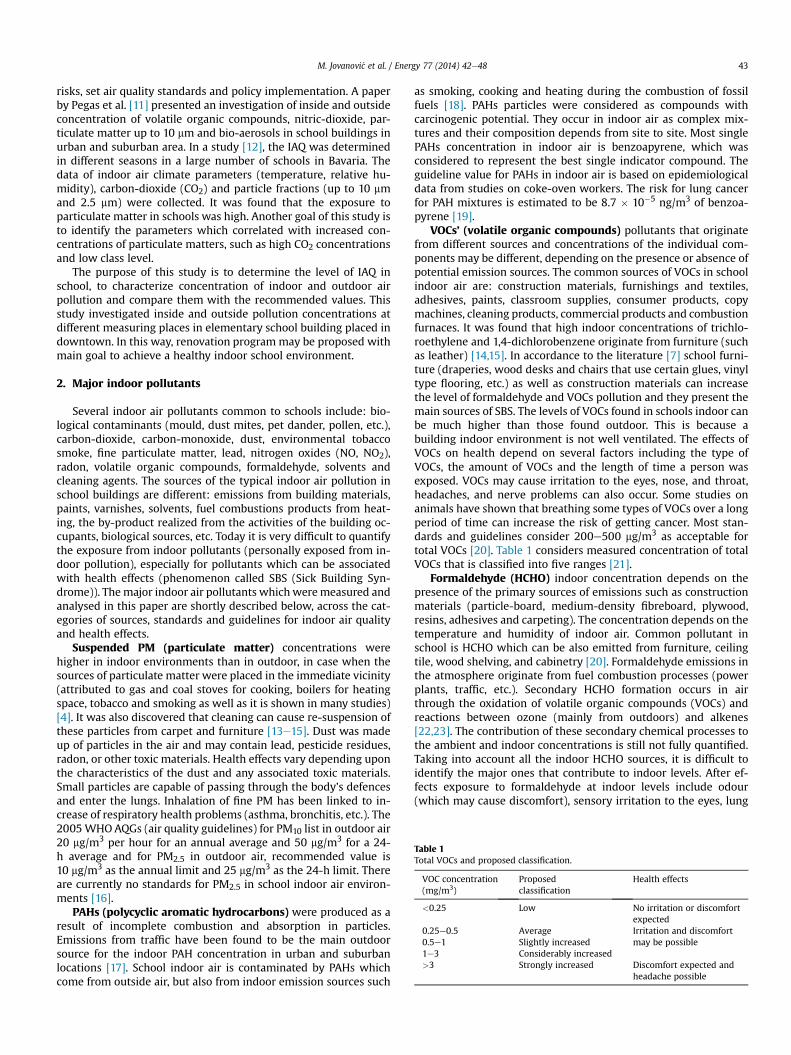
Table 1Total VOCs and proposed classification.
VOC concentration(mg/m3)
Proposedclassification
Health effects
<0.25 Low No irritation or discomfortexpected
0.25e0.5 Average Irritation and discomfortmay be possible0.5e1 Slightly increased
1e3 Considerably increased>3 Strongly increased Discomfort expected and
headache possible
M. Jovanovi�c et al. / Energy 77 (2014) 42e48 43
risks, set air quality standards and policy implementation. A paperby Pegas et al. [11] presented an investigation of inside and outsideconcentration of volatile organic compounds, nitric-dioxide, par-ticulate matter up to 10 mm and bio-aerosols in school buildings inurban and suburban area. In a study [12], the IAQ was determinedin different seasons in a large number of schools in Bavaria. Thedata of indoor air climate parameters (temperature, relative hu-midity), carbon-dioxide (CO2) and particle fractions (up to 10 mmand 2.5 mm) were collected. It was found that the exposure toparticulate matter in schools was high. Another goal of this study isto identify the parameters which correlated with increased con-centrations of particulate matters, such as high CO2 concentrationsand low class level.
The purpose of this study is to determine the level of IAQ inschool, to characterize concentration of indoor and outdoor airpollution and compare them with the recommended values. Thisstudy investigated inside and outside pollution concentrations atdifferent measuring places in elementary school building placed indowntown. In this way, renovation program may be proposed withmain goal to achieve a healthy indoor school environment.
2. Major indoor pollutants
Several indoor air pollutants common to schools include: bio-logical contaminants (mould, dust mites, pet dander, pollen, etc.),carbon-dioxide, carbon-monoxide, dust, environmental tobaccosmoke, fine particulate matter, lead, nitrogen oxides (NO, NO2),radon, volatile organic compounds, formaldehyde, solvents andcleaning agents. The sources of the typical indoor air pollution inschool buildings are different: emissions from building materials,paints, varnishes, solvents, fuel combustions products from heat-ing, the by-product realized from the activities of the building oc-cupants, biological sources, etc. Today it is very difficult to quantifythe exposure from indoor pollutants (personally exposed from in-door pollution), especially for pollutants which can be associatedwith health effects (phenomenon called SBS (Sick Building Syn-drome)). Themajor indoor air pollutants which weremeasured andanalysed in this paper are shortly described below, across the cat-egories of sources, standards and guidelines for indoor air qualityand health effects.
Suspended PM (particulate matter) concentrations werehigher in indoor environments than in outdoor, in case when thesources of particulate matter were placed in the immediate vicinity(attributed to gas and coal stoves for cooking, boilers for heatingspace, tobacco and smoking as well as it is shown in many studies)[4]. It was also discovered that cleaning can cause re-suspension ofthese particles from carpet and furniture [13e15]. Dust was madeup of particles in the air and may contain lead, pesticide residues,radon, or other toxic materials. Health effects vary depending uponthe characteristics of the dust and any associated toxic materials.Small particles are capable of passing through the body’s defencesand enter the lungs. Inhalation of fine PM has been linked to in-crease of respiratory health problems (asthma, bronchitis, etc.). The2005WHOAQGs (air quality guidelines) for PM10 list in outdoor air20 mg/m3 per hour for an annual average and 50 mg/m3 for a 24-h average and for PM2.5 in outdoor air, recommended value is10 mg/m3 as the annual limit and 25 mg/m3 as the 24-h limit. Thereare currently no standards for PM2.5 in school indoor air environ-ments [16].
PAHs (polycyclic aromatic hydrocarbons) were produced as aresult of incomplete combustion and absorption in particles.Emissions from traffic have been found to be the main outdoorsource for the indoor PAH concentration in urban and suburbanlocations [17]. School indoor air is contaminated by PAHs whichcome from outside air, but also from indoor emission sources such
as smoking, cooking and heating during the combustion of fossilfuels [18]. PAHs particles were considered as compounds withcarcinogenic potential. They occur in indoor air as complex mix-tures and their composition depends from site to site. Most singlePAHs concentration in indoor air is benzoapyrene, which wasconsidered to represent the best single indicator compound. Theguideline value for PAHs in indoor air is based on epidemiologicaldata from studies on coke-oven workers. The risk for lung cancerfor PAH mixtures is estimated to be 8.7 � 10�5 ng/m3 of benzoa-pyrene [19].
VOCs’ (volatile organic compounds) pollutants that originatefrom different sources and concentrations of the individual com-ponents may be different, depending on the presence or absence ofpotential emission sources. The common sources of VOCs in schoolindoor air are: construction materials, furnishings and textiles,adhesives, paints, classroom supplies, consumer products, copymachines, cleaning products, commercial products and combustionfurnaces. It was found that high indoor concentrations of trichlo-roethylene and 1,4-dichlorobenzene originate from furniture (suchas leather) [14,15]. In accordance to the literature [7] school furni-ture (draperies, wood desks and chairs that use certain glues, vinyltype flooring, etc.) as well as construction materials can increasethe level of formaldehyde and VOCs pollution and they present themain sources of SBS. The levels of VOCs found in schools indoor canbe much higher than those found outdoor. This is because abuilding indoor environment is not well ventilated. The effects ofVOCs on health depend on several factors including the type ofVOCs, the amount of VOCs and the length of time a person wasexposed. VOCs may cause irritation to the eyes, nose, and throat,headaches, and nerve problems can also occur. Some studies onanimals have shown that breathing some types of VOCs over a longperiod of time can increase the risk of getting cancer. Most stan-dards and guidelines consider 200e500 mg/m3 as acceptable fortotal VOCs [20]. Table 1 considers measured concentration of totalVOCs that is classified into five ranges [21].
Formaldehyde (HCHO) indoor concentration depends on thepresence of the primary sources of emissions such as constructionmaterials (particle-board, medium-density fibreboard, plywood,resins, adhesives and carpeting). The concentration depends on thetemperature and humidity of indoor air. Common pollutant inschool is HCHO which can be also emitted from furniture, ceilingtile, wood shelving, and cabinetry [20]. Formaldehyde emissions inthe atmosphere originate from fuel combustion processes (powerplants, traffic, etc.). Secondary HCHO formation occurs in airthrough the oxidation of volatile organic compounds (VOCs) andreactions between ozone (mainly from outdoors) and alkenes[22,23]. The contribution of these secondary chemical processes tothe ambient and indoor concentrations is still not fully quantified.Taking into account all the indoor HCHO sources, it is difficult toidentify the major ones that contribute to indoor levels. After ef-fects exposure to formaldehyde at indoor levels include odour(which may cause discomfort), sensory irritation to the eyes, lung
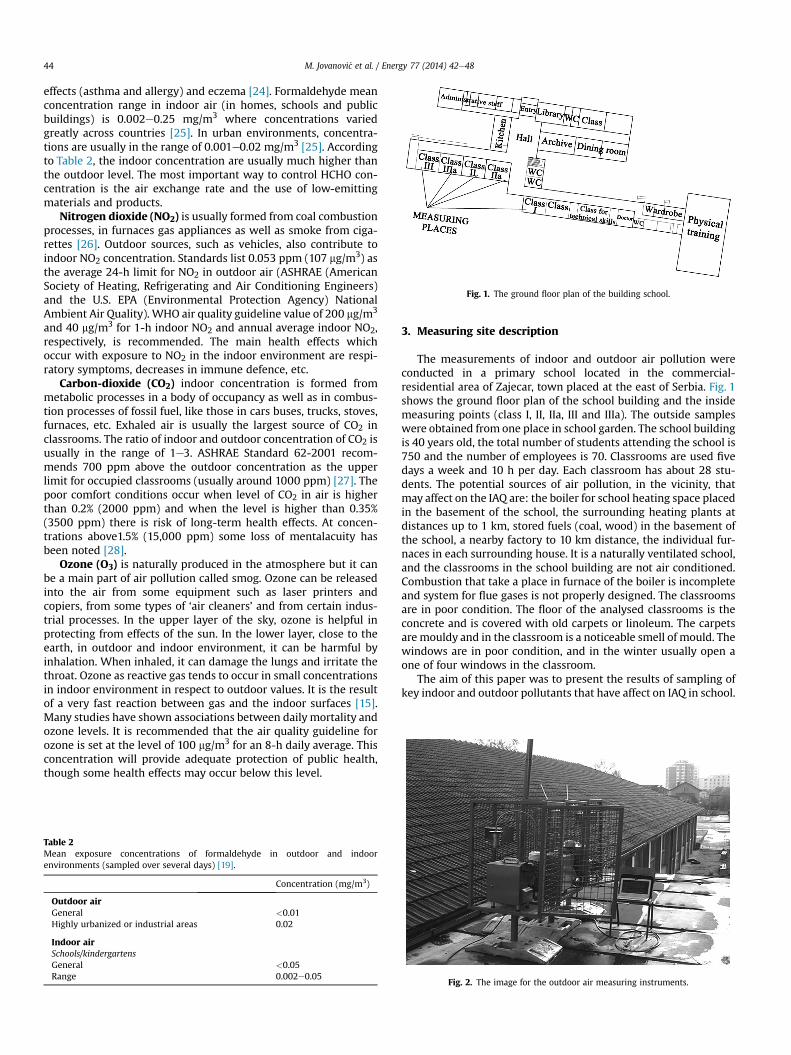
Fig. 1. The ground floor plan of the building school.
M. Jovanovi�c et al. / Energy 77 (2014) 42e4844
effects (asthma and allergy) and eczema [24]. Formaldehyde meanconcentration range in indoor air (in homes, schools and publicbuildings) is 0.002e0.25 mg/m3 where concentrations variedgreatly across countries [25]. In urban environments, concentra-tions are usually in the range of 0.001e0.02 mg/m3 [25]. Accordingto Table 2, the indoor concentration are usually much higher thanthe outdoor level. The most important way to control HCHO con-centration is the air exchange rate and the use of low-emittingmaterials and products.
Nitrogen dioxide (NO2) is usually formed from coal combustionprocesses, in furnaces gas appliances as well as smoke from ciga-rettes [26]. Outdoor sources, such as vehicles, also contribute toindoor NO2 concentration. Standards list 0.053 ppm (107 mg/m3) asthe average 24-h limit for NO2 in outdoor air (ASHRAE (AmericanSociety of Heating, Refrigerating and Air Conditioning Engineers)and the U.S. EPA (Environmental Protection Agency) NationalAmbient Air Quality). WHO air quality guideline value of 200 mg/m3
and 40 mg/m3 for 1-h indoor NO2 and annual average indoor NO2,respectively, is recommended. The main health effects whichoccur with exposure to NO2 in the indoor environment are respi-ratory symptoms, decreases in immune defence, etc.
Carbon-dioxide (CO2) indoor concentration is formed frommetabolic processes in a body of occupancy as well as in combus-tion processes of fossil fuel, like those in cars buses, trucks, stoves,furnaces, etc. Exhaled air is usually the largest source of CO2 inclassrooms. The ratio of indoor and outdoor concentration of CO2 isusually in the range of 1e3. ASHRAE Standard 62-2001 recom-mends 700 ppm above the outdoor concentration as the upperlimit for occupied classrooms (usually around 1000 ppm) [27]. Thepoor comfort conditions occur when level of CO2 in air is higherthan 0.2% (2000 ppm) and when the level is higher than 0.35%(3500 ppm) there is risk of long-term health effects. At concen-trations above1.5% (15,000 ppm) some loss of mentalacuity hasbeen noted [28].
Ozone (O3) is naturally produced in the atmosphere but it canbe a main part of air pollution called smog. Ozone can be releasedinto the air from some equipment such as laser printers andcopiers, from some types of ‘air cleaners’ and from certain indus-trial processes. In the upper layer of the sky, ozone is helpful inprotecting from effects of the sun. In the lower layer, close to theearth, in outdoor and indoor environment, it can be harmful byinhalation. When inhaled, it can damage the lungs and irritate thethroat. Ozone as reactive gas tends to occur in small concentrationsin indoor environment in respect to outdoor values. It is the resultof a very fast reaction between gas and the indoor surfaces [15].Many studies have shown associations between daily mortality andozone levels. It is recommended that the air quality guideline forozone is set at the level of 100 mg/m3 for an 8-h daily average. Thisconcentration will provide adequate protection of public health,though some health effects may occur below this level.
Table 2Mean exposure concentrations of formaldehyde in outdoor and indoorenvironments (sampled over several days) [19].
Concentration (mg/m3)
Outdoor airGeneral <0.01Highly urbanized or industrial areas 0.02
Indoor airSchools/kindergartensGeneral <0.05Range 0.002e0.05
3. Measuring site description
The measurements of indoor and outdoor air pollution wereconducted in a primary school located in the commercial-residential area of Zajecar, town placed at the east of Serbia. Fig. 1shows the ground floor plan of the school building and the insidemeasuring points (class I, II, IIa, III and IIIa). The outside sampleswere obtained from one place in school garden. The school buildingis 40 years old, the total number of students attending the school is750 and the number of employees is 70. Classrooms are used fivedays a week and 10 h per day. Each classroom has about 28 stu-dents. The potential sources of air pollution, in the vicinity, thatmay affect on the IAQ are: the boiler for school heating space placedin the basement of the school, the surrounding heating plants atdistances up to 1 km, stored fuels (coal, wood) in the basement ofthe school, a nearby factory to 10 km distance, the individual fur-naces in each surrounding house. It is a naturally ventilated school,and the classrooms in the school building are not air conditioned.Combustion that take a place in furnace of the boiler is incompleteand system for flue gases is not properly designed. The classroomsare in poor condition. The floor of the analysed classrooms is theconcrete and is covered with old carpets or linoleum. The carpetsare mouldy and in the classroom is a noticeable smell of mould. Thewindows are in poor condition, and in the winter usually open aone of four windows in the classroom.
The aim of this paper was to present the results of sampling ofkey indoor and outdoor pollutants that have affect on IAQ in school.
Fig. 2. The image for the outdoor air measuring instruments.
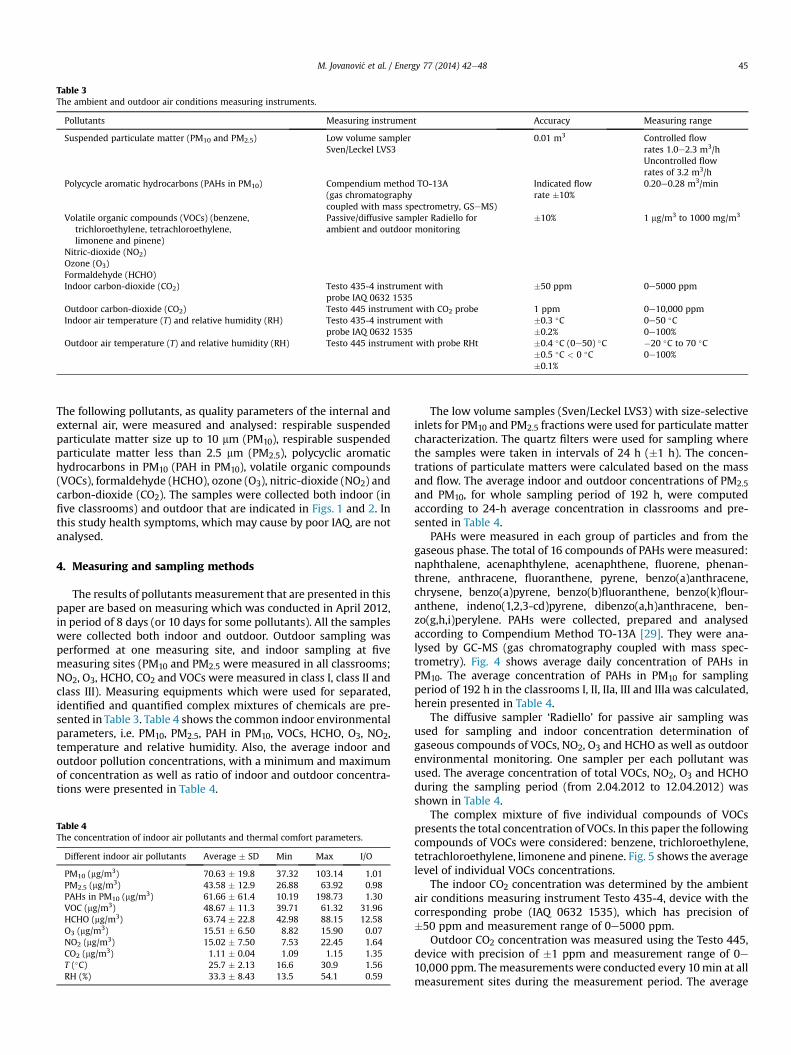
Table 3The ambient and outdoor air conditions measuring instruments.
Pollutants Measuring instrument Accuracy Measuring range
Suspended particulate matter (PM10 and PM2.5) Low volume samplerSven/Leckel LVS3
0.01 m3 Controlled flowrates 1.0e2.3 m3/hUncontrolled flowrates of 3.2 m3/h
Polycycle aromatic hydrocarbons (PAHs in PM10) Compendium method TO-13A(gas chromatographycoupled with mass spectrometry, GSeMS)
Indicated flowrate �10%
0.20e0.28 m3/min
Volatile organic compounds (VOCs) (benzene,trichloroethylene, tetrachloroethylene,limonene and pinene)
Passive/diffusive sampler Radiello forambient and outdoor monitoring
�10% 1 mg/m3 to 1000 mg/m3
Nitric-dioxide (NO2)Ozone (O3)Formaldehyde (HCHO)Indoor carbon-dioxide (CO2) Testo 435-4 instrument with
probe IAQ 0632 1535�50 ppm 0e5000 ppm
Outdoor carbon-dioxide (CO2) Testo 445 instrument with CO2 probe 1 ppm 0e10,000 ppmIndoor air temperature (T) and relative humidity (RH) Testo 435-4 instrument with
probe IAQ 0632 1535�0.3 �C�0.2%
0e50 �C0e100%
Outdoor air temperature (T) and relative humidity (RH) Testo 445 instrument with probe RHt �0.4 �C (0e50) �C�0.5 �C < 0 �C�0.1%
�20 �C to 70 �C0e100%
M. Jovanovi�c et al. / Energy 77 (2014) 42e48 45
The following pollutants, as quality parameters of the internal andexternal air, were measured and analysed: respirable suspendedparticulate matter size up to 10 mm (PM10), respirable suspendedparticulate matter less than 2.5 mm (PM2.5), polycyclic aromatichydrocarbons in PM10 (PAH in PM10), volatile organic compounds(VOCs), formaldehyde (HCHO), ozone (O3), nitric-dioxide (NO2) andcarbon-dioxide (CO2). The samples were collected both indoor (infive classrooms) and outdoor that are indicated in Figs. 1 and 2. Inthis study health symptoms, which may cause by poor IAQ, are notanalysed.
4. Measuring and sampling methods
The results of pollutants measurement that are presented in thispaper are based on measuring which was conducted in April 2012,in period of 8 days (or 10 days for some pollutants). All the sampleswere collected both indoor and outdoor. Outdoor sampling wasperformed at one measuring site, and indoor sampling at fivemeasuring sites (PM10 and PM2.5 were measured in all classrooms;NO2, O3, HCHO, CO2 and VOCs were measured in class I, class II andclass III). Measuring equipments which were used for separated,identified and quantified complex mixtures of chemicals are pre-sented in Table 3. Table 4 shows the common indoor environmentalparameters, i.e. PM10, PM2.5, PAH in PM10, VOCs, HCHO, O3, NO2,temperature and relative humidity. Also, the average indoor andoutdoor pollution concentrations, with a minimum and maximumof concentration as well as ratio of indoor and outdoor concentra-tions were presented in Table 4.
Table 4The concentration of indoor air pollutants and thermal comfort parameters.
Different indoor air pollutants Average � SD Min Max I/O
PM10 (mg/m3) 70.63 � 19.8 37.32 103.14 1.01PM2.5 (mg/m3) 43.58 � 12.9 26.88 63.92 0.98PAHs in PM10 (mg/m3) 61.66 � 61.4 10.19 198.73 1.30VOC (mg/m3) 48.67 � 11.3 39.71 61.32 31.96HCHO (mg/m3) 63.74 � 22.8 42.98 88.15 12.58O3 (mg/m3) 15.51 � 6.50 8.82 15.90 0.07NO2 (mg/m3) 15.02 � 7.50 7.53 22.45 1.64CO2 (mg/m3) 1.11 � 0.04 1.09 1.15 1.35T (�C) 25.7 � 2.13 16.6 30.9 1.56RH (%) 33.3 � 8.43 13.5 54.1 0.59
The low volume samples (Sven/Leckel LVS3) with size-selectiveinlets for PM10 and PM2.5 fractions were used for particulate mattercharacterization. The quartz filters were used for sampling wherethe samples were taken in intervals of 24 h (�1 h). The concen-trations of particulate matters were calculated based on the massand flow. The average indoor and outdoor concentrations of PM2.5and PM10, for whole sampling period of 192 h, were computedaccording to 24-h average concentration in classrooms and pre-sented in Table 4.
PAHs were measured in each group of particles and from thegaseous phase. The total of 16 compounds of PAHs were measured:naphthalene, acenaphthylene, acenaphthene, fluorene, phenan-threne, anthracene, fluoranthene, pyrene, benzo(a)anthracene,chrysene, benzo(a)pyrene, benzo(b)fluoranthene, benzo(k)flour-anthene, indeno(1,2,3-cd)pyrene, dibenzo(a,h)anthracene, ben-zo(g,h,i)perylene. PAHs were collected, prepared and analysedaccording to Compendium Method TO-13A [29]. They were ana-lysed by GC-MS (gas chromatography coupled with mass spec-trometry). Fig. 4 shows average daily concentration of PAHs inPM10. The average concentration of PAHs in PM10 for samplingperiod of 192 h in the classrooms I, II, IIa, III and IIIa was calculated,herein presented in Table 4.
The diffusive sampler ‘Radiello’ for passive air sampling wasused for sampling and indoor concentration determination ofgaseous compounds of VOCs, NO2, O3 and HCHO as well as outdoorenvironmental monitoring. One sampler per each pollutant wasused. The average concentration of total VOCs, NO2, O3 and HCHOduring the sampling period (from 2.04.2012 to 12.04.2012) wasshown in Table 4.
The complex mixture of five individual compounds of VOCspresents the total concentration of VOCs. In this paper the followingcompounds of VOCs were considered: benzene, trichloroethylene,tetrachloroethylene, limonene and pinene. Fig. 5 shows the averagelevel of individual VOCs concentrations.
The indoor CO2 concentration was determined by the ambientair conditions measuring instrument Testo 435-4, device with thecorresponding probe (IAQ 0632 1535), which has precision of�50 ppm and measurement range of 0e5000 ppm.
Outdoor CO2 concentration was measured using the Testo 445,device with precision of �1 ppm and measurement range of 0e10,000 ppm. Themeasurements were conducted every 10min at allmeasurement sites during the measurement period. The average
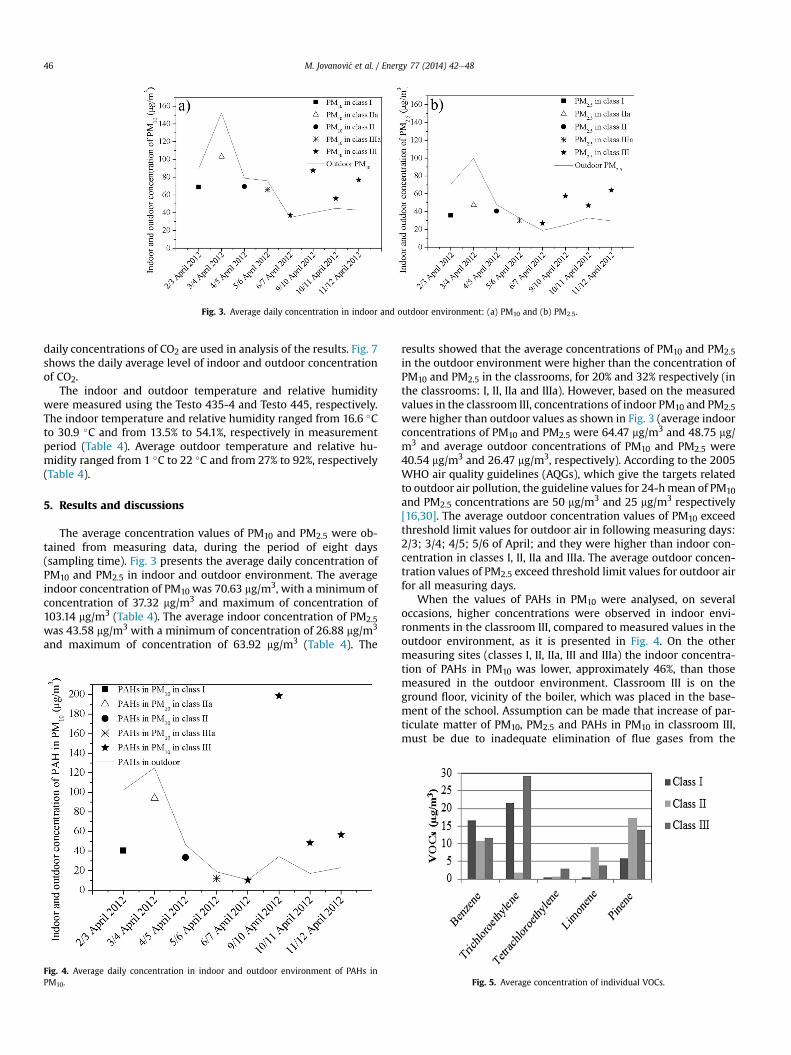
Fig. 3. Average daily concentration in indoor and outdoor environment: (a) PM10 and (b) PM2.5.
M. Jovanovi�c et al. / Energy 77 (2014) 42e4846
daily concentrations of CO2 are used in analysis of the results. Fig. 7shows the daily average level of indoor and outdoor concentrationof CO2.
The indoor and outdoor temperature and relative humiditywere measured using the Testo 435-4 and Testo 445, respectively.The indoor temperature and relative humidity ranged from 16.6 �Cto 30.9 �C and from 13.5% to 54.1%, respectively in measurementperiod (Table 4). Average outdoor temperature and relative hu-midity ranged from 1 �C to 22 �C and from 27% to 92%, respectively(Table 4).
5. Results and discussions
The average concentration values of PM10 and PM2.5 were ob-tained from measuring data, during the period of eight days(sampling time). Fig. 3 presents the average daily concentration ofPM10 and PM2.5 in indoor and outdoor environment. The averageindoor concentration of PM10 was 70.63 mg/m3, with a minimum ofconcentration of 37.32 mg/m3 and maximum of concentration of103.14 mg/m3 (Table 4). The average indoor concentration of PM2.5was 43.58 mg/m3 with a minimum of concentration of 26.88 mg/m3
and maximum of concentration of 63.92 mg/m3 (Table 4). The
Fig. 4. Average daily concentration in indoor and outdoor environment of PAHs inPM10.
results showed that the average concentrations of PM10 and PM2.5in the outdoor environment were higher than the concentration ofPM10 and PM2.5 in the classrooms, for 20% and 32% respectively (inthe classrooms: I, II, IIa and IIIa). However, based on the measuredvalues in the classroom III, concentrations of indoor PM10 and PM2.5were higher than outdoor values as shown in Fig. 3 (average indoorconcentrations of PM10 and PM2.5 were 64.47 mg/m3 and 48.75 mg/m3 and average outdoor concentrations of PM10 and PM2.5 were40.54 mg/m3 and 26.47 mg/m3, respectively). According to the 2005WHO air quality guidelines (AQGs), which give the targets relatedto outdoor air pollution, the guideline values for 24-hmean of PM10and PM2.5 concentrations are 50 mg/m3 and 25 mg/m3 respectively[16,30]. The average outdoor concentration values of PM10 exceedthreshold limit values for outdoor air in following measuring days:2/3; 3/4; 4/5; 5/6 of April; and they were higher than indoor con-centration in classes I, II, IIa and IIIa. The average outdoor concen-tration values of PM2.5 exceed threshold limit values for outdoor airfor all measuring days.
When the values of PAHs in PM10 were analysed, on severaloccasions, higher concentrations were observed in indoor envi-ronments in the classroom III, compared to measured values in theoutdoor environment, as it is presented in Fig. 4. On the othermeasuring sites (classes I, II, IIa, III and IIIa) the indoor concentra-tion of PAHs in PM10 was lower, approximately 46%, than thosemeasured in the outdoor environment. Classroom III is on theground floor, vicinity of the boiler, which was placed in the base-ment of the school. Assumption can be made that increase of par-ticulate matter of PM10, PM2.5 and PAHs in PM10 in classroom III,must be due to inadequate elimination of flue gases from the
Fig. 5. Average concentration of individual VOCs.
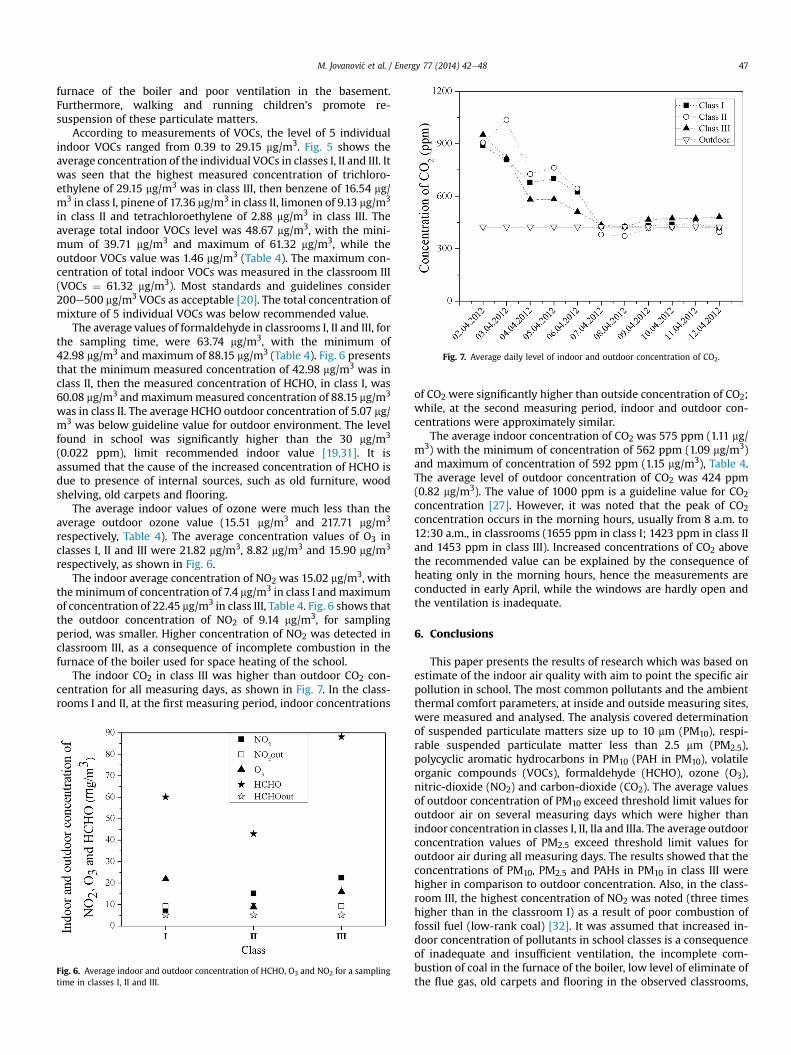
Fig. 7. Average daily level of indoor and outdoor concentration of CO2.
M. Jovanovi�c et al. / Energy 77 (2014) 42e48 47
furnace of the boiler and poor ventilation in the basement.Furthermore, walking and running children’s promote re-suspension of these particulate matters.
According to measurements of VOCs, the level of 5 individualindoor VOCs ranged from 0.39 to 29.15 mg/m3. Fig. 5 shows theaverage concentration of the individual VOCs in classes I, II and III. Itwas seen that the highest measured concentration of trichloro-ethylene of 29.15 mg/m3 was in class III, then benzene of 16.54 mg/m3 in class I, pinene of 17.36 mg/m3 in class II, limonen of 9.13 mg/m3
in class II and tetrachloroethylene of 2.88 mg/m3 in class III. Theaverage total indoor VOCs level was 48.67 mg/m3, with the mini-mum of 39.71 mg/m3 and maximum of 61.32 mg/m3, while theoutdoor VOCs value was 1.46 mg/m3 (Table 4). The maximum con-centration of total indoor VOCs was measured in the classroom III(VOCs ¼ 61.32 mg/m3). Most standards and guidelines consider200e500 mg/m3 VOCs as acceptable [20]. The total concentration ofmixture of 5 individual VOCs was below recommended value.
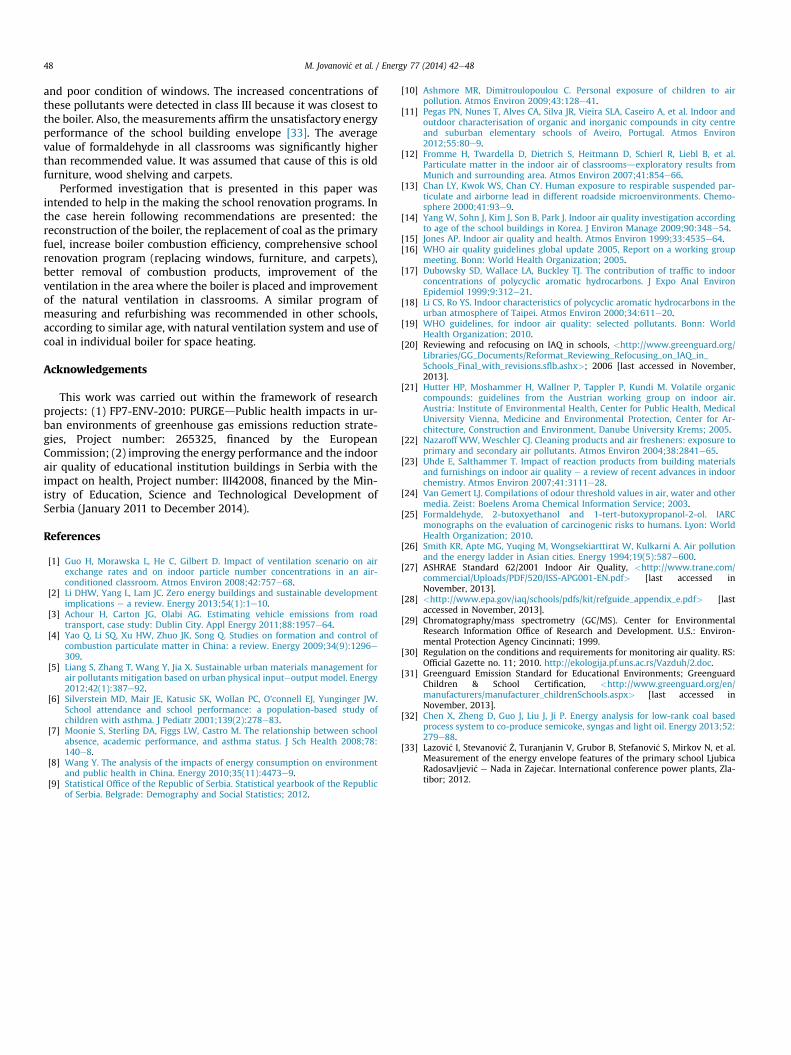
The average values of formaldehyde in classrooms I, II and III, forthe sampling time, were 63.74 mg/m3, with the minimum of42.98 mg/m3 and maximum of 88.15 mg/m3 (Table 4). Fig. 6 presentsthat the minimum measured concentration of 42.98 mg/m3 was inclass II, then the measured concentration of HCHO, in class I, was60.08 mg/m3 andmaximummeasured concentration of 88.15 mg/m3
was in class II. The average HCHO outdoor concentration of 5.07 mg/m3 was below guideline value for outdoor environment. The levelfound in school was significantly higher than the 30 mg/m3
(0.022 ppm), limit recommended indoor value [19,31]. It isassumed that the cause of the increased concentration of HCHO isdue to presence of internal sources, such as old furniture, woodshelving, old carpets and flooring.
The average indoor values of ozone were much less than theaverage outdoor ozone value (15.51 mg/m3 and 217.71 mg/m3
respectively, Table 4). The average concentration values of O3 inclasses I, II and III were 21.82 mg/m3, 8.82 mg/m3 and 15.90 mg/m3
respectively, as shown in Fig. 6.The indoor average concentration of NO2 was 15.02 mg/m3, with
theminimum of concentration of 7.4 mg/m3 in class I andmaximumof concentration of 22.45 mg/m3 in class III, Table 4. Fig. 6 shows thatthe outdoor concentration of NO2 of 9.14 mg/m3, for samplingperiod, was smaller. Higher concentration of NO2 was detected inclassroom III, as a consequence of incomplete combustion in thefurnace of the boiler used for space heating of the school.
The indoor CO2 in class III was higher than outdoor CO2 con-centration for all measuring days, as shown in Fig. 7. In the class-rooms I and II, at the first measuring period, indoor concentrations
Fig. 6. Average indoor and outdoor concentration of HCHO, O3 and NO2 for a samplingtime in classes I, II and III.
of CO2 were significantly higher than outside concentration of CO2;while, at the second measuring period, indoor and outdoor con-centrations were approximately similar.
The average indoor concentration of CO2 was 575 ppm (1.11 mg/m3) with the minimum of concentration of 562 ppm (1.09 mg/m3)and maximum of concentration of 592 ppm (1.15 mg/m3), Table 4.The average level of outdoor concentration of CO2 was 424 ppm(0.82 mg/m3). The value of 1000 ppm is a guideline value for CO2concentration [27]. However, it was noted that the peak of CO2concentration occurs in the morning hours, usually from 8 a.m. to12:30 a.m., in classrooms (1655 ppm in class I; 1423 ppm in class IIand 1453 ppm in class III). Increased concentrations of CO2 abovethe recommended value can be explained by the consequence ofheating only in the morning hours, hence the measurements areconducted in early April, while the windows are hardly open andthe ventilation is inadequate.
6. Conclusions
This paper presents the results of research which was based onestimate of the indoor air quality with aim to point the specific airpollution in school. The most common pollutants and the ambientthermal comfort parameters, at inside and outside measuring sites,were measured and analysed. The analysis covered determinationof suspended particulate matters size up to 10 mm (PM10), respi-rable suspended particulate matter less than 2.5 mm (PM2.5),polycyclic aromatic hydrocarbons in PM10 (PAH in PM10), volatileorganic compounds (VOCs), formaldehyde (HCHO), ozone (O3),nitric-dioxide (NO2) and carbon-dioxide (CO2). The average valuesof outdoor concentration of PM10 exceed threshold limit values foroutdoor air on several measuring days which were higher thanindoor concentration in classes I, II, IIa and IIIa. The average outdoorconcentration values of PM2.5 exceed threshold limit values foroutdoor air during all measuring days. The results showed that theconcentrations of PM10, PM2.5 and PAHs in PM10 in class III werehigher in comparison to outdoor concentration. Also, in the class-room III, the highest concentration of NO2 was noted (three timeshigher than in the classroom I) as a result of poor combustion offossil fuel (low-rank coal) [32]. It was assumed that increased in-door concentration of pollutants in school classes is a consequenceof inadequate and insufficient ventilation, the incomplete com-bustion of coal in the furnace of the boiler, low level of eliminate ofthe flue gas, old carpets and flooring in the observed classrooms,
M. Jovanovi�c et al. / Energy 77 (2014) 42e4848
and poor condition of windows. The increased concentrations ofthese pollutants were detected in class III because it was closest tothe boiler. Also, the measurements affirm the unsatisfactory energyperformance of the school building envelope [33]. The averagevalue of formaldehyde in all classrooms was significantly higherthan recommended value. It was assumed that cause of this is oldfurniture, wood shelving and carpets.
Performed investigation that is presented in this paper wasintended to help in the making the school renovation programs. Inthe case herein following recommendations are presented: thereconstruction of the boiler, the replacement of coal as the primaryfuel, increase boiler combustion efficiency, comprehensive schoolrenovation program (replacing windows, furniture, and carpets),better removal of combustion products, improvement of theventilation in the area where the boiler is placed and improvementof the natural ventilation in classrooms. A similar program ofmeasuring and refurbishing was recommended in other schools,according to similar age, with natural ventilation system and use ofcoal in individual boiler for space heating.
Acknowledgements
This work was carried out within the framework of researchprojects: (1) FP7-ENV-2010: PURGEdPublic health impacts in ur-ban environments of greenhouse gas emissions reduction strate-gies, Project number: 265325, financed by the EuropeanCommission; (2) improving the energy performance and the indoorair quality of educational institution buildings in Serbia with theimpact on health, Project number: III42008, financed by the Min-istry of Education, Science and Technological Development ofSerbia (January 2011 to December 2014).
References
[1] Guo H, Morawska L, He C, Gilbert D. Impact of ventilation scenario on airexchange rates and on indoor particle number concentrations in an air-conditioned classroom. Atmos Environ 2008;42:757e68.
[2] Li DHW, Yang L, Lam JC. Zero energy buildings and sustainable developmentimplications e a review. Energy 2013;54(1):1e10.
[3] Achour H, Carton JG, Olabi AG. Estimating vehicle emissions from roadtransport, case study: Dublin City. Appl Energy 2011;88:1957e64.
[4] Yao Q, Li SQ, Xu HW, Zhuo JK, Song Q. Studies on formation and control ofcombustion particulate matter in China: a review. Energy 2009;34(9):1296e309.
[5] Liang S, Zhang T, Wang Y, Jia X. Sustainable urban materials management forair pollutants mitigation based on urban physical inputeoutput model. Energy2012;42(1):387e92.
[6] Silverstein MD, Mair JE, Katusic SK, Wollan PC, O’connell EJ, Yunginger JW.School attendance and school performance: a population-based study ofchildren with asthma. J Pediatr 2001;139(2):278e83.
[7] Moonie S, Sterling DA, Figgs LW, Castro M. The relationship between schoolabsence, academic performance, and asthma status. J Sch Health 2008;78:140e8.
[8] Wang Y. The analysis of the impacts of energy consumption on environmentand public health in China. Energy 2010;35(11):4473e9.
[9] Statistical Office of the Republic of Serbia. Statistical yearbook of the Republicof Serbia. Belgrade: Demography and Social Statistics; 2012.
[10] Ashmore MR, Dimitroulopoulou C. Personal exposure of children to airpollution. Atmos Environ 2009;43:128e41.
[11] Pegas PN, Nunes T, Alves CA, Silva JR, Vieira SLA, Caseiro A, et al. Indoor andoutdoor characterisation of organic and inorganic compounds in city centreand suburban elementary schools of Aveiro, Portugal. Atmos Environ2012;55:80e9.
[12] Fromme H, Twardella D, Dietrich S, Heitmann D, Schierl R, Liebl B, et al.Particulate matter in the indoor air of classroomsdexploratory results fromMunich and surrounding area. Atmos Environ 2007;41:854e66.
[13] Chan LY, Kwok WS, Chan CY. Human exposure to respirable suspended par-ticulate and airborne lead in different roadside microenvironments. Chemo-sphere 2000;41:93e9.
[14] Yang W, Sohn J, Kim J, Son B, Park J. Indoor air quality investigation accordingto age of the school buildings in Korea. J Environ Manage 2009;90:348e54.
[15] Jones AP. Indoor air quality and health. Atmos Environ 1999;33:4535e64.[16] WHO air quality guidelines global update 2005, Report on a working group
meeting. Bonn: World Health Organization; 2005.[17] Dubowsky SD, Wallace LA, Buckley TJ. The contribution of traffic to indoor
concentrations of polycyclic aromatic hydrocarbons. J Expo Anal EnvironEpidemiol 1999;9:312e21.
[18] Li CS, Ro YS. Indoor characteristics of polycyclic aromatic hydrocarbons in theurban atmosphere of Taipei. Atmos Environ 2000;34:611e20.
[19] WHO guidelines, for indoor air quality: selected pollutants. Bonn: WorldHealth Organization; 2010.
[20] Reviewing and refocusing on IAQ in schools, <http://www.greenguard.org/Libraries/GG_Documents/Reformat_Reviewing_Refocusing_on_IAQ_in_Schools_Final_with_revisions.sflb.ashx>; 2006 [last accessed in November,2013].
[21] Hutter HP, Moshammer H, Wallner P, Tappler P, Kundi M. Volatile organiccompounds: guidelines from the Austrian working group on indoor air.Austria: Institute of Environmental Health, Center for Public Health, MedicalUniversity Vienna, Medicine and Environmental Protection, Center for Ar-chitecture, Construction and Environment, Danube University Krems; 2005.
[22] Nazaroff WW, Weschler CJ. Cleaning products and air fresheners: exposure toprimary and secondary air pollutants. Atmos Environ 2004;38:2841e65.
[23] Uhde E, Salthammer T. Impact of reaction products from building materialsand furnishings on indoor air quality e a review of recent advances in indoorchemistry. Atmos Environ 2007;41:3111e28.
[24] Van Gemert LJ. Compilations of odour threshold values in air, water and othermedia. Zeist: Boelens Aroma Chemical Information Service; 2003.
[25] Formaldehyde, 2-butoxyethanol and 1-tert-butoxypropanol-2-ol. IARCmonographs on the evaluation of carcinogenic risks to humans. Lyon: WorldHealth Organization; 2010.
[26] Smith KR, Apte MG, Yuqing M, Wongsekiarttirat W, Kulkarni A. Air pollutionand the energy ladder in Asian cities. Energy 1994;19(5):587e600.
[27] ASHRAE Standard 62/2001 Indoor Air Quality, <http://www.trane.com/commercial/Uploads/PDF/520/ISS-APG001-EN.pdf> [last accessed inNovember, 2013].
[28] <http://www.epa.gov/iaq/schools/pdfs/kit/refguide_appendix_e.pdf> [lastaccessed in November, 2013].
[29] Chromatography/mass spectrometry (GC/MS). Center for EnvironmentalResearch Information Office of Research and Development. U.S.: Environ-mental Protection Agency Cincinnati; 1999.
[30] Regulation on the conditions and requirements for monitoring air quality. RS:Official Gazette no. 11; 2010. http://ekologija.pf.uns.ac.rs/Vazduh/2.doc.
[31] Greenguard Emission Standard for Educational Environments; GreenguardChildren & School Certification, <http://www.greenguard.org/en/manufacturers/manufacturer_childrenSchools.aspx> [last accessed inNovember, 2013].
[32] Chen X, Zheng D, Guo J, Liu J, Ji P. Energy analysis for low-rank coal basedprocess system to co-produce semicoke, syngas and light oil. Energy 2013;52:279e88.
[33] Lazovi�c I, Stevanovi�c �Z, Turanjanin V, Grubor B, Stefanovi�c S, Mirkov N, et al.Measurement of the energy envelope features of the primary school LjubicaRadosavljevi�c e Nada in Zaje�car. International conference power plants, Zla-tibor; 2012.