Embed Size (px)
Citation preview
Investigation of Graphene as a Powder and in a Resin Coating
by
Nam NGUYEN
THESIS PRESENTED TO ÉCOLE DE TECHNOLOGIE SUPÉRIEURE IN PARTIAL FULFILLMENT FOR A MASTER DEGREE
WITH THESIS IN CONSTRUCTION ENGINEERING M.A.Sc.
MONTREAL, JULY 10TH, 2019
ÉCOLE DE TECHNOLOGIE SUPÉRIEURE UNIVERSITÉ DU QUÉBEC
Nam Nguyen, 2019

This Creative Commons licence allows readers to download this work and share it with others as long as the
author is credited. The content of this work can’t be modified in any way or used commercially.
BOARD OF EXAMINERS
THIS THESIS HAS BEEN EVALUATED
BY THE FOLLOWING BOARD OF EXAMINERS Mme Claudiane Ouellet Plamondon, Thesis Supervisor Department of Construction Engineering, École de technologie supérieure Mr. Ali Motamedi, President of the Board of Examiners Department of Construction Engineering, École de technologie supérieure Mr. Éric David, Member of the jury Department of Mechanical Engineering, École de technologie supérieure
THIS THESIS WAS PRENSENTED AND DEFENDED
IN THE PRESENCE OF A BOARD OF EXAMINERS AND PUBLIC
ON JUNE 10, 2019
AT ÉCOLE DE TECHNOLOGIE SUPÉRIEURE


ACKNOWLEDGMENT
Firstly, I would like to thank my supervisor Professor Claudiane Ouellet Plamondon,
Professor Éric David and Dr Phuong Tri-Nguyen for the long-term collaboration and the help
with building up my academic career with their patience, their support and guidance of my
master thesis. Throughout my entire Masters, I greatly enjoy my research and life in the
Claudiane’s group.
A special thanks to all my colleagues and technicians: Mr. Xuan Dai Nguyen, Mrs. Khouloud
Jhimi, Mrs. Nancy Milena Sacristan Celys, Mr. Anas Himmad, Mr. Victor Brial, Mr. Honoré
Kuate Togue, Mr. Michael Di Mare, Mr. Michael Dubois, Mr. Nabil Mazeghrane, and Mr.
Radu Romanica, for the help even during my challenging times.
I would like to thank Mrs. Thi Quynh Nga Vu, Mr. Tuan Tran Anh, Mr. Duc Hoang Minh
and their family for the guide of my life in Montréal throughout my Masters study just like
my family.
This project was made possible thanks to NanoXplore and especially École de technologie
supérieure.
Finally, I would like to give my deepest thanks my parents and friends for their endless love
and support. Last but not least, massive thanks to my brother Mr. Sang Nguyen and my
beloved girl-friend Ms. Tra, who I shared a lot of significant time and their support was
invaluable to me.

Étude du graphène sous forme de poudre et dans un revêtement de résine
Nam NGUYEN
RÉSUMÉ Le graphène est une monocouche à deux dimensions d’atomes de carbone organisée en réseau hexagonal. La feuille de route d’application du graphène montre qu’il s’agit d’une technologie potentiellement perturbatrice. NanoXplore a déjà produit plusieurs générations de graphène et le produit récent est le graphène noir 3X, un graphène de 6 à 10 couches. Dans la présente étude, en montrant l’incorporation de feuilles de graphène dans une matrice de résine vinylique, nous montrons qu’il est possible de fabriquer des revêtements conducteurs à faible teneur en graphène à haute stabilité thermique. L’analyse thermogravimetrique montre que ces nanocomposites peuvent être utilisés à une temperature inféreure a 300oC sans décomposition chimique. Les revêtements conducteurs peuvent être obtenus en ajoutant seulement 5% de graphène. La valeur de conductivité la plus élevée est 3,7 x 10⁻² S/cm avec 20% en poids de G3X, suffisamment élevée pour divers dispositifs électriques. De plus, l’analyse morphologique par SEM et AFM a révélé une distribution uniforme du graphène noir 3X dans la matrice polymere et l’épassseur des feuilles de graphène. Les propriétés mécaniques peuvent être augmentées 1.5 fois en comparant les 5% et 7% en poids de charge de graphène du composite. Cette augmentation est exceptionnelle et rarement mentionnée dans littérature pour ce type de revêtement. Mots-clés: Nanocomposites, nanomatériaux, résines vinylester, graphène, morphologie, conductivité électrique

Investigation of graphene as a powder and in a resin coating
Nam NGUYEN
ABSTRACT
Graphene is two-dimension monolayers of carbon atoms organized in a hexagonal lattice. The road map of application of graphene shows that this is a potentially disruptive technology. NanoXplore already produced several generations of graphene and the recent product is the Graphene Black 3X, a 6-10 layers’ graphene. In the present investigation, by incorporating black 3X graphene sheets into a vinyl resin matrix, we show that is possible to fabricate low graphene content conductive coatings with high thermal stability. TGA analysis shows that these nanocomposites can be used at a temperature lower than 300oC without any chemical decomposition. The conductive coatings can be achieved with the addition of only 5 wt.% of graphene. The highest value of conductivity is found to be 3.7 x 10⁻² S/cm with 20 wt.% of G3X, sufficiently high for various electrical devices. Furthermore, the morphological analysis by SEM and AFM revealed uniform distribution of black 3X graphene within the polymer matrix and the thickness of graphene sheets. The mechanical properties can be increased 1.5 times comparing 5 wt.% and 7 wt.& loading of the graphene of the composite. This increment is exceptional high and rarely reported in the literature for this kind of coating. Keywords: Nanocomposites, Nanomaterial, Vinyl ester resins, Graphene, morphology, Electrical conductivity

TABLE OF CONTENTS
Page
INTRODUCTION .....................................................................................................................1
CHAPTER 1 LITERATURE REVIEW ..............................................................................5 1.1 Introduction ....................................................................................................................5 1.2 Materials ........................................................................................................................6
1.2.1 Plastic classification ..................................................................................... 6 1.2.2 Thermoset polymer and resins ..................................................................... 9 1.2.3 Vinyl ester resin.......................................................................................... 11 1.2.4 Graphene .................................................................................................... 13
1.3 Fabrication and characterization methods ...................................................................19 1.3.1 High shear mixer ........................................................................................ 19 1.3.2 Morphological studies ................................................................................ 20 1.3.3 Fourier Transform Infrared (FTIR) spectroscopy ...................................... 23 1.3.4 Thermal properties ..................................................................................... 24 1.3.5 Tensile property .......................................................................................... 25 1.3.6 Electrical properties .................................................................................... 25
1.4 Review of the measured properties of polymer composites with graphene ................29 1.5 Application of vinyl ester resin and graphene in coating ............................................31
CHAPTER 2 MATERIALS AND METHODS ................................................................33 2.1 Introduction ..................................................................................................................33 2.2 Materials ......................................................................................................................34
2.2.1 Vinyl ester resin.......................................................................................... 34 2.2.2 Hardener ..................................................................................................... 34 2.2.3 Graphene .................................................................................................... 35
2.3 Processing the preparation of vinyl ester resin/graphene composites .........................37 2.4 Test methods ................................................................................................................38
2.4.1 Electrical properties measurements of graphene black 3X and OX ........... 38 2.4.2 Scanning electron microscopy.................................................................... 39 2.4.3 Atomic force microscope ........................................................................... 40 2.4.4 Thermogravimetric Analysis ...................................................................... 41 2.4.5 Mechanical properties ................................................................................ 42 2.4.6 Broadband dielectric spectroscopy ............................................................. 43 2.4.7 Four-point probe ......................................................................................... 44
CHAPTER 3 RESULTS AND DISCUSSIONS................................................................46 3.1 Introduction ..................................................................................................................46 3.2 Results and discussions ................................................................................................46
3.2.1 Electrical conductivity of 3X and OX graphene under compression ......... 46 3.2.2 Morphological studies ................................................................................ 49
XII
3.2.3 Thermal properties ..................................................................................... 54 3.2.4 Mechanical properties ................................................................................ 57 3.2.5 Electrical properties .................................................................................... 59
CONCLUSION ........................................................................................................................60
RECOMMENDATIONS .........................................................................................................61
BIBLIOGRAPHY ....................................................................................................................73

LIST OF TABLES
Page
Table 1.1 Summary of construction material applications for thermoset resins ....................................................................................10
Table 1.2 Compare three main of thermoset polymers ..............................................11
Table 1.3 Mechanical properties of different grapahene derivatives .........................17
Table 1.4 Literature review on electrical conductivity of different graphene derivatives ....................................................................18
Table 1.5 Literature review on thermal conductivity of different graphene derivatives produced by various methods ..................................19
Table 1.6 Literature review on different nanocomposites showing the tensile .....................................................................................29
Table 1.7 Literature review on electrical conductivity ..............................................30
Table 1.8 Literature review on polymer graphene nanocomposites ..........................30
Table 2.1 Characteristics of the vinyl ester resin .......................................................34
Table 2.2 Physical properties of graphene black 3X .................................................36
Table 2.3 The graphene black 3X chemical composition values ...............................36
Table 2.4 The proportion of vinyl ester resin and graphene black 3X .......................38
Table 2.5 Measurement of body resistivity ρ on thin samples of thickness t and spacing s ........................................................................45
Table 3.1 TGA data of prepared samples ..................................................................56
Table 3.2 The tensile strength of the nanocomposites ...............................................58

LIST OF FIGURES
Page
Figure 1.1 The main categories of polymers .................................................................7
Figure 1.2 The proportion of global use of plastics ......................................................8
Figure 1.3 Chemical structure composition of vinyl ester resins ................................12
Figure 1.4 The structure and main properties of graphene-based materials ...........................................................................14
Figure 1.5 The 3D structure of graphene layer ...........................................................14
Figure 1.6 The summary of synthesis techniques for graphene ..................................16
Figure 1.7 Schematic four-point probe and BDS ........................................................27
Figure 2.1 The overview of the experimental procedure ............................................33
Figure 2.2 Chemical structure of MEKP .....................................................................35
Figure 2.3 The application of graphene black 3X in the industry ...............................36
Figure 2.4 Fabrication process of vinyl ester resin/graphene black 3X composite ....................................................................................37
Figure 2.5 The composite samples based on VSR and various G3X contents .............................................................................................38
Figure 2.6 The SEM model Su-8230, FE-SEM equipment in ÉTS laboratory .......................................................................................40
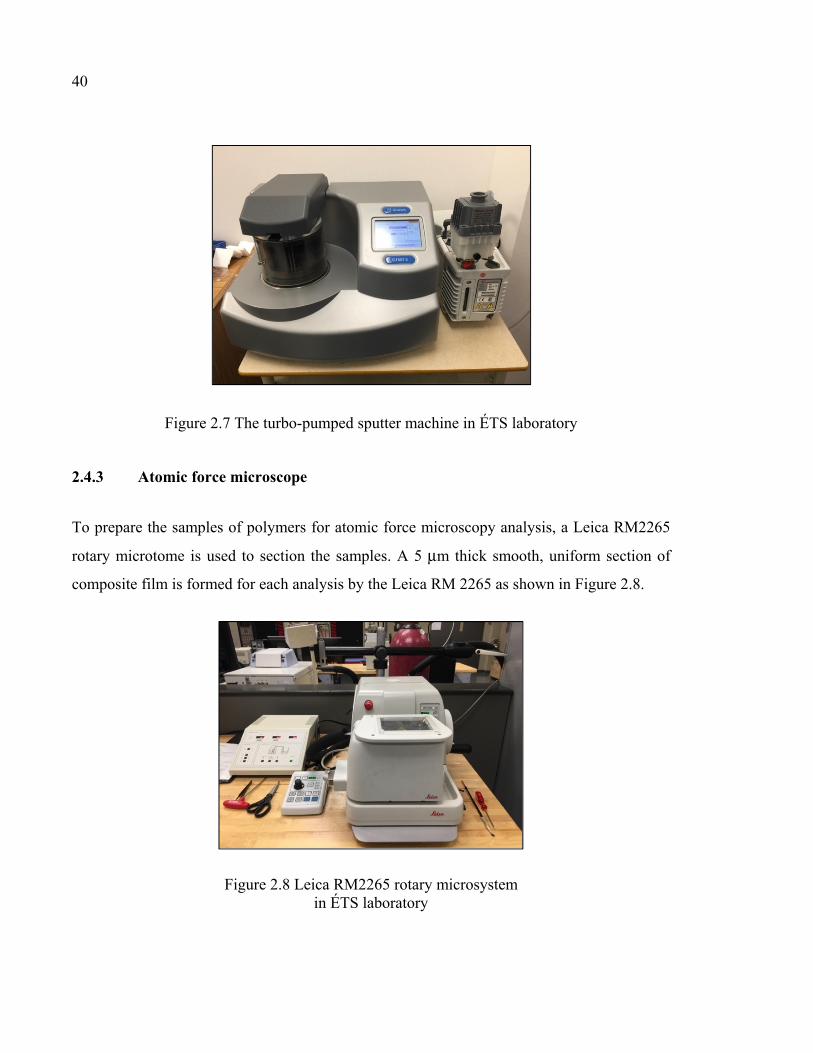
Figure 2.7 The turbo-pumped sputter machine in ÉTS laboratory ..............................40
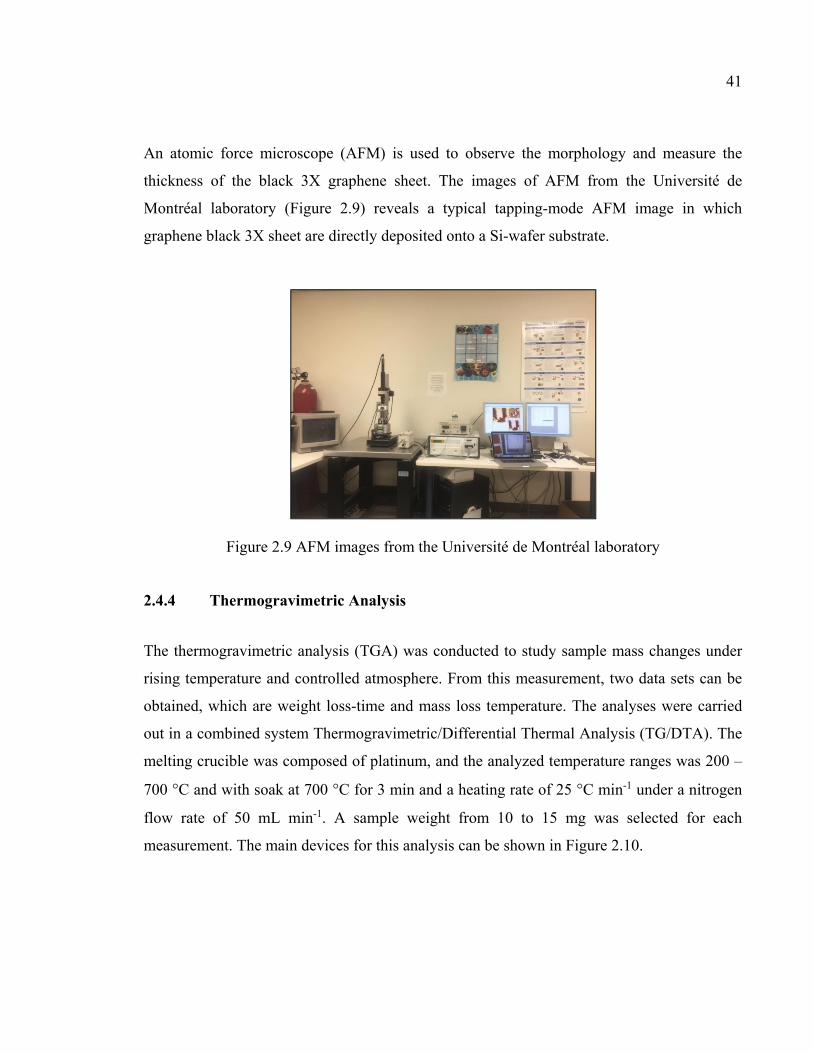
Figure 2.8 Leica RM2265 rotary microsystem in ÉTS laboratory ..............................41
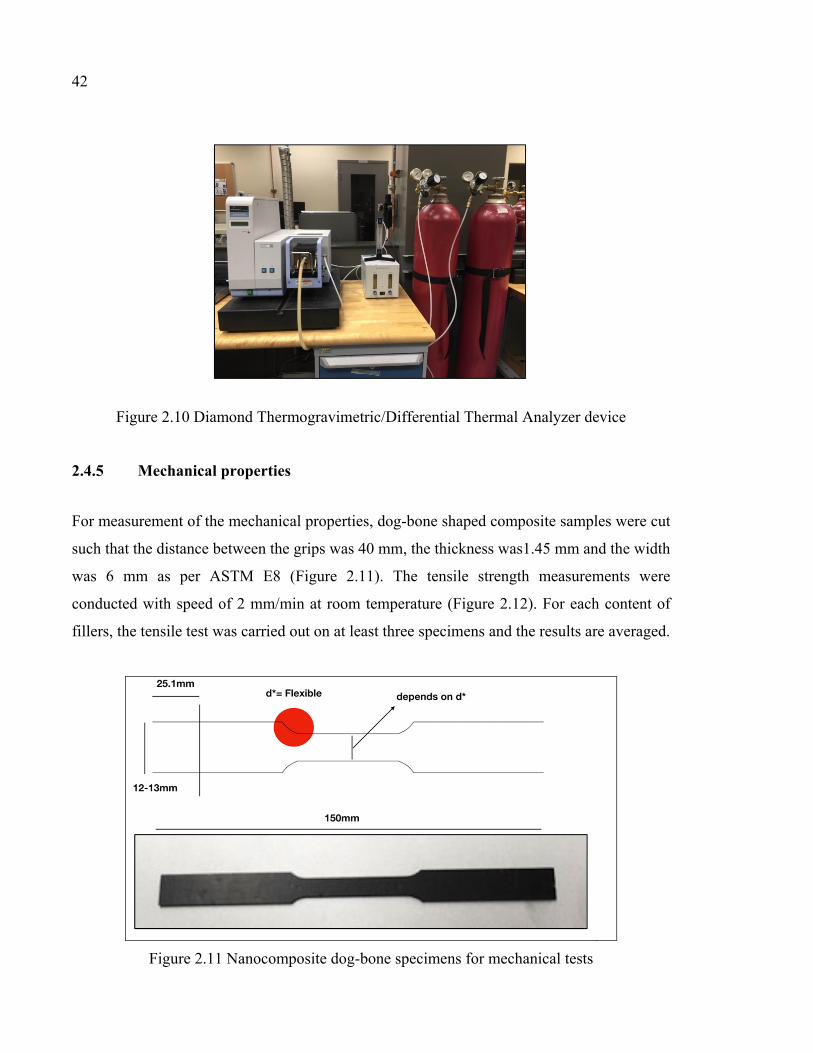
Figure 2.9 AFM images from the Université de Montréal laboratory ........................41
Figure 2.10 Diamond Thermogravimetric/Differential Thermal Analyzer device ...........................................................................42
Figure 2.11 Nanocomposite dog-bone specimens for mechanical tests ........................43
XVI
Figure 2.12 Tensile strength measurement equipment used in this work ................................................................................................43
Figure 2.13 Images showing main devices for BDS technique ....................................44
Figure 2.14 Four-point probe collinear probe resistivity method .................................45
Figure 3.1 Electrical conductivity versus pressure of two types of graphene .............48
Figure 3.2 AFM image of graphene black 3X with 500x500 nm ...............................50
Figure 3.3 AFM images of VSR_20%G with 3x3μm .................................................51
Figure 3.4 SEM images of cross section of the composites ........................................53
Figure 3.5 SEM images of structure characteristics of black 3X graphene in vinyl ester matrix ..............................................................54
Figure 3.6 TGA curves of neat G3X, neat resin and VSR/G3X composites ...............................................................................56
Figure 3.7 TGA thermograms of the derivative of mass loss as a function of temperature ..............................................................57
Figure 3.8 Representatives stress-strain curves of the composites with different graphene black 3X contents ................................................58
Figure 3.9 Electrical properties by four point probe test of VSR_G3X ......................59
Figure 3.10 Modulus of VSR_G3X complex conductivity as function of frequency .............................................................................61
Figure 3.11 Modulus of VSR_G3X complex conductivity as function of frequency .............................................................................61
LIST OF ABREVIATIONS 3D Three dimensional AC Alternating current AFM Atomic force microscopy BDS Broadband dielectric spectroscopy Bio_GOX Bio-epoxy resin_Graphene OX CVD Chemical vapour deposition DC Direct current (DC) DTG Derivative thermogravimetry EC Electrical conductivity EMI Electromagnetic interference shielding (EMI) ESD Electrostatic discharge eV Electron volt EVA Ethylene vinyl acetate fGO Functionalised graphene oxide frGO Functionalised reduced graphene oxide FTIR Fourier transform infrared spectroscopy G3X Graphene black 3X GNS Graphene nanosheets GO Graphene oxide GOX Graphene black OX Gr Graphene HDPE High density polyethylene
XVIII
LDPE Low density polyethylene LLDPE Linear low density polyethylene MEK Methyl ethyl ketone MEKP Methyl ethyl ketone peroxide N Newton OBRC Online bioinformatics resources collection Pa Pascal PA Polyamide PC Polycarbonate PE Polyethylene PET Polyethylene terephthalate PP Polypropylene PS Polystyrene PVA polyvinyl alcohol PVC Polyvinyl chloride PVDF Polyvinylidene difluoride rGO Reduced graphene oxide SEM Scanning electron microscope SERS Surface-enhanced Raman spectroscopy TG/DTA Thermogravimetric/Differential Thermal Analysis TGA Thermogravimetric analysis TrGO Thermally reduced graphene oxide UTS Ultimate tensile strength

XIX
UV Ultraviolet VE Vinyl ester VSR Vinyl ester resin VSR+H Vinyl ester resin and Hardener


LIST OF SYMBOLS A Area of the piston surface (cm2)
F Correction factor
I Current (mA)
L Sample distance (cm)
nm Nanometre oC Degree Celsius
P Pressure (Pa)
s Distance between the probes (mm)
sp2 Hybridized atoms in sigma and pi bonding
t Film thickness (mm)
V Applied voltage (mV)
wt.% Weight percentage
ρ Resistivity (Ωcm)
R Resistance (Ω)
ρs Resistivity of sample (Ωcm)
σ Electrical conductivity (S/m)

INTRODUCTION The capability to synthesize nanoparticles of diverse materials, sizes and shapes associated
with the ability to assemble them efficiently into complicated structures makes a significant
breakthrough in the area of nanoscience (Evanoff Jr. et Chumanov, 2005). The structural
characteristics allow nanomaterials to possess a large variety of applications. However,
different types of materials owning advanced physicochemical properties were thoroughly
investigated to be more dimensionally compatible in the field of nanoscience and technology.
The exploration of graphene and graphene-based polymer nanocomposites has consequently
become essential in the field of nanoscience particularly and in the era of science and
technology (Stankovich et al., 2006).
There has been an increasingly positive concern about polymer nanocomposites in the recent
years thanks to their improved properties derived from the reinforcement of nanofillers (Kim,
Abdala et Macosko, 2010; Potts et al., 2011). In comparison with the conventional micron
scale fillers, the properties of the composites are considerably influenced by the dispersion of
the nanofilleres inside the polymer matrix (Kuilla et al., 2010). Graphene is a one-atom-thick
planar sheet of sp2-bonded carbon atoms and emerges as a potentially multifunctional
nanofiller owning to its range of strengths, namely exceptionally high electrical and thermal
conductivities, enormous mechanical properties and affordably-priced manufacture. It is
additionally seen as the “thinnest material in the universe” with a great potential for different
applications (Dreyer et al., 2010; Si et Samulski, 2008).
NanoXplore is a company located in Montreal and it has expertise on graphene commercial
at a low cost, large volume and highly scalable. Graphene is two-dimension monolayers of
carbon atoms organized in a hexagonal lattice. The road map of application of graphene
shows that this is a potentially disruptive technology. NanoXplore already produced several
generations of graphene and the recent product is the Graphene Black 3X, a 6-10 layers’
graphene. The potential applications are various, including heat dissipation, EMI shielding,
gas barriers, UV resistance, conductive inks and coatings, battery electrodes, smart
2
composites, electrostatic discharge (ESD) and anti-static. Graphene may also be used for
latest innovative technologies such as production of hydrogen from water (Peng et al., 2018);
enhanced surface-enhanced Raman spectroscopy (SERS) (Liu et al., 2018), storage energy
(Pei et al., 2018) and fast water transport (Xie et al., 2018).
The current data sheet does not contain information about the basic conductivity of this
material. NanoXplore has an important line of activity in graphene that needs more
investigations on several aspects including: coating materials and methods, durability,
conductivity. Regarding graphene based nanocomposites, NanoXplore has developed strict
collaboration and funded to some research groups to prepare smart graphene-polymer
nanocomposites: i) conducting polymer from polyethylene (PE)/graphene (Moghimian et al.,
2017), ii) EVA/graphene, iii) super thermally conductive PE/graphene nanoplatelets
(Hamidinejad et al., 2018), iv) super-high heat dissipation poly (vinyldene fluoride)/graphene
nanoplatelets composites to improve electromagnetic shielding (Zhao et al., 2017a).
Vinyl ester resins are thermoset matrices, which are widely applied in the industry of
composites (Changwoon Jang, 2012; Liao et al., 2010). It is the esterification of epoxy resin
with unsaturated monocarboxylic acid that manufactures the VE resin. The environment
which is suitable for the resins requires high corrosion and chemical resistance, water barrier
properties, low moisture absorption, low shrinkage and good dimensional stability (Anupama
Chaturvedi, 2013; Zhanhu Guo, 2006). Owing a variety of advantages, these resins have been
extensively used in number of applications such as matrix material, coating, adhesive,
electronic encapsulate, in the marine industry, pipelines and automotives (Guo, 2009;
Thostenson et Chou, 2006; Zhang et al., 2014).
Objectives of the Master thesis
The general objective of this project is to prepare and characterize graphene/vinyl ester
nanocomposite. The specific objectives are the following:
3
• Measure the conductivity of graphene powders;
• Investigate the optimal conditions for the preparation of conducting coating from vinyl
ester resin by turning processing conditions (graphene content, temperature, hardness
content, sample thickness, and mixing time).
• Investigate the electrical, thermal, mechanical properties of as-prepared coatings.
Thesis outline In the “Literature review”, the mechanism, synthesis and applications on composite
materials, a brief overview of thermoset resins, vinyl ester resin, graphene and
characterization methods have been introduced.
In the following chapter Materials and methods, Chapter 2 explains the experimental process,
materials and test methods involved in making and analyzing Vinyl ester resin/graphene
black 3X composite materials.
In chapter 3 Results and discussions, the synthesized samples were characterized by scanning
electron microscopy (SEM), atomic force microscopy (AFM), thermogravimetric analysis
(TGA), tensile strength measurements, broadband dielectric spectroscopy (BDS) and four-
point probe test.
Conclusions and recommendations are made for summary and future research.
Appendix 1 shows exploratory results on graphene black 0X and bio-epoxy resin
decomposition. These results were not further analyzed because of the low conductivity.
Original contribution The aim of the present work is to perform facile and low cost mechanical methods to prepare
advanced composite materials. Graphene-based vinyl ester resin composites were
successfully prepared by incorporating graphene into the matrix with improved electrical

4
properties, thermal stability, and mechanical strength. Furthermore, results from this thesis
provide better understanding on the new graphene materials and their potential applications
in the smart composite materials. The improvement of the material properties, particularly on
conductivity of materials contributes to reducing the price and increases the performance of
the composite materials. The latter has a direct link to the use of energy efficiency and thus
sustainable development.

CHAPTER 1
LITERATURE REVIEW
1.1 Introduction
In this section, the structure and applications of materials (plastic, vinyl ester resins,
graphene), characterization methods are introduced.
A composite material is composed of at least two distinct materials. It is typically composed
of two phases, a non continuous phase, like a particle, which has superior properties and a
continuous phase, the matrix. This review of conducting polymer/graphene nanocomposites
highlighted their potential applications in the coming years for material science and
construction engineering field.
The overall polymer nanocomposites properties are driven by the optimal conditions for the
preparation of conducting coating and the properties of the graphene and vinyl ester resins.
Graphene-based is undoubtedly considered as an exceptional material which was studied for
different properties, such as thermal properties (Shahil et Balandin, 2012), mechanical
properties (Al-Saleh et Sundararaj, 2011), electrical properties (Sanjinés et al., 2011),
rheological properties (Potts et al., 2011), microwave adsorption (Lee, 2012; Qin et
Brosseau, 2012), environmental and toxicological impacts (Singh et al., 2011), tailoring with
preparation methods (van Rooyen, Karger-Kocsis et David Kock, 2015), and gas barrier
properties (Kim, Abdala et Macosko, 2010). The polymer nanocomposites and graphene
have been currently used to widespread applications in electronics (Bkakri et al., 2014), bio-
electric sensors (Lian et al., 2015), energy technology (Abdin et al., 2013), lithium batteries
(Sun et al., 2014), aerospace (Azeez et al., 2013), and various other fields of nanotechnology
(Agnihotri, Chowdhury et De, 2015).
6
1.2 Materials
The matrix of the composite studied in this master thesis is made of plastic, more specifically
a thermoset resin. In this section, the classification of plastic is explained, then the composite
polymer and graphene is introduced.
1.2.1 Plastic classification
Plastic plays a crucial role in a large number of industrial fields such as the automobile,
aerospace, transport, and communication. Plastic, a general term for a range of synthetic or
semi-synthetic polymer, is extensively applied to almost all the industries. The plastic mainly
consists of thermoplastics, thermosets and elastomers families.
The term “plastic” is derived from a Greek word “plastikos” which means the act of molding
and shaping (Starr, 2002). The reason behind this term is that plastic is soft and flexible, and
in the process of manufacturing, it is molded and reshaped into many different structures
such as films, fibers, plates, and bottles (Robertson, 2005). In the 21st century, plastics are
widely used to replace products made of fabric, wood, metal, glass, etc. as they featured as
the optimal materials which are light-weight, chemically and mechanically resilient, easy to
form and can accommodate many functional additives (Rhoades, 2008).
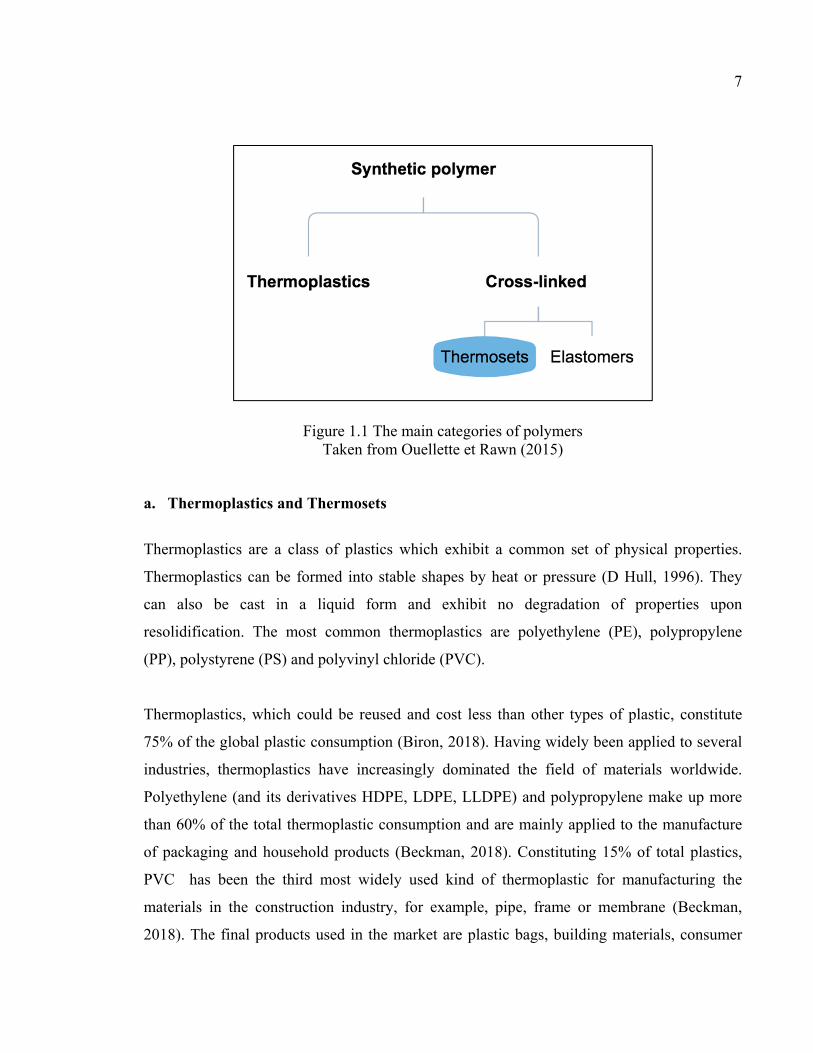
Polymers are long chains of molecules and they can be organized into two main types:
natural polymer and synthetic polymer (Kutz, 2011). Synthetic polymers are classified as
either thermoplastics or cross-linked polymers (JMG Cowie, 2007) as shown in Fig. 1.1. This
study will focus on thermoplastics and thermoset polymers, which are a subset of crosslinked
polymers.
7
Figure 1.1 The main categories of polymers Taken from Ouellette et Rawn (2015)
a. Thermoplastics and Thermosets
Thermoplastics are a class of plastics which exhibit a common set of physical properties.
Thermoplastics can be formed into stable shapes by heat or pressure (D Hull, 1996). They
can also be cast in a liquid form and exhibit no degradation of properties upon
resolidification. The most common thermoplastics are polyethylene (PE), polypropylene
(PP), polystyrene (PS) and polyvinyl chloride (PVC).
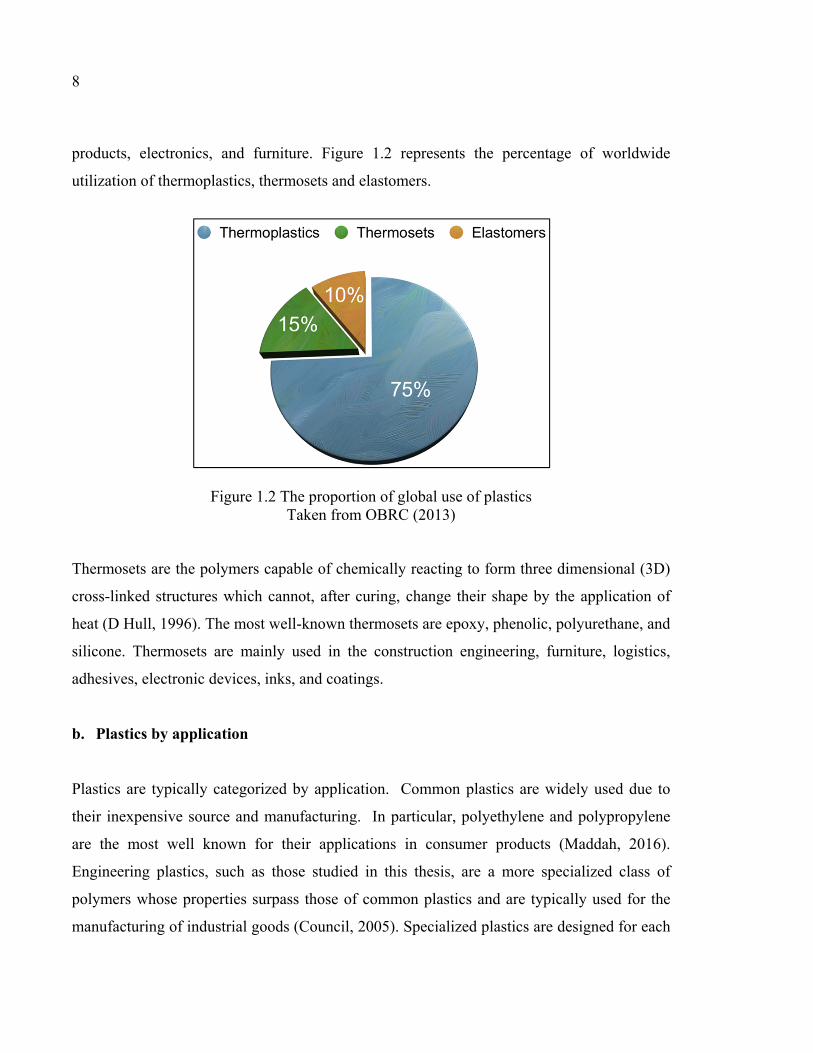
Thermoplastics, which could be reused and cost less than other types of plastic, constitute
75% of the global plastic consumption (Biron, 2018). Having widely been applied to several
industries, thermoplastics have increasingly dominated the field of materials worldwide.
Polyethylene (and its derivatives HDPE, LDPE, LLDPE) and polypropylene make up more
than 60% of the total thermoplastic consumption and are mainly applied to the manufacture
of packaging and household products (Beckman, 2018). Constituting 15% of total plastics,
PVC has been the third most widely used kind of thermoplastic for manufacturing the
materials in the construction industry, for example, pipe, frame or membrane (Beckman,
2018). The final products used in the market are plastic bags, building materials, consumer
8
products, electronics, and furniture. Figure 1.2 represents the percentage of worldwide
utilization of thermoplastics, thermosets and elastomers.
Figure 1.2 The proportion of global use of plastics Taken from OBRC (2013)
Thermosets are the polymers capable of chemically reacting to form three dimensional (3D)
cross-linked structures which cannot, after curing, change their shape by the application of
heat (D Hull, 1996). The most well-known thermosets are epoxy, phenolic, polyurethane, and
silicone. Thermosets are mainly used in the construction engineering, furniture, logistics,
adhesives, electronic devices, inks, and coatings.
b. Plastics by application
Plastics are typically categorized by application. Common plastics are widely used due to
their inexpensive source and manufacturing. In particular, polyethylene and polypropylene
are the most well known for their applications in consumer products (Maddah, 2016).
Engineering plastics, such as those studied in this thesis, are a more specialized class of
polymers whose properties surpass those of common plastics and are typically used for the
manufacturing of industrial goods (Council, 2005). Specialized plastics are designed for each

9
use case and are reserved for applications where critical material properties warrant a more
expensive material design and manufacturing process (Drobny, 2014).
1.2.2 Thermoset polymer and resins
Due to the 3D cross-linked structure of thermoset polymers, the cannot be converted into the
different forms by the application of heat (J-P. Pascault, 2002). Thermoset polymers are
obtained by a wide range of cross-linking routes of linear pre-polymers or by the
establishment of cross-linked networks from the reaction between two monomers (Saleem et
al., 2016). In comparison to thermoplastic materials, thermosets are superior in strength,
hardness, and thermal stability (P.E, 2006). To further enhance the quality of thermoset
materials, fillers have been incorporated, including clays, carbon nanotubes, and graphene.
The most well-known thermosetting polymers in construction materials are epoxies, vinyl
ester resin, phenolic, melamine, and urea-formaldehydes, acrylics, urethane and furane. Table
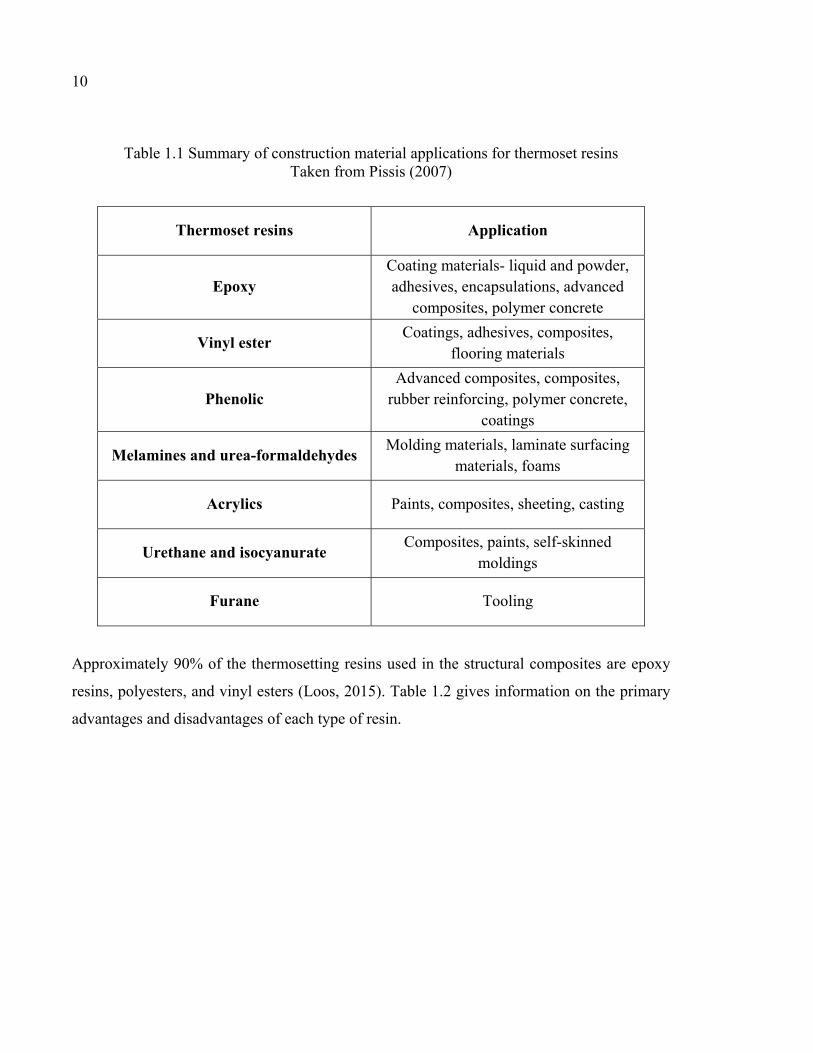
1.1 shows that the thermoset resins are common in the coating industry.
10
Table 1.1 Summary of construction material applications for thermoset resins Taken from Pissis (2007)
Thermoset resins Application
Epoxy Coating materials- liquid and powder, adhesives, encapsulations, advanced
composites, polymer concrete
Vinyl ester Coatings, adhesives, composites, flooring materials
Phenolic Advanced composites, composites,
rubber reinforcing, polymer concrete, coatings
Melamines and urea-formaldehydes Molding materials, laminate surfacing materials, foams
Acrylics Paints, composites, sheeting, casting
Urethane and isocyanurate Composites, paints, self-skinned moldings
Furane Tooling
Approximately 90% of the thermosetting resins used in the structural composites are epoxy
resins, polyesters, and vinyl esters (Loos, 2015). Table 1.2 gives information on the primary
advantages and disadvantages of each type of resin.
11
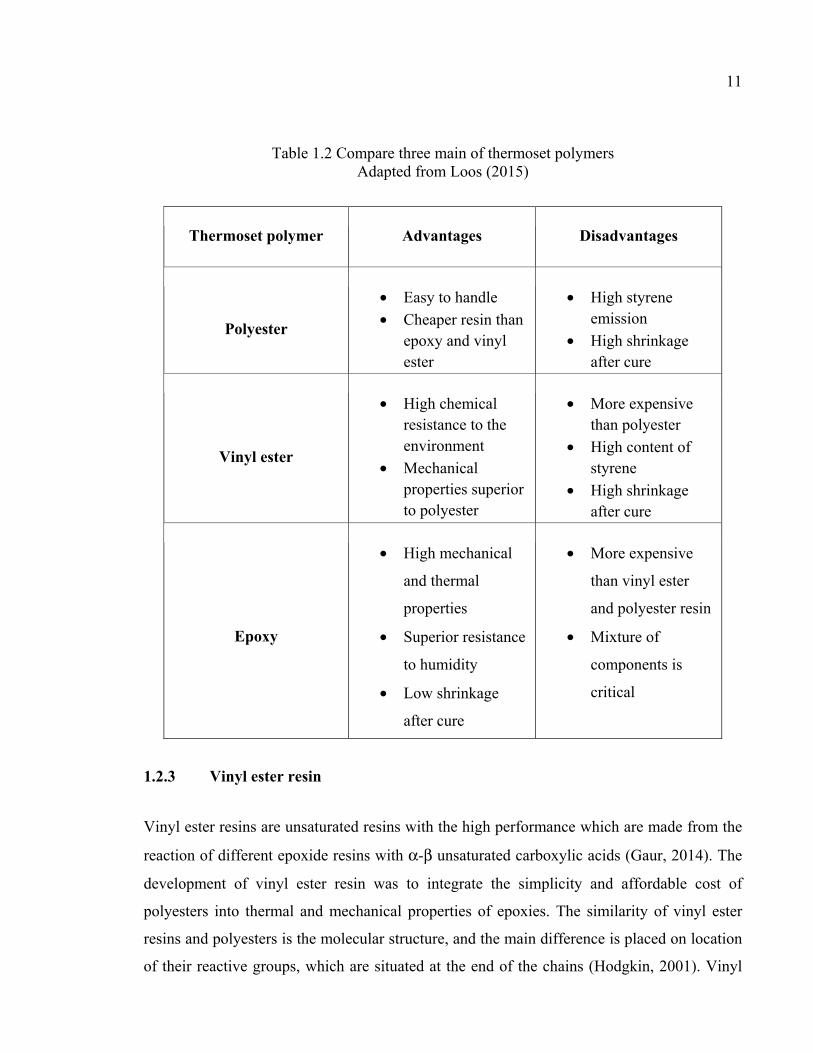
Table 1.2 Compare three main of thermoset polymers Adapted from Loos (2015)
Thermoset polymer Advantages Disadvantages
Polyester
• Easy to handle • Cheaper resin than
epoxy and vinyl ester
• High styrene emission
• High shrinkage after cure
Vinyl ester
• High chemical resistance to the environment
• Mechanical properties superior to polyester
• More expensive than polyester
• High content of styrene
• High shrinkage after cure
Epoxy
• High mechanical
and thermal
properties
• Superior resistance
to humidity
• Low shrinkage
after cure
• More expensive
than vinyl ester
and polyester resin
• Mixture of
components is
critical
1.2.3 Vinyl ester resin
Vinyl ester resins are unsaturated resins with the high performance which are made from the
reaction of different epoxide resins with α-β unsaturated carboxylic acids (Gaur, 2014). The
development of vinyl ester resin was to integrate the simplicity and affordable cost of
polyesters into thermal and mechanical properties of epoxies. The similarity of vinyl ester
resins and polyesters is the molecular structure, and the main difference is placed on location
of their reactive groups, which are situated at the end of the chains (Hodgkin, 2001). Vinyl
12
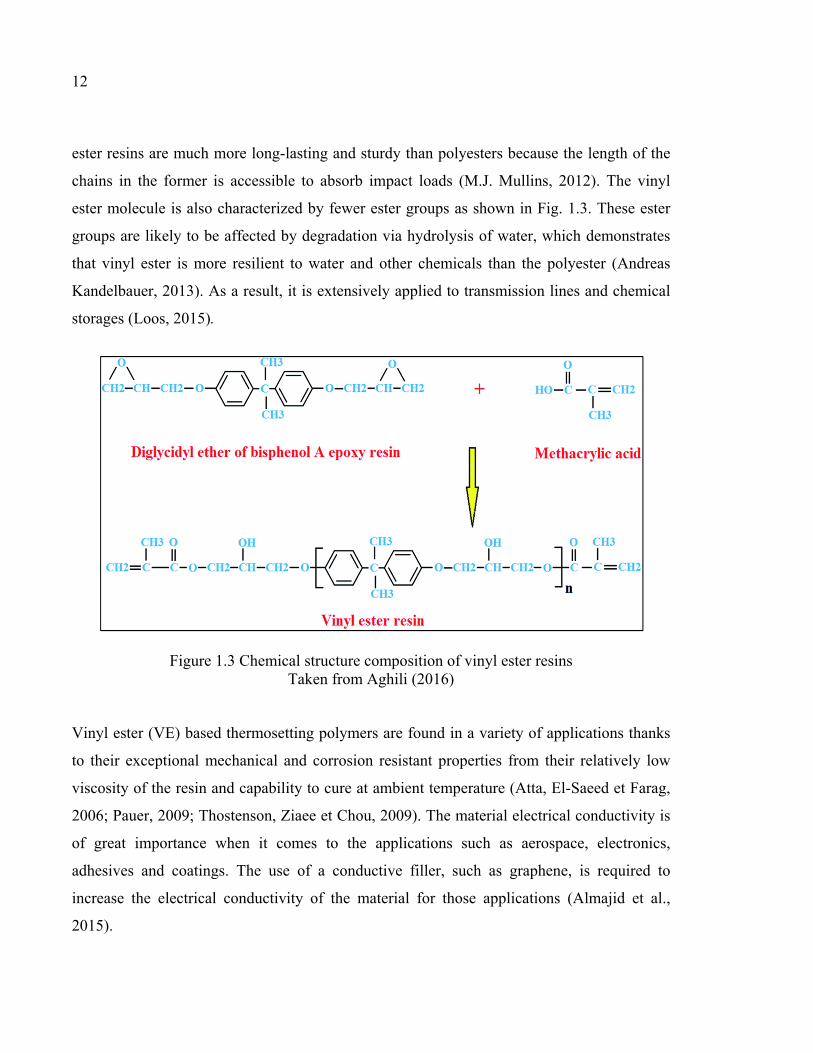
ester resins are much more long-lasting and sturdy than polyesters because the length of the
chains in the former is accessible to absorb impact loads (M.J. Mullins, 2012). The vinyl
ester molecule is also characterized by fewer ester groups as shown in Fig. 1.3. These ester
groups are likely to be affected by degradation via hydrolysis of water, which demonstrates
that vinyl ester is more resilient to water and other chemicals than the polyester (Andreas
Kandelbauer, 2013). As a result, it is extensively applied to transmission lines and chemical
storages (Loos, 2015).
Figure 1.3 Chemical structure composition of vinyl ester resins Taken from Aghili (2016)
Vinyl ester (VE) based thermosetting polymers are found in a variety of applications thanks
to their exceptional mechanical and corrosion resistant properties from their relatively low
viscosity of the resin and capability to cure at ambient temperature (Atta, El-Saeed et Farag,
2006; Pauer, 2009; Thostenson, Ziaee et Chou, 2009). The material electrical conductivity is
of great importance when it comes to the applications such as aerospace, electronics,
adhesives and coatings. The use of a conductive filler, such as graphene, is required to
increase the electrical conductivity of the material for those applications (Almajid et al.,
2015).

13
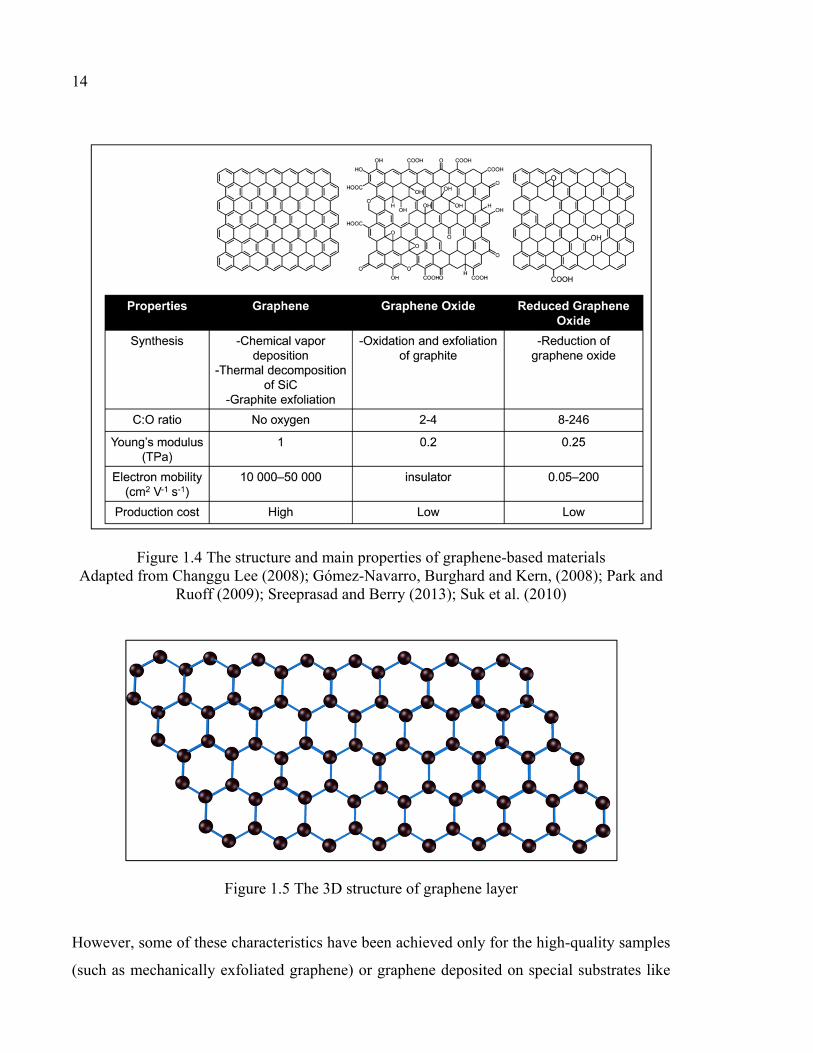
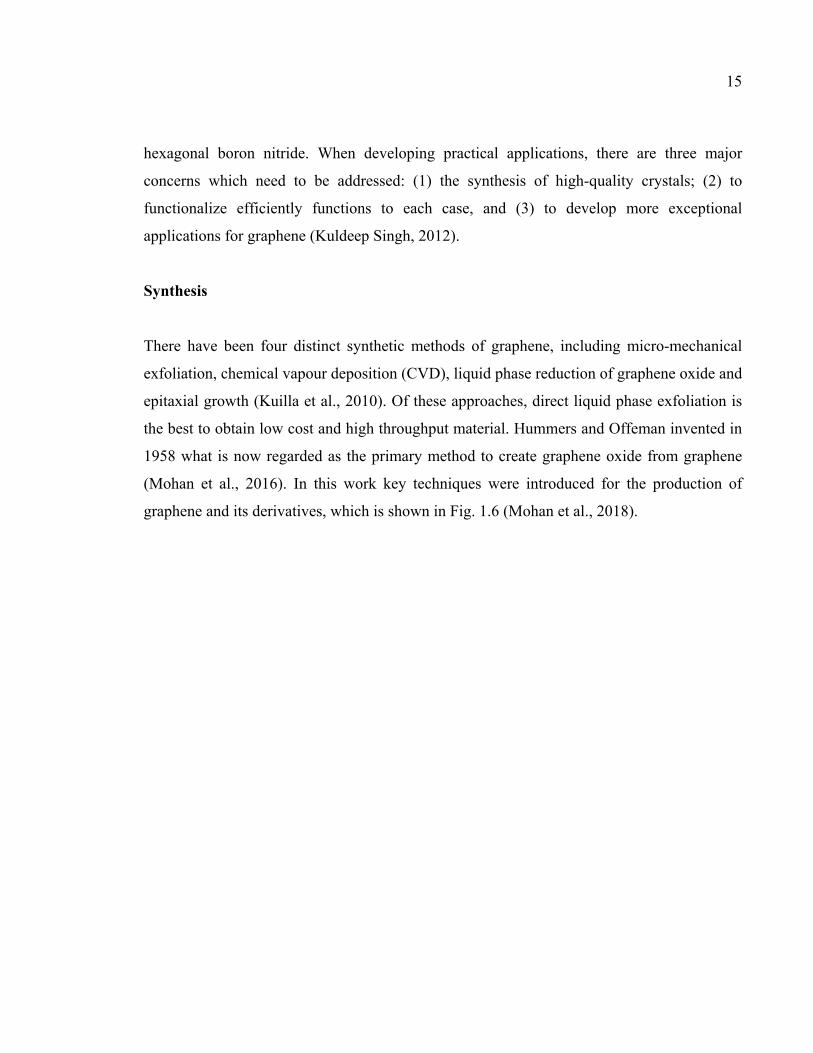
1.2.4 Graphene
Graphene, in its original form, contains a single layer of carbon atoms arranged in a sp2-
bonded aromatic structure as shown in Fig. 1.4 and Fig. 1.5, respectively. It is found as the
building block of graphite, where π-stacking of graphene sheets holds the lamellar graphite
structure strongly in place with an interlayer spacing of 3.34 Å between the sheets (Hontoria-
Lucas et al., 1995). To produce the single layers of graphene, graphite is exfoliated. The
sequential cleavage of graphite to graphene employed the use of adhesive tape (Zhu et al.,
2010). Geim and Novoselov manufactured the first single-layer graphene sheets (Perreault,
Fonseca de Faria et Elimelech, 2015). Their research played an indispensable role in the
understanding of the electronic properties of graphene, which was then awarded the Nobel
Prize in Physics in 2010 (Geim, 2009; Novoselov, 2007).
Graphene exhibits a large number of exceptional properties which are ideal for some
environment-inclined applications. One aspect of graphene which is intensively examined is
its electronic properties (Castro Neto et al., 2009; Geim, 2009). Similar to any other
nanoscale material, graphene has a high surface area. In theory, graphene exhibits the highest
possible surface area, having the theoretical value of 2630 m2g-1, because each atom of a
single-layer graphene sheet participates in two surfaces (Sanchez et al., 2012). The high
surface area of graphene allows it to be the perfect material for some processes such as
adsorption or surface reactions. Graphene, additionally, is a great support to anchor chemical
functionalities or nanomaterials. Graphene-based nanocomposites, therefore, have become
the attractive field of research for novel materials (Compton et Nguyen, 2010).
14
Figure 1.4 The structure and main properties of graphene-based materials Adapted from Changgu Lee (2008); Gómez-Navarro, Burghard and Kern, (2008); Park and
Ruoff (2009); Sreeprasad and Berry (2013); Suk et al. (2010)
Figure 1.5 The 3D structure of graphene layer
However, some of these characteristics have been achieved only for the high-quality samples
(such as mechanically exfoliated graphene) or graphene deposited on special substrates like
15
hexagonal boron nitride. When developing practical applications, there are three major
concerns which need to be addressed: (1) the synthesis of high-quality crystals; (2) to
functionalize efficiently functions to each case, and (3) to develop more exceptional
applications for graphene (Kuldeep Singh, 2012).
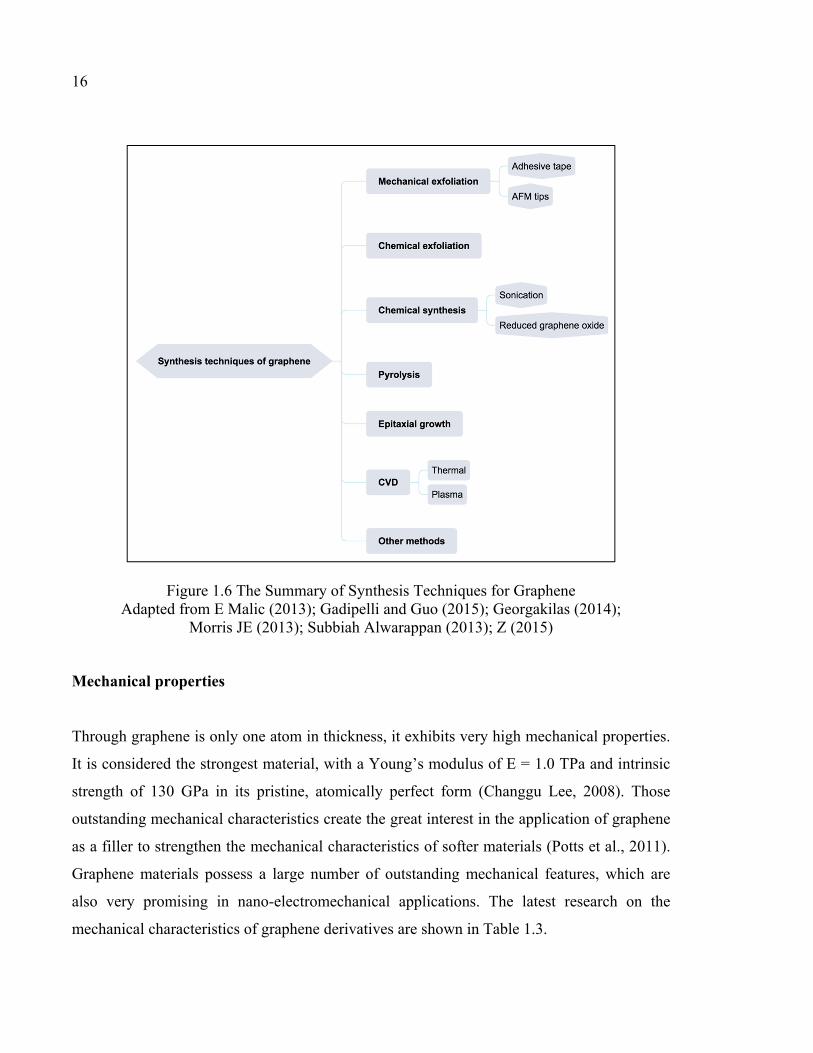
Synthesis There have been four distinct synthetic methods of graphene, including micro-mechanical
exfoliation, chemical vapour deposition (CVD), liquid phase reduction of graphene oxide and
epitaxial growth (Kuilla et al., 2010). Of these approaches, direct liquid phase exfoliation is
the best to obtain low cost and high throughput material. Hummers and Offeman invented in
1958 what is now regarded as the primary method to create graphene oxide from graphene
(Mohan et al., 2016). In this work key techniques were introduced for the production of
graphene and its derivatives, which is shown in Fig. 1.6 (Mohan et al., 2018).
16
Figure 1.6 The Summary of Synthesis Techniques for Graphene Adapted from E Malic (2013); Gadipelli and Guo (2015); Georgakilas (2014);
Morris JE (2013); Subbiah Alwarappan (2013); Z (2015)
Mechanical properties Through graphene is only one atom in thickness, it exhibits very high mechanical properties.
It is considered the strongest material, with a Young’s modulus of E = 1.0 TPa and intrinsic
strength of 130 GPa in its pristine, atomically perfect form (Changgu Lee, 2008). Those
outstanding mechanical characteristics create the great interest in the application of graphene
as a filler to strengthen the mechanical characteristics of softer materials (Potts et al., 2011).
Graphene materials possess a large number of outstanding mechanical features, which are
also very promising in nano-electromechanical applications. The latest research on the
mechanical characteristics of graphene derivatives are shown in Table 1.3.

17
Table 1.3 Reported Mechanical Properties of Different Graphene Sources
Derivative Production
method Young’s modulus Reference
Graphene Mechanical
exfoliation 1 TPa
(Frank et al.,
2007)
Graphene Mechanical
exfoliation 0.96 TPa
(Faccio et al.,
2009)
Graphene Mechanical
exfoliation 0.8 TPa
(Changgu Lee,
2008)
Graphene Mechanical
exfoliation 1.02 TPa (Kudin K, 2001)
Graphene Mechanical
exfoliation 1.1 TPa
(Van Lier et al.,
2000)
Electrical properties
Electrons were observed to possess a high mobility in graphene, reaching 10 000 cm2 V-1 s-1
to 50 000 cm2 V-1 s-1 at room temperature (Fig. 1.4), with an intrinsic mobility limit of > 200
000 cm2 V-1 s-1 (Bolotin et al., 2008; Sreeprasad et Berry, 2013). Without scattering, these
charge carriers can be travel sub-micrometer distances and it is known as ballistic transport.
Graphene is capable of maintaining current densities up to six order of magnitude higher than
copper (Novoselov, 2007). Nevertheless, these electronic characteristics of graphene are only
measured under certain conditions, with mechanically exfoliated graphene under vacuum
(Bolotin et al., 2008). A number of reasons are attributed to the limitations of the electronic
characteristics of graphene, including number of layers, the presence of defects, impurities,
functional groups, the size and flatness of the sheet, and the nature of the substrate
(Sreeprasad et Berry, 2013; Yang et al., 2010).
18
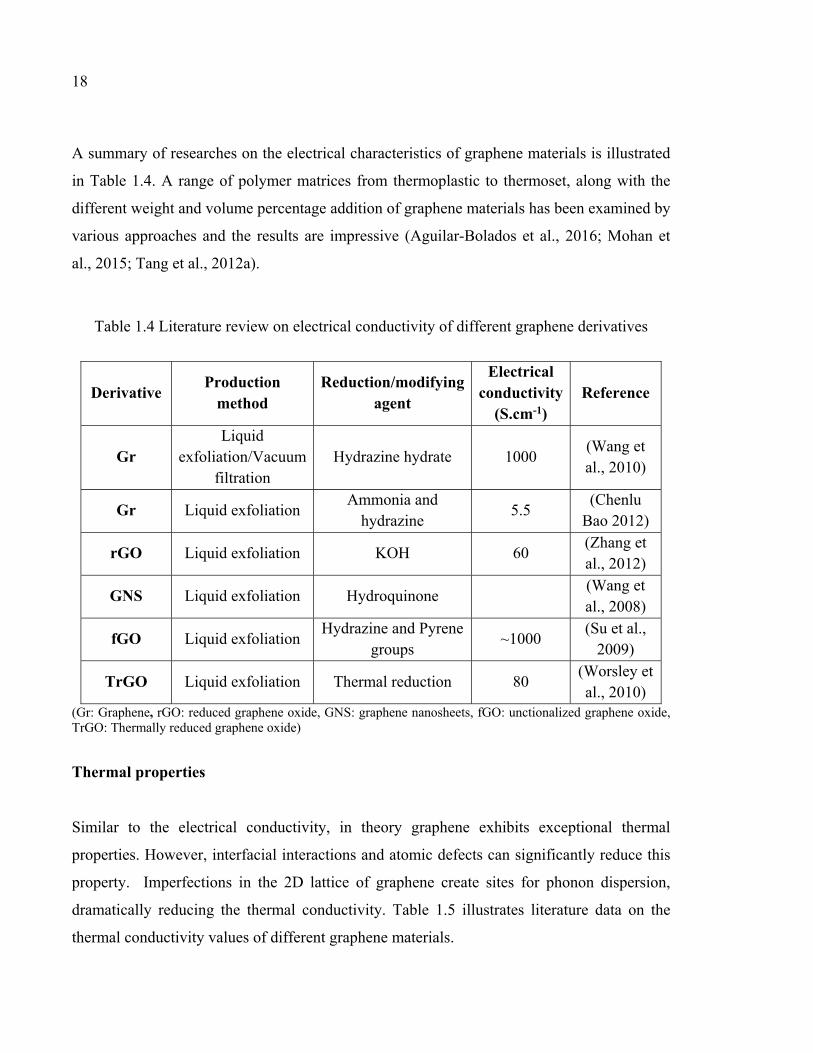
A summary of researches on the electrical characteristics of graphene materials is illustrated
in Table 1.4. A range of polymer matrices from thermoplastic to thermoset, along with the
different weight and volume percentage addition of graphene materials has been examined by
various approaches and the results are impressive (Aguilar-Bolados et al., 2016; Mohan et
al., 2015; Tang et al., 2012a).
Table 1.4 Literature review on electrical conductivity of different graphene derivatives
Derivative Production method
Reduction/modifying agent
Electrical conductivity
(S.cm-1) Reference
Gr Liquid
exfoliation/Vacuum filtration
Hydrazine hydrate 1000 (Wang et al., 2010)
Gr Liquid exfoliation Ammonia and hydrazine 5.5 (Chenlu
Bao 2012)
rGO Liquid exfoliation KOH 60 (Zhang et al., 2012)
GNS Liquid exfoliation Hydroquinone (Wang et al., 2008)
fGO Liquid exfoliation Hydrazine and Pyrene groups ~1000 (Su et al.,
2009)
TrGO Liquid exfoliation Thermal reduction 80 (Worsley et al., 2010)
(Gr: Graphene, rGO: reduced graphene oxide, GNS: graphene nanosheets, fGO: unctionalized graphene oxide, TrGO: Thermally reduced graphene oxide)
Thermal properties
Similar to the electrical conductivity, in theory graphene exhibits exceptional thermal
properties. However, interfacial interactions and atomic defects can significantly reduce this
property. Imperfections in the 2D lattice of graphene create sites for phonon dispersion,
dramatically reducing the thermal conductivity. Table 1.5 illustrates literature data on the
thermal conductivity values of different graphene materials.
19
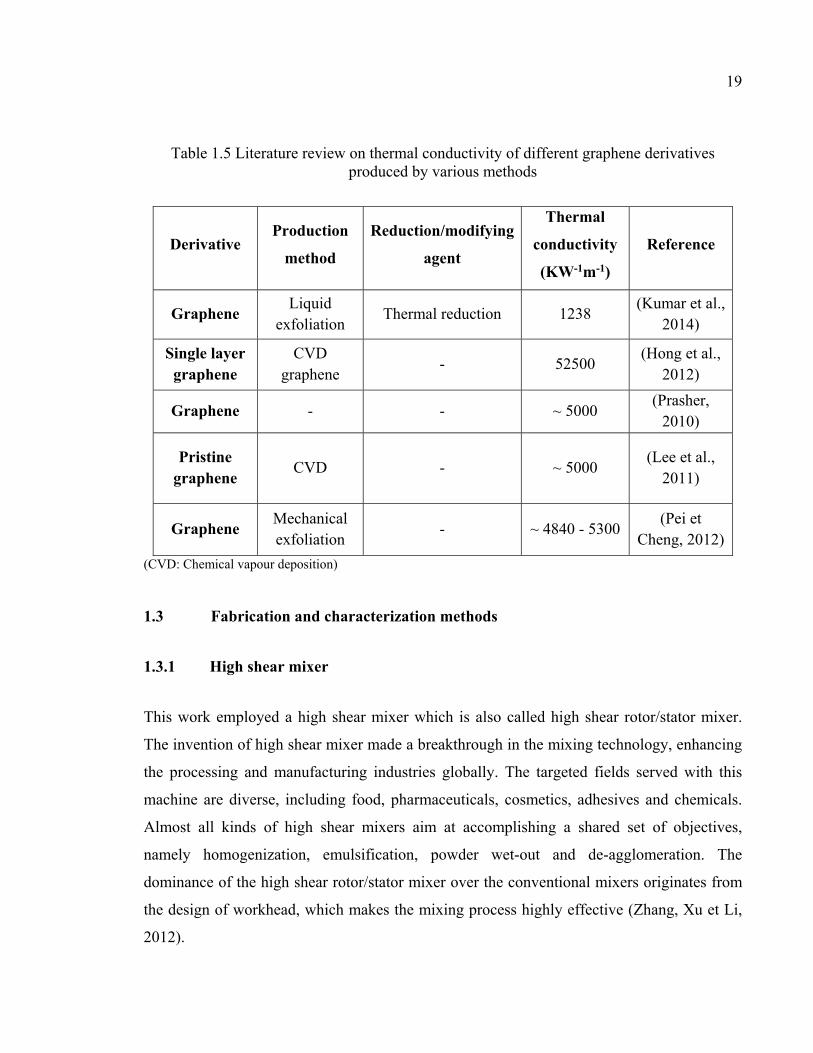
Table 1.5 Literature review on thermal conductivity of different graphene derivatives produced by various methods
Derivative Production
method Reduction/modifying
agent
Thermal conductivity (KW-1m-1)
Reference
Graphene Liquid exfoliation Thermal reduction 1238 (Kumar et al.,
2014)
Single layer graphene
CVD graphene - 52500 (Hong et al.,
2012)
Graphene - - ~ 5000 (Prasher, 2010)
Pristine graphene CVD - ~ 5000 (Lee et al.,
2011)
Graphene Mechanical exfoliation - ~ 4840 - 5300 (Pei et
Cheng, 2012) (CVD: Chemical vapour deposition)
1.3 Fabrication and characterization methods
1.3.1 High shear mixer
This work employed a high shear mixer which is also called high shear rotor/stator mixer.
The invention of high shear mixer made a breakthrough in the mixing technology, enhancing
the processing and manufacturing industries globally. The targeted fields served with this
machine are diverse, including food, pharmaceuticals, cosmetics, adhesives and chemicals.
Almost all kinds of high shear mixers aim at accomplishing a shared set of objectives,
namely homogenization, emulsification, powder wet-out and de-agglomeration. The
dominance of the high shear rotor/stator mixer over the conventional mixers originates from
the design of workhead, which makes the mixing process highly effective (Zhang, Xu et Li,
2012).
20
In the first stage, the rotor with the high-speed rotation creates a suction, which forces liquid
and solid materials upwards to the workhead. The process moves on with the centrifugal
force pushing the materials to the periphery of the workhead at which they are ground
between the rotor blades and the stator. Following this step, an intense hydraulic shear
happens when the materials are forced out of the stator and return to the mixture. Fresh
materials are then pulled into the workhead, which repeats the cycle. The resulting process
largely eliminates turbulent material flow and minimizes aeration (Utomo, Baker et Pacek,
2008).
There is a host of advantages a high shear mixer. For many applications, the advanced high
shear mixer is manufactured with the capability of reducing mixing times up to 90 percent
compared to conventional methods. The specifically-designed workhead allows each
machine to perform a variety of functions simultaneously. For instance, in case of oil and
water emulsions, a nearly instantaneous stable emulsion can be produced through the high
shear mixer in comparison with other available mixers, which can find hard to form the
emulsion by a stirrer or an agitator. In another example, thickening agents can be added
quickly and form a clear agglomerate-free solution, whereas other conventional agitators
require the rather slow and careful act of pouring thickening agents so that agglomerates
could be prevented. The mixer can also be used for disintegrating and homogenizing large
solids like any types of animal, mineral or synthetic original in a single operation (Kowalski,
Cooke et Hall, 2011).
1.3.2 Morphological studies
a. Atomic force microscope (AFM)
An atomic force microscope (AFM) is used to image the micro and nanostructure of
materials. AFM is a tool for observing the morphology and measuring the thickness of 3X
and OX graphene sheets. In an AFM, a cantilever is attached to a sharp tip is used for
scanning the sample surface. When the tip touches the sample surface, the force generated
21
between the tip and the surface make the cantilever move towards the surface. However,
when the cantilever bends closer towards the surface, a controlled repulsive force is exerted
on the cantilever to bend away from the surface. An AFM contains 3 crucial devices for
different functions. The first instrument is a Z scanner to move the cantilever up and down.
In order to move across the sample an XY scanner is employed. The position detector is also
added to record the bending of the cantilever. The function of the position sensor is to track a
laser beam reflected off the flat top of the cantilever. The direction of the reflected beam is
changed if the cantilever is bent. The position detector records those beam changes to map
the surface. An AFM records the topographic map of the sample surface by scanning the
cantilever over some areas using a feedback loop to control the tip on the surface (Giessibl,
2003).
Unlike other microscopes providing a two-dimensional image of a sample, AFM provides a
three-dimensional surface profile. Sample surfaces tested on AFM do not require any special
treatments like metal or carbon coatings, which may cause the change or damage for the
sample. Most of the AFMs can work efficiently in ambient air or even a liquid environment
compared to some microscopes that require a high vacuum environment. AFM is also
considered dominant as it provides atomic resolution in ultra-high vacuum and in liquid
environments (Garcı́a et Pérez, 2002).
On the other hand, AFM still has some weak points that need to be fixed. The very first
weakness is that AFM is the single size, which can only image a maximum height of 10-20
micrometers and a maximum scanning area of about 150 x 150 micrometers. Another
limitation is the scanning speed. AFM requires a large amount of time for a typical scan,
which causes the thermal drift in the image. Consequently, AFM is not the proper method for
the measurement of accurate distances between topographical features. One more
disadvantage is attributed to the hysteresis of the piezoelectric material and cross-talk
between the x, y, z piezoelectric actuators, which can affect the AFM images, leading to the
fact that the real topographical features can be flattened out. Like any other methods, the
22
image artifacts can be found by inappropriate tip, poor-quality environment or even by the
sample itself (Meyer et Amer, 1988).
b. Scanning electron microscope (SEM)
A scanning electron microscope (SEM) is an accomplished device used for obtaining
information on the surface of solid materials through the focused beams of electrons. Thanks
to the high-solution and three-dimensional images provided by SEM, a great deal of data
about the sample is revealed, including external morphology (texture), chemical composition,
crystalline structure and orientation of materials (Joseph I. Goldstein, 2017).
An SEM is comprised of an electron gun, focusing lenses, a high vacuum chamber and a
series of electron detectors. The electron gun generates a beam of high-energy electrons
down the column and into a series of electromagnetic lenses to focus onto and raster across
the sample. This process is conducted on a computer with the support of SEM operator to
control magnification and identify the surface area to be scanned. The beam is focused onto
the stage, where a solid sample is placed. Sample preparation for the sample is required
before being put in the vacuum chamber. All samples require the capability of handling the
low pressure inside the vacuum chamber. The acceleration rate of incident electrons, carrying
significant amounts of kinetic energy, will determine the interaction between the incident
electrons and the surface of the sample. When the interaction happens, energetic electrons are
exposed from the surface of the sample. The scattered patterns give information in size,
shape, texture and composition of the sample. Several detectors, including backscattered
electrons and X-rays, are applied for attracting different types of scattered electrons.
Backscatter electrons provide composition data regarding element and compound detection.
The data about mineral can be found through X-rays emitted from beneath the sample surface
(Reimer, 2013).
SEM is undoubtedly crucial in the fields that require the examination of solid materials. Due
to the three-dimensional, topographical images and detailed information from different
23
detectors, SEM is widely applied for a range of areas, particularly on geological applications.
For the most part, almost all SEMs are comparatively easy to operate. The available
assistance of computer technology and associated software makes the operation much
simpler for operators. The use of this technique is primarily limited by high equipment cost
(Goldstein, 2017). In addition to the unit cost, SEMs must be operated in an environment
where there is no interference of electricity, magnet and vibration. The requirement for
maintenance is also demanding, which involves remaining a stable voltage, currents to
electromagnetic coils and circulation of cool water. The preparation of samples can lead to
the artifacts, making an adverse impact on the information processing. There is still no
absolute way to eliminate or identify the potential artifacts (Goldstein, 2017).
1.3.3 Fourier Transform Infrared (FTIR) spectroscopy
Fourier Transform Infrared (FTIR) is a method used to measure infrared spectrum
absorption. FTIR is a mathematical process to turn the data into a visual spectrum. In the
infrared spectroscopy, infrared radiation passes through a sample. Some of the infrared
radiation is absorbed by the sample and some of it is transmitted. The resulting spectrum
shows the molecular absorption and transmission, which forms the molecular fingerprint of
the sample. FTIR spectroscopy can be applied to identifying unknown materials, determine
the quality or consistency of a sample and the amount of components in a mixture (Smith,
2011).
FTIR spectroscopy offers a number of advantages over other techniques. As all of the
frequencies are measured at the same time and spectra are generated in a matter of seconds.
The application of FTIR can substantially improve the molecular sensitivity. The noise levels
have been observed far lower with the support of the detectors and the higher optical
throughput. With regard to the mechanical property, as there exists only one moving part in
the machine, the unit is low maintenance. These instruments also use a HeNe laser as an
internal wavelength calibration standard which allows them to be self-calibrating (Smith,
2011).

24
1.3.4 Thermal properties
Thermogravimetric analysis (TGA) is a thermal analysis technique for measuring mass
changes of a sample under the condition of raising temperature in a controlled atmosphere.
From this measurement, two data sets can be obtained, which are weight loss-time and mass
loss-temperature. Thermogravimetric analysis was carried out in a combined system
Thermogravimetric/Differential Thermal Analysis (TG/DTA) (JD Menczel, 2009).
This instrument is the combination of a special furnace and a sensitive mass balance. DSC
sensor is used to replace the scale pan. In order to limit the impact on the environment, the
balance cell is thermostated. The balance beam is then attached to the TGA-DSC sensor. The
sample and reference crucibles are set in the center of the furnace. Due to the support of
thermal buoyancy and the purge gas flow, the horizontal design of the furnace is able to
reduce the possibility of turbulence. Both sides of the furnace are protected with baffles, and
the whole volume is purified by a constant flow of gas. The sample can also be purged with a
reactive gas flowing through the capillary near the sample crucible. The volatile and gaseous
combustion products from the sample, together with the purge gas and reactive gas remove
from the furnace through the gas outlet on the left. The process finishes with the connection
of analytical devices and the outlet to obtain the gas analysis (Broido, 1969).
A key strength of the TGA technique is its proven dual balance beam to provide drift-free
baselines. The efficiency of the dual balance design minimizes the effects of changing purge
gases and purge gas flow rates; reducing chimney and convection effects. The system is
resilient to external disturbances such as temperature fluctuations and vibrations. High
quality results can be obtained even for very low mass weight loss events. With the
horizontal balance design of TG/DTA, the gas flow and the weight direction are
perpendicular. Consequently, the purge gas flows will cause a limited amount of effect even
at rapid purge rates up to 1000 mL/min. Highly condensable or oily volatiles are measured by
high purge gas flow since they are purged from the DT-TGA instrument before significant
condensation. The act of introducing the corrosive or special purge gases into the furnace
25
tube helps to minimize the damage to the balance assembly and electronics. Additionally, the
maintenance cost and time is reduced by the light weight replaceable parts (Doyle, 1961).
1.3.5 Tensile property
The capacity to minimalize the breakage under tensile stress is one of the most pivotal
measured properties of materials for structural applications. In order to quantify this property,
the maximum force per unit area (MPa or psi) is measured, known as the ultimate tensile
strength or tensile strength at break. The speed at which the sample is pulled apart in the test
can be varied between 0.2 and 20 inches per minute and this will have an influence on the
results. For the test, composite samples are either manufactured from the stock shapes or
injection molded. The machine used to test the tensile strength pulls the samples from both
sides and then measures the force required while simultaneously measuring the strain before
breaking (Kim et al., 2006).
With this ultimate tensile strength measured, the material characteristics are identified, which
allows the materials engineers to forecast whether the materials will react favorably in their
designed applications (D Gay, 2007). The data obtained from the tensile test can be also
utilized to determine batch quality and consistency in manufacture. However, there are some
factors influencing tensile strength such as the effect of additives and impurities, temperature,
geometric size and shape of samples, gauge length, orientation and morphology, and surface
condition (Zhang et al., 1999).
1.3.6 Electrical properties
a. Four-point probe test Electrical resistivity is the fundamental material characteristic, which determines the
material’s opposition to the current flow. The material’s resistivity relies on some factors,
including the material doping, processing, and environmental factors such as temperature

26
and humidity. Some characteristics, namely the series resistance, threshold voltage, and
capacitance can be influenced by the material’s resistivity (Archie, 1942).
A four-point probe is a suitable equipment to quantify the resistivity of semiconductor
samples. To measure the substrate resistivity, a current is passed through two outer probes
and the voltage is measure through the inner probes (Smits, 1958).
The method of the four-point probe is conducted by contacting four equally spaced probes
with a material of unknown resistance. There is a DC current set between the outer two
probes, and a voltmeter is employed to test the voltage between the inner two probes. The
calculation of the resistivity depends on several factors such as the geometry, the source
current and the voltage measurement. To simplify measurements, integrated parameter
analyzer accompanied by control software is applied for a variety of material resistances
including very high-resistance semiconductor materials (Smits, 1958).
Even though the principle is simple, some experimental problems are still taken into
consideration when using a four-point probe. The application of metal into a semiconductor
generates a Schottky diode rather than an ohmic contact. The samples with very high or very
low resistivity require the modification of the drive current to get the reliable reading.
Samples with cut or lapped surfaces are more easily measured than those with polished
surfaces (Smits, 1958).
To quantify the resistivity of thin, flat materials including semiconductors or conductive
coatings, a four-point collinear probe together with a parameter analyzer has been
successfully applied. A few parameter analyzers provide built-in configurable tests, which
require the proper calculations. The possibilities of defects such as electronics interference,
leakage current, and environmental factors like light and temperature need to be also taken
into account to ensure the proper measurements (Schuetze et al., 2004).
27
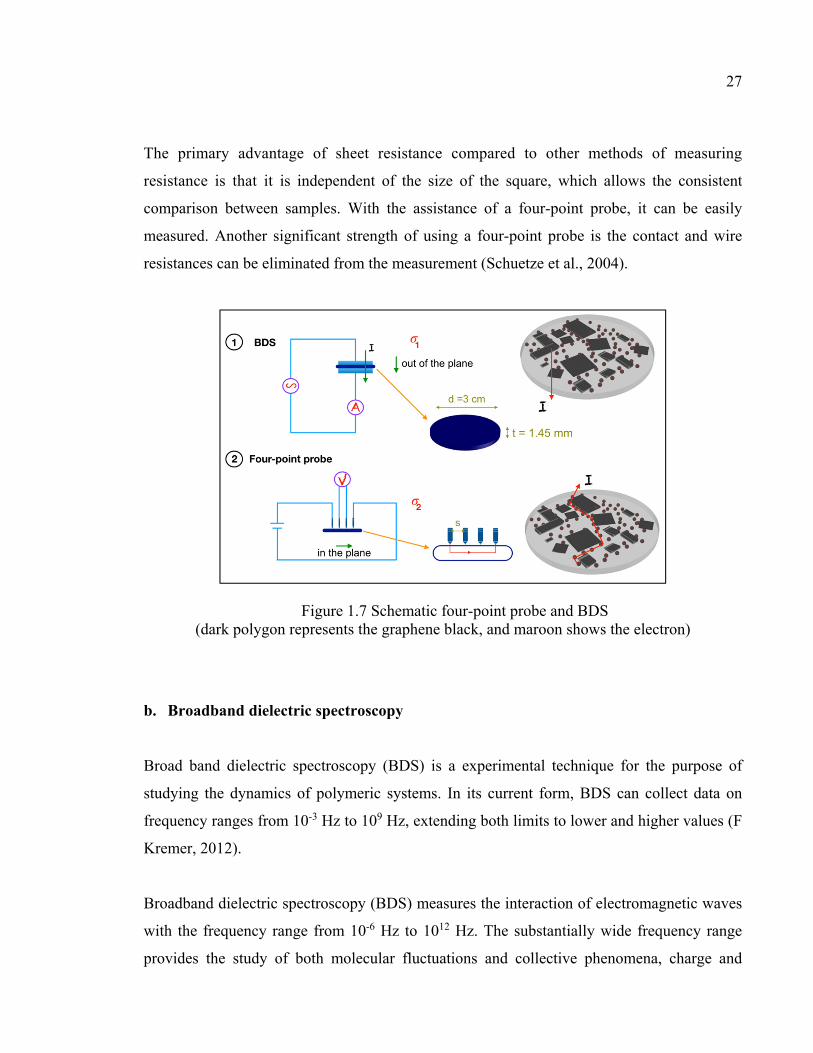
The primary advantage of sheet resistance compared to other methods of measuring
resistance is that it is independent of the size of the square, which allows the consistent
comparison between samples. With the assistance of a four-point probe, it can be easily
measured. Another significant strength of using a four-point probe is the contact and wire
resistances can be eliminated from the measurement (Schuetze et al., 2004).
Figure 1.7 Schematic four-point probe and BDS (dark polygon represents the graphene black, and maroon shows the electron)
b. Broadband dielectric spectroscopy Broad band dielectric spectroscopy (BDS) is a experimental technique for the purpose of
studying the dynamics of polymeric systems. In its current form, BDS can collect data on
frequency ranges from 10-3 Hz to 109 Hz, extending both limits to lower and higher values (F
Kremer, 2012).
Broadband dielectric spectroscopy (BDS) measures the interaction of electromagnetic waves
with the frequency range from 10-6 Hz to 1012 Hz. The substantially wide frequency range
provides the study of both molecular fluctuations and collective phenomena, charge and

28
polarization effects and the dielectric properties of different materials in both liquid and solid
form. The versatility of BDS has made it the primary technique in the multidisciplinary
design, characterization and application of materials in various fields from nanotechnology to
biology (F Kremer, 2012).
BDS quantifies the dielectric permittivity as a function of frequency and temperature. It can
also be used to non-conducting materials. The frequency ranges from 10-6 Hz to 1012 Hz.
BDS is sensitive to dipolar species and localized charges, and it determines their strength,
their kinetics and their interactions. Dielectric spectroscopy, therefore, is an influential device
for measuring electrical properties of non-conducting and semiconducting materials (Kremer,
2002).
Dielectric spectroscopy is based on the interaction of an external electric field with the
electric dipole moment and charges of the medium (Stannarius, Kremer et Arndt, 1995). The
information on dielectric spectroscopy can be analyzed through a wide range of ways: (i) in
terms of dielectric permittivity, (ii) in terms of AC conductivity, (iii) in terms of electric
modulus, and (iv) in terms of complex impedance. Those four methods can be applied to
identity and analyze the recorded electrical characteristics. In some circumstances, however,
a certain method could be more impactful to extract data. The dielectric data, therefore,
should be measured in more than one way, especially in the case of the examination of a
complicated material as in a nanocomposite.
Due to the high sensitivity with decreasing domain size and wide dynamic range, dielectric
spectroscopy has been beneficial in the research of polymer dynamics and in confining
geometries. The dielectric characteristics of graphene (dielectric constant, dielectric
permittivity, etc.) including polymer nanocomposites are remarkably impacted by the aspect
ratio of the graphene and its interfacial adhesion with the polymer matrix (Petzelt et al.,
2013).
29
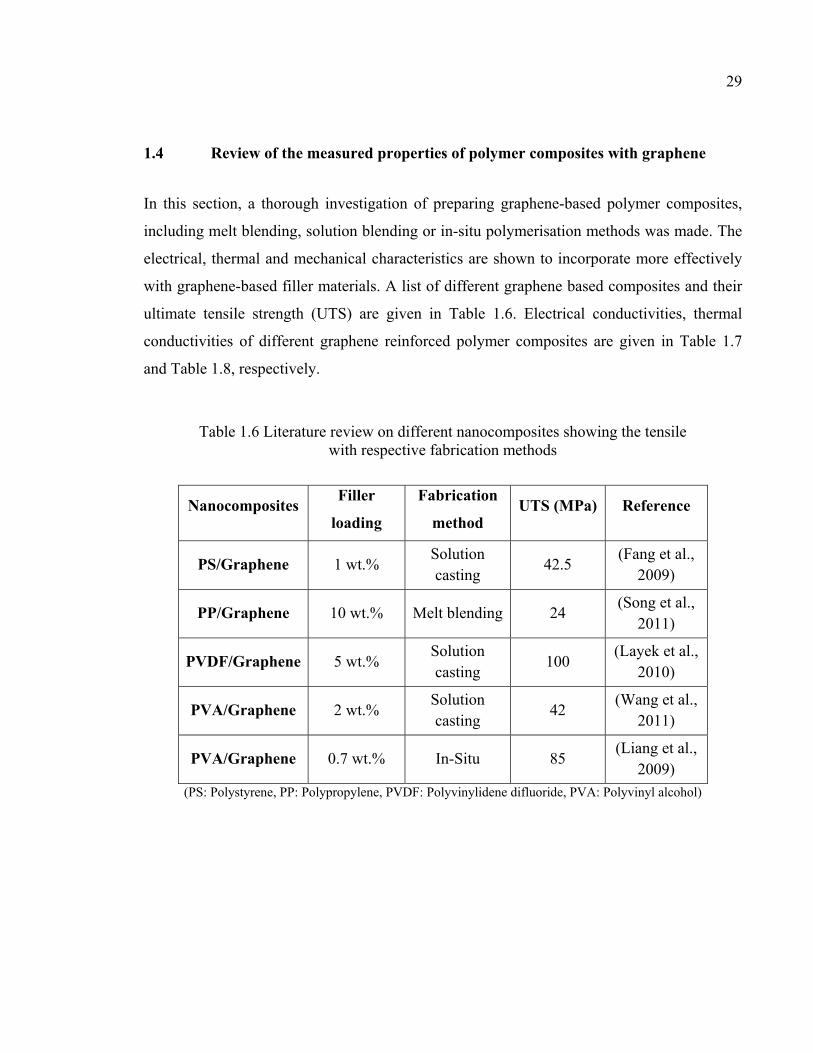
1.4 Review of the measured properties of polymer composites with graphene
In this section, a thorough investigation of preparing graphene-based polymer composites,
including melt blending, solution blending or in-situ polymerisation methods was made. The
electrical, thermal and mechanical characteristics are shown to incorporate more effectively
with graphene-based filler materials. A list of different graphene based composites and their
ultimate tensile strength (UTS) are given in Table 1.6. Electrical conductivities, thermal
conductivities of different graphene reinforced polymer composites are given in Table 1.7
and Table 1.8, respectively.
Table 1.6 Literature review on different nanocomposites showing the tensile with respective fabrication methods
Nanocomposites Filler loading
Fabrication method
UTS (MPa) Reference
PS/Graphene 1 wt.% Solution casting 42.5 (Fang et al.,
2009)
PP/Graphene 10 wt.% Melt blending 24 (Song et al., 2011)
PVDF/Graphene 5 wt.% Solution casting 100 (Layek et al.,
2010)
PVA/Graphene 2 wt.% Solution casting 42 (Wang et al.,
2011)
PVA/Graphene 0.7 wt.% In-Situ 85 (Liang et al., 2009)
(PS: Polystyrene, PP: Polypropylene, PVDF: Polyvinylidene difluoride, PVA: Polyvinyl alcohol)
30
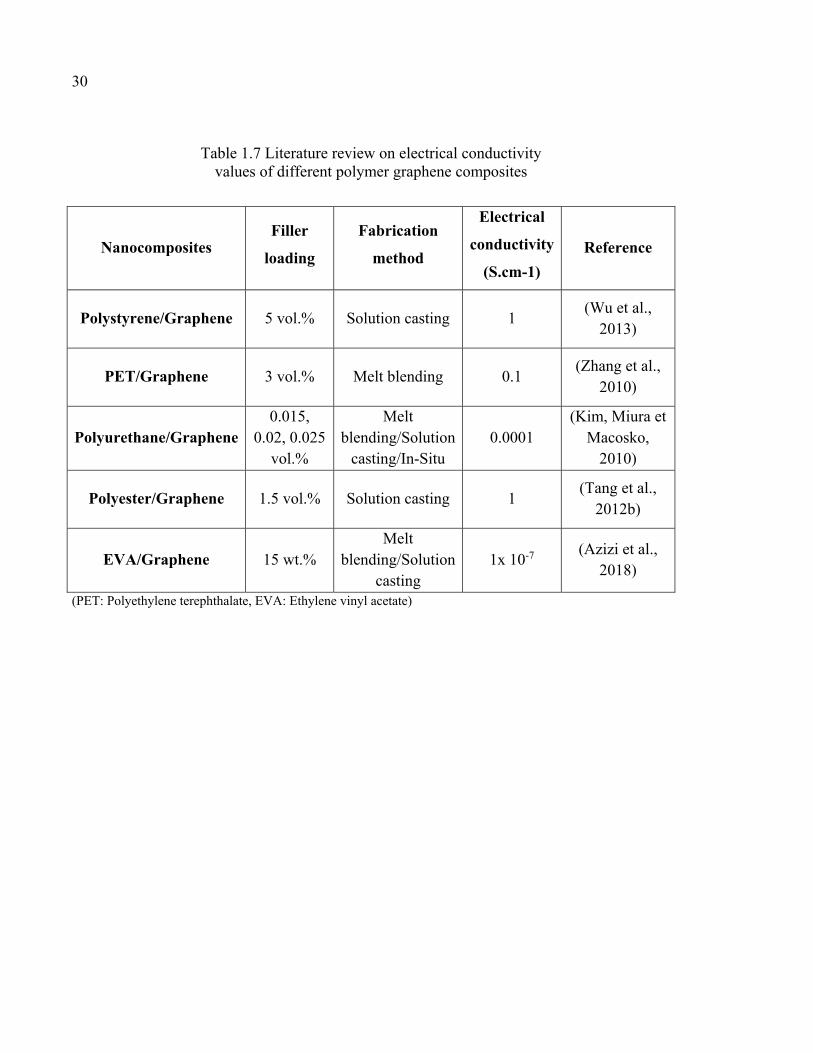
Table 1.7 Literature review on electrical conductivity values of different polymer graphene composites
Nanocomposites Filler
loading Fabrication
method
Electrical conductivity
(S.cm-1) Reference
Polystyrene/Graphene 5 vol.% Solution casting 1 (Wu et al., 2013)
PET/Graphene 3 vol.% Melt blending 0.1 (Zhang et al., 2010)
Polyurethane/Graphene 0.015,
0.02, 0.025 vol.%
Melt blending/Solution
casting/In-Situ 0.0001
(Kim, Miura et Macosko,
2010)
Polyester/Graphene 1.5 vol.% Solution casting 1 (Tang et al., 2012b)
EVA/Graphene 15 wt.% Melt
blending/Solution casting
1x 10⁻⁷ (Azizi et al., 2018)
(PET: Polyethylene terephthalate, EVA: Ethylene vinyl acetate)
31
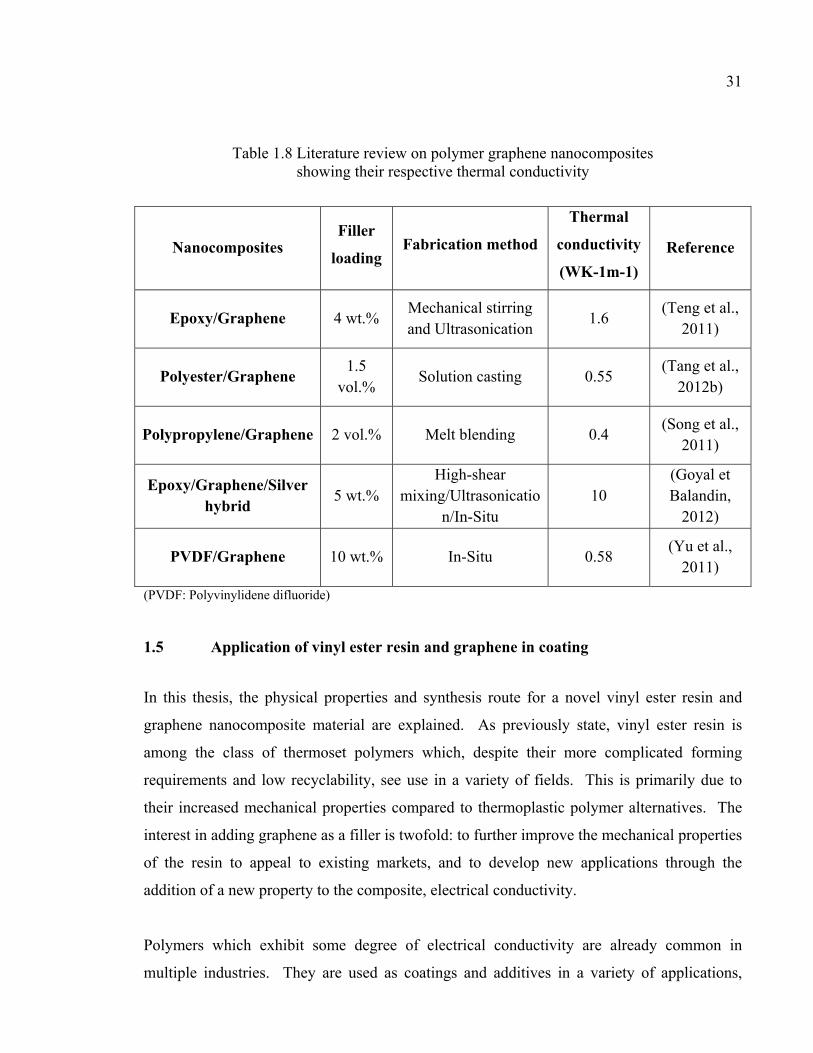
Table 1.8 Literature review on polymer graphene nanocomposites showing their respective thermal conductivity
Nanocomposites Filler
loading Fabrication method
Thermal conductivity (WK-1m-1)
Reference
Epoxy/Graphene 4 wt.% Mechanical stirring and Ultrasonication 1.6 (Teng et al.,
2011)
Polyester/Graphene 1.5 vol.% Solution casting 0.55 (Tang et al.,
2012b)
Polypropylene/Graphene 2 vol.% Melt blending 0.4 (Song et al., 2011)
Epoxy/Graphene/Silver hybrid 5 wt.%
High-shear mixing/Ultrasonicatio
n/In-Situ 10
(Goyal et Balandin,
2012)
PVDF/Graphene 10 wt.% In-Situ 0.58 (Yu et al., 2011)
(PVDF: Polyvinylidene difluoride)
1.5 Application of vinyl ester resin and graphene in coating
In this thesis, the physical properties and synthesis route for a novel vinyl ester resin and
graphene nanocomposite material are explained. As previously state, vinyl ester resin is
among the class of thermoset polymers which, despite their more complicated forming
requirements and low recyclability, see use in a variety of fields. This is primarily due to
their increased mechanical properties compared to thermoplastic polymer alternatives. The
interest in adding graphene as a filler is twofold: to further improve the mechanical properties
of the resin to appeal to existing markets, and to develop new applications through the
addition of a new property to the composite, electrical conductivity.
Polymers which exhibit some degree of electrical conductivity are already common in
multiple industries. They are used as coatings and additives in a variety of applications,
32
including integrated de-icing and security coatings for vehicle glass (Mcmaster, 1942) and
antistatic coatings for textiles (Gregory et al, 1991). The proposed vinyl ester resin –
graphene nanocomposite described herein offers a further alternative in the range of
electrically conducive materials for coatings which offers advantages in mechanical stability
compared to conventional technology. This material is applicable to many of the same fields
as conventional conductive polymers, such as electrical grounding coatings for equipment
and factory floors and to electromagnetic shielding applications such as for electrical devices
to reduce reception and transmittance of radio interference (Williams et al, 2017).

CHAPTER 2
MATERIALS AND METHODS
2.1 Introduction
This chapter describes the experimental materials, procedures and test methods used through
the thesis. Scheme in Fig. 2.1 shows a summary of the work in this master thesis. During the
experimental process, the fabrication and tests were carried out on two types of thermoset
resin: vinyl ester resin and bio-epoxy resin. The coating with vinyl ester resin was made with
graphene 3X and the coating with bio-epoxy with graphene OX. Although graphene black
OX exhibits higher electrical conductivity in pure state than graphene black 3X, a very low
electrical conductivity in the bio-epoxy composites were measured due to the poor
compatibility with the bio-resin matrix as shown with electron imaging. Therefore, the main
focus of the thesis is on the experiments and results of vinyl ester resin/graphene black 3X
composite materials. The content of bio-epoxy/graphene black OX is included in the section
Appendix I as complementary measurements.
Figure 2.1 The overview of the experimental procedure
34
2.2 Materials
The constituents of the composites synthesized are vinyl ester resin, methyl ethyl ketone
peroxide (MEKP) and graphene black 3X.
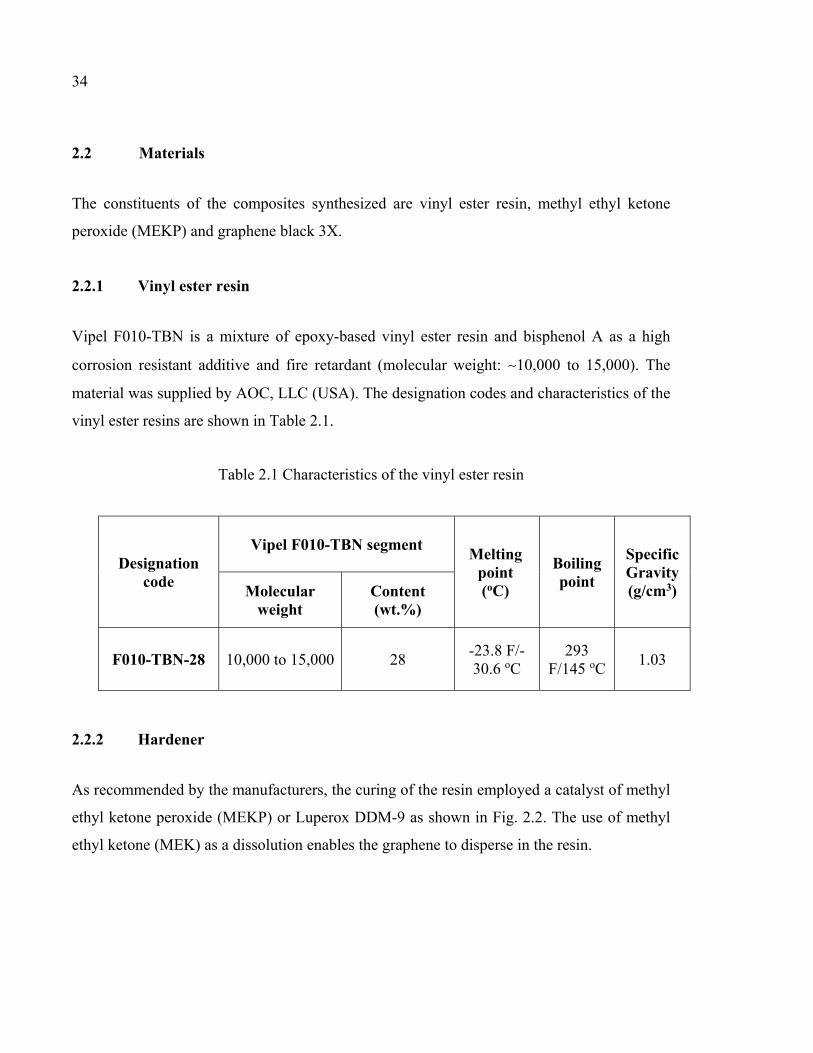
2.2.1 Vinyl ester resin
Vipel F010-TBN is a mixture of epoxy-based vinyl ester resin and bisphenol A as a high
corrosion resistant additive and fire retardant (molecular weight: ∼10,000 to 15,000). The
material was supplied by AOC, LLC (USA). The designation codes and characteristics of the
vinyl ester resins are shown in Table 2.1.
Table 2.1 Characteristics of the vinyl ester resin
2.2.2 Hardener
As recommended by the manufacturers, the curing of the resin employed a catalyst of methyl
ethyl ketone peroxide (MEKP) or Luperox DDM-9 as shown in Fig. 2.2. The use of methyl
ethyl ketone (MEK) as a dissolution enables the graphene to disperse in the resin.
Designation code
Vipel F010-TBN segment Melting point (oC)
Boiling point
Specific Gravity (g/cm3) Molecular
weight Content (wt.%)
F010-TBN-28 10,000 to 15,000 28 -23.8 F/-30.6 oC
293 F/145 oC 1.03
35
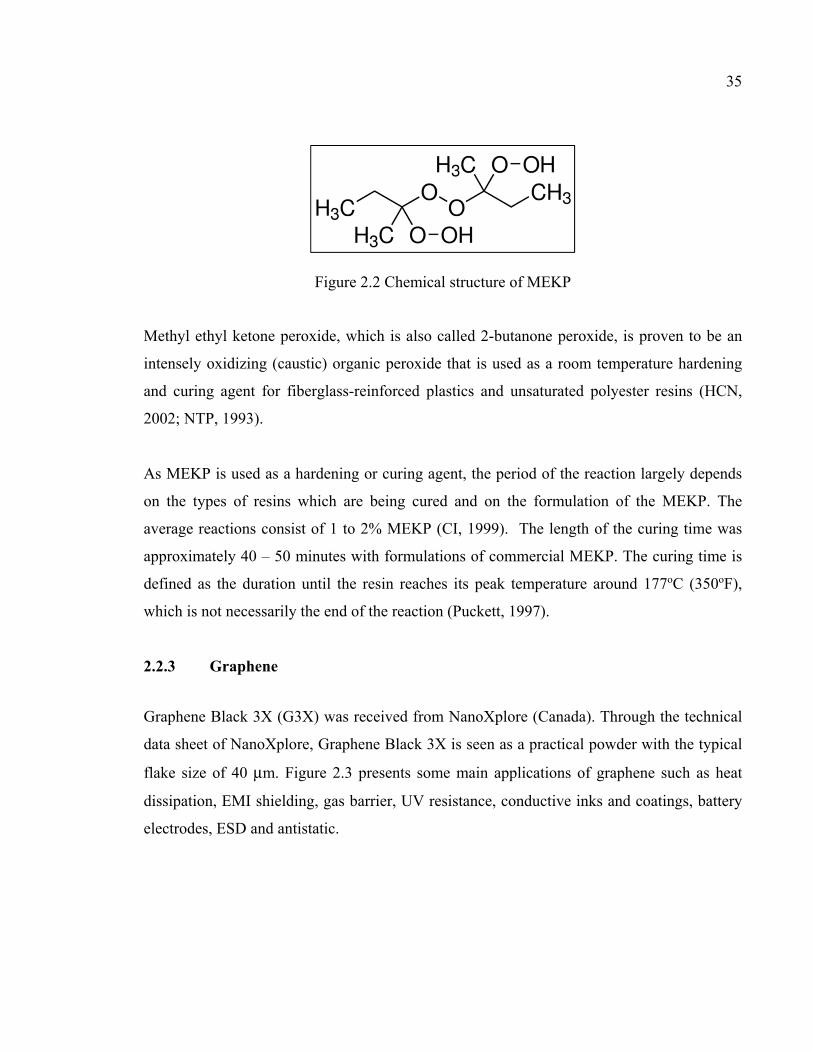
Figure 2.2 Chemical structure of MEKP
Methyl ethyl ketone peroxide, which is also called 2-butanone peroxide, is proven to be an
intensely oxidizing (caustic) organic peroxide that is used as a room temperature hardening
and curing agent for fiberglass-reinforced plastics and unsaturated polyester resins (HCN,
2002; NTP, 1993).
As MEKP is used as a hardening or curing agent, the period of the reaction largely depends
on the types of resins which are being cured and on the formulation of the MEKP. The
average reactions consist of 1 to 2% MEKP (CI, 1999). The length of the curing time was
approximately 40 – 50 minutes with formulations of commercial MEKP. The curing time is
defined as the duration until the resin reaches its peak temperature around 177oC (350oF),
which is not necessarily the end of the reaction (Puckett, 1997).
2.2.3 Graphene
Graphene Black 3X (G3X) was received from NanoXplore (Canada). Through the technical
data sheet of NanoXplore, Graphene Black 3X is seen as a practical powder with the typical
flake size of 40 μm. Figure 2.3 presents some main applications of graphene such as heat
dissipation, EMI shielding, gas barrier, UV resistance, conductive inks and coatings, battery
electrodes, ESD and antistatic.

36
Figure 2.3 The application of graphene black 3X in the industry (Technical data sheet from NanoXplore)
Physical and chemical properties are illustrated in Table 2.2 and Table 2.3 as following the
NanoXplore technical data sheet.
Table 2.2 Physical properties of graphene black 3X
Property Value
Particle size (laser diffraction) D50=38 μm Number of layers 6-10
Bulk density 0.18g/cm3 Solubility Insoluble
Moisture (TGA) <0.7 wt.% Peak decomposition temperature 750oC
Table 2.3 The graphene black 3X chemical composition values
Element Value Carbon >91 at.% Oxygen <7 at.% Sulfur <0.5 at.%
Metal impurities <2 at.%
37
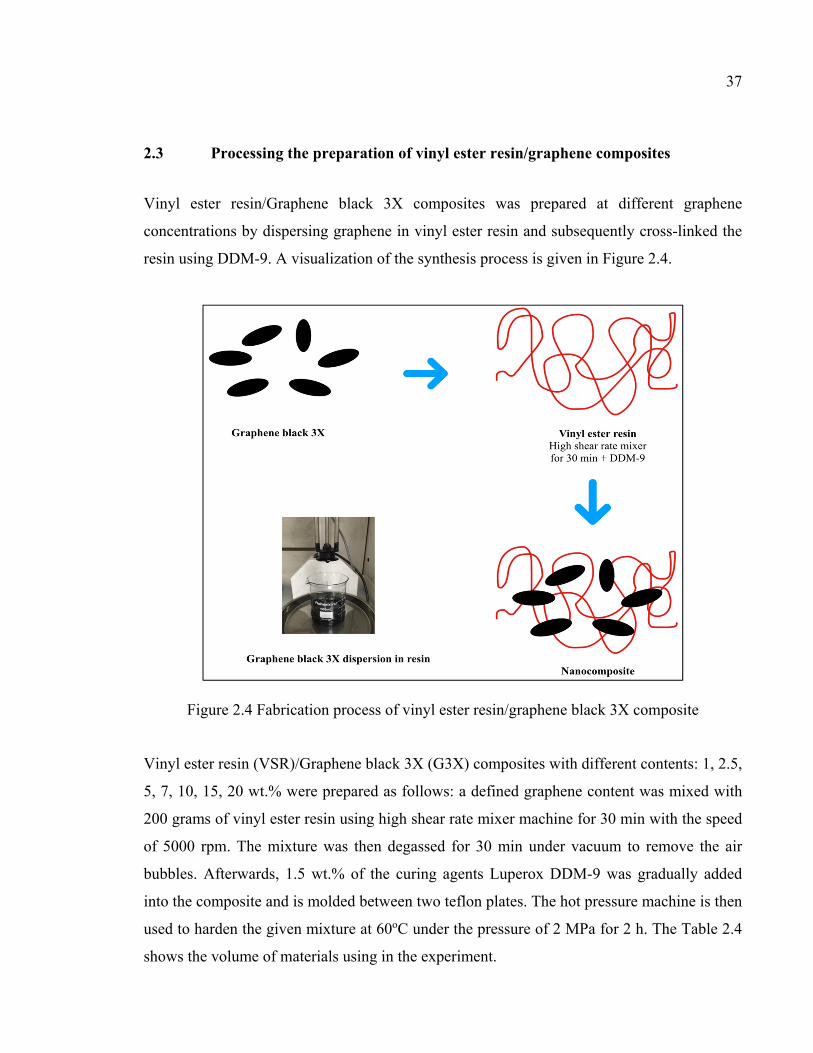
2.3 Processing the preparation of vinyl ester resin/graphene composites
Vinyl ester resin/Graphene black 3X composites was prepared at different graphene
concentrations by dispersing graphene in vinyl ester resin and subsequently cross-linked the
resin using DDM-9. A visualization of the synthesis process is given in Figure 2.4.
Figure 2.4 Fabrication process of vinyl ester resin/graphene black 3X composite
Vinyl ester resin (VSR)/Graphene black 3X (G3X) composites with different contents: 1, 2.5,
5, 7, 10, 15, 20 wt.% were prepared as follows: a defined graphene content was mixed with
200 grams of vinyl ester resin using high shear rate mixer machine for 30 min with the speed
of 5000 rpm. The mixture was then degassed for 30 min under vacuum to remove the air
bubbles. Afterwards, 1.5 wt.% of the curing agents Luperox DDM-9 was gradually added
into the composite and is molded between two teflon plates. The hot pressure machine is then
used to harden the given mixture at 60oC under the pressure of 2 MPa for 2 h. The Table 2.4
shows the volume of materials using in the experiment.
38
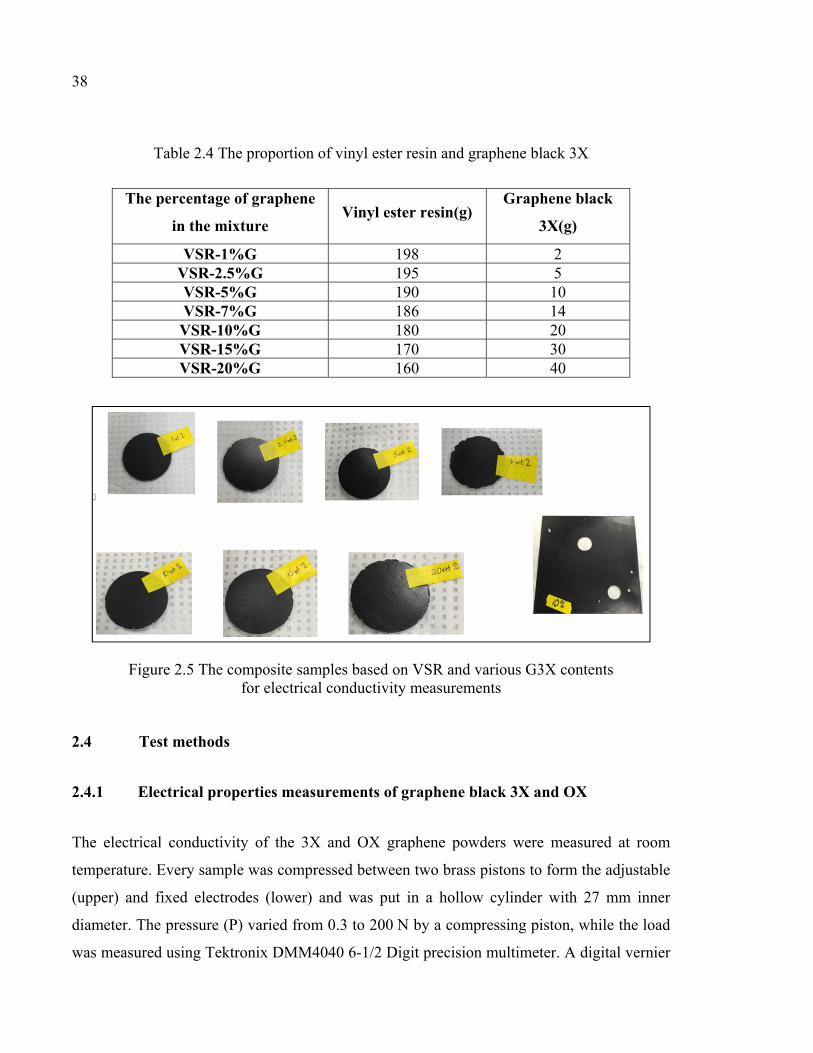
Table 2.4 The proportion of vinyl ester resin and graphene black 3X
The percentage of graphene in the mixture
Vinyl ester resin(g) Graphene black
3X(g)
VSR-1%G 198 2 VSR-2.5%G 195 5 VSR-5%G 190 10 VSR-7%G 186 14
VSR-10%G 180 20 VSR-15%G 170 30 VSR-20%G 160 40
Figure 2.5 The composite samples based on VSR and various G3X contents for electrical conductivity measurements
2.4 Test methods
2.4.1 Electrical properties measurements of graphene black 3X and OX
The electrical conductivity of the 3X and OX graphene powders were measured at room
temperature. Every sample was compressed between two brass pistons to form the adjustable
(upper) and fixed electrodes (lower) and was put in a hollow cylinder with 27 mm inner
diameter. The pressure (P) varied from 0.3 to 200 N by a compressing piston, while the load
was measured using Tektronix DMM4040 6-1/2 Digit precision multimeter. A digital vernier
39
caliper was used to measure the changes in height at each compression step. Conductivity
was measured using Tektronix DMM4040 6-1/2 Digit precision multimeter following
resistivity and pressure. Ohmic conductivity was measured using following formula :
(2.1)
Where σ is electrical conductivity, L is the sample distance, A is the area of the piston
surface, and R is resistivity.
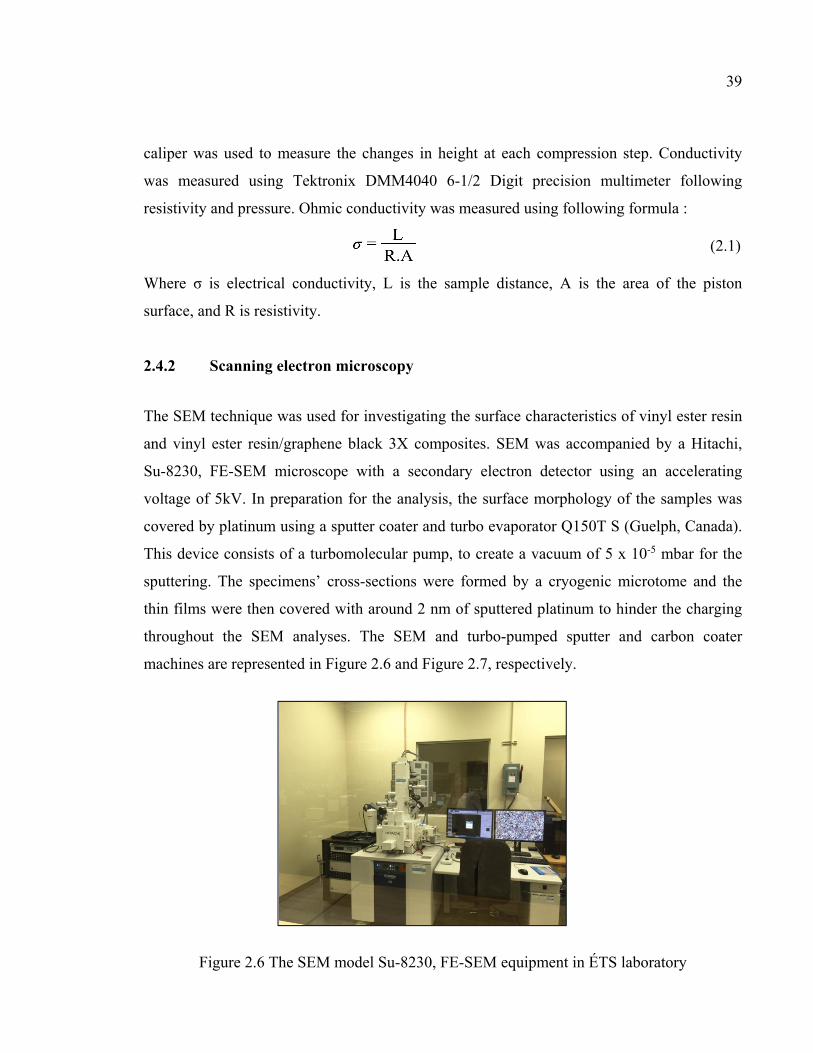
2.4.2 Scanning electron microscopy
The SEM technique was used for investigating the surface characteristics of vinyl ester resin
and vinyl ester resin/graphene black 3X composites. SEM was accompanied by a Hitachi,
Su-8230, FE-SEM microscope with a secondary electron detector using an accelerating
voltage of 5kV. In preparation for the analysis, the surface morphology of the samples was
covered by platinum using a sputter coater and turbo evaporator Q150T S (Guelph, Canada).
This device consists of a turbomolecular pump, to create a vacuum of 5 x 10⁻⁵ mbar for the
sputtering. The specimens’ cross-sections were formed by a cryogenic microtome and the
thin films were then covered with around 2 nm of sputtered platinum to hinder the charging
throughout the SEM analyses. The SEM and turbo-pumped sputter and carbon coater
machines are represented in Figure 2.6 and Figure 2.7, respectively.
Figure 2.6 The SEM model Su-8230, FE-SEM equipment in ÉTS laboratory
40
Figure 2.7 The turbo-pumped sputter machine in ÉTS laboratory
2.4.3 Atomic force microscope
To prepare the samples of polymers for atomic force microscopy analysis, a Leica RM2265
rotary microtome is used to section the samples. A 5 μm thick smooth, uniform section of
composite film is formed for each analysis by the Leica RM 2265 as shown in Figure 2.8.
Figure 2.8 Leica RM2265 rotary microsystem in ÉTS laboratory
41
An atomic force microscope (AFM) is used to observe the morphology and measure the
thickness of the black 3X graphene sheet. The images of AFM from the Université de
Montréal laboratory (Figure 2.9) reveals a typical tapping-mode AFM image in which
graphene black 3X sheet are directly deposited onto a Si-wafer substrate.
Figure 2.9 AFM images from the Université de Montréal laboratory
2.4.4 Thermogravimetric Analysis
The thermogravimetric analysis (TGA) was conducted to study sample mass changes under
rising temperature and controlled atmosphere. From this measurement, two data sets can be
obtained, which are weight loss-time and mass loss temperature. The analyses were carried
out in a combined system Thermogravimetric/Differential Thermal Analysis (TG/DTA). The
melting crucible was composed of platinum, and the analyzed temperature ranges was 200 –
700 °C and with soak at 700 °C for 3 min and a heating rate of 25 °C min-1 under a nitrogen
flow rate of 50 mL min-1. A sample weight from 10 to 15 mg was selected for each
measurement. The main devices for this analysis can be shown in Figure 2.10.
42
Figure 2.10 Diamond Thermogravimetric/Differential Thermal Analyzer device
2.4.5 Mechanical properties
For measurement of the mechanical properties, dog-bone shaped composite samples were cut
such that the distance between the grips was 40 mm, the thickness was1.45 mm and the width
was 6 mm as per ASTM E8 (Figure 2.11). The tensile strength measurements were
conducted with speed of 2 mm/min at room temperature (Figure 2.12). For each content of
fillers, the tensile test was carried out on at least three specimens and the results are averaged.
Figure 2.11 Nanocomposite dog-bone specimens for mechanical tests
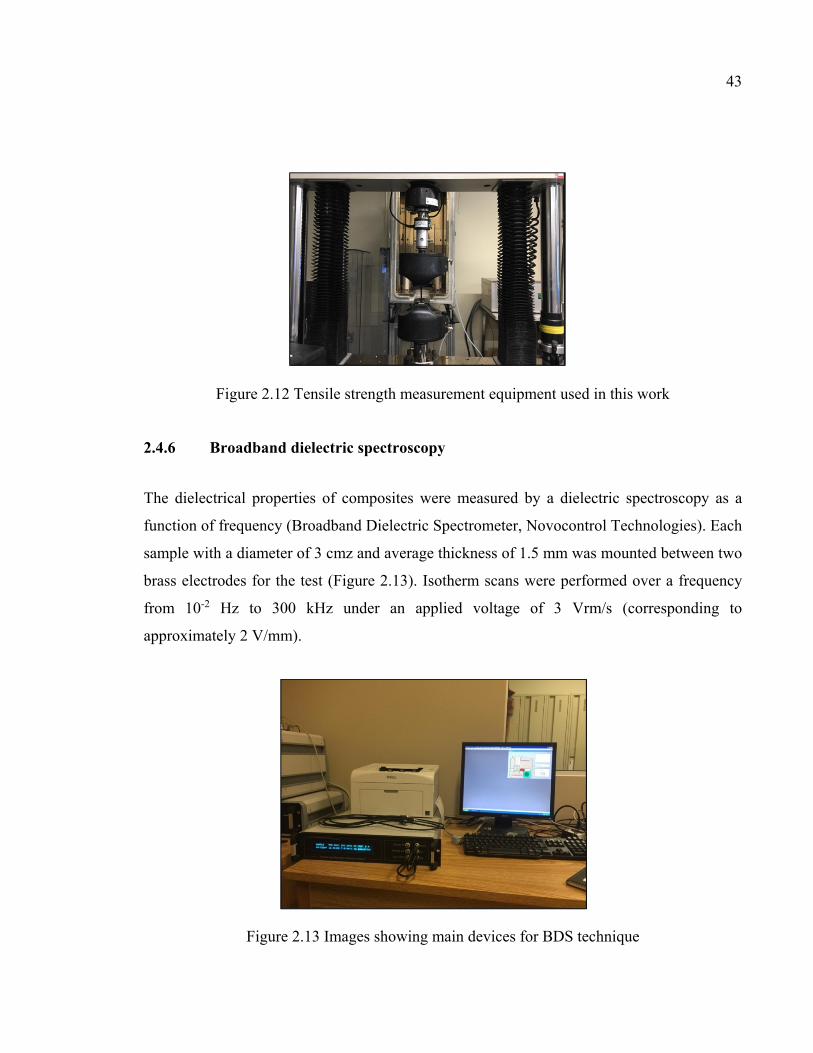
43
Figure 2.12 Tensile strength measurement equipment used in this work
2.4.6 Broadband dielectric spectroscopy
The dielectrical properties of composites were measured by a dielectric spectroscopy as a
function of frequency (Broadband Dielectric Spectrometer, Novocontrol Technologies). Each
sample with a diameter of 3 cmz and average thickness of 1.5 mm was mounted between two
brass electrodes for the test (Figure 2.13). Isotherm scans were performed over a frequency
from 10-2 Hz to 300 kHz under an applied voltage of 3 Vrm/s (corresponding to
approximately 2 V/mm).
Figure 2.13 Images showing main devices for BDS technique

44
2.4.7 Four-point probe
The four-point probe test was used to determine the resistivity of a composite materials. A
direct current (DC) power source with a high internal resistivity applies a current through two
outer electrodes. A voltmeter measures the potential drop between the two inner electrodes,
from which the resistivity in the sample can be calculated. The four-point probe test was
selected for this measurement due to its ability to correct for material-electrode contact
resistance. This increases the reliability of the measurement compared to two-point
equivalent tests.
The electrical conductivity of vinyl ester resin/graphene black 3X composites at different
loadings were determined using a four-point probe resistivity measurement system (Figure
2.14). Measurements of electrical conductivity were performed using a Keithley 2000
instrument. For measurement of the electrical properties, the composite films were cut to a
diameter of 3 cm and a thickness of 1.45 mm. The resistivity of the samples (ρ is the
resistivity (Ωcm) was measured in a four-point probe unit using the following equation.
(2.2)
(2.3)
Where V is the applied voltage, I is the measured current through the sample, F(t/s) is a
correction factor, s is the distance between the probes and s = 2.61 mm.
In this formula t is the film thickness, V is the measured voltage and I is the measured
current. This gives that the resistivity is independent of the distance s between the electrodes.
In this experiment, for a value of thickness t = 1.45 mm and s = 2.61 mm, we consider the
measurement of body resistivity on thin samples. From the Table 2.5, F(t/s) = 0.9948 with t =
1.45 mm, s = 2.61 mm.

45
Figure 2.14 Four-point probe collinear probe resistivity method
Table 2.5 Measurement of body resistivity ρ on thin samples of thickness t and spacing s Taken from F.M.Smits (1957)
t/s F(t/s) 0.4000 0.9995 0.5000 0.9974 0.5555 0.9948 0.6250 0.9898 0.7143 0.9798 0.8333 0.9600 1.0000 0.9214 1.1111 0.8907 1.2500 0.8490 1.4286 0.7938 1.6666 0.7225 2.000 0.6336


CHAPTER 3
RESULTS AND DISCUSSIONS
3.1 Introduction
A nanocomposite material was made via dispersing graphene black 3X into a vinyl ester
resin matrix. In this section, results and relevant discussions are presented.
3.2 Results and discussions
3.2.1 Electrical conductivity of 3X and OX graphene under compression
The samples were synthesized using a compressive force to increase the contact, form a
cohesive sample body and ensure conductivity. Here, we investigate first the electrical
conductivity of a well-known commercial graphene (G/X) containing particles of 3-6 layers
thick and another version, named OX graphene. The latter is expected to have higher purity
and thinner structure, making it more suitable for advanced technology. The comparison of
the electrical conductivity is made between both graphene products in samples of the same
mass (1 mg) with equal applied compression at the room temperature.
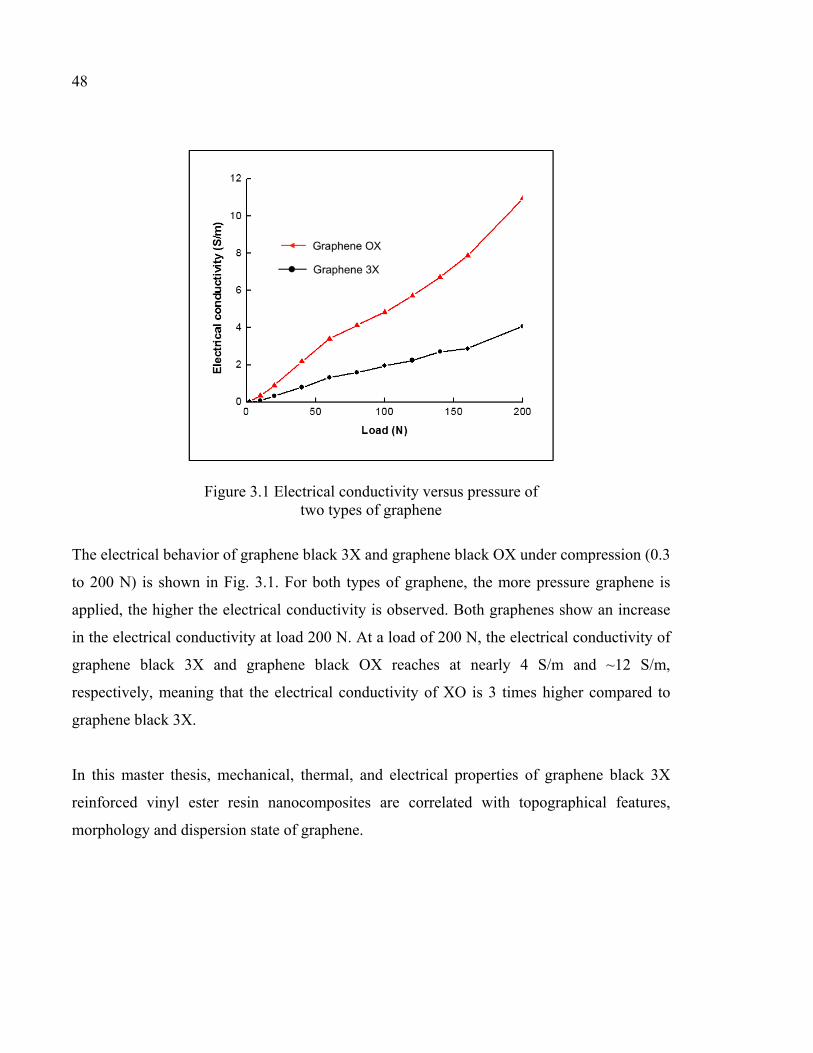
48
Figure 3.1 Electrical conductivity versus pressure of two types of graphene
The electrical behavior of graphene black 3X and graphene black OX under compression (0.3
to 200 N) is shown in Fig. 3.1. For both types of graphene, the more pressure graphene is
applied, the higher the electrical conductivity is observed. Both graphenes show an increase
in the electrical conductivity at load 200 N. At a load of 200 N, the electrical conductivity of
graphene black 3X and graphene black OX reaches at nearly 4 S/m and ~12 S/m,
respectively, meaning that the electrical conductivity of XO is 3 times higher compared to
graphene black 3X.
In this master thesis, mechanical, thermal, and electrical properties of graphene black 3X
reinforced vinyl ester resin nanocomposites are correlated with topographical features,
morphology and dispersion state of graphene.
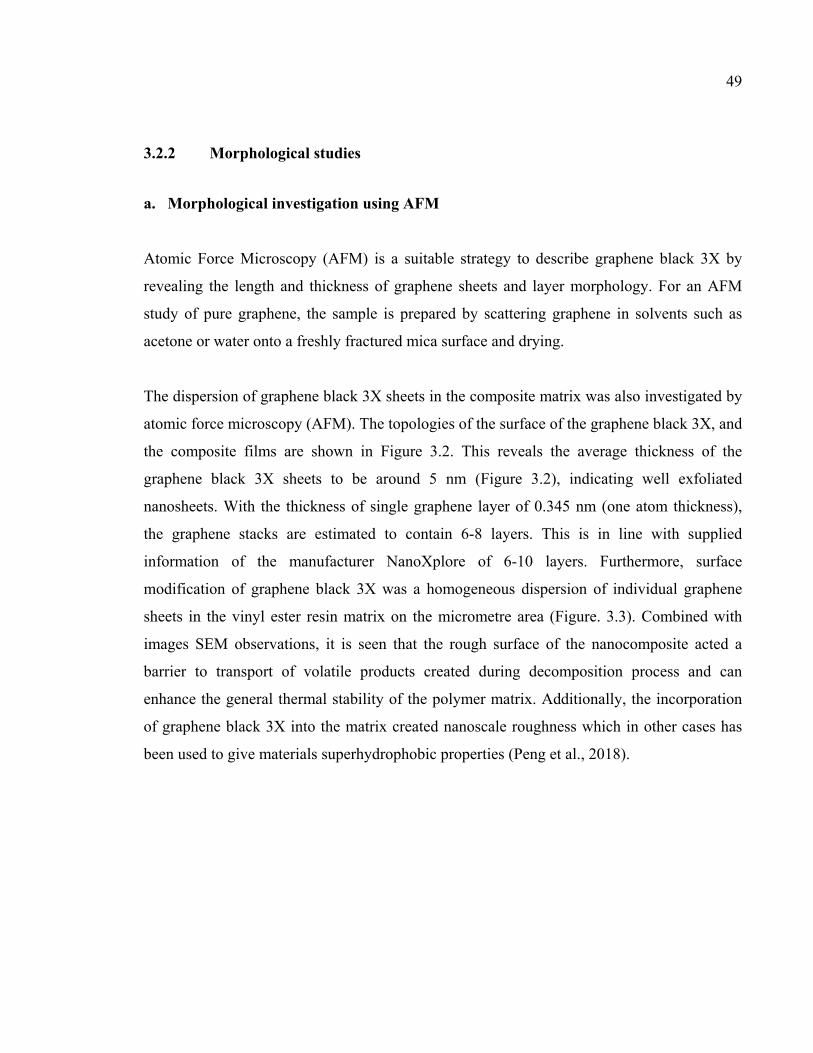
49
3.2.2 Morphological studies
a. Morphological investigation using AFM
Atomic Force Microscopy (AFM) is a suitable strategy to describe graphene black 3X by
revealing the length and thickness of graphene sheets and layer morphology. For an AFM
study of pure graphene, the sample is prepared by scattering graphene in solvents such as
acetone or water onto a freshly fractured mica surface and drying.
The dispersion of graphene black 3X sheets in the composite matrix was also investigated by
atomic force microscopy (AFM). The topologies of the surface of the graphene black 3X, and
the composite films are shown in Figure 3.2. This reveals the average thickness of the
graphene black 3X sheets to be around 5 nm (Figure 3.2), indicating well exfoliated
nanosheets. With the thickness of single graphene layer of 0.345 nm (one atom thickness),
the graphene stacks are estimated to contain 6-8 layers. This is in line with supplied
information of the manufacturer NanoXplore of 6-10 layers. Furthermore, surface
modification of graphene black 3X was a homogeneous dispersion of individual graphene
sheets in the vinyl ester resin matrix on the micrometre area (Figure. 3.3). Combined with
images SEM observations, it is seen that the rough surface of the nanocomposite acted a
barrier to transport of volatile products created during decomposition process and can
enhance the general thermal stability of the polymer matrix. Additionally, the incorporation
of graphene black 3X into the matrix created nanoscale roughness which in other cases has
been used to give materials superhydrophobic properties (Peng et al., 2018).
50
Figure 3.2 AFM image of graphene black 3X with 500x500 nm

51
Figure 3.3 AFM images of VSR_20%G with 3x3μm
b. Morphological investigation using SEM The morphological properties of a polymeric nanocomposite can be changed by
incorporation of graphene black 3X in different ratios. The packing arrangement of the
polymer may be affected by the dispersion of foreign element in the continuous polymeric
matrix, which can cause the formation of voids. In certain cases, the characteristics of the
nanocomposite are adversely influenced, which suggests the agglomeration of the particles in
the polymeric matrix. Therefore, checking the dispersion of the graphene black 3X in the
bulk of the nanocomposite is of great importance to interpreting the results.
The images shown in Figure 3.4 document the distribution of graphene black 3X in the
matrix with increasing loading from 1 to 10 wt.%. Figure 3.4a and Figure 3.4b demonstrate
an uneven dispersion of graphene in the vinyl ester resin, which takes the appearance of a
layered structure compared to the smooth surface of the vinyl ester resin. However, in the
other images, the well uniform dispersion of graphene black 3X sheets in the polymer matrix
are shown. The images from SEM displays that the distribution of graphene sheets black 3X
in the vinyl ester resin is random. This is most evident in the Figure 3.4b with 5 wt.% loading
of graphene.
52
Figure 3.5 shows the SEM of graphene black 3X to be a layered, occasionally folded
structure. The thickness of these layered graphene sheets is measured to be 119 nm and 471
nm in folded areas (Figure 3.5a). This is in contrast to the dispersed graphene sheets
measured by AFM to have a thickness between 43 nm to 73 nm as shown in Figure 3.5b.
This phenomenon of a few restacking may affect the tensile properties and other
characteristics of the composites. By SEM, the width of a graphene sheets can be measured
to be between 10.6 μm to 17.5 μm as shown in Figure 3.5c and Figure 3.5d. These SEM
results reveal that the compatibility of graphene black 3X with the resin was enhanced as the
proportion of carbon black in the polymer matrix increased. Through a random distribution
of cross-linked graphene sheets, a nanocomposite can be formed with the characteristic
properties of the graphene such as enhanced electrical conductivity and mechanical
properties.
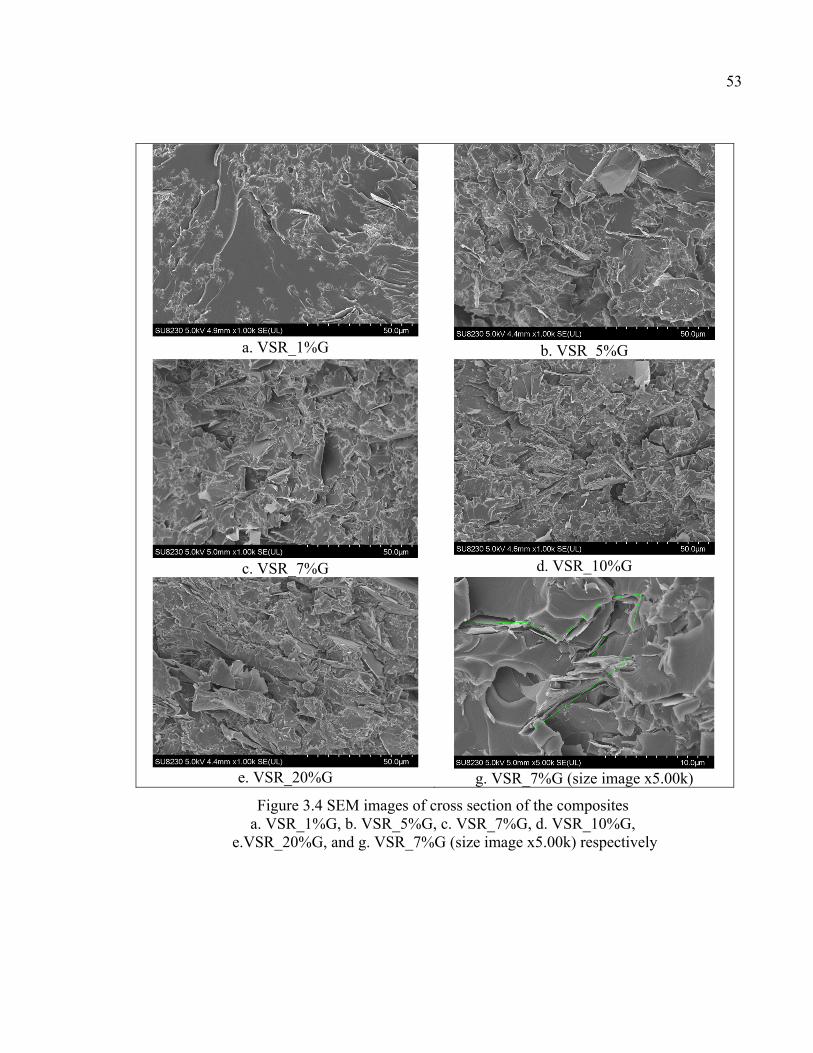
53
a. VSR_1%G
b. VSR_5%G
c. VSR_7%G
d. VSR_10%G
e. VSR_20%G
g. VSR_7%G (size image x5.00k)
Figure 3.4 SEM images of cross section of the composites a. VSR_1%G, b. VSR_5%G, c. VSR_7%G, d. VSR_10%G,
e.VSR_20%G, and g. VSR_7%G (size image x5.00k) respectively

54
a. The graphene layer is folded
b. The thickness of graphene layers
c. The width of graphene layers d. The images of 1 graphene sheet
Figure 3.5 SEM images of structure characteristics of black 3X graphene in vinyl ester matrix a. graphene layer is folded, b. c. thickness and width of graphene layers,
and d. the graphene sheet
3.2.3 Thermal properties
The effect of the addition of graphene black 3X on the thermal degradation of vinyl ester
resin was studied by thermogravimetric analysis (TGA). TGA curves for vinyl ester resin
with hardener resin (VSR_H), vinyl ester resin with varying amounts of graphene 3X loading
(VSR X%G), and graphene black 3X (G3X) are shown in Figure 3.6 with corresponding data
being summarized in Table 3.1.

55
From the TGA curve of VSR_H, the initial weight loss occurs at temperature of 400 °C
(Figure 3.6 (VSR_H)). The most dramatic weight loss, starting from 350 °C, corresponds to
the degradation of the backbone chain (CH2 groups) in polymer (Bora et Dolui, 2012;
Costache, Jiang et Wilkie, 2005; Sabet, Soleimani et Hosseini, 2018; Wu, Zhao et Chen,
2012). The second mass loss begins at 580°C and is related to the evaporation of resin in the
composite matrix. When the temperature reaches to 700 °C, the residual weight is
approaching 0 %, meaning that the resin is almost entirely decomposed. Graphene black 3X
plays an important role in the thermostability of the composites. On incorporation of
graphene black 3X, the major degradation temperature of vinyl ester resin was remarkably
improved from 170-230 °C (Figure 3.5a). This improvement in thermal stability is attributed
to the strong interaction between graphene black 3X and vinyl ester resin which stabilizes the
polymer segments at the interfaces of vinyl ester resin and graphene 3X. The incorporation of
graphene into the matrix acts as a mass transport barrier to the volatile products generated
during decomposition which may enhance the overall thermal stability of the composite.
The results of the differential thermal analysis (DTA) of the vinyl ester resin composites with
graphene black 3X display two-step thermal degradation as shown in Figure 3.7. Consistent
with the TGA results, the primary degradation begins at 420°C. Interestingly, it is observed
that with higher loading of graphene the decomposition shifts to slightly lower temperatures.
However, the decomposition temperature plummeted in first phase when there was no
enhancement of graphene in the resin film. As considered by Figure 3.6 and Figure 3.7, the
addition of graphene black 3X slightly increases the thermal endurance of the composites.
Table 3.1 demonstrates that increasing the percentage of graphene substance will improve the
thermal properties of the nanocomposite materials.
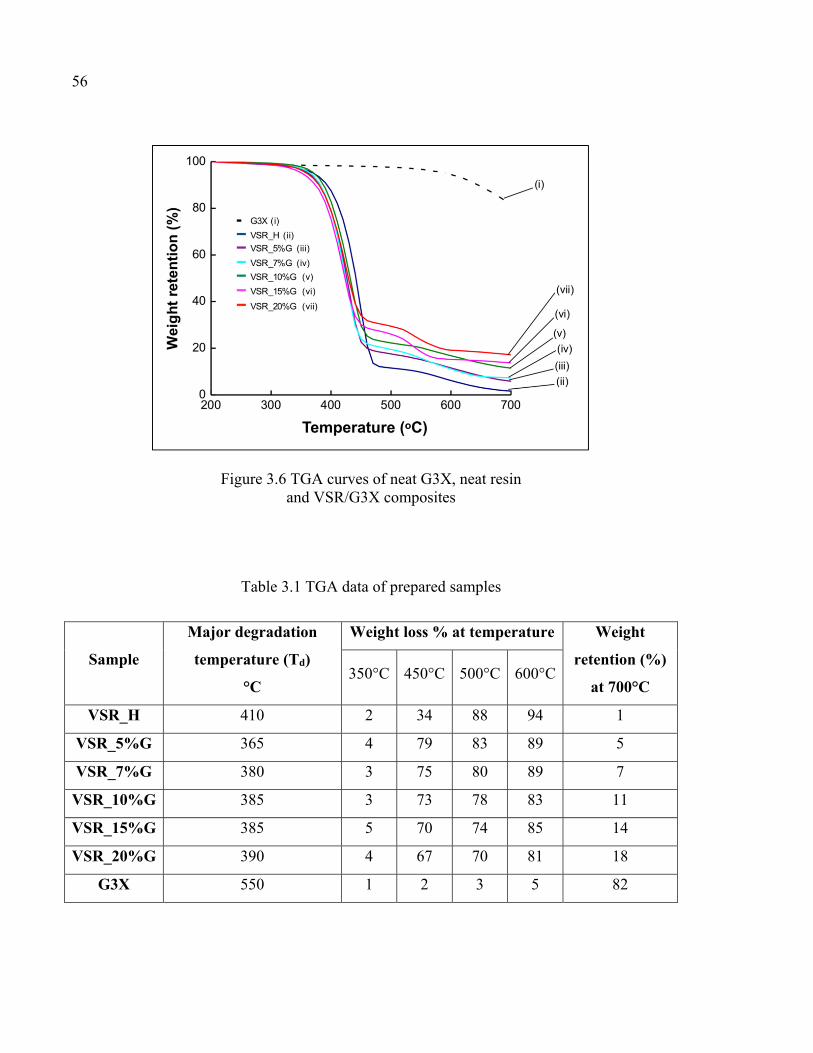
56
Figure 3.6 TGA curves of neat G3X, neat resin and VSR/G3X composites
Table 3.1 TGA data of prepared samples
Sample Major degradation temperature (Td)
°C
Weight loss % at temperature Weight retention (%)
at 700°C 350°C 450°C 500°C 600°C
VSR_H 410 2 34 88 94 1
VSR_5%G 365 4 79 83 89 5
VSR_7%G 380 3 75 80 89 7
VSR_10%G 385 3 73 78 83 11
VSR_15%G 385 5 70 74 85 14
VSR_20%G 390 4 67 70 81 18
G3X 550 1 2 3 5 82

57
Figure 3.7 DFA thermograms of the derivative of mass loss as a function of temperature
3.2.4 Mechanical properties
In many applications of coatings, mechanical stability is required for the protection of the
substrate. Due to the large particle aspect ratio and outstanding mechanical theoretical
strength, the graphene black 3X reinforcement of vinyl ester resin shows a significant impact
on the mechanical properties of the composites. The representative stress-strain curves of the
composites at various graphene loadings are shown in Figure 3.8. The measured
improvement is observed to be dependent on the graphene content. For 5 wt% loading, the
primary improvement is in the ultimate strain. However, for higher graphene contents, the
composites exhibit a significant increase in ultimate tensile strength. Even at as little as 7
wt.% graphene the tensile strength is 1.5 times as higher than 5 wt.%, demonstrating the
importance of the dispersion of the graphene particles, as observed in the SEM results
(Figure 3.4g). Additions up to 20% graphene demonstrate significant increases in the
ultimate strain up to 3.5 mm/mm.
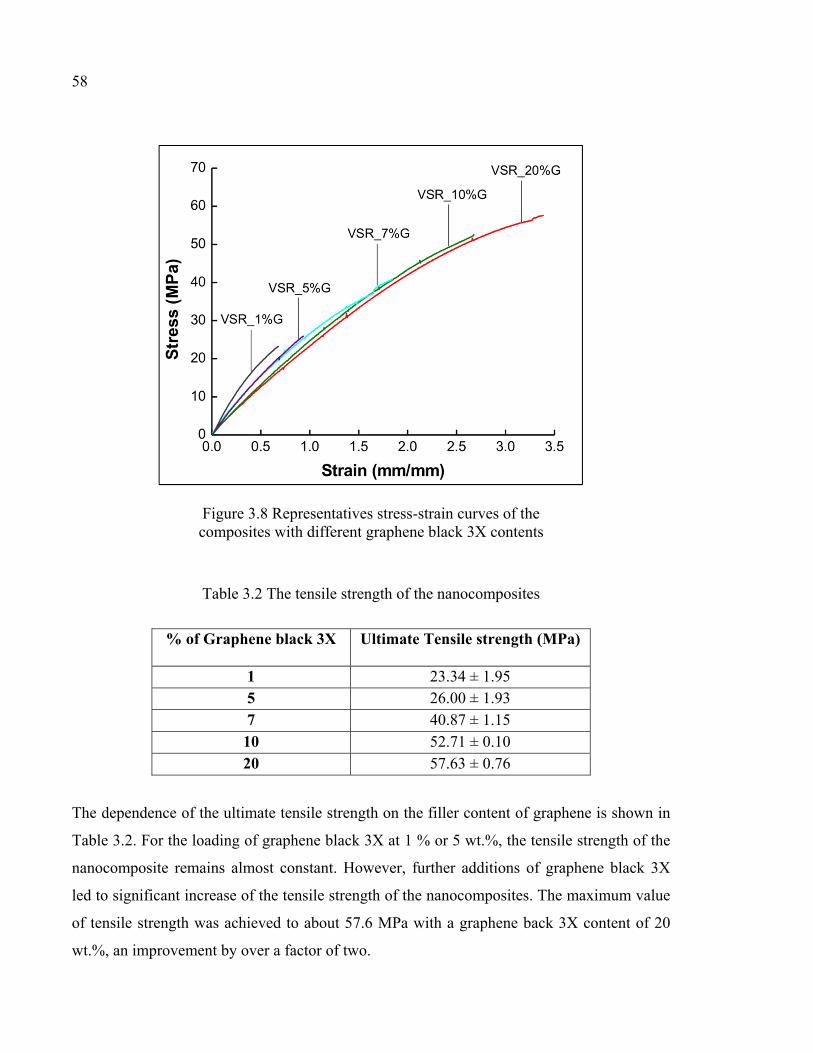
58
Figure 3.8 Representatives stress-strain curves of the composites with different graphene black 3X contents
Table 3.2 The tensile strength of the nanocomposites
% of Graphene black 3X Ultimate Tensile strength (MPa)
1 23.34 ± 1.95 5 26.00 ± 1.93 7 40.87 ± 1.15
10 52.71 ± 0.10 20 57.63 ± 0.76
The dependence of the ultimate tensile strength on the filler content of graphene is shown in
Table 3.2. For the loading of graphene black 3X at 1 % or 5 wt.%, the tensile strength of the
nanocomposite remains almost constant. However, further additions of graphene black 3X
led to significant increase of the tensile strength of the nanocomposites. The maximum value
of tensile strength was achieved to about 57.6 MPa with a graphene back 3X content of 20
wt.%, an improvement by over a factor of two.

59
3.2.5 Electrical properties
a. Four-point probe test The electrical conductivity of vinyl ester resin/graphene black 3X composites at different
graphene contents are determined using a four-point probe resistivity measurement system as
shown in Figure 3.9. This figure shows that composites with at least 7 % of G3X exhibit
some degree of electrical conductivity with constant conductivity for current intensities up to
5 mA. Moreover, the electrical conductivity increases with the of graphene content in the
formulations. The samples containing 20 wt.% of G3X demonstrate the highest conductivity
tested of about 3.7 10-2 S/cm. Increasing higher conductivity with content is explained by the
increased probability of favorable electrical contacts between graphene particles dispersed
homogeneously in the resin matrix.
Figure 3.9 Electrical properties by four point probe test of VSR_G3X
60
b. Broadband dielectric spectroscopy The electrical conductivity of vinyl ester resin-graphene black 3X nanocomposites as a
function of frequency-domain dielectric responses is shown in Figure 3.10 and Figure 3.11,
in terms of modulus of the complex conductivity. The measurements were recorded from 10-2
to 30 kHz frequency at room temperature.
The vinyl ester resin containing 3 - 20 wt.% of graphene black 3X featured a percolation
threshold concentration at about 5 wt.% which represents a dominance of the electrical
conduction over dielectric response in the frequency range. The dielectric response of vinyl
ester resin with 5% graphene loading (VSR_5% G) exhibited high frequency-independent
dielectric losses. Meanwhile, resin with 7% graphene (VSR_7% G) demonstrated electrical
conductivity breakthrough, exposing the high-frequency property. At 5 wt.% of G3X, the
nanocomposites had an alternating current conductivity over 10-8 S/cm at 0.01 Hz as shown
in Figure 3.10. When the concentration rises above the percolation threshold, the
conductivity increases rapidly.
Figure 3.11 presents the value of the vinyl ester resin sample with the hardener (VSR_H),
with 1% graphene (VSR_1%G), and with 3% (VSR_3%G). At low filler concentration, the
dielectric response of graphene 3X and vinyl ester resin composite is measured to be under
10-15 S/cm and the vinyl ester resin pure is 10-17 S/cm. This demonstrates the range of
improvement possible with additions of graphene to the resin matrix.
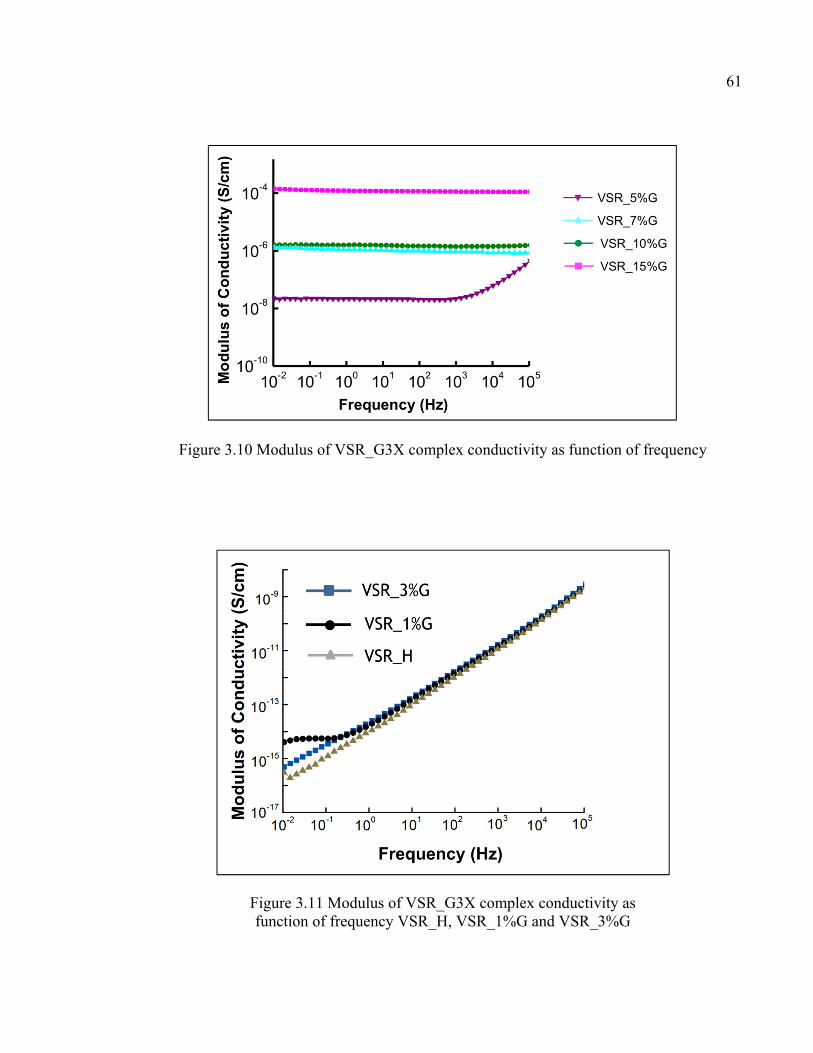
61
Figure 3.10 Modulus of VSR_G3X complex conductivity as function of frequency
Figure 3.11 Modulus of VSR_G3X complex conductivity as function of frequency VSR_H, VSR_1%G and VSR_3%G

CONCLUSION
The objective in this master thesis is to advance a new nanocomposite material through the
process of mixing graphene black 3X with Vinyl ester resin matrix. Apart from the
investigation into the characterization of the synthesized samples, the writing also provides a
central focus on the optimal preparation of graphene based vinyl ester resin nanocomposite.
Some particular properties of importance are exhibited by these novel materials including
improved thermal stability, enhanced mechanical strength and electrical conductivity. The
success of incorporating graphene into the polymer matrix is observed in the morphological
analyses by SEM and AFM.
In the first chapter of the thesis, the theoretical foundation for the work was explained and a
literature review provided a background on thermoset resins, vinyl ester resin, graphene, and
relevant characterization methods. Chapter 2 presented an in-depth review of the materials
and methods utilized in this work. The specific materials, synthesis method, characterization
techniques and testing procedures involved in the making and analysis of graphene vinyl
ester resin composite were explained to clarify the experiments conducted for this thesis.
Chapter 3 provides the results of those tests indicating a beneficial combination of properties
for composites of graphene and vinyl ester resin. By incorporating black 3X graphene
particles into a resin matrix, it is possible to fabricate low graphene content conductive
coatings with improved thermal stability. TGA analysis shows that these nanocomposites can
be used at a temperature lower than 300oC without any chemical decomposition. Electrically
conductive coatings can be achieved with the addition of only 5 % of graphene. The highest
value of conductivity was 3.7. 10-2 S/cm with 20 wt.% of G3X, high enough to various
electrical devices. Furthermore, it was observed that the mechanical properties can be
increased by a factor of two. This combination of improvements in both mechanical stability
and electrical functionalization is exceptional and suggests a future for this type of graphene
thermoset nanocomposite in a variety of applications.

RECOMMENDATIONS Although the preliminary results issued in this work are encouraging, there remains several
open questions for future work to explore. For example:
a. What are chemical interactions at the graphene/resin interface?
b. What is the real distribution of graphene in the resin matrix?
c. How to improve the dispersion of fillers and thus reduce the filler content to achieving the
similar performance (electrical, thermal, mechanical properties).
The BisPhenol A (BPA) containing epoxy-vinyl ester resin used in this work has a negative
impact on the environment, so there is significant interest in replacing this by a green-
sourced or high recyclability alternative. This is the motivation behind planning similar
investigations of nanocomposites based on a bioepoxy resin (bio-resource resin). However,
this dispersion of the graphene in the bioepoxy was difficult with current laboratory
fabrication methods. Preliminary results which formed an insulating composite even at high
graphene content are included in the Appendix.
It is expected that bio-based polymer composite products will be available in the market
based on this technique in the upcoming years. However, the study of mechanisms related to
the production and functionalization of graphene nanomaterials will continue to require more
research to generate sustainable products for the global market.

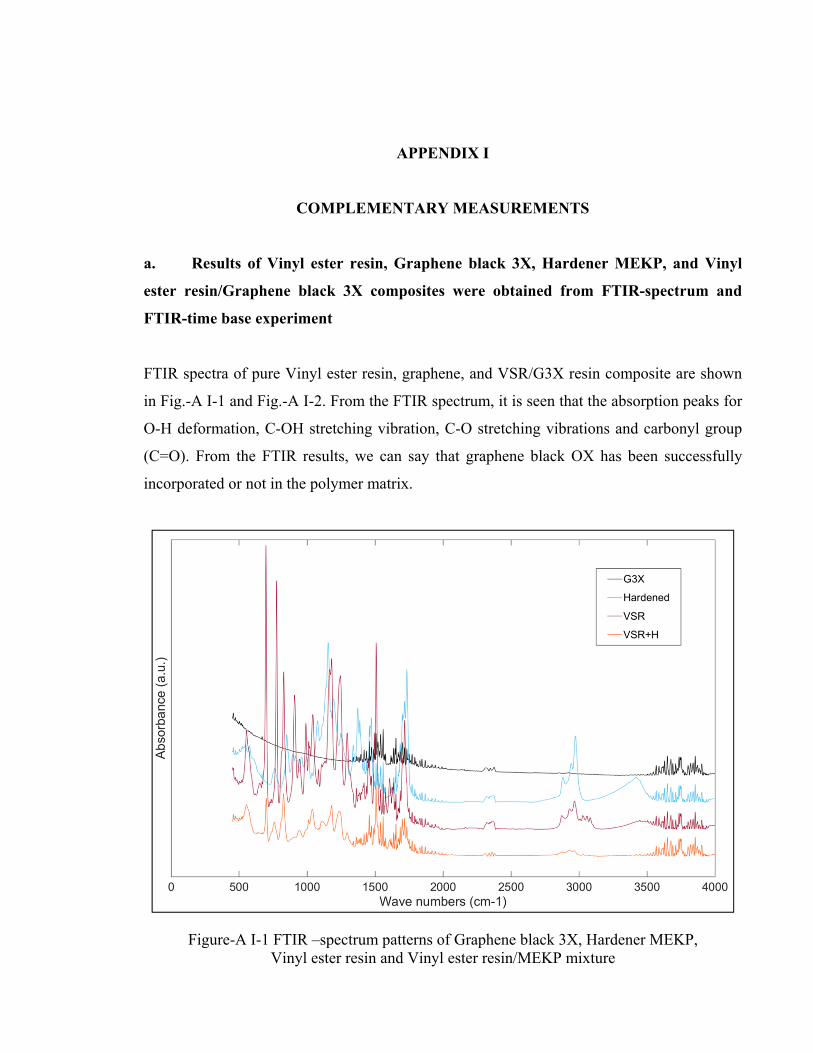
APPENDIX I
COMPLEMENTARY MEASUREMENTS
a. Results of Vinyl ester resin, Graphene black 3X, Hardener MEKP, and Vinyl ester resin/Graphene black 3X composites were obtained from FTIR-spectrum and FTIR-time base experiment
FTIR spectra of pure Vinyl ester resin, graphene, and VSR/G3X resin composite are shown
in Fig.-A I-1 and Fig.-A I-2. From the FTIR spectrum, it is seen that the absorption peaks for
O-H deformation, C-OH stretching vibration, C-O stretching vibrations and carbonyl group
(C=O). From the FTIR results, we can say that graphene black OX has been successfully
incorporated or not in the polymer matrix.
Figure-A I-1 FTIR –spectrum patterns of Graphene black 3X, Hardener MEKP, Vinyl ester resin and Vinyl ester resin/MEKP mixture
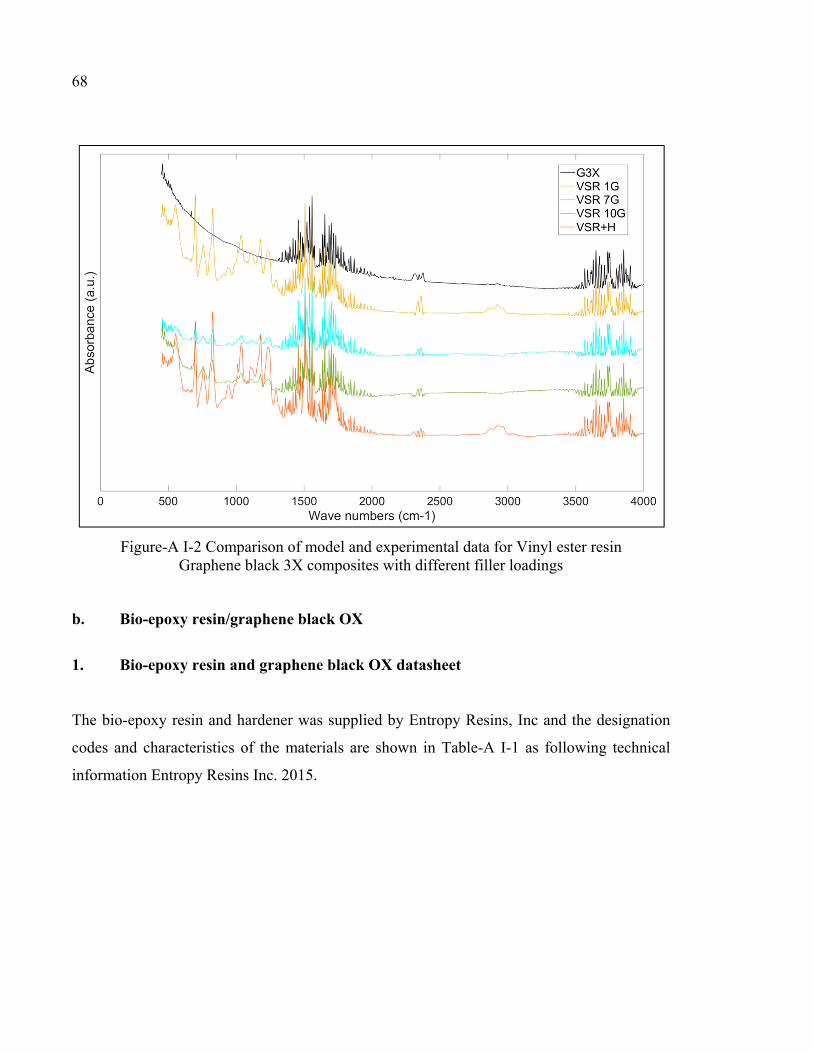
68
Figure-A I-2 Comparison of model and experimental data for Vinyl ester resin
Graphene black 3X composites with different filler loadings
b. Bio-epoxy resin/graphene black OX 1. Bio-epoxy resin and graphene black OX datasheet The bio-epoxy resin and hardener was supplied by Entropy Resins, Inc and the designation
codes and characteristics of the materials are shown in Table-A I-1 as following technical
information Entropy Resins Inc. 2015.
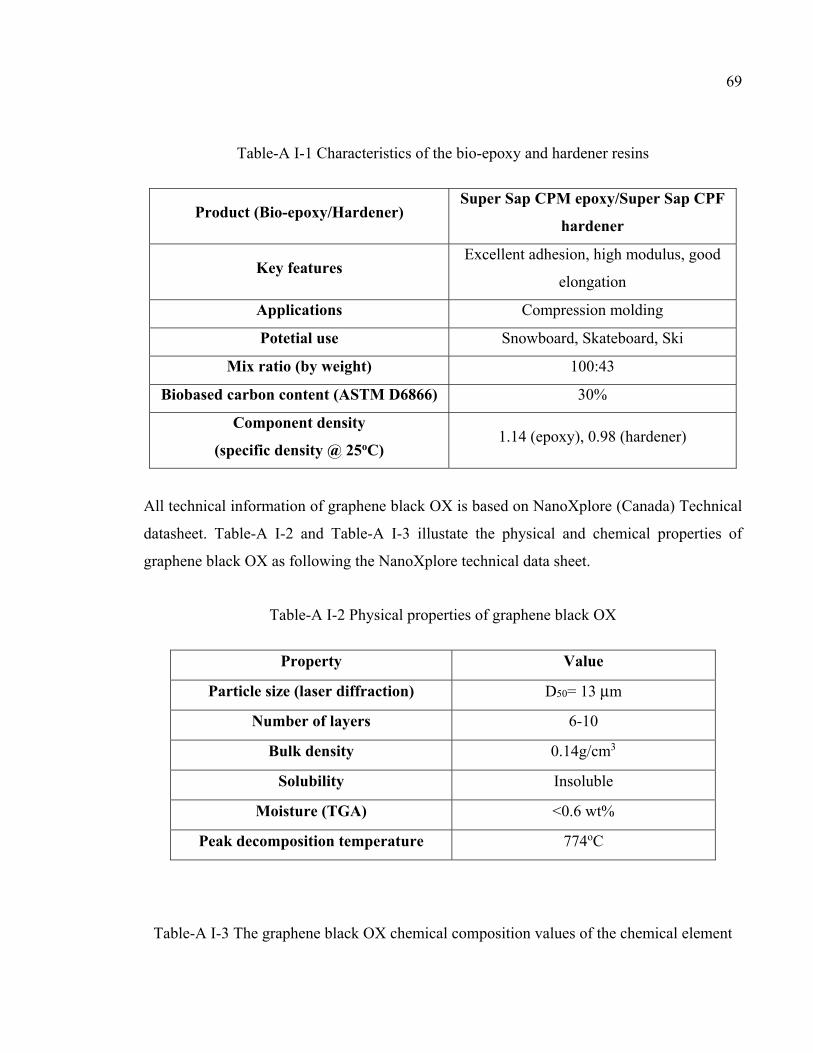
69
Table-A I-1 Characteristics of the bio-epoxy and hardener resins
Product (Bio-epoxy/Hardener) Super Sap CPM epoxy/Super Sap CPF
hardener
Key features Excellent adhesion, high modulus, good
elongation
Applications Compression molding
Potetial use Snowboard, Skateboard, Ski
Mix ratio (by weight) 100:43
Biobased carbon content (ASTM D6866) 30%
Component density (specific density @ 25oC)
1.14 (epoxy), 0.98 (hardener)
All technical information of graphene black OX is based on NanoXplore (Canada) Technical
datasheet. Table-A I-2 and Table-A I-3 illustate the physical and chemical properties of
graphene black OX as following the NanoXplore technical data sheet.
Table-A I-2 Physical properties of graphene black OX
Property Value
Particle size (laser diffraction) D50= 13 μm
Number of layers 6-10
Bulk density 0.14g/cm3
Solubility Insoluble
Moisture (TGA) <0.6 wt%
Peak decomposition temperature 774oC
Table-A I-3 The graphene black OX chemical composition values of the chemical element
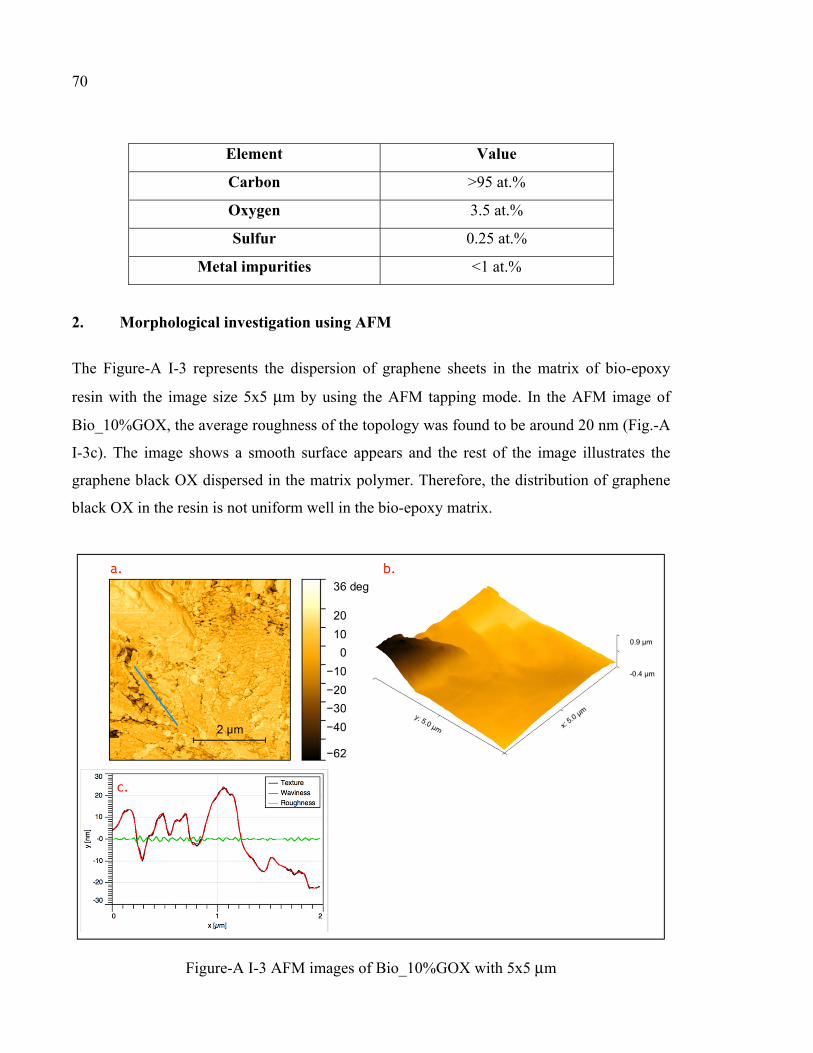
70
Element Value
Carbon >95 at.%
Oxygen 3.5 at.%
Sulfur 0.25 at.%
Metal impurities <1 at.%
2. Morphological investigation using AFM The Figure-A I-3 represents the dispersion of graphene sheets in the matrix of bio-epoxy
resin with the image size 5x5 μm by using the AFM tapping mode. In the AFM image of
Bio_10%GOX, the average roughness of the topology was found to be around 20 nm (Fig.-A
I-3c). The image shows a smooth surface appears and the rest of the image illustrates the
graphene black OX dispersed in the matrix polymer. Therefore, the distribution of graphene
black OX in the resin is not uniform well in the bio-epoxy matrix.
Figure-A I-3 AFM images of Bio_10%GOX with 5x5 μm
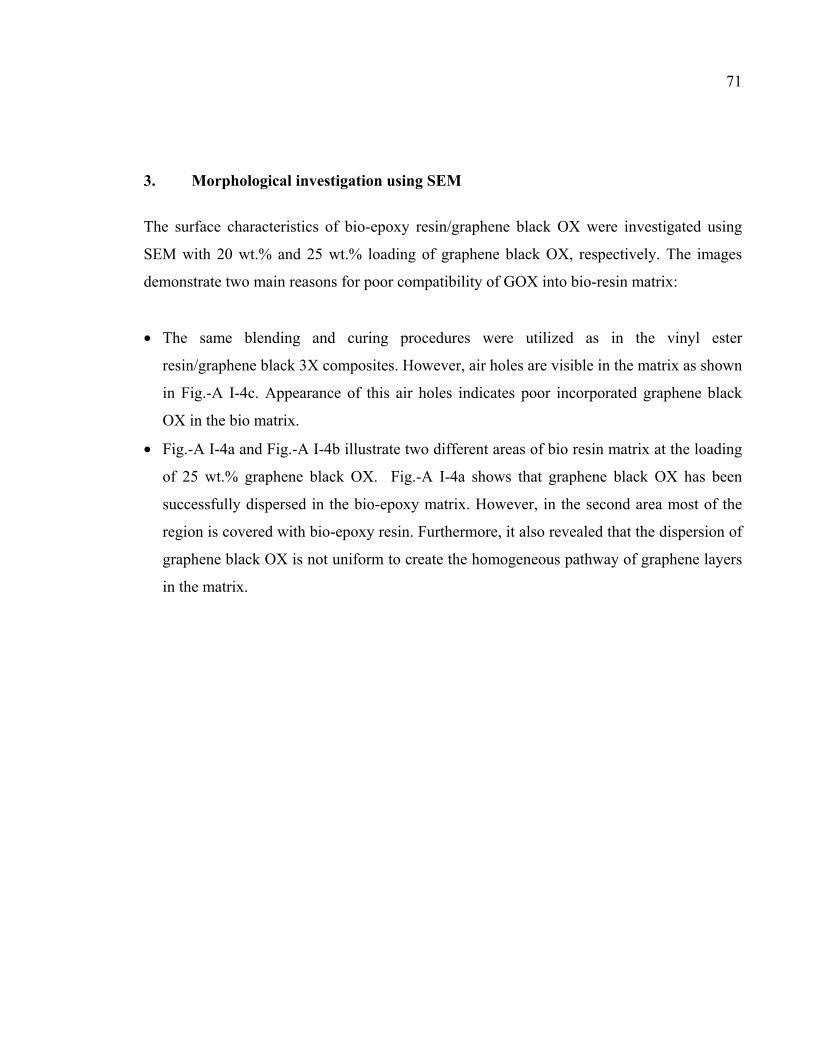
71
3. Morphological investigation using SEM
The surface characteristics of bio-epoxy resin/graphene black OX were investigated using
SEM with 20 wt.% and 25 wt.% loading of graphene black OX, respectively. The images
demonstrate two main reasons for poor compatibility of GOX into bio-resin matrix:
• The same blending and curing procedures were utilized as in the vinyl ester
resin/graphene black 3X composites. However, air holes are visible in the matrix as shown
in Fig.-A I-4c. Appearance of this air holes indicates poor incorporated graphene black
OX in the bio matrix.
• Fig.-A I-4a and Fig.-A I-4b illustrate two different areas of bio resin matrix at the loading
of 25 wt.% graphene black OX. Fig.-A I-4a shows that graphene black OX has been
successfully dispersed in the bio-epoxy matrix. However, in the second area most of the
region is covered with bio-epoxy resin. Furthermore, it also revealed that the dispersion of
graphene black OX is not uniform to create the homogeneous pathway of graphene layers
in the matrix.
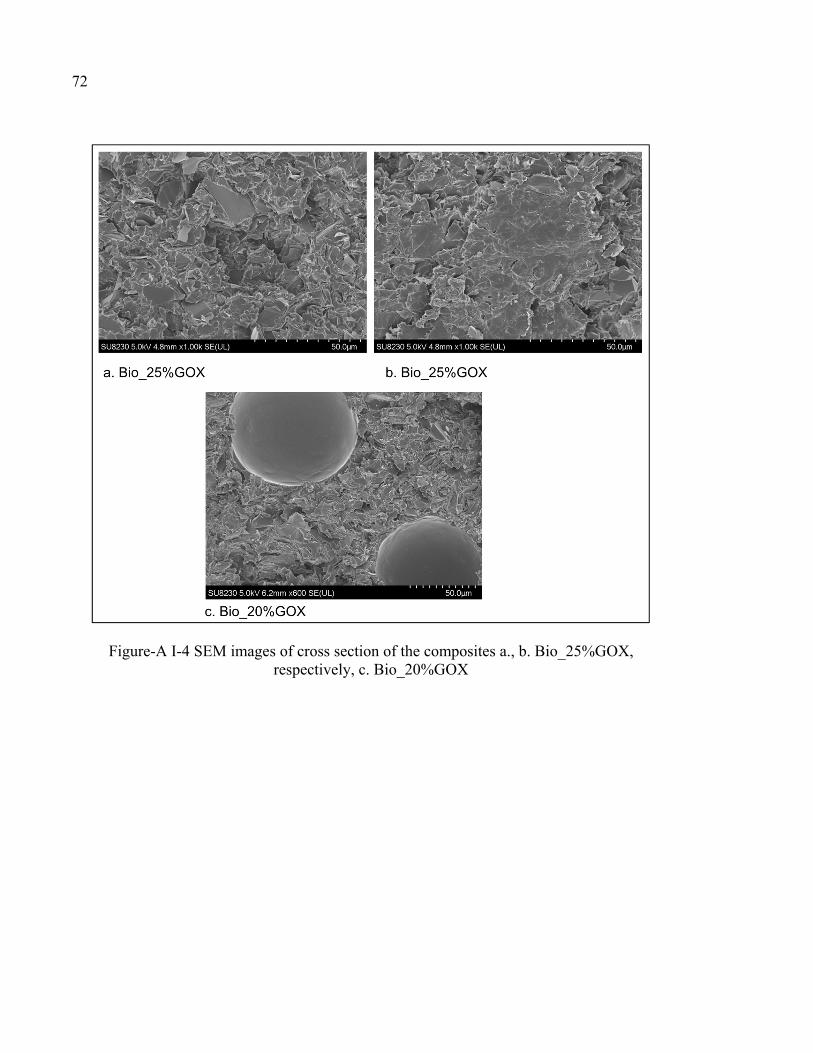
72
Figure-A I-4 SEM images of cross section of the composites a., b. Bio_25%GOX, respectively, c. Bio_20%GOX
BIBLIOGRAPHY
Abdin, Z., M. A. Alim, R. Saidur, M. R. Islam, W. Rashmi, S. Mekhilef et A. Wadi. 2013.
« Solar energy harvesting with the application of nanotechnology ». Renewable and Sustainable Energy Reviews, vol. 26, p. 837-852.
Aghili, Vahid Arablia and Alireza. 2016. Graphene oxide/vinyl ester resin nanocomposite:
the effect of graphene oxide, curing kinetics, modeling, mechanical properties and thermal stability.
Agnihotri, Nidhi, Ankan Dutta Chowdhury et Amitabha De. 2015.
« Non-enzymatic electrochemical detection of cholesterol using β-cyclodextrin functionalized graphene ». Biosensors and Bioelectronics, vol. 63, p. 212-217.
Aguilar-Bolados, Héctor, Miguel A. Lopez-Manchado, Justo Brasero, F. Avilés et Mehrdad
Yazdani-Pedram. 2016. « Effect of the morphology of thermally reduced graphite oxide on the mechanical and electrical properties of natural rubber nanocomposites ». Composites Part B: Engineering, vol. 87, p. 350-356.
Al-Saleh, Mohammed H., et Uttandaraman Sundararaj. 2011. « Review of the mechanical
properties of carbon nanofiber/polymer composites ». Composites Part A: Applied Science and Manufacturing, vol. 42, no 12, p. 2126-2142.
Almajid, A., L. Sorochynska, K. Friedrich et B. Wetzel. 2015. « Effects of graphene and
CNT on mechanical, thermal, electrical and corrosion properties of vinylester based nanocomposites ». Plastics, Rubber and Composites, vol. 44, no 2, p. 50-62.
Andreas Kandelbauer, Gianluca Tondi, Oscar C. Zaske, Sidney H. Goodman. 2013.
Unsaturated polyesters and vinyl esters. Handbook of thermoset plastics. Anupama Chaturvedi, Ashutosh Tiwari, Atul Tiwari. 2013. « Spectroscopic and
morphological analysis of graphene vinylester nanocomposites ». Archie, G. E. 1942. « The Electrical Resistivity Log as an Aid in Determining Some
Reservoir Characteristics ». Transactions of the AIME, vol. 146, no 01, p. 54-62. Atta, Ayman M., Shymaa M. El-Saeed et Reem K. Farag. 2006. « New vinyl ester resins
based on rosin for coating applications ». Reactive and Functional Polymers, vol. 66, no 12, p. 1596-1608.
Azeez, Asif Abdul, Kyong Yop Rhee, Soo Jin Park et David Hui. 2013. « Epoxy clay
nanocomposites – processing, properties and applications: A review ». Composites Part B: Engineering, vol. 45, no 1, p. 308-320.
74
Azizi, Sohrab, Eric David, Michel F. Fréchette, Phuong Nguyen-Tri et Claudiane M. Ouellet-
Plamondon. 2018. « Electrical and thermal conductivity of ethylene vinyl acetate composite with graphene and carbon black filler ». Polymer Testing, vol. 72, p. 24-31.
Beckman, Eric. 2018. « The world of plastics, in numbers ». Biron, M. 2018. Thermoplastics and thermoplastic composites. Bkakri, R., A. Sayari, E. Shalaan, S. Wageh, A. A. Al-Ghamdi et A. Bouazizi. 2014.
« Effects of the graphene doping level on the optical and electrical properties of ITO/P3HT:Graphene/Au organic solar cells ». Superlattices and Microstructures, vol. 76, p. 461-471.
Bolotin, K. I., K. J. Sikes, Z. Jiang, M. Klima, G. Fudenberg, J. Hone, P. Kim et H. L.
Stormer. 2008. « Ultrahigh electron mobility in suspended graphene ». Solid State Communications, vol. 146, no 9, p. 351-355.
Bora, C., et S. K. Dolui. 2012. « Fabrication of polypyrrole/graphene oxide nanocomposites
by liquid/liquid interfacial polymerization and evaluation of their optical, electrical and electrochemical properties ». Polymer, vol. 53, no 4, p. 923-932.
Broido, A. 1969. « A simple, sensitive graphical method of treating thermogravimetric
analysis data ». Journal of Polymer Science Part A-2: Polymer Physics, vol. 7, no 10, p. 1761-1773.
C Berthomieu, R Hienerwadel. 2009. « Fourier transform infrared (FTIR) spectroscopy ». Cantor, Kirk M., et Patrick Watts. 2011. « 1 - Plastics Materials ». In Applied Plastics
Engineering Handbook, sous la dir. de Kutz, Myer. p. 3-5. Oxford: William Andrew Publishing. < http://www.sciencedirect.com/science/article/pii/B9781437735147100017 >.
Castro Neto, A. H., F. Guinea, N. M. R. Peres, K. S. Novoselov et A. K. Geim. 2009.
« The electronic properties of graphene ». Reviews of Modern Physics, vol. 81, no 1, p. 109-162.
Changgu Lee, Xiaoding Wei, Jeffrey W. Kysar, James Hone. 2008. « Measurement of the
Elastic properties and intrinsic strength of monolayer graphene ». Science. Changwoon Jang, Thomas E. Lacy, Steven R. Gwaltney, Hossein Toghiani, and Charles U.
Pittman Jr. 2012. « Relative reactivity volume criterion for cross-linking: Application to vinyl ester resin molecular dynamics simulations ».

75
Chenlu Bao , Lei Song , Weiyi Xing ,Bihe Yuan ,Charles A. Wilkie , Jianliu Huang,Yuqiang Guoa and Yuan Hu. 2012. « Preparation of graphene by pressurized oxidation and multiplex reduction and its polymer nanocomposites by masterbatch-based melt blending ». Journal of Materials Chemistry.
CI. 1999. The role of monomeric and dimeric oligomers of methyl ethyl ketone peroxide in
the cure of unsaturated resin formulations. International Conference Proceedings: Composites Institute.
Compton, Owen C., et SonBinh T. Nguyen. 2010. « Graphene Oxide, Highly Reduced
Graphene Oxide, and Graphene: Versatile Building Blocks for Carbon-Based Materials ». Small, vol. 6, no 6, p. 711-723.
Costache, Marius C., David D. Jiang et Charles A. Wilkie. 2005. « Thermal degradation of
ethylene–vinyl acetate coplymer nanocomposites ». Polymer, vol. 46, no 18, p. 6947-6958.
Council, American Chemistry. 2005. How plastics are made. Plastics Industry Producer
Statistics Group. D Gay, SV Hoa. 2007. Composite materials: design and applications. D Hull, TW Clyne. 1996. An introduction to composite materials. Doyle, CD. 1961. « Kinetic analysis of thermogravimetric data ». Dreyer, Daniel R., Sungjin Park, Christopher W. Bielawski et Rodney S. Ruoff. 2010. « The
chemistry of graphene oxide ». Chemical Society Reviews, vol. 39, no 1, p. 228-240. Drobny, JG. 2014. « Handbook of thermoplastic elastomers ». Dubois, J. Harry. 1900-1975. J. Harry Dubois Collection on the History of Plastics. E Malic, A Knorr. 2013. Graphene and Carbon nanotubes: ultrafast optics and relaxation
dynamics. Evanoff Jr., David D., et George Chumanov. 2005. « Synthesis and Optical Properties of
Silver Nanoparticles and Arrays ». ChemPhysChem, vol. 6, no 7, p. 1221-1231. F Kremer, A Schönhals. 2012. Broadband dielectric spectroscopy. F.M.Smits. 1957. « Measurement of sheet resistivity with the Four-Point Probe ».
76
Faccio, Ricardo, Pablo A. Denis, Helena Pardo, Cecilia Goyenola et Álvaro W. Mombrú. 2009. « Mechanical properties of graphene nanoribbons ». Journal of Physics: Condensed Matter, vol. 21, no 28, p. 285304.
Fang, Ming, Kaigang Wang, Hongbin Lu, Yuliang Yang et Steven Nutt. 2009. « Covalent
polymer functionalization of graphene nanosheets and mechanical properties of composites ». Journal of Materials Chemistry, vol. 19, no 38, p. 7098-7105.
Frank, I. W., D. M. Tanenbaum, A. M. van der Zande et P. L. McEuen. 2007. « Mechanical
properties of suspended graphene sheets ». Journal of Vacuum Science & Technology B: Microelectronics and Nanometer Structures Processing, Measurement, and Phenomena, vol. 25, no 6, p. 2558-2561.
Gadipelli, Srinivas, et Zheng Xiao Guo. 2015. « Graphene-based materials: Synthesis and gas
sorption, storage and separation ». Progress in Materials Science, vol. 69, p. 1-60. Garcı́a, Ricardo, et Rubén Pérez. 2002. « Dynamic atomic force microscopy methods ».
Surface Science Reports, vol. 47, no 6, p. 197-301. Gaur, Shipra Jaswal and Bharti. 2014. « New trends in vinyl ester resins ». Geim, A. K. 2009. « Graphene: Status and prospects ». Science. Georgakilas, Vasilios. 2014. Functionalization of graphne. Giessibl, Franz J. 2003. « Advances in atomic force microscopy ». Reviews of Modern
Physics, vol. 75, no 3, p. 949-983. Gómez-Navarro, Cristina, Marko Burghard et Klaus Kern. 2008. « Elastic Properties of
Chemically Derived Single Graphene Sheets ». Nano Letters, vol. 8, no 7, p. 2045-2049.
Goyal, Vivek, et Alexander A. Balandin. 2012. « Thermal properties of the hybrid graphene-
metal nano-micro-composites: Applications in thermal interface materials ». Applied Physics Letters, vol. 100, no 7, p. 073113.
Gregory, R.V., Kimbrell, W.C., Kuhn, H.H., 1991, Electrically Conductive Non-Metallic
Textile Coatings, J. of Coated Fabrics, 20, p.167-175. Guo, Zhanhu; Ng, Ho Wai; Yee, Gary L.; Hahn, H. Thomas. 2009. « Differential Scanning
Calorimetry Investigation on Vinyl Ester Resin Curing Process for Polymer Nanocomposite Fabrication ».
Hamidinejad, S. M., R. K. M. Chu, B. Zhao, C. B. Park et T. Filleter. 2018. « Enhanced
Thermal Conductivity of Graphene Nanoplatelet-Polymer Nanocomposites
77
Fabricated via Supercritical Fluid-Assisted in Situ Exfoliation ». ACS Appl Mater Interfaces, vol. 10, no 1, p. 1225-1236.
HCN. 2002. Health Council of the Netherlands Committee on Updating of Occupational
Exposure Limits/Methyl ethyl ketone peroxide. Hodgkin, J. 2001. « Thermosets: Epoxies and Polyesters ». Encyclopedia of materials:
Science and Technology. Holbl. 1995. Microtome. Hong, Seul Ki, Ki Yeong Kim, Taek Yong Kim, Jong Hoon Kim, Seong Wook Park, Joung
Ho Kim et Byung Jin Cho. 2012. « Electromagnetic interference shielding effectiveness of monolayer graphene ». Nanotechnology, vol. 23, no 45, p. 455704.
Hontoria-Lucas, C., A. J. López-Peinado, J. de D. López-González, M. L. Rojas-Cervantes et
R. M. Martín-Aranda. 1995. « Study of oxygen-containing groups in a series of graphite oxides: Physical and chemical characterization ». Carbon, vol. 33, no 11, p. 1585-1592.
J-P. Pascault, H. Sauterea, J. Verdu. 2002. « Thermosetting Polymers ». JD Menczel, RB Prime. 2009. Thermogravimetric Analysis of polymers. JMG Cowie, V Arrighi. 2007. Polymers: chemistry and physics of modern materials. Joseph I. Goldstein, Dale E. Newbury, Joseph R. Michael, Nicholas W.M. Ritchie, John
Henry J. Scott, David C. Joy. 2017. Scanning electron microscopy and X-ray microanalysis.
Kim, Hyunwoo, Ahmed A. Abdala et Christopher W. Macosko. 2010. « Graphene/Polymer
Nanocomposites ». Macromolecules, vol. 43, no 16, p. 6515-6530. Kim, Hyunwoo, Yutaka Miura et Christopher W. Macosko. 2010. « Graphene/Polyurethane
Nanocomposites for Improved Gas Barrier and Electrical Conductivity ». Chemistry of Materials, vol. 22, no 11, p. 3441-3450.
Kim, Ju-Young, Kyung-Woo Lee, Jung-Suk Lee et Dongil Kwon. 2006. « Determination of
tensile properties by instrumented indentation technique: Representative stress and strain approach ». Surface and Coatings Technology, vol. 201, no 7, p. 4278-4283.
Kowalski, A. J., M. Cooke et S. Hall. 2011. « Expression for turbulent power draw of an in-
line Silverson high shear mixer ». Chemical Engineering Science, vol. 66, no 3, p. 241-249.
78
Kremer, F. 2002. « Dielectric spectroscopy – yesterday, today and tomorrow ». Journal of Non-Crystalline Solids, vol. 305, no 1, p. 1-9.
Kudin K, Scuseria G, Yakobson B. 2001. « Oxygen-driven unzipping graphite materials ».
Phys Rev B. Kuilla, Tapas, Sambhu Bhadra, Dahu Yao, Nam Hoon Kim, Saswata Bose et Joong Hee Lee.
2010. « Recent advances in graphene based polymer composites ». Progress in Polymer Science, vol. 35, no 11, p. 1350-1375.
Kuldeep Singh, Anil Ohlan and S.K. Dhwan. 2012. « Polymer-Graphene Nanocomposites:
Preparation, Characterization, Properties, and Applications ». Kumar, Pradip, Uday Narayan Maiti, Kyung Eun Lee et Sang Ouk Kim. 2014. « Rheological
properties of graphene oxide liquid crystal ». Carbon, vol. 80, p. 453-461. Kutz, M. 2011. « Applied plastics engineering handbook: processing and materials ». In. Layek, Rama K., Sanjoy Samanta, Dhruba P. Chatterjee et Arun K. Nandi. 2010. « Physical
and mechanical properties of poly(methyl methacrylate) -functionalized graphene/poly(vinylidine fluoride) nanocomposites: Piezoelectric β polymorph formation ». Polymer, vol. 51, no 24, p. 5846-5856.
Lee, Jae-Ung, Duhee Yoon, Hakseong Kim, Sang Wook Lee et Hyeonsik Cheong. 2011.
« Thermal conductivity of suspended pristine graphene measured by Raman spectroscopy ». Physical Review B, vol. 83, no 8, p. 081419.
Lee, Seul-Yi;Park, Soo-Jin. 2012. « Comprehensive review on synthesis and adsorption
behaviors of graphene-based materials ». Lian, Yan, Fengjiao He, Huan Wang et Feifei Tong. 2015. « A new aptamer/graphene
interdigitated gold electrode piezoelectric sensor for rapid and specific detection of Staphylococcus aureus ». Biosensors and Bioelectronics, vol. 65, p. 314-319.
Liang, Jiajie, Yi Huang, Long Zhang, Yan Wang, Yanfeng Ma, Tianyin Guo et Yongsheng
Chen. 2009. « Molecular-Level Dispersion of Graphene into Poly(vinyl alcohol) and Effective Reinforcement of their Nanocomposites ». Advanced Functional Materials, vol. 19, no 14, p. 2297-2302.
Liao, Shu-Hang, Min-Chien Hsiao, Chuan-Yu Yen, Chen-Chi M. Ma, Shuo-Jen Lee, Ay Su,
Ming-Chi Tsai, Ming-Yu Yen et Po-Lan Liu. 2010. « Novel functionalized carbon nanotubes as cross-links reinforced vinyl ester/nanocomposite bipolar plates for polymer electrolyte membrane fuel cells ». Journal of Power Sources, vol. 195, no 23, p. 7808-7817.
79
Liu, D., X. Chen, Y. Hu, T. Sun, Z. Song, Y. Zheng, Y. Cao, Z. Cai, M. Cao, L. Peng, Y. Huang, L. Du, W. Yang, G. Chen, D. Wei, A. T. S. Wee et D. Wei. 2018. « Raman enhancement on ultra-clean graphene quantum dots produced by quasi-equilibrium plasma-enhanced chemical vapor deposition ». Nat Commun, vol. 9, no 1, p. 193.
Liu, Qinghong, Xufeng Zhou, Xinyu Fan, Chunyang Zhu, Xiayin Yao et Zhaoping Liu.
2012. « Mechanical and Thermal Properties of Epoxy Resin Nanocomposites Reinforced with Graphene Oxide ». Polymer-Plastics Technology and Engineering, vol. 51, no 3, p. 251-256.
Loos, Marcio. 2015. Carbon nanotube reinforced composities. Lubchenco, Jane. 1998. « Entering the Century of the Environment: A New Social Contract
for Science ». Science, vol. 279, no 5350, p. 491. M.J. Mullins, D. Liu, H.-J.Sue. 2012. « Mechanical properties of thermosets ». Maddah, Hisham A. 2016. « Polypropylene as a Promising Plastic: A Review ». McMaster, H.A., Libbey-Owens-For Glass Company, 1947, Conductive Coating for Glass
and Method of Application, US Patent 2429420. Meyer, Gerhard, et Nabil M. Amer. 1988. « Novel optical approach to atomic force
microscopy ». Applied Physics Letters, vol. 53, no 12, p. 1045-1047. Moghimian, Nima, Sajjad Saeidlou, Helen Lentzakis, Gian Flippo Rosi, Naiheng Song et
Eric David. 2017. « Electrical conductivity of commercial graphene polyethylene nanocomposites ».
Mohan, Velram Balaji, Reuben Brown, Krishnan Jayaraman et Debes Bhattacharyya. 2015.
« Characterisation of reduced graphene oxide: Effects of reduction variables on electrical conductivity ». Materials Science and Engineering: B, vol. 193, p. 49-60.
Mohan, Velram Balaji, Krishnan Jayaraman, Manfred Stamm et Debes Bhattacharyya. 2016.
« Physical and chemical mechanisms affecting electrical conductivity in reduced graphene oxide films ». Thin Solid Films, vol. 616, p. 172-182.
Mohan, Velram Balaji, Kin-tak Lau, David Hui et Debes Bhattacharyya. 2018. « Graphene-
based materials and their composites: A review on production, applications and product limitations ». Composites Part B: Engineering, vol. 142, p. 200-220.
Morris JE, Iniewski K. 2013. « Graphene, carbon nanotubes, and nanostructures: techniques
and applicaitons ». Novoselov, A. K. Geim and K. S. 2007. « The rise of graphene ». Natural materials.
80
NTP. 1993. National Toxicology Program/Methyl ethyl ketone peroxide in dimethyl
phthalate.: US. OBRC. 2013. « The proportion of global use of plastics ». Ouellette, Robert J., et J. David Rawn. 2015. « 28 - Synthetic Polymers ». In Organic
Chemistry Study Guide, sous la dir. de Ouellette, Robert J., et J. David Rawn. p. 587-601. Boston: Elsevier. < http://www.sciencedirect.com/science/article/pii/B9780128018897000285 >.
P.E, Philip A. Schweitzer. 2006. Corrosion of Polymers and Elastomers. Park, Sungjin, et Rodney S. Ruoff. 2009. « Chemical methods for the production of
graphenes ». Nature Nanotechnology, vol. 4, p. 217. Pauer, S Taillemite and R. 2009. « Bringt future for vinyl ester resins in corrosion
applications ». Reinf. Plast. Pei, S., Q. Wei, K. Huang, H. M. Cheng et W. Ren. 2018. « Green synthesis of graphene
oxide by seconds timescale water electrolytic oxidation ». Nat Commun, vol. 9, no 1, p. 145.
Pei, Songfeng, et Hui-Ming Cheng. 2012. « The reduction of graphene oxide ». Carbon, vol.
50, no 9, p. 3210-3228. Peng, Y., W. Pan, N. Wang, J. E. Lu et S. Chen. 2018. « Ruthenium Ion-Complexed
Graphitic Carbon Nitride Nanosheets Supported on Reduced Graphene Oxide as High-Performance Catalysts for Electrochemical Hydrogen Evolution ». ChemSusChem, vol. 11, no 1, p. 130-136.
Perreault, François, Andreia Fonseca de Faria et Menachem Elimelech. 2015.
« Environmental applications of graphene-based nanomaterials ». Chemical Society Reviews, vol. 44, no 16, p. 5861-5896.
Petzelt, Jan, Dmitry Nuzhnyy, Viktor Bovtun, Maxim Savinov, Martin Kempa et Ivan
Rychetsky. 2013. « Broadband dielectric and conductivity spectroscopy of inhomogeneous and composite conductors ». physica status solidi (a), vol. 210, no 11, p. 2259-2271.
Pissis, P. 2007. Thermoset nanocomposites for engineering applications. Potts, Jeffrey R., Daniel R. Dreyer, Christopher W. Bielawski et Rodney S. Ruoff. 2011.
« Graphene-based polymer nanocomposites ». Polymer, vol. 52, no 1, p. 5-25.
81
Prasher, Ravi. 2010. « Graphene Spreads the Heat ». Science, vol. 328, no 5975, p. 185. Puckett, Juska and. 1997. « Matrix Resins and Fiber/Matrix Adhesion ». Composites
Engineering Handbook, vol. 1st ed. Qin, F., et C. Brosseau. 2012. « A review and analysis of microwave absorption in polymer
composites filled with carbonaceous particles ». Journal of Applied Physics, vol. 111, no 6, p. 061301.
Reimer. 2013. Scanning electron microscopy: physics of image formation and microanalysis. Rhoades, Lawrence J. 2008. « The Transformation of Manufacturing in the 21st Century ». Robertson. 2005. Food packaging: principles and practice. Sabet, Maziyar, Hassan Soleimani et Seyednooroldin Hosseini. 2018. « Effect of addition
graphene to ethylene vinyl acetate and low-density polyethylene ». Journal of Vinyl and Additive Technology, vol. 24, no S1, p. E177-E185.
Saleem, Haleema, Anjali Edathil, Thamsanqa Ncube, Jeewan Pokhrel, Sara Khoori, Akhil
Abraham et Vikas Mittal. 2016. « Mechanical and Thermal Properties of Thermoset–Graphene Nanocomposites ». Macromolecular Materials and Engineering, vol. 301, no 3, p. 231-259.
Sanchez, Vanesa C., Ashish Jachak, Robert H. Hurt et Agnes B. Kane. 2012. « Biological
Interactions of Graphene-Family Nanomaterials: An Interdisciplinary Review ». Chemical Research in Toxicology, vol. 25, no 1, p. 15-34.
Sanjinés, R., M. D. Abad, Cr Vâju, R. Smajda, M. Mionić et A. Magrez. 2011. « Electrical
properties and applications of carbon based nanocomposite materials: An overview ». Surface and Coatings Technology, vol. 206, no 4, p. 727-733.
Schuetze, Andrew P., Wayne Lewis, Chris Brown et Wilhelmus J. Geerts. 2004. « A
laboratory on the four-point probe technique ». American Journal of Physics, vol. 72, no 2, p. 149-153.
Shahil, Khan M. F., et Alexander A. Balandin. 2012. « Thermal properties of graphene and
multilayer graphene: Applications in thermal interface materials ». Solid State Communications, vol. 152, no 15, p. 1331-1340.
Si, Yongchao, et Edward T. Samulski. 2008. « Synthesis of Water Soluble Graphene ». Nano
Letters, vol. 8, no 6, p. 1679-1682.

82
Singh, Virendra, Daeha Joung, Lei Zhai, Soumen Das, Saiful I. Khondaker et Sudipta Seal. 2011. « Graphene based materials: Past, present and future ». Progress in Materials Science, vol. 56, no 8, p. 1178-1271.
Smith, BC. 2011. Fundamentals of Fourier transform infrared spectroscopy. Smits, F. M. 1958. « Measurement of Sheet Resistivities with the Four-Point Probe ». Bell
System Technical Journal, vol. 37, no 3, p. 711-718. Song, Pingan, Zhenhu Cao, Yuanzheng Cai, Liping Zhao, Zhengping Fang et Shenyuan Fu.
2011. « Fabrication of exfoliated graphene-based polypropylene nanocomposites with enhanced mechanical and thermal properties ». Polymer, vol. 52, no 18, p. 4001-4010.
Sreeprasad, T. S., et Vikas Berry. 2013. « How Do the Electrical Properties of Graphene
Change with its Functionalization? ». Small, vol. 9, no 3, p. 341-350. Stankovich, Sasha, Dmitriy A. Dikin, Geoffrey H. B. Dommett, Kevin M. Kohlhaas, Eric J.
Zimney, Eric A. Stach, Richard D. Piner, SonBinh T. Nguyen et Rodney S. Ruoff. 2006. « Graphene-based composite materials ». Nature, vol. 442, p. 282.
Stannarius, R., F. Kremer et M. Arndt. 1995. « Dynamic Exchange Effects in Broadband
Dielectric Spectroscopy ». Physical Review Letters, vol. 75, no 25, p. 4698-4701. Starr, Ken L. Fordyke and Trevor F. 2002. Thermoset resin. Su, Qi, Shuping Pang, Vajiheh Alijani, Chen Li, Xinliang Feng et Klaus Müllen. 2009.
« Composites of Graphene with Large Aromatic Molecules ». Advanced Materials, vol. 21, no 31, p. 3191-3195.
Subbiah Alwarappan, Ashok Kumar. 2013. Graphene-Based Materials. Science and
Technology. Suk, Ji Won, Richard D. Piner, Jinho An et Rodney S. Ruoff. 2010. « Mechanical Properties
of Monolayer Graphene Oxide ». ACS Nano, vol. 4, no 11, p. 6557-6564. Sun, Wei, Renzong Hu, Hui Liu, Meiqin Zeng, Lichun Yang, Haihui Wang et Min Zhu.
2014. « Embedding nano-silicon in graphene nanosheets by plasma assisted milling for high capacity anode materials in lithium ion batteries ». Journal of Power Sources, vol. 268, p. 610-618.
Taipalus, R., T. Harmia, M. Q. Zhang et K. Friedrich. 2001. « The electrical conductivity of
carbon-fibre-reinforced polypropylene/polyaniline complex-blends: experimental characterisation and modelling ». Composites Science and Technology, vol. 61, no 6, p. 801-814.
83
Tang, Haixiong, Gregory J. Ehlert, Yirong Lin et Henry A. Sodano. 2012a. « Highly Efficient Synthesis of Graphene Nanocomposites ». Nano Letters, vol. 12, no 1, p. 84-90.
Tang, Zhenghai, Hailan Kang, Zuoli Shen, Baochun Guo, Liqun Zhang et Demin Jia. 2012b.
« Grafting of Polyester onto Graphene for Electrically and Thermally Conductive Composites ». Macromolecules, vol. 45, no 8, p. 3444-3451.
Teng, Chih-Chun, Chen-Chi M. Ma, Chu-Hua Lu, Shin-Yi Yang, Shie-Heng Lee, Min-Chien
Hsiao, Ming-Yu Yen, Kuo-Chan Chiou et Tzong-Ming Lee. 2011. « Thermal conductivity and structure of non-covalent functionalized graphene/epoxy composites ». Carbon, vol. 49, no 15, p. 5107-5116.
Thostenson, Erik T., et Tsu-Wei Chou. 2006. « Processing-structure-multi-functional
property relationship in carbon nanotube/epoxy composites ». Carbon, vol. 44, no 14, p. 3022-3029.
Thostenson, Erik T., Saeed Ziaee et Tsu-Wei Chou. 2009. « Processing and electrical
properties of carbon nanotube/vinyl ester nanocomposites ». Composites Science and Technology, vol. 69, no 6, p. 801-804.
Utomo, Adi T., Michael Baker et Andrzej W. Pacek. 2008. « Flow pattern, periodicity and
energy dissipation in a batch rotor–stator mixer ». Chemical Engineering Research and Design, vol. 86, no 12, p. 1397-1409.
Van Lier, Gregory, Christian Van Alsenoy, Vic Van Doren et Paul Geerlings. 2000.
« Ab initio study of the elastic properties of single-walled carbon nanotubes and graphene ». Chemical Physics Letters, vol. 326, no 1, p. 181-185.
van Rooyen, Louis Johann, Jozsef Karger-Kocsis et Lesotlho David Kock. 2015.
« Improving the helium gas barrier properties of epoxy coatings through the incorporation of graphene nanoplatelets and the influence of preparation techniques ». Journal of Applied Polymer Science, vol. 132, no 39.
Wang, Guoxiu, Juan Yang, Jinsoo Park, Xinglong Gou, Bei Wang, Hao Liu et Jane Yao.
2008. « Facile Synthesis and Characterization of Graphene Nanosheets ». The Journal of Physical Chemistry C, vol. 112, no 22, p. 8192-8195.
Wang, Jingchao, Xianbao Wang, Chunhui Xu, Min Zhang et Xiaopeng Shang. 2011.
« Preparation of graphene/poly(vinyl alcohol) nanocomposites with enhanced mechanical properties and water resistance ». Polymer International, vol. 60, no 5, p. 816-822.
Wang, Shu Jun, Yan Geng, Qingbin Zheng et Jang-Kyo Kim. 2010. « Fabrication of highly
conducting and transparent graphene films ». Carbon, vol. 48, no 6, p. 1815-1823.
84
Williams, Tim, 2017, Chapter 15 - Shielding, EMC for Product Designers (Fifth Edition), p.435-456.
Worsley, Marcus A., Peter J. Pauzauskie, Tammy Y. Olson, Juergen Biener, Joe H. Satcher
et Theodore F. Baumann. 2010. « Synthesis of Graphene Aerogel with High Electrical Conductivity ». Journal of the American Chemical Society, vol. 132, no 40, p. 14067-14069.
Wu, Chao, Xingyi Huang, Genlin Wang, Libing Lv, Gan Chen, Guangyv Li et Pingkai Jiang.
2013. « Highly Conductive Nanocomposites with Three-Dimensional, Compactly Interconnected Graphene Networks via a Self-Assembly Process ». Advanced Functional Materials, vol. 23, no 4, p. 506-513.
Wu, Hang, Weifeng Zhao et Guohua Chen. 2012. « One-pot in situ ball milling preparation
of polymer/graphene nanocomposites ». Journal of Applied Polymer Science, vol. 125, no 5, p. 3899-3903.
Xie, Q., M. A. Alibakhshi, S. Jiao, Z. Xu, M. Hempel, J. Kong, H. G. Park et C. Duan. 2018.
« Fast water transport in graphene nanofluidic channels ». Nat Nanotechnol. Yang, Wenrong, Kyle R. Ratinac, Simon P. Ringer, Pall Thordarson, J. Justin Gooding et
Filip Braet. 2010. « Carbon Nanomaterials in Biosensors: Should You Use Nanotubes or Graphene? ». Angewandte Chemie International Edition, vol. 49, no 12, p. 2114-2138.
Yu, J., X. Huang, C. Wu et P. Jiang. 2011. « Permittivity, thermal conductivity and thermal
stability of poly(vinylidene fluoride)/graphene nanocomposites ». IEEE Transactions on Dielectrics and Electrical Insulation, vol. 18, no 2, p. 478-484.
Z, Liu. 2015. Graphene: energy storage and conversion applications. Zhang, Hao-Bin, Wen-Ge Zheng, Qing Yan, Yong Yang, Ji-Wen Wang, Zhao-Hui Lu, Guo-
Ying Ji et Zhong-Zhen Yu. 2010. « Electrically conductive polyethylene terephthalate/graphene nanocomposites prepared by melt compounding ». Polymer, vol. 51, no 5, p. 1191-1196.
Zhang, Jinli, Shuangqing Xu et Wei Li. 2012. « High shear mixers: A review of typical
applications and studies on power draw, flow pattern, energy dissipation and transfer properties ». Chemical Engineering and Processing: Process Intensification, vol. 57-58, p. 25-41.
Zhang, Li Li, Xin Zhao, Meryl D. Stoller, Yanwu Zhu, Hengxing Ji, Shanthi Murali, Yaping
Wu, Stephen Perales, Brandon Clevenger et Rodney S. Ruoff. 2012. « Highly Conductive and Porous Activated Reduced Graphene Oxide Films for High-Power Supercapacitors ». Nano Letters, vol. 12, no 4, p. 1806-1812.
85
Zhang, Xi, Vahid Bitaraf, Suying Wei, Zhanhu Guo, Xi Zhang, Suying Wei et Henry A.
Colorado. 2014. « Vinyl ester resin: Rheological behaviors, curing kinetics, thermomechanical, and tensile properties ». AIChE Journal, vol. 60, no 1, p. 266-274.
Zhang, Z. L., M. Hauge, J. Ødegård et C. Thaulow. 1999. « Determining material true stress–
strain curve from tensile specimens with rectangular cross-section ». International Journal of Solids and Structures, vol. 36, no 23, p. 3497-3516.
Zhanhu Guo, Tony Pereira, Oyoung Choi, Ying Wang, H. Thomas Hahn. 2006. « Surface
functionalized alumina nanoparticle filled polymeric nanocomposites with enhanced mechanical properties ».
Zhao, B., C. Zhao, R. Li, S. M. Hamidinejad et C. B. Park. 2017a. « Flexible, Ultrathin, and
High-Efficiency Electromagnetic Shielding Properties of Poly(Vinylidene Fluoride)/Carbon Composite Films ». ACS Appl Mater Interfaces, vol. 9, no 24, p. 20873-20884.
Zhao, Biao, Chongxiang Zhao, Ruosong Li, S. Mahdi Hamidinejad et Chul B. Park. 2017b. «
Flexible, Ultrathin, and High-Efficiency Electromagnetic Shielding Properties of Poly(Vinylidene Fluoride)/Carbon Composite Films ». ACS Applied Materials & Interfaces, vol. 9, no 24, p. 20873-20884.
Zhu, Yanwu, Shanthi Murali, Weiwei Cai, Xuesong Li, Ji Won Suk, Jeffrey R. Potts et
Rodney S. Ruoff. 2010. « Graphene and Graphene Oxide: Synthesis, Properties, and Applications ». Advanced Materials, vol. 22, no 35, p. 3906-3924.