Embed Size (px)
Citation preview
1
Investigation of Ferritic Superalloysby Computational Design and Experimental
ValidationInvestigators: Mark D. Asta2, Gautam Ghosh3, David C. Dunand3, Morris E. Fine3,
Chain T. Liu4, and Peter K. Liaw1
Ph.D. Students: Hong Ding2, Sharon Huang1, Michael Rawings3, Gian Song1, Zhiqian Sun1, and Kevin Teng1
Research Associates: Gongyao Wang1, Nhon Q Vo3, and Christian Liebscher2
1. Department of Materials Science and Engineering, The University ofTennessee (UT), Knoxville, TN 37996, USA
2. Department of Materials Science and Engineering, University of California(UC), Berkeley, CA 94720, USA
3. Department of Materials Science and Engineering, Northwestern University(NU), Evanston, IL 60208‐3108, USA
4. Systems Engineering and Engineering Management and Mechanical andBiomedical Engineering, City University of Hong Kong, Hong Kong
2
AcknowledgementsWe are very grateful to:
(1) Richard Dunst
(2) Vito Cedro
(3) Patricia Rawls
(4) Robert Romanosky
(5) Susan Maley
(6) Conrad Regis
(7) Nicholas Anderson, for their kind support and
encouragement, and
(8) National Energy Technology Laboratory (NETL)
for sponsoring this project
3
Outline
Introduction – Why NiAl/Ni2TiAl‐strengthened ferritic steels
Objectives First‐Principles Calculations
Calculations of Interfacial Energies for Fe, B2, and L21 Phases
Coarsening Kinetics of NiAl Precipitates NiAl/Ni2TiAl‐Strengthened Ferritic Superalloys (Transmission
Electron Microscopy and Creep Behavior) In‐situ Neutron Creep Studies Dislocation‐Dynamics Simulations Papers and Presentations Future Work Conclusions
4
[1] http://en.wikipedia.org/wiki/Steam_turbine[2] http://www.handyharmancanada.com/TheBrazingBook/comparis.htm[3] http://en.wikipedia.org/wiki/List_of_thermal_conductivities[4] Z. Sun, C.H. Liebscher, S. Huang, Z. Teng, G. Song, G. Wang, M. Asta, M. Rawlings, M.E. Fine, and P.K. Liaw, Scripta Materialia 68 (2013) 384[5] http://www.ttiinc.com/page/ME_Materials
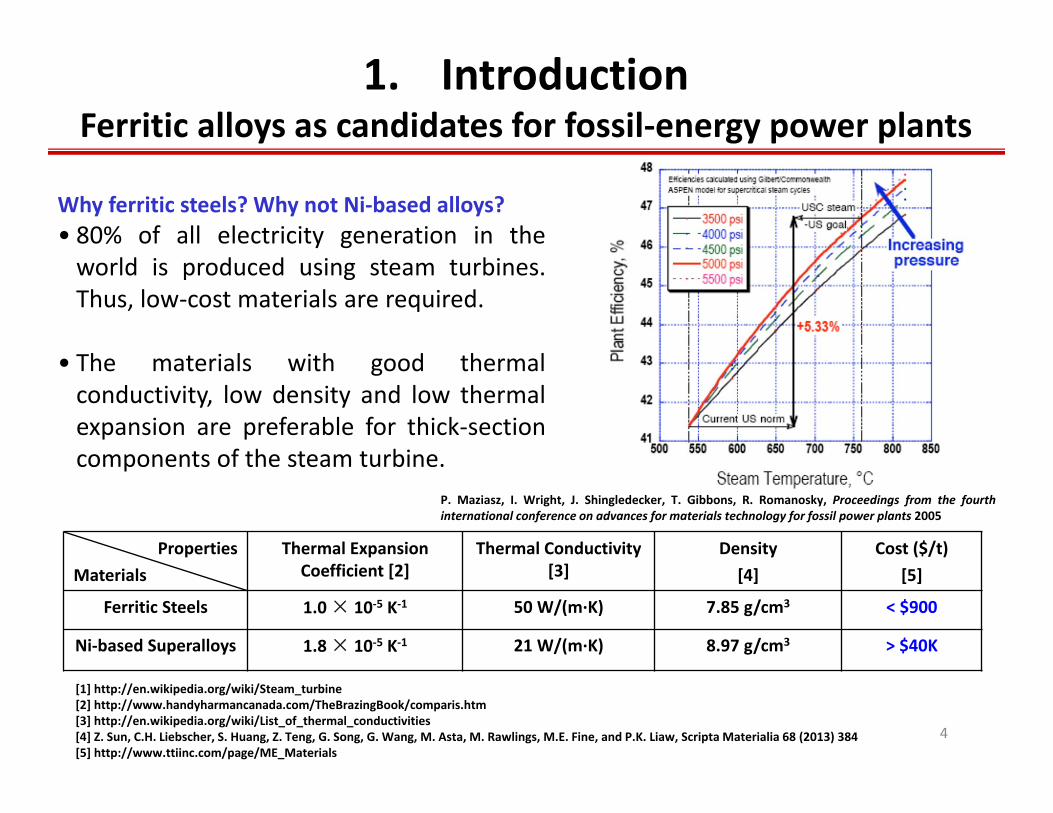
Why ferritic steels? Why not Ni‐based alloys?• 80% of all electricity generation in theworld is produced using steam turbines.Thus, low‐cost materials are required.
• The materials with good thermalconductivity, low density and low thermalexpansion are preferable for thick‐sectioncomponents of the steam turbine.
1. Introduction Ferritic alloys as candidates for fossil‐energy power plants
PropertiesMaterials
Thermal Expansion Coefficient [2]
Thermal Conductivity [3]
Density[4]
Cost ($/t) [5]
Ferritic Steels 1.0 × 10‐5 K‐1 50 W/(m∙K) 7.85 g/cm3 < $900
Ni‐based Superalloys 1.8 × 10‐5 K‐1 21 W/(m∙K) 8.97 g/cm3 > $40K
P. Maziasz, I. Wright, J. Shingledecker, T. Gibbons, R. Romanosky, Proceedings from the fourthinternational conference on advances for materials technology for fossil power plants 2005
S. Huang, D. Brown, B. Clausen, Z. Teng, Y. Gao. P. Liaw.(2011). Metallurgical and Materials Transactions A, 43, pp.1497‐1508
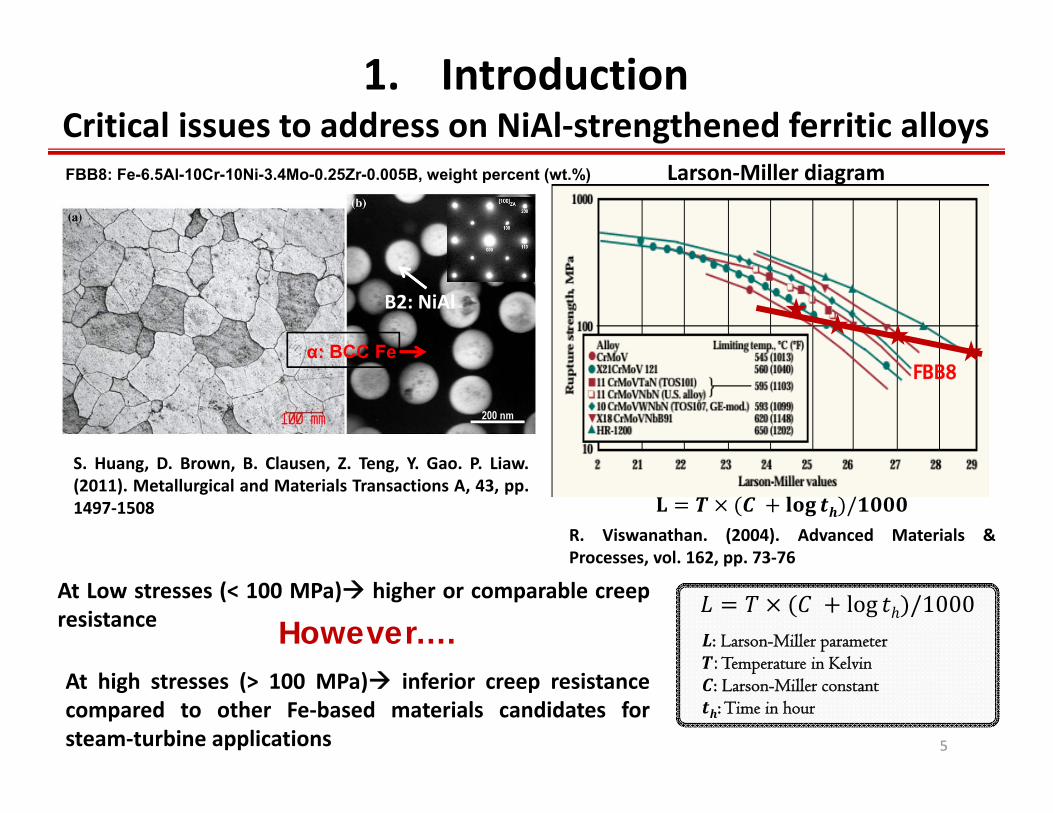
α: BCC Fe
At Low stresses (< 100 MPa) higher or comparable creepresistance
At high stresses (> 100 MPa) inferior creep resistancecompared to other Fe‐based materials candidates forsteam‐turbine applications
However….
1. Introduction Critical issues to address on NiAl‐strengthened ferritic alloys
Larson‐Miller diagramFBB8: Fe-6.5Al-10Cr-10Ni-3.4Mo-0.25Zr-0.005B, weight percent (wt.%)
FBB8
R. Viswanathan. (2004). Advanced Materials &Processes, vol. 162, pp. 73‐76
B2: NiAl
/
5
: Larson-Miller parameter:Temperature in Kelvin: Larson-Miller constant: Time in hour
log /1000
Ni
AlTi
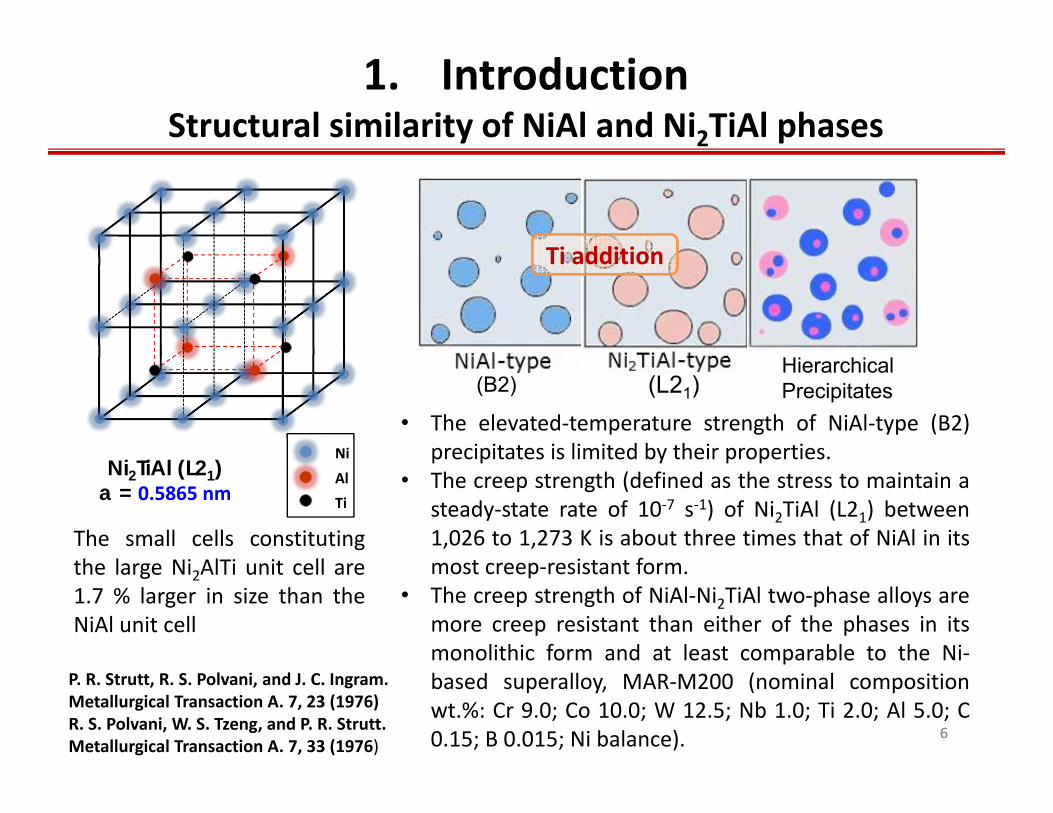
Ni2TiAl (L21)a = 0.5865 nm
6
The small cells constitutingthe large Ni2AlTi unit cell are1.7 % larger in size than theNiAl unit cell
1. Introduction Structural similarity of NiAl and Ni2TiAl phases
(B2) (L21)Hierarchical Precipitates
P. R. Strutt, R. S. Polvani, and J. C. Ingram. Metallurgical Transaction A. 7, 23 (1976)R. S. Polvani, W. S. Tzeng, and P. R. Strutt. Metallurgical Transaction A. 7, 33 (1976)
• The elevated‐temperature strength of NiAl‐type (B2)precipitates is limited by their properties.
• The creep strength (defined as the stress to maintain asteady‐state rate of 10‐7 s‐1) of Ni2TiAl (L21) between1,026 to 1,273 K is about three times that of NiAl in itsmost creep‐resistant form.
• The creep strength of NiAl‐Ni2TiAl two‐phase alloys aremore creep resistant than either of the phases in itsmonolithic form and at least comparable to the Ni‐based superalloy, MAR‐M200 (nominal compositionwt.%: Cr 9.0; Co 10.0; W 12.5; Nb 1.0; Ti 2.0; Al 5.0; C0.15; B 0.015; Ni balance). 6
Ti addition
7
• Objective 1: To develop and integrate moderncomputational tools and algorithms required to assist inthe optimization of creep properties of high‐temperaturealloys for fossil‐energy applications
• Objective 2: To achieve fundamental understanding ofthe processing‐microstructure‐property‐performance linksunderlying the creep behavior of novel ferritic superalloysstrengthened by B2 and/or L21 intermetallics.
2. Objectives
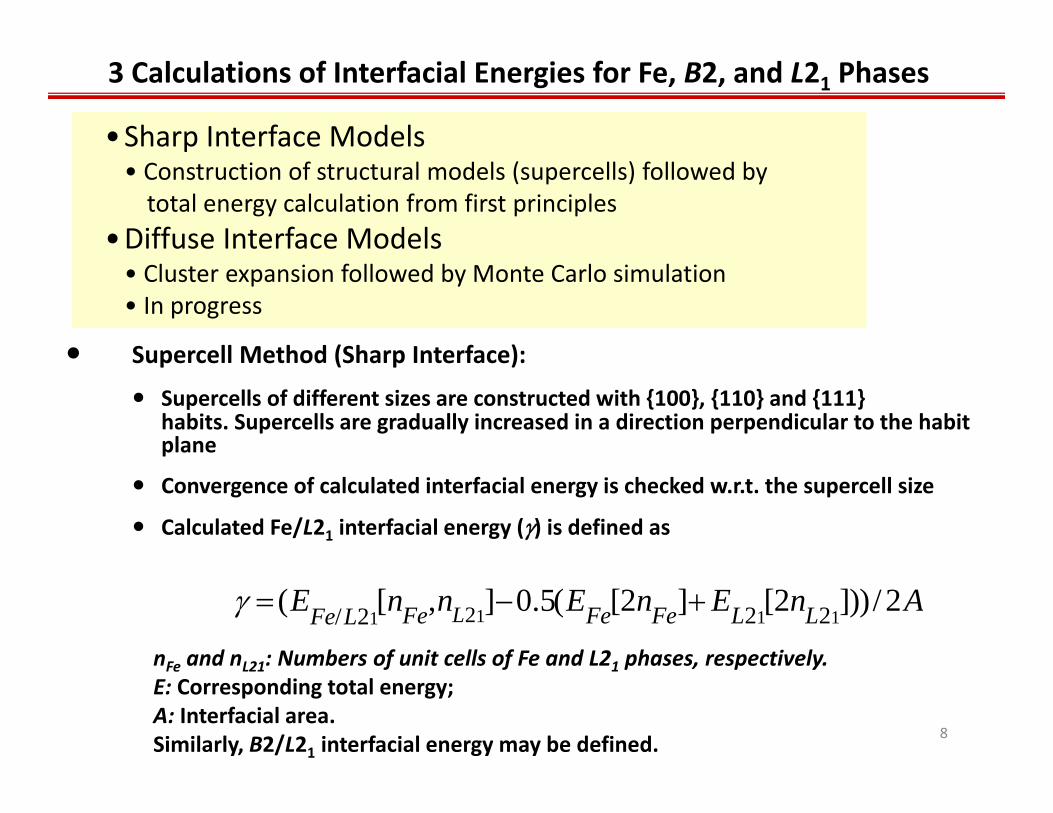
3 Calculations of Interfacial Energies for Fe, B2, and L21 Phases
8
•Sharp Interface Models• Construction of structural models (supercells) followed by total energy calculation from first principles
•Diffuse Interface Models• Cluster expansion followed by Monte Carlo simulation• In progress
• Supercell Method (Sharp Interface):
• Supercells of different sizes are constructed with {100}, {110} and {111} habits. Supercells are gradually increased in a direction perpendicular to the habit plane
• Convergence of calculated interfacial energy is checked w.r.t. the supercell size
• Calculated Fe/L21 interfacial energy () is defined as
(EFe/L21
[nFe,nL21]0.5(EFe[2nFe]EL21[2nL21
]))/ 2A
nFe and nL21: Numbers of unit cells of Fe and L21 phases, respectively.E: Corresponding total energy;A: Interfacial area.Similarly, B2/L21 interfacial energy may be defined.
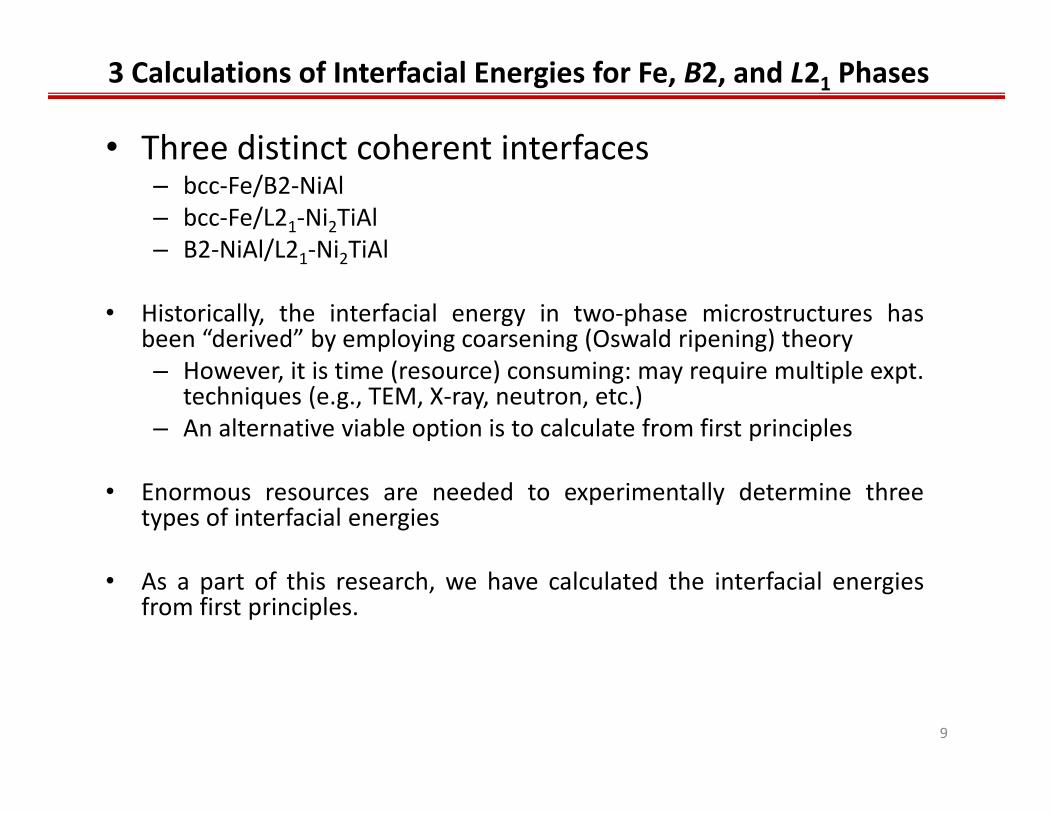
3 Calculations of Interfacial Energies for Fe, B2, and L21 Phases
9
• Three distinct coherent interfaces– bcc‐Fe/B2‐NiAl– bcc‐Fe/L21‐Ni2TiAl– B2‐NiAl/L21‐Ni2TiAl
• Historically, the interfacial energy in two‐phase microstructures hasbeen “derived” by employing coarsening (Oswald ripening) theory– However, it is time (resource) consuming: may require multiple expt.
techniques (e.g., TEM, X‐ray, neutron, etc.)– An alternative viable option is to calculate from first principles
• Enormous resources are needed to experimentally determine threetypes of interfacial energies
• As a part of this research, we have calculated the interfacial energiesfrom first principles.
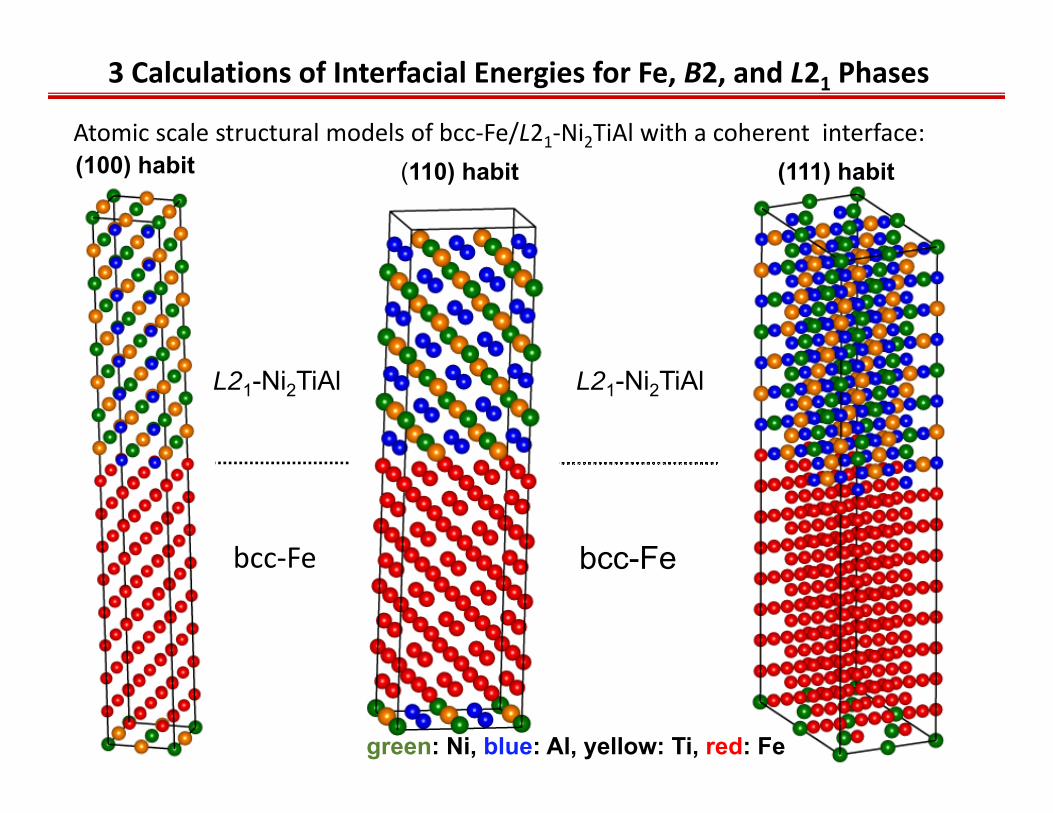
3 Calculations of Interfacial Energies for Fe, B2, and L21 Phases
10
Atomic scale structural models of bcc‐Fe/L21‐Ni2TiAl with a coherent interface:
L21-Ni2TiAl
(100) habit (110) habit
L21-Ni2TiAl
green: Ni, blue: Al, yellow: Ti, red: Fe
bcc-Fe
(111) habit
bcc‐Fe

3 Calculation of Interfacial Energies for Fe, B2, and L21 Phases
11
bcc-Fe/L21-Ni2TiAl
• In progress: Calculations involving larger supercells• Its obvious that for any habit, the coherent interfacial energy of
NiAl/Ni2TiAl << Fe/Ni2TiAl
B2-NiAl/L21-Ni2TiAl
{100}
{110}
{111}
{100}
{110}
{111}
4 Coarsening Kinetics of NiAl Precipitates in FBB8
12
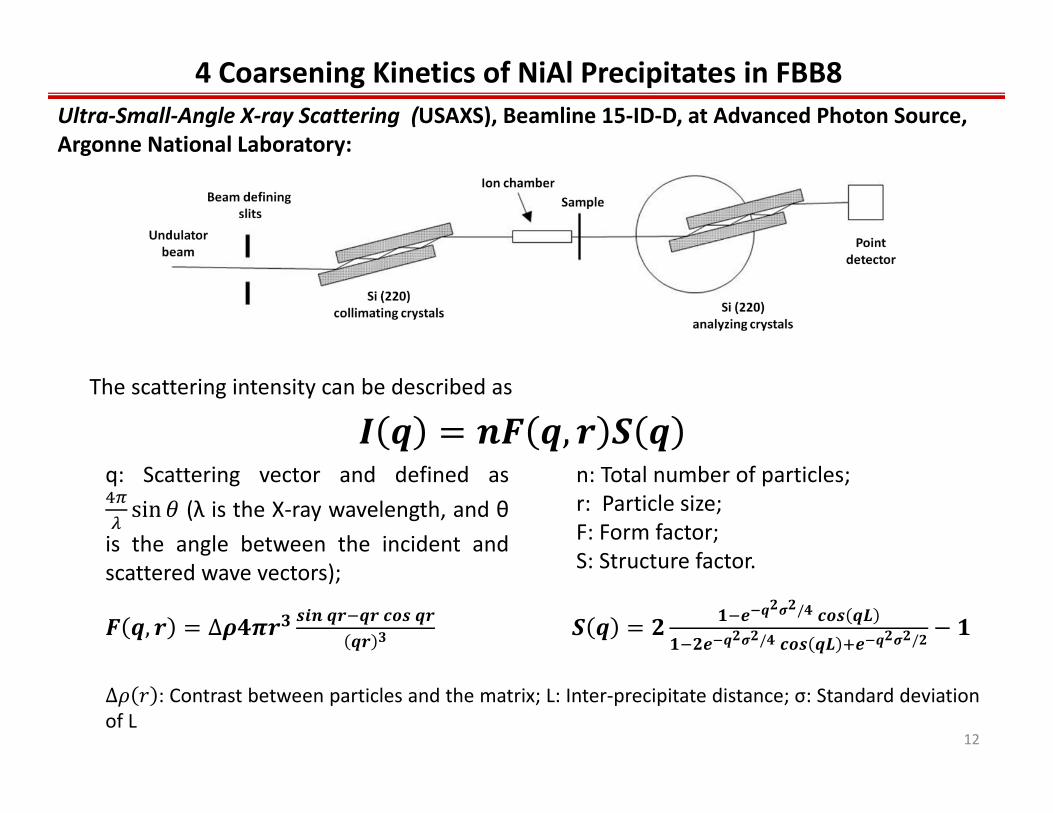
Ultra‐Small‐Angle X‐ray Scattering (USAXS), Beamline 15‐ID‐D, at Advanced Photon Source, Argonne National Laboratory:
The scattering intensity can be described as
q: Scattering vector and defined assin (λ is the X‐ray wavelength, and θ
is the angle between the incident andscattered wave vectors);
n: Total number of particles;r: Particle size;F: Form factor;S: Structure factor.
, ∆ /
/ /
∆ : Contrast between particles and the matrix; L: Inter‐precipitate distance; σ: Standard deviationof L
4 Coarsening Kinetics of NiAl Precipitates in FBB8
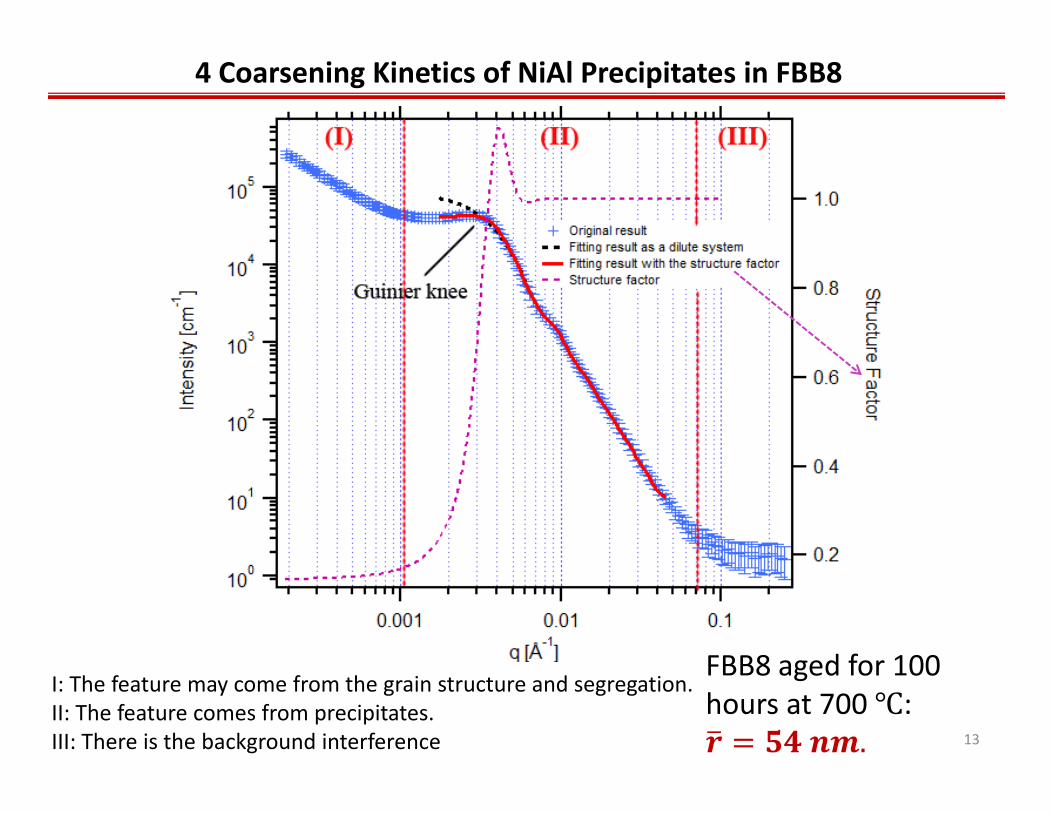
13
FBB8 aged for 100 hours at 700 :
.
I: The feature may come from the grain structure and segregation.II: The feature comes from precipitates.III: There is the background interference
4 Coarsening Kinetics of NiAl Precipitates in FBB8
14
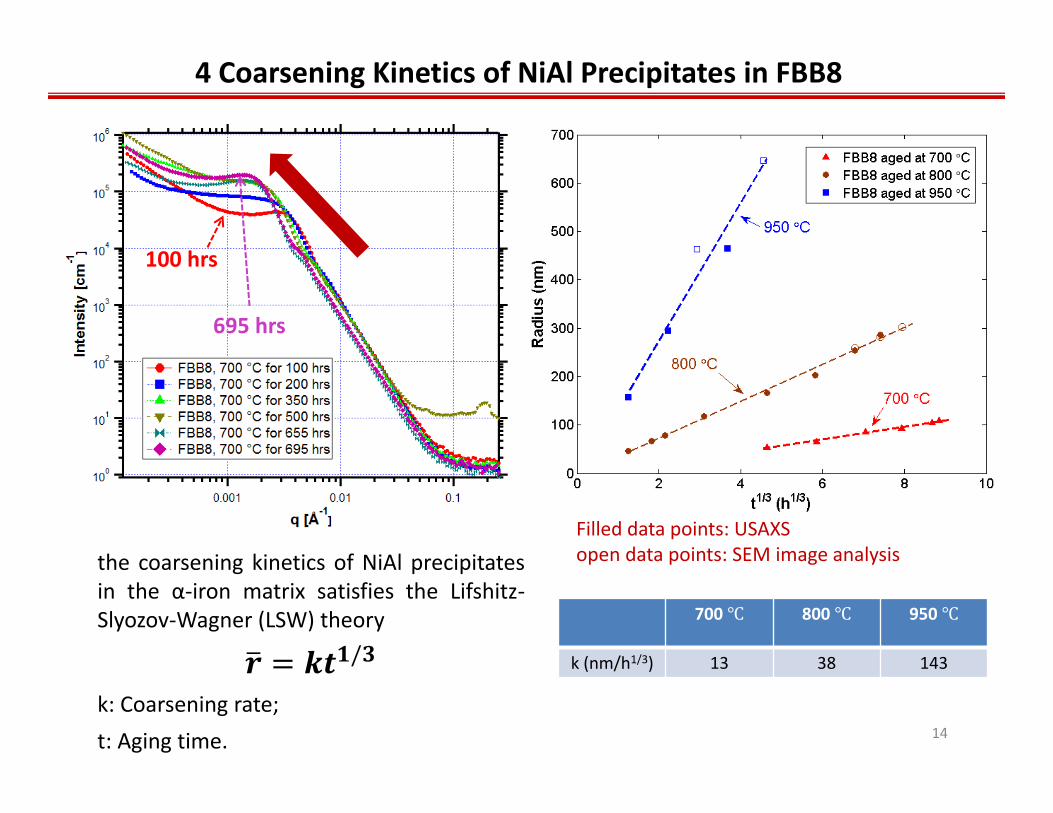
the coarsening kinetics of NiAl precipitatesin the α‐iron matrix satisfies the Lifshitz‐Slyozov‐Wagner (LSW) theory
/
k: Coarsening rate;t: Aging time.
700 800 950
k (nm/h1/3) 13 38 143
Filled data points: USAXSopen data points: SEM image analysis
100 hrs
695 hrs
4 Coarsening Kinetics of NiAl Precipitates in FBB8
15
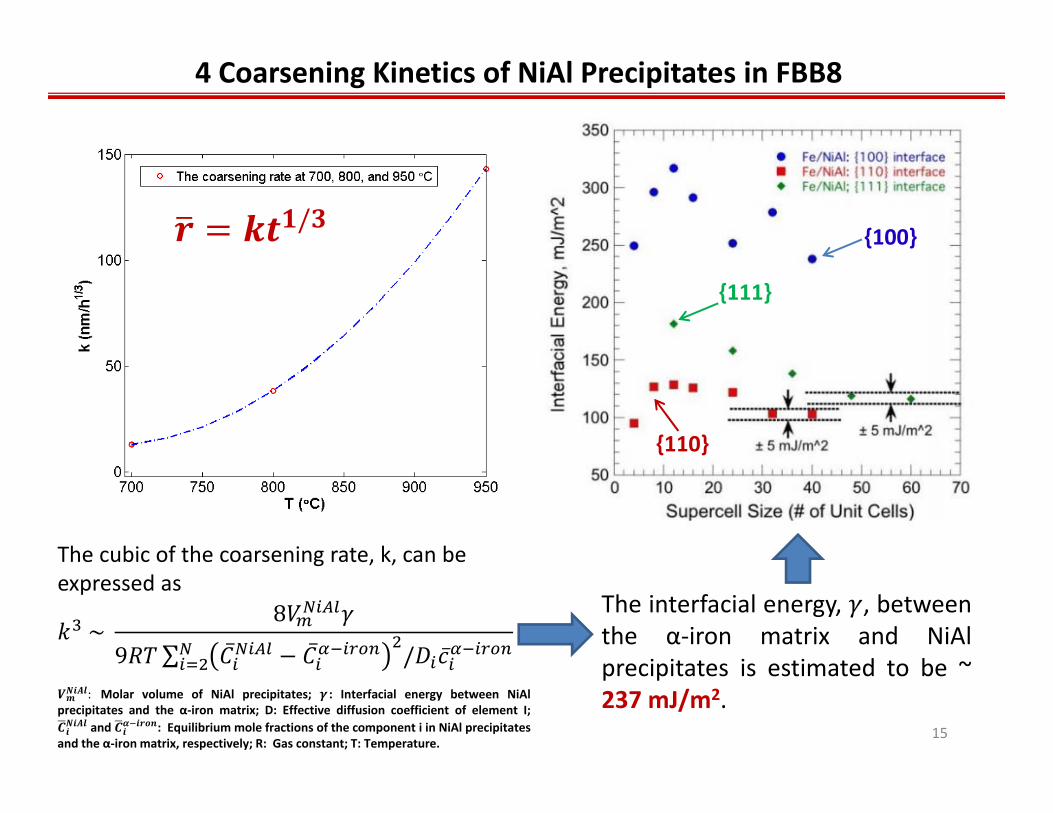
/
The cubic of the coarsening rate, k, can be expressed as
~8
9 ∑ ̅ ̅ / ̅
The interfacial energy, , betweenthe α‐iron matrix and NiAlprecipitates is estimated to be ~237 mJ/m2.: Molar volume of NiAl precipitates; : Interfacial energy between NiAl
precipitates and the α‐iron matrix; D: Effective diffusion coefficient of element I;and : Equilibrium mole fractions of the component i in NiAl precipitates
and the α‐iron matrix, respectively; R: Gas constant; T: Temperature.
{100}
{111}
{110}

NiAl/Ni2TiAl‐Strengthened Ferritic Superalloys
Fe‐2 ~ 6Ti‐6.5Al‐10Cr‐10Ni‐3.4Mo‐0.25Zr‐0.005B (wt. %)
16

o Confirmation of B2-NiAl formation within L21Ni2TiAl parent precipitate
Fe‐2Ti‐6.5Al‐10Cr‐10Ni‐3.4Mo‐0.25Zr‐0.005B (wt. %), heat‐treated sample
DF image using <020>
L21-Ni2TiAl parent precipitate
B2-NiAl zones
DF image using <222>
DF image using <111>
5.1 TEM Microstructural Characterization on Heat‐treated Samples
17
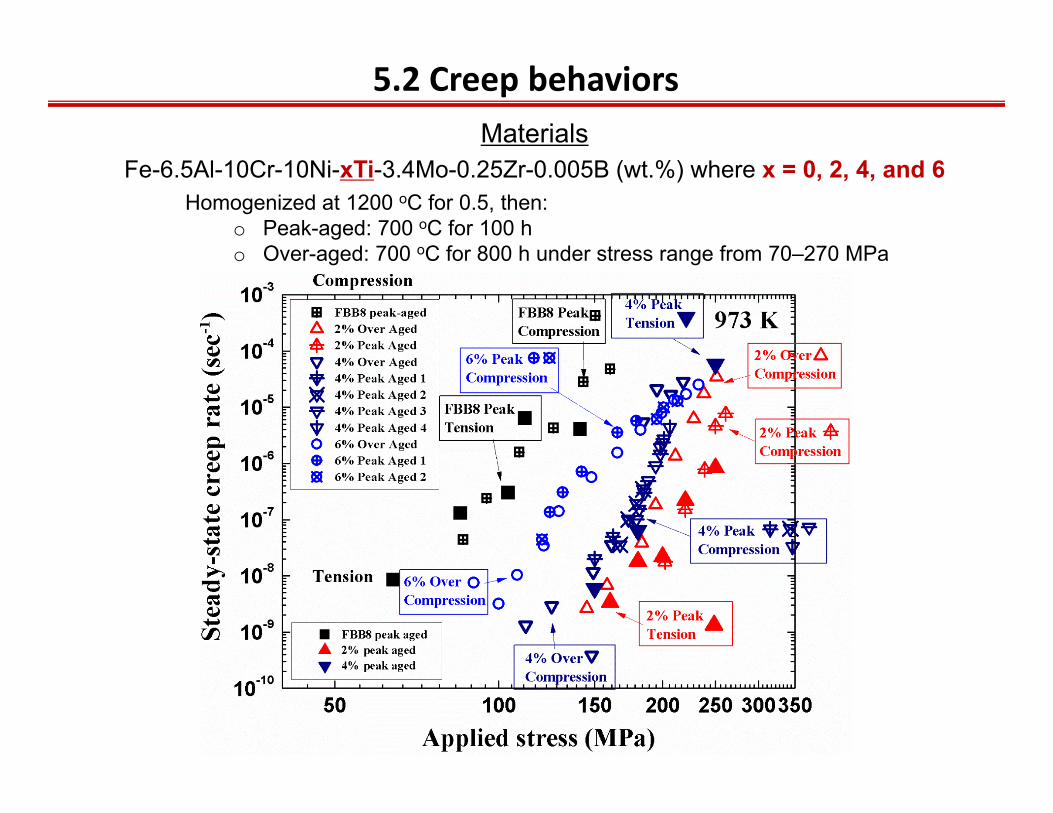
MaterialsFe-6.5Al-10Cr-10Ni-xTi-3.4Mo-0.25Zr-0.005B (wt.%) where x = 0, 2, 4, and 6
5.2 Creep behaviors
Homogenized at 1200 oC for 0.5, then:o Peak-aged: 700 oC for 100 ho Over-aged: 700 oC for 800 h under stress range from 70–270 MPa
5.2 Creep behaviors
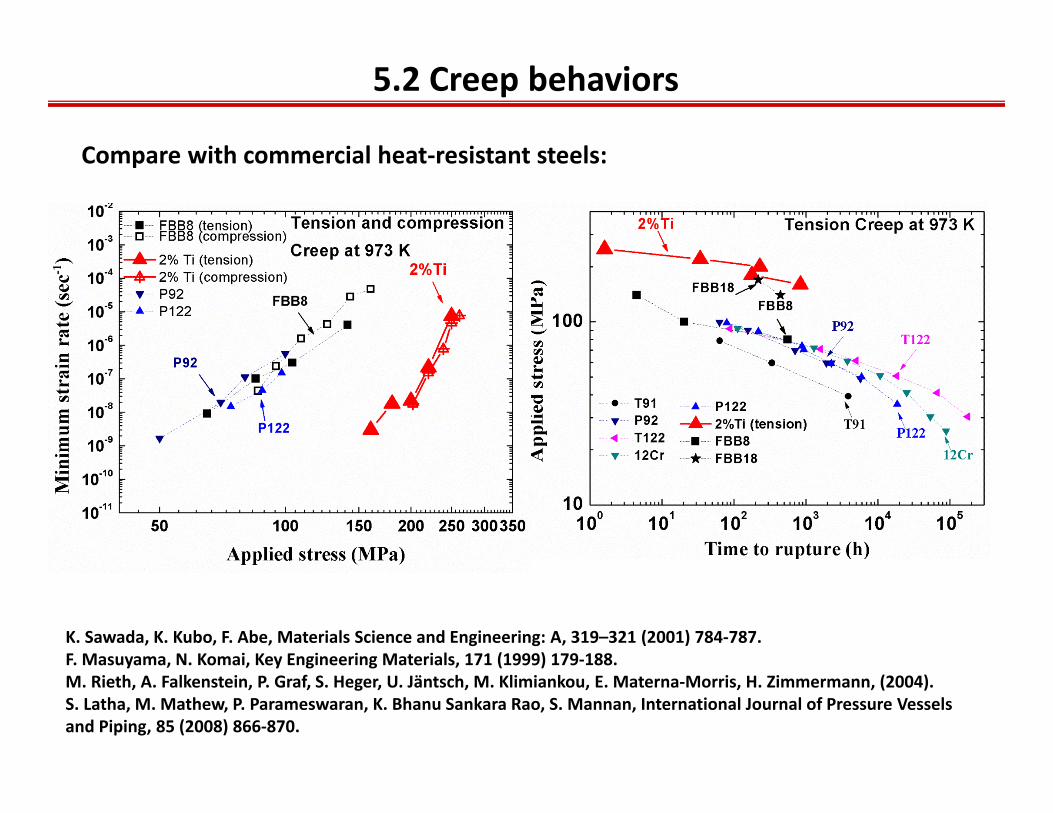
K. Sawada, K. Kubo, F. Abe, Materials Science and Engineering: A, 319–321 (2001) 784‐787.F. Masuyama, N. Komai, Key Engineering Materials, 171 (1999) 179‐188.M. Rieth, A. Falkenstein, P. Graf, S. Heger, U. Jäntsch, M. Klimiankou, E. Materna‐Morris, H. Zimmermann, (2004).S. Latha, M. Mathew, P. Parameswaran, K. Bhanu Sankara Rao, S. Mannan, International Journal of Pressure Vessels and Piping, 85 (2008) 866‐870.
Compare with commercial heat‐resistant steels:
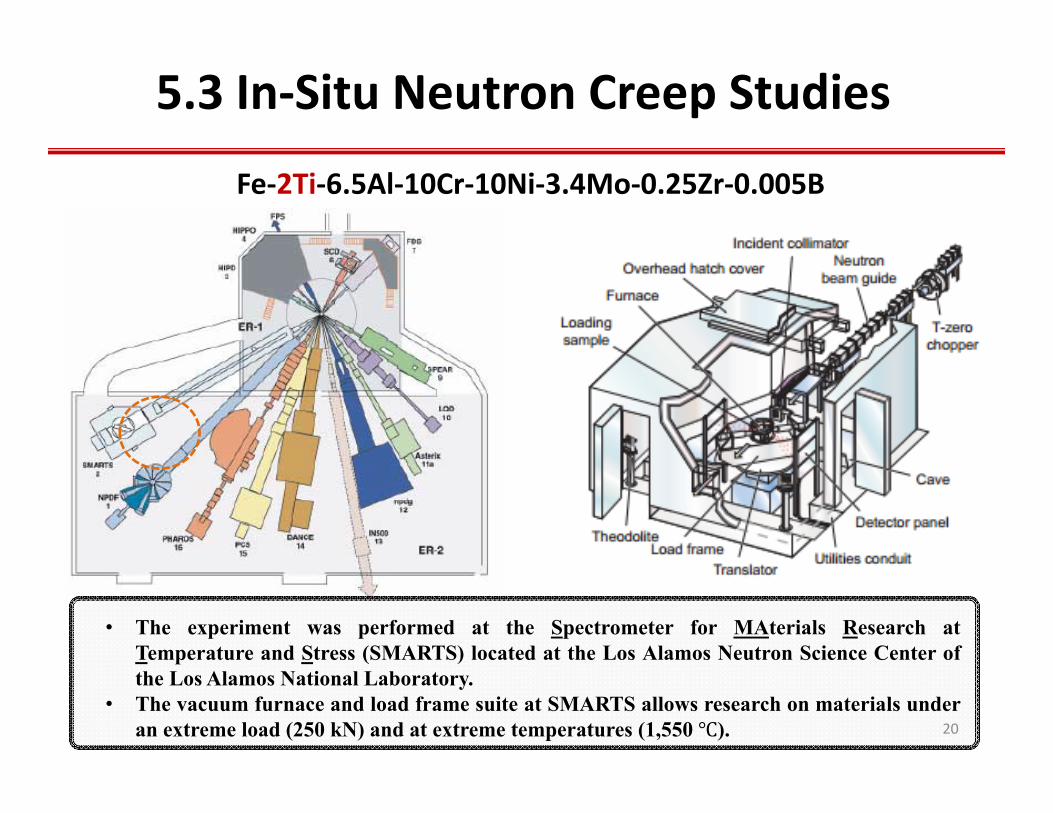
5.3 In‐Situ Neutron Creep Studies
Fe‐2Ti‐6.5Al‐10Cr‐10Ni‐3.4Mo‐0.25Zr‐0.005B
20
• The experiment was performed at the Spectrometer for MAterials Research atTemperature and Stress (SMARTS) located at the Los Alamos Neutron Science Center ofthe Los Alamos National Laboratory.
• The vacuum furnace and load frame suite at SMARTS allows research on materials underan extreme load (250 kN) and at extreme temperatures (1,550 ).

5.3 In‐situ Neutron Creep Studies
Loadingdirection
Loadingdirection
Incidentbeam
Diffractedbeam Q┴
1. Volume-averaged phase strain
Diffractedbeam Q//
2. hkl-plane specific strain–intergranular
single peak fittingof overlapping composite peak
0
0
hkl
hklhklhkl d
dd
Rietveld whole-pattern fitting
0
0_ a
aaphaseavg
3. Local phase strain-intragranular
0,
0,
_
hkl
hklhkllocal d
dd
Separation of overlapping fundamental reflections
(within hkl grain family)
21
5.3 In‐Situ Neutron Creep Studies
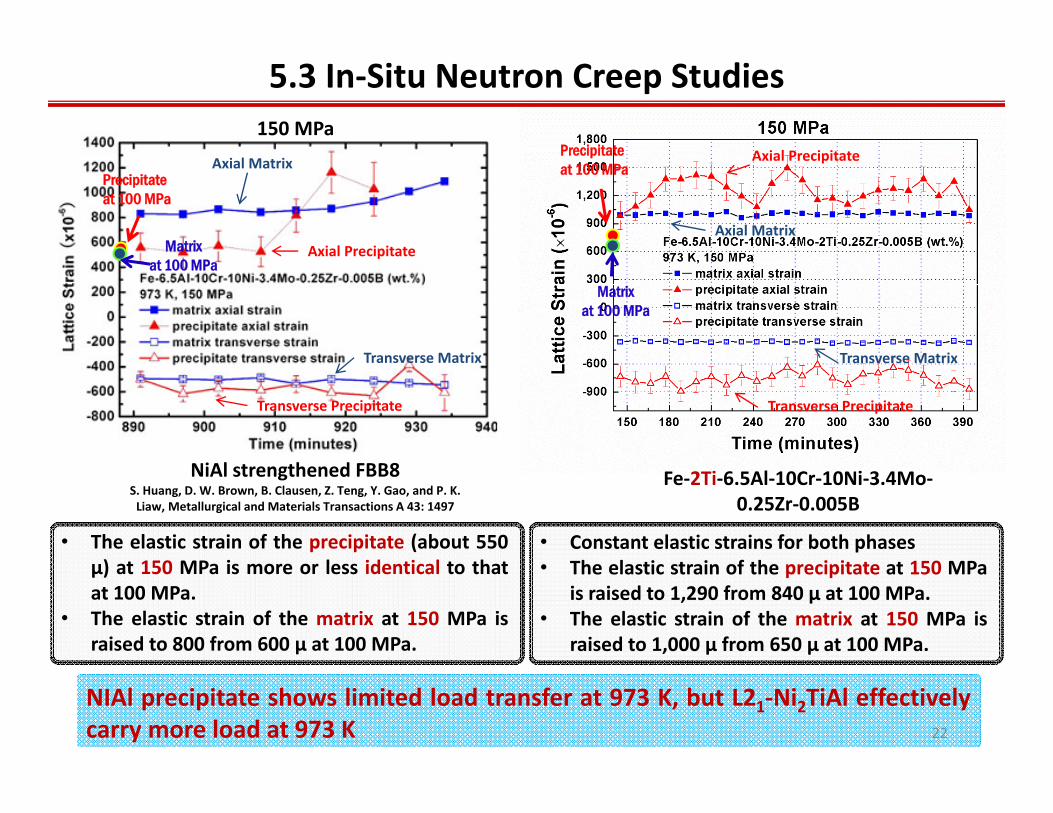
Fe‐2Ti‐6.5Al‐10Cr‐10Ni‐3.4Mo‐0.25Zr‐0.005B
NiAl strengthened FBB8S. Huang, D. W. Brown, B. Clausen, Z. Teng, Y. Gao, and P. K. Liaw, Metallurgical and Materials Transactions A 43: 1497
150 MPa
• Constant elastic strains for both phases• The elastic strain of the precipitate at 150 MPa
is raised to 1,290 from 840 μ at 100 MPa.• The elastic strain of the matrix at 150 MPa is
raised to 1,000 μ from 650 μ at 100 MPa.
• The elastic strain of the precipitate (about 550μ) at 150 MPa is more or less identical to thatat 100 MPa.
• The elastic strain of the matrix at 150 MPa israised to 800 from 600 μ at 100 MPa.
NIAl precipitate shows limited load transfer at 973 K, but L21‐Ni2TiAl effectivelycarry more load at 973 K
Axial Precipitate
Transverse Precipitate
Axial Matrix
Transverse Matrix
Axial Precipitate
Transverse Precipitate
Axial Matrix
Transverse Matrix
Precipitateat 100 MPa
Precipitateat 100 MPa
22
Matrixat 100 MPa
Matrixat 100 MPa
5.3 In‐Situ Neutron Creep Studies
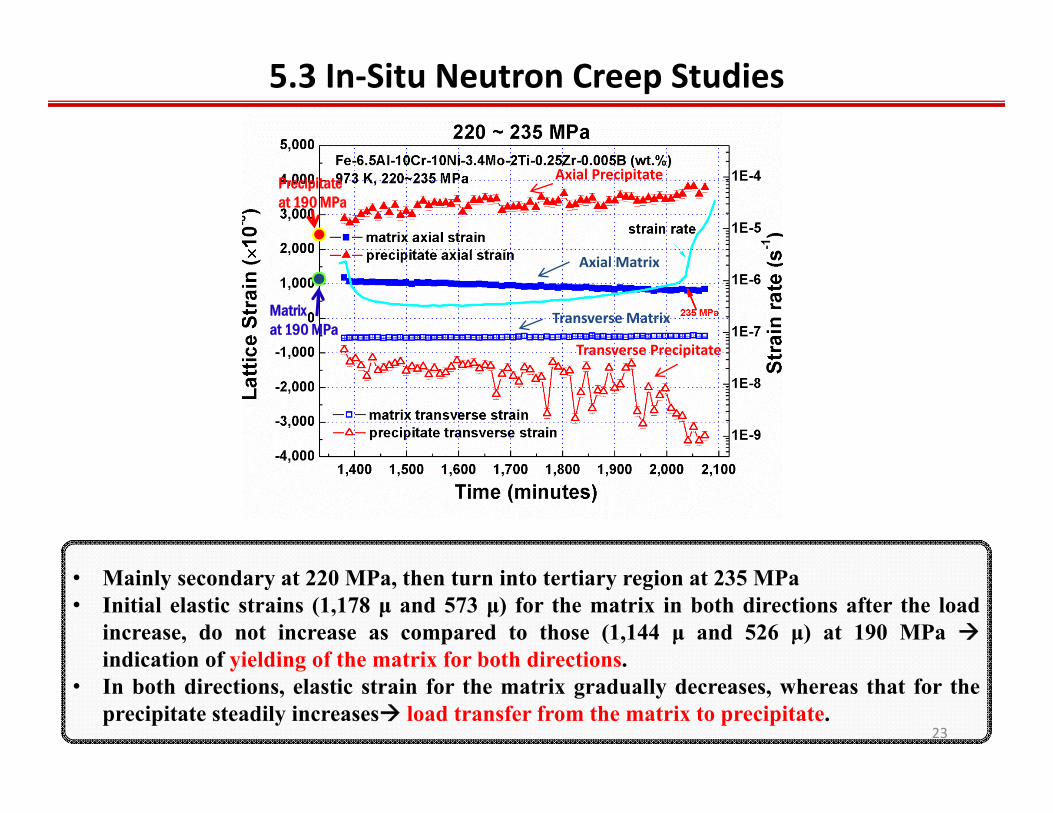
• Mainly secondary at 220 MPa, then turn into tertiary region at 235 MPa• Initial elastic strains (1,178 μ and 573 μ) for the matrix in both directions after the loadincrease, do not increase as compared to those (1,144 μ and 526 μ) at 190 MPa indication of yielding of the matrix for both directions.
• In both directions, elastic strain for the matrix gradually decreases, whereas that for theprecipitate steadily increases load transfer from the matrix to precipitate.
Axial Precipitate
Transverse Precipitate
Axial Matrix
Transverse Matrix
Precipitateat 190 MPa
Matrixat 190 MPa
23
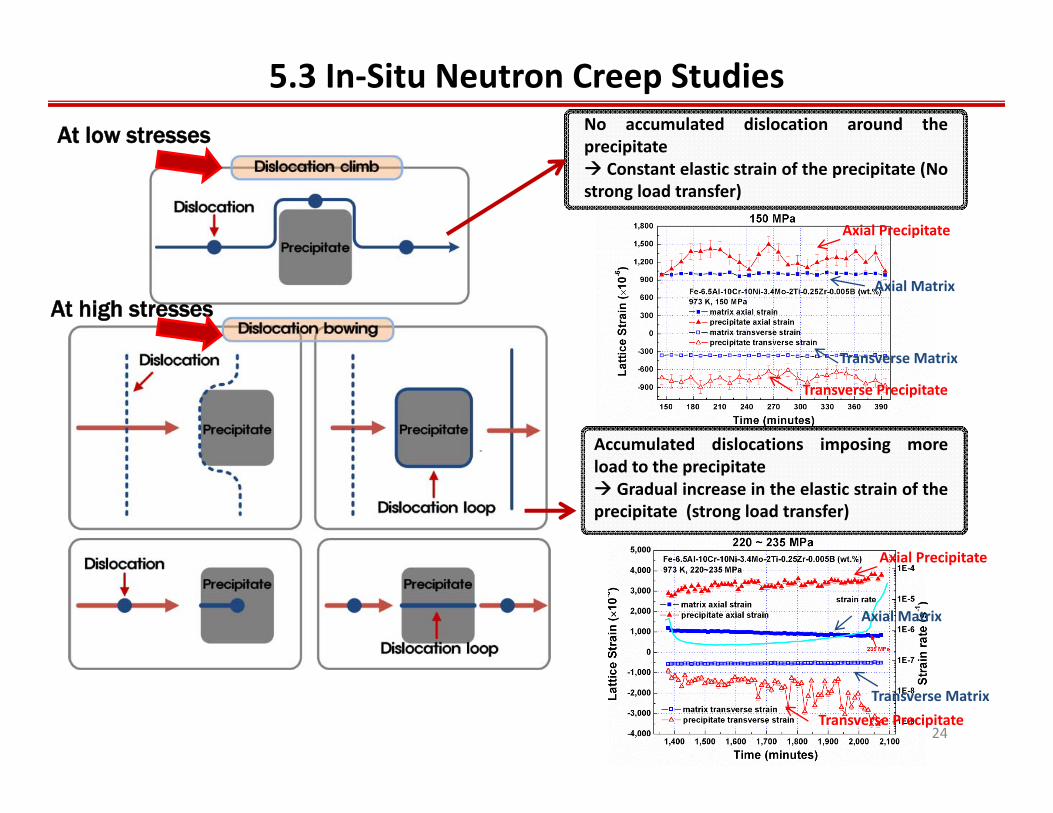
Accumulated dislocations imposing moreload to the precipitate Gradual increase in the elastic strain of theprecipitate (strong load transfer)
5.3 In‐Situ Neutron Creep Studies No accumulated dislocation around theprecipitate Constant elastic strain of the precipitate (Nostrong load transfer)
24
At low stresses
At high stresses
Axial Precipitate
Transverse Precipitate
Axial Matrix
Transverse Matrix
Axial Precipitate
Transverse Precipitate
Axial Matrix
Transverse Matrix
6 Dislocation‐Dynamics Simulations
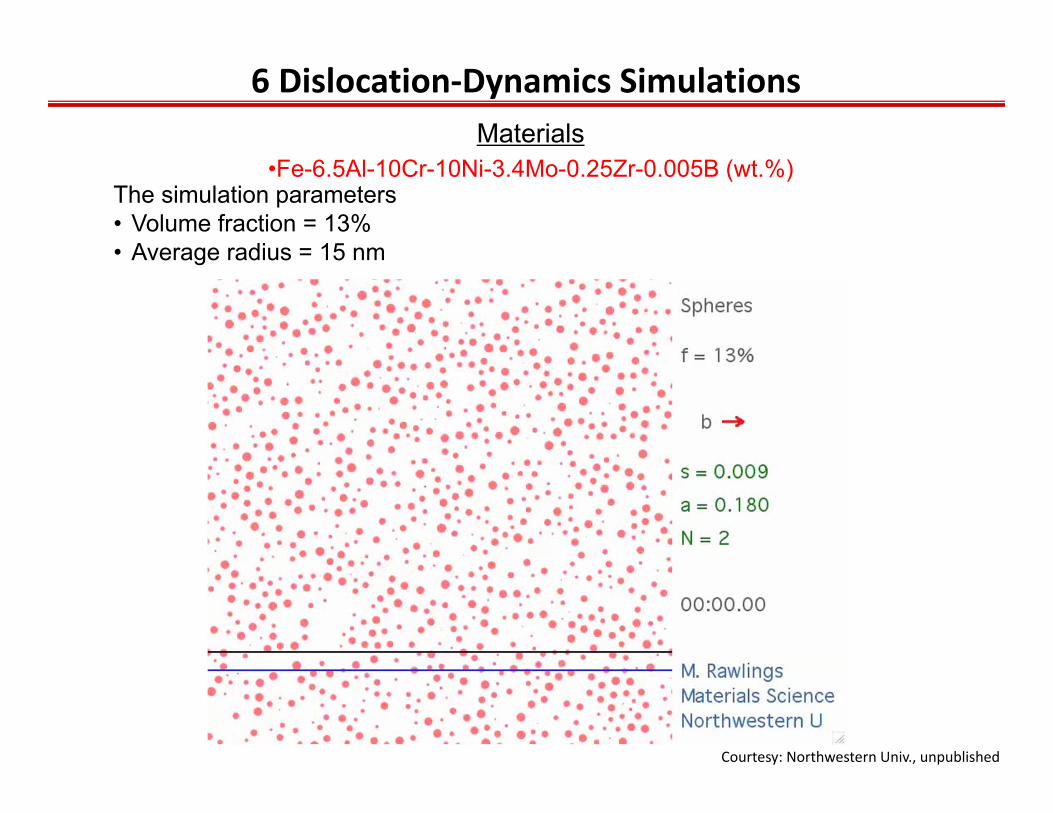
Courtesy: Northwestern Univ., unpublished
The simulation parameters • Volume fraction = 13%• Average radius = 15 nm
Materials•Fe-6.5Al-10Cr-10Ni-3.4Mo-0.25Zr-0.005B (wt.%)
6 Dislocation‐Dynamics Simulations
Courtesy: Northwestern Univ., unpublished
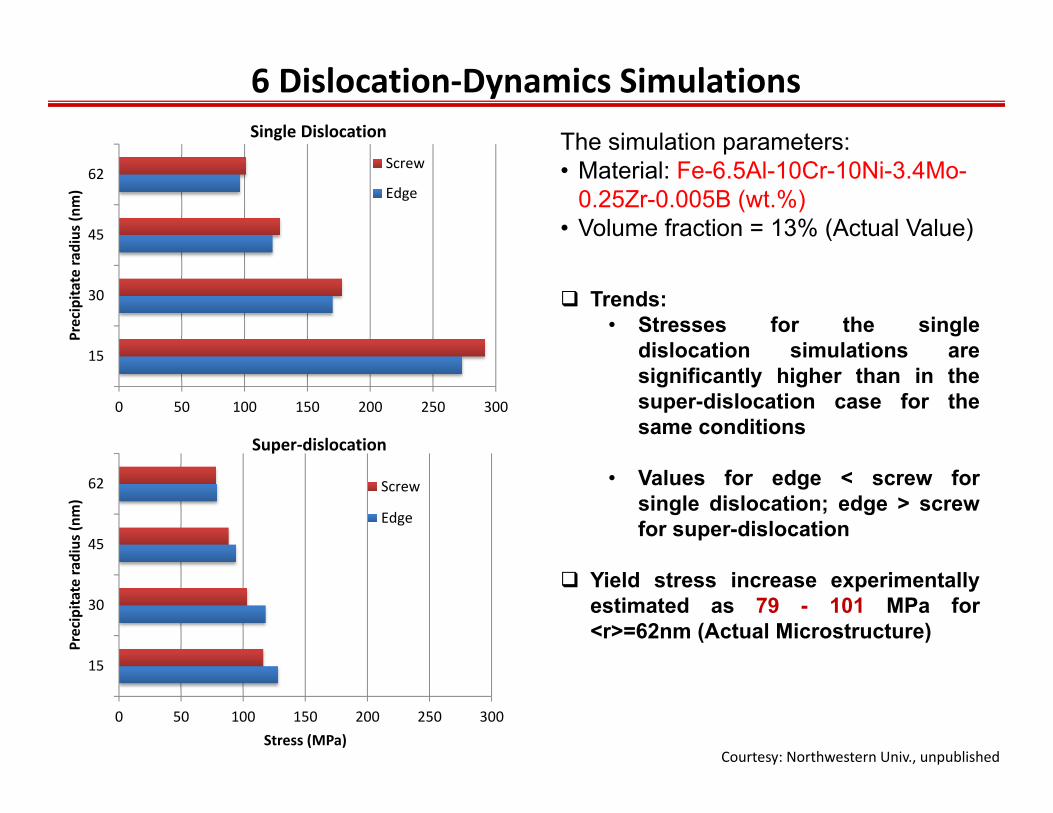
The simulation parameters: • Material: Fe-6.5Al-10Cr-10Ni-3.4Mo-
0.25Zr-0.005B (wt.%)• Volume fraction = 13% (Actual Value)
Trends:• Stresses for the single
dislocation simulations aresignificantly higher than in thesuper-dislocation case for thesame conditions
• Values for edge < screw forsingle dislocation; edge > screwfor super-dislocation
Yield stress increase experimentallyestimated as 79 - 101 MPa for<r>=62nm (Actual Microstructure)
0 50 100 150 200 250 300
15
30
45
62
Stress (MPa)
Precipita
te ra
dius (n
m)
Super‐dislocation
Screw
Edge
0 50 100 150 200 250 300
15
30
45
62
Precipita
te ra
dius (n
m)
Single Dislocation
Screw
Edge
Papers and PresentationsPapers
1) Z. K. Teng, M. K. Miller, G. Ghosh, C. T. Liu, S. Huang, K. F. Russel, M. E. Fine, and P. K. Liaw,Scripta Materialia, 2010;63:61.
2) S. Huang, D. L. Worthington, M. Asta, V. Ozolins, G. Ghosh, and P. K. Liaw, Acta Materialia,2010;58:1982.
3) S. Huang, B. Clausen, D. Brown, Z. K. Teng, Y. F. Gao, and P. K. Liaw, Metallurgical and MaterialsTransactions A, 2012;43:1497.
4) Z. K. Teng, F. Zhang, M. K. Miller, C. T. Liu, S. Huang, Y. T. Chou, R. H. Tien, Y. A. Chang, and P. K.Liaw, Materials Letters, 2012;71:36.
5) Z. K. Teng, G. Ghosh, M. K. Miller, S. Huang, B. Clausen, D. W. Brown, and P. K. Liaw. ActaMater. 2012;60:5362.
6) Z. K. Teng, C. T. Liu, M. K. Miller, G. Ghosh, E. A. Kenik, S. Huang, and P. K. Liaw, MaterialsScience and Engineering A, 2012;541:22.
7) H. Ding, S. Huang, G. Ghosh, P. K. Liaw, and M. Asta, Scripta Mater. 2012;67:732.8) S. Huang, G. Ghosh, X. Li, J. Ilavsky, Z. K. Teng, and P. K. Liaw, Metallurgical and Materials
Transactions A. 2012;43:3423.9) C. H. Liebscher, V. Radmilovic, U. Dahmen, M. Asta, and G. Ghosh, Journal of Materials
Science,2013;48:2067.10) Z. Sun, C. H. Liebscher, S. Huang, Z. Teng, G. Song, G. Wang, M. Asta, M. Rawlings, M. E. Fine,
and P. K. Liaw, Scripta Materialia, 2013;68:384.11) H. Ding, V. I. Razumovsky, and M. Asta, Acta Materialia, 2014;70:130.12) N.Q. Vo, C.H. Liebscher, M.J.S. Rawlings, M. Asta, and D.C. Dunand, Acta Materialia,
2014;71:89. 27
Papers and PresentationsPresentations
1) Z. K. Teng, F. Zhang, M. K. Miller, C. T. Liu, A. Y. Chuang, S. Y. Huang, R. H. Tien, Y. T. Chou, and P.K. Liaw. 2011 TMS Meeting, San Diego, 02/27 ‐03/04.
2) S. Y. Huang, B. Clausen, D. Brown, Z. Teng, G. Ghosh, M. Fine, and P. K. Liaw, 2011 TMS Meeting,San Diego, 02/27 ‐03/04.
3) P. K. Liaw, Z. Teng, S. Huang, C. T. Liu, M. E. Fine, G. Ghosh, M. D. Asta, and G. Wang, The AnnualUniversity Coal Research/Historically Black Colleges and Universities and Other MinorityInstitutions Conference, Pittsburgh, PA, 06/07 – 06/08, 2011.
4) S. Huang, Y. F. Gao, K. An, W. Wu, L. Zheng, M. Rawlings, D. Dunand, and P. K. Liaw, TMS 141thAnnual Meeting, Orlando, FL, Mar., 2012, 03/11 ‐ 03/15.
5) P. K. Liaw, M. D. Asta, D. C. Dunand, M. E. Fine, G. Ghosh, and C. T. Liu, National EnergyTechnology Laboratory, Pittsburgh, 04/18, 2012.
6) C. H. Liebscher, V. Radmilovic, U. Dahmen, M. Asta, and G. Gosh, Microscopy & Microanalysis2012 Meeting, at the Phoenix Convention Center in downtown Phoenix, AZ., 07/29 ‐ 08/02.
7) C. H. Liebscher, V. Radmilovic, U. Dahmen, M. Asta, and G. Gosh, Materials Science andTechnology 2012 Meeting, Pittsburgh, Pennsylvania, 08/07 ‐ 08/11.
8) H. Ding, S. Huang, G. Ghosh, P. K. Liaw, and M. Asta, Materials Science and Technology 2012Meeting, Pittsburgh, Pennsylvania, 08/07 ‐ 08/11.
9) Z. Sun, G. Song, Z. Teng, G. Ghosh, and P. K. Liaw , 2012 MRS Fall Meeting & Exhibit, Boston,11/25 – 11/30.
10) P. K. Liaw, M. Asta, D, Dunand, M. Fine, G. Ghosh, C. Liu, H. Ding, S. Huang, M. Rawlings, Z. Sun,G. Song, Z. Teng, G. Wang, and C. Liebscher, 2013 TMS Meeting , San Antonio, Texas, 03/03 –03/07
11) Z. Sun, S. Huang, Z. Teng, G. Song, G. Wang, and P. K. Liaw, 2013 TMS Meeting , San Antonio,Texas, 03/03 – 03/09 28
Conclusions
1. Calculations of Interfacial Energies for Fe, B2, andL21 Phases
• First‐principles calculations of the interfacial energiesin BCC‐Fe/B2‐NiAl, BCC‐Fe/L21‐Ni2TiAl, and B2‐NiAl/L21‐Ni2TiAl have been carried out.
• The first‐principles calculation is a viable option,compared to the time‐consuming coarsening study.
• Furthermore, it is well known that the shape evolutionin the coherent microstructure is governed by subtleinterplay between interfacial and strain energies(relevant to elastic constant calculations).
29

Conclusions (Cont’d)
2. Coarsening Kinetics of NiAl Precipitates in FBB8
• The coarsening kinetics of NiAl precipitates in FBB8 at 700, 800,and 950 has been investigated.
• It satisfies the linear relationship between ̅ and / . Thecoarsening rates are 13, 38, and 143 nm/h1/3 at 700, 800, and 950, respectively.
• The interfacial energy between the α‐iron matrix and NiAlprecipitates is estimated to be ~ 237 mJ/m2, which is comparable tothe value calculated by first principles.
30
Conclusions (Cont’d)
3. NiAl/Ni2TiAl‐Strengthened Ferritic Superalloys
• TEM shows the formation of an NiAl phase in the Ni2TiAl parentprecipitate for the 2% Ti‐containing alloy.
• Systematic creep tests have been performed on FBB8‐based newalloys at 973 K. These Ti‐containing alloys, especially the 2% Ti alloy,have superior creep resistance, compared to commercial heat‐resistant ferritic steels and NiAl‐strengthened ferritic alloys.
4. In‐Situ Neutron Creep on the 2% Ti alloy
• The in‐situ neutron creep test on the 2% Ti alloy at 973 K wasperformed using SMARTS located at the Los Alamos NationalLaboratory.
• The evolution of the elastic strain shows the dependence of thecreep‐deformation mechanisms, such as dislocation climb andbowing.
31
Conclusions (Cont’d)
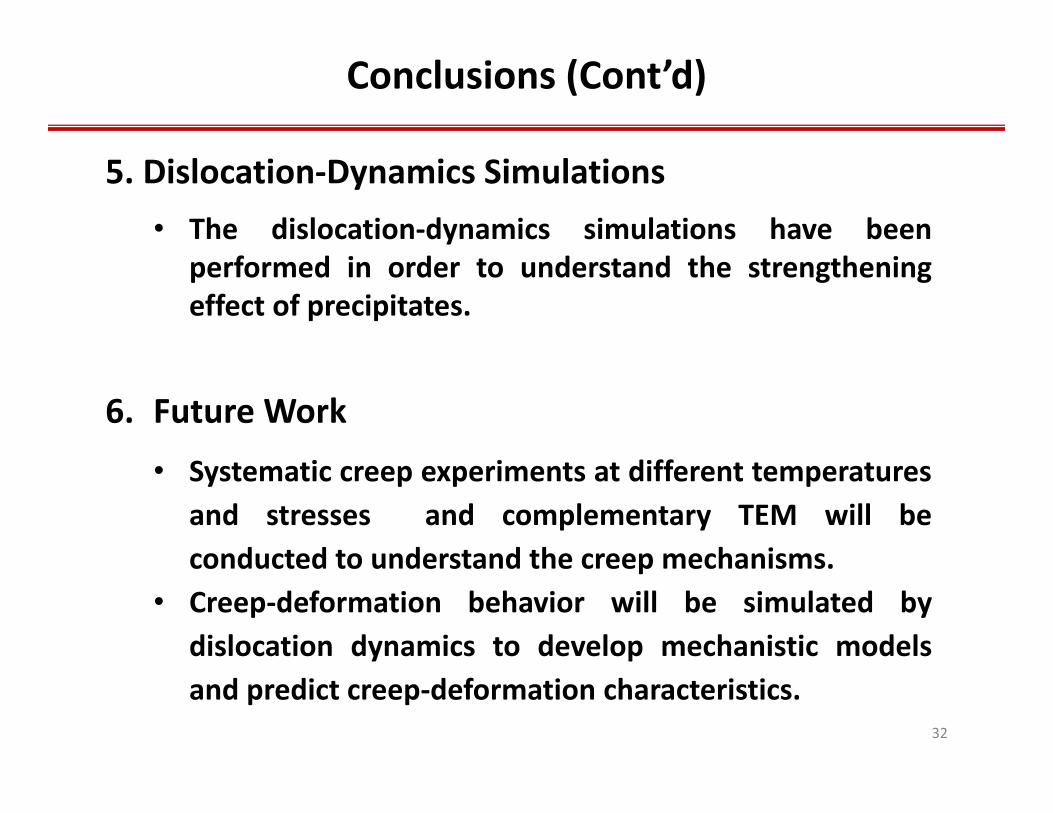
5. Dislocation‐Dynamics Simulations• The dislocation‐dynamics simulations have been
performed in order to understand the strengtheningeffect of precipitates.
6. Future Work
• Systematic creep experiments at different temperaturesand stresses and complementary TEM will beconducted to understand the creep mechanisms.
• Creep‐deformation behavior will be simulated bydislocation dynamics to develop mechanistic modelsand predict creep‐deformation characteristics.
32

Thank you for your kind attention
Q & A
33

3 Calculations of Interfacial Energies for Fe, B2, and L21 Phases
34
Atomic scale structural models of B2‐NiAl/L21‐Ni2TiAl with a coherent interface:
L21-Ni2TiAl
(111) habit
NiAl
L21-Ni2TiAl
(100) habit (110) habit
green: Ni, blue: Al, yellow: Ti
NiAl
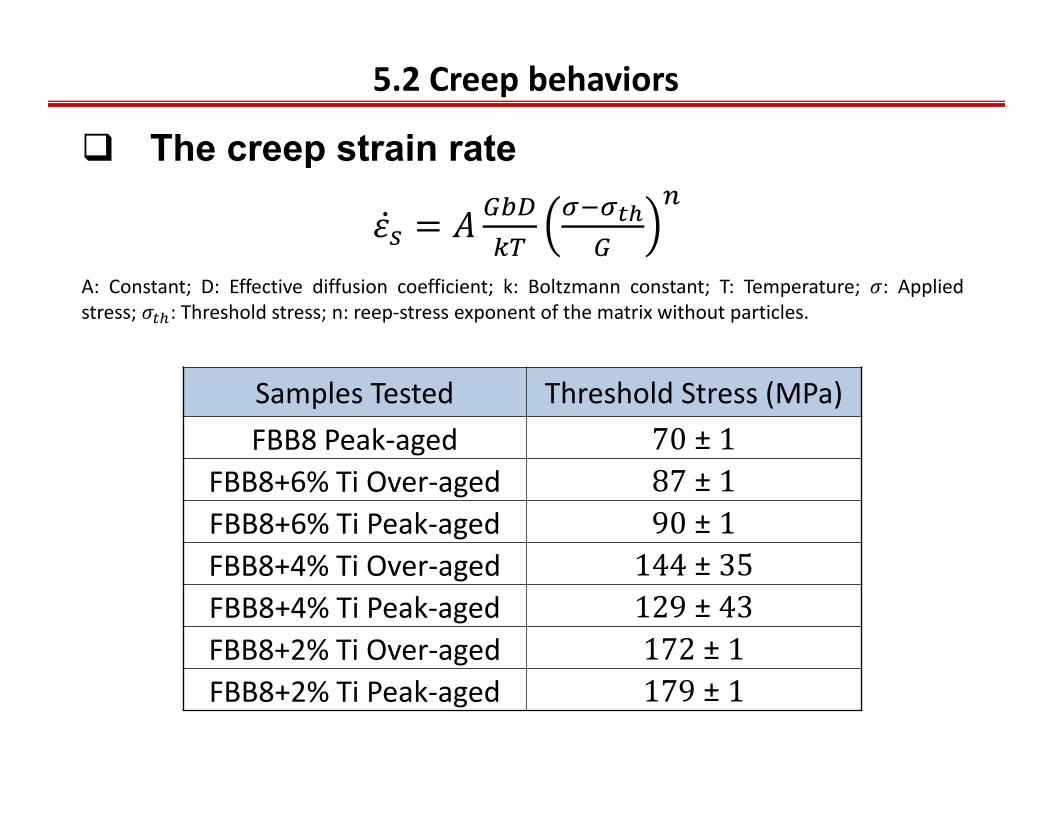
5.2 Creep behaviors
The creep strain rate
A: Constant; D: Effective diffusion coefficient; k: Boltzmann constant; T: Temperature; : Appliedstress; : Threshold stress; n: reep‐stress exponent of the matrix without particles.
Samples Tested Threshold Stress (MPa)FBB8 Peak‐aged 70± 1
FBB8+6% Ti Over‐aged 87± 1FBB8+6% Ti Peak‐aged 90± 1FBB8+4% Ti Over‐aged 144± 35FBB8+4% Ti Peak‐aged 129± 43FBB8+2% Ti Over‐aged 172± 1FBB8+2% Ti Peak‐aged 179± 1

5.3 In‐Situ Neutron Creep Studies
36
Strain vs. Time Strain rate vs. Time
• The sample was subjected to constant loads of 100, 150, 190, 220, and 235 MPa forvarious periods. The diffracted neutron signal in the axial and transverse directionswas continuously collected.
• The total measuring time is ~ 33 h, and the final rupture strain ~ 9%.

Future Work
Understanding of creep mechanisms on 2% Ti alloy1. Systematic creep experiments will be conducted at different temperatures
and applied stresses to obtain all crucial creep parameters, including stressexponents, activation energies, and threshold stresses.
2. A complementary transmission electron microscope (TEM) study on creptspecimens of the 2% Ti alloy will be carried out in order to examine thedetailed interactions between dislocations and precipitates.
3. In‐situ neutron creep data will be analyzed using single‐peak fitting tounderstand the inter‐granular interaction between differently‐orientedgrains during creep deformation.
4. With the experimental results, including TEM, creep, and in‐situ neutroncreep, creep‐deformation will be predicted by dislocation‐dynamicssimulations, which enable us to develop mechanistic models and predictcreep‐deformation behaviors.
37
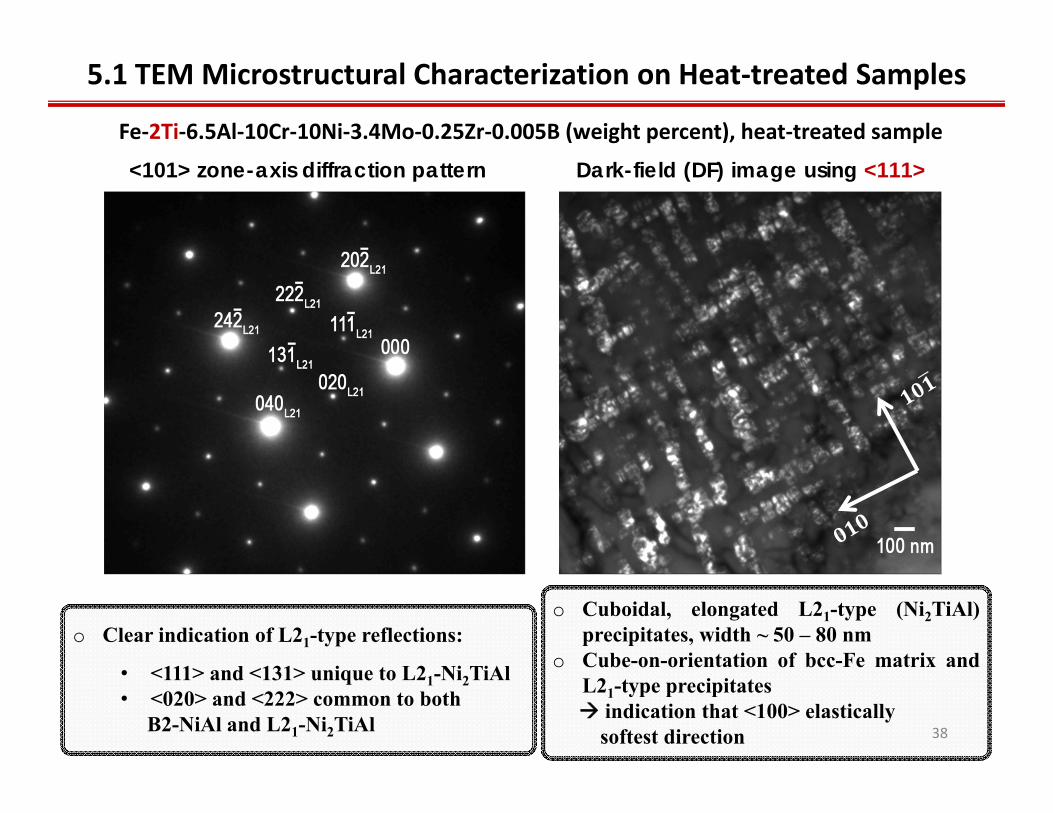
<101> zone-axis diffraction pattern
o Clear indication of L21-type reflections:
• <111> and <131> unique to L21-Ni2TiAl• <020> and <222> common to bothB2-NiAl and L21-Ni2TiAl
Dark-field (DF) image using <111>
o Cuboidal, elongated L21-type (Ni2TiAl)precipitates, width ~ 50 – 80 nm
o Cube-on-orientation of bcc-Fe matrix andL21-type precipitates indication that <100> elasticallysoftest direction
5.1 TEM Microstructural Characterization on Heat‐treated Samples
Fe‐2Ti‐6.5Al‐10Cr‐10Ni‐3.4Mo‐0.25Zr‐0.005B (weight percent), heat‐treated sample
38


![28119167 Corrosion of Superalloys[1]](https://img.pdfslide.us/doc/110x75/577d2ae91a28ab4e1eaa6cd2/28119167-corrosion-of-superalloys1.jpg)