Embed Size (px)
Citation preview
pharmaceutics
Article
Investigation of Drug–Polymer Compatibility UsingChemometric-Assisted UV-Spectrophotometry
Amir Ibrahim Mohamed 1,*, Amr Mohamed Elsayed Abd-Motagaly 1, Osama A. A. Ahmed 2,Suzan Amin 3 and Alaa Ibrahim Mohamed Ali 4,*
1 Pharmaceutics and industrial pharmacy, Military Medical Academy, Cairo 00202, Egypt;[email protected]
2 Department of Pharmaceutics and Industrial Pharmacy, Faculty of Pharmacy,King Abdulaziz University, Jeddah 21589, Saudi Arabia; [email protected]
3 Medical services Department, Cairo 00202, Egypt; [email protected] Faculty of Pharmacy, Cairo University, Cairo 11562, Egypt* Correspondence: [email protected] (A.I.M.); [email protected] (A.I.M.A.);
Tel.: +20-010-0155-6638 (A.I.M.)
Academic Editor: Afzal R. MohammedReceived: 2 November 2016; Accepted: 3 January 2017; Published: 16 January 2017
Abstract: A simple chemometric-assisted UV-spectrophotometric method was used to study thecompatibility of clindamycin hydrochloride (HC1) with two commonly used natural controlled-releasepolymers, alginate (Ag) and chitosan (Ch). Standard mixtures containing 1:1, 1:2, and 1:0.5 w/wdrug–polymer ratios were prepared and UV scanned. A calibration model was developed with partialleast square (PLS) regression analysis for each polymer separately. Then, test mixtures containing1:1 w/w drug–polymer ratios with different sets of drug concentrations were prepared. These wereUV scanned initially and after three and seven days of storage at 25 ◦C. Using the calibration model,the drug recovery percent was estimated and a decrease in concentration of 10% or more from initialconcentration was considered to indicate instability. PLS models with PC3 (for Ag) and PC2 (for Ch)showed a good correlation between actual and found values with root mean square error of crossvalidation (RMSECV) of 0.00284 and 0.01228, and calibration coefficient (R2) values of 0.996 and 0.942,respectively. The average drug recovery percent after three and seven days was 98.1 ± 2.9 and95.4 ± 4.0 (for Ag), and 97.3 ± 2.1 and 91.4 ± 3.8 (for Ch), which suggests more drug compatibilitywith an Ag than a Ch polymer. Conventional techniques including DSC, XRD, FTIR, and in vitrominimum inhibitory concentration (MIC) for (1:1) drug–polymer mixtures were also performed toconfirm clindamycin compatibility with Ag and Ch polymers.
Keywords: clindamycin HCl; sodium alginate; chitosan; partial least squares regression (PLS);drug–polymer compatibility
1. Introduction
Drug–excipient compatibility is one of the most important parameters to be considered duringpre-formulation studies, as it can alter the physicochemical properties and bioavailability of thedrugs involved. Especially for antibiotics, it is necessary to determine the drug compatibility orincompatibility either in oral preparations or in parenteral admixtures before they appear in the clinicalsetting. To develop effective, safe and stable formulation drug–excipient compatibility is an importantprocess in pharmaceutical product development but the cost and time associated with this processrepresent a major challenge and make this type of predictability technique more desirable [1]. Despite ofthe importance of drug–excipient compatibility tests, there is no universally accepted protocol forthis purpose. The most frequently used methods for the physico-chemical investigation include
Pharmaceutics 2017, 9, 7; doi:10.3390/pharmaceutics9010007 www.mdpi.com/journal/pharmaceutics
Pharmaceutics 2017, 9, 7 2 of 13
thermal analysis (DSC, DTA, DTG, ITC), spectroscopic methods (FT-IR, X-ray diffraction, NMR), andchromatographic methods (LC, LC-MS/MS, HPLC) [2]. Some of the reported methods have poorpredictive values, while others are tedious and time consuming. Therefore, simple, effective, rapid andreliable methods using low-cost equipment seem to be necessary.
Spectroscopic techniques are generally fast, with the analysis taking from a few seconds toa few minutes, and can generate large amounts of data for each sample analyzed. This data canbe said to consist of two parts: information and noise. The information part of the data is whateventually leads to knowledge about the sample, while the noise is a non-information part. This iswhere chemometrics comes in. Chemometric tools can extract the information from large sets of dataand markedly increase the quality of the spectral information [3]. The use of spectroscopic techniquescoupled with chemometric tools offers many advantages in qualitative and quantitative spectroscopicanalysis. The methods generally become more robust, precise, and less sensitive to spectral artefacts.Nowadays, various applications performed by means of UV-Vis spectrophotometry and chemometrictechniques have been reported, such as simultaneous determination of drugs in commercial combinedformulations [4,5], as well as purity and quantitative analysis of raw materials and active ingredientsin the manufacturing of pharmaceuticals, cosmetics, foods and beverages [6–9]. In addition, thesetechniques have been applied for stability studies and evaluation of photo-degradation kinetics underdifferent reaction conditions [10]. To our knowledge, there have not yet been reports involving the useof chemometric-assisted UV-spectrophotometry for drug–excipient compatibility studies.
In this study, a simple chemometric-assisted UV-spectrophotometric method was used to research thecompatibility of a model antibiotic drug (clindamycin hydrochloride) with two commonly used naturalbio-degradable controlled-release polymers, Alginate and Chitosan. Standard drug–polymer mixturescontaining 1:1, 1:2, and 1:0.5 w/w drug–polymer ratios at a concentration range of 0.008–0.14 mg/mLwere prepared and UV scanned in the range of 190–250 nm. The UV calibration model was developedwith partial least square (PLS) regression analysis for each polymer separately. Then, test drug–polymermixtures containing 1:1 w/w drug–polymer ratios with different sets of drug concentrations were preparedand UV spectra were collected initially and after three and seven days of storage at temperaturesof 25 ◦C [11]. Using the calibration model of each polymer, the drug recovery percent was estimatedand a decrease in concentration of 10% or more from initial concentration was considered to indicateinstability [12]. In addition, conventional techniques including DSC, XRD, FTIR, and in vitro minimuminhibitory concentration (MIC) for (1:1) drug–polymer mixtures were also performed to confirm theresults obtained.
2. Materials and Methods
2.1. Materials
Clindamycin hydrochloride was purchased from Sigma-Aldrich Chemie GmbH (Riedstrasse,Germany). Sodium alginate, molecular weight of 216.12 g/mol was purchased from Sas chemicals(Mumbai, India). Chitosan, molecular weight of 10,000–30,000 Da was obtained from Srividya Enterprises(Ratnagiri, India). Acetic acid was purchased from El-Nasr Chemicals Co. (Cairo, Egypt). All otherchemicals were of analytical grade.
2.2. Methodology
2.2.1. UV-Spectroscopic Studies
Absorbance spectra were collected with Agilent Cary 60 UV-Vis spectrometer (Agilent, Richardson,TX, USA) equipped with computer software package UV Agilent Cary 60 version 5.0.0.999, usinga 10 mm path length quartz cell over the wavelength range from 190 to 1100 nm.
Pharmaceutics 2017, 9, 7 3 of 13
Preparation of Standard Stock Solutions
Stock solutions of the single compounds (clindamycin, alginate and chitosan) were prepared toget standard stock solutions with a concentration of 10 mg/mL. For the drug, an accurately weighedamount of clindamycin HCl equivalent to 100 mg of clindamycin was transferred into a 10 mLvolumetric flask and diluted to volume with 1 M phosphate buffer of pH 7.5. Sodium alginate wasdissolved in distilled water while chitosan was dissolved in a 0.5% acetic acid solution with a magneticstirrer at 100 rpm [13].
Selection of Appropriate Wavelength Range
The absorbance spectrum of free clindamycin standard solution with a concentration of 4 mg/mLwas scanned from 190 to 1100 nm against phosphate buffer as blank. The wavelength range withmaximum sensitivity of measured absorbance (absorption maxima) and minimum interference frominstrumental factors such as signal-to-noise ratio was selected.
Selection of Linear Concentration Range
Free clindamycin standard solutions with a concentration range of 0.0075–4 mg/mL were scannedwithin the selected wavelength rage and the multi-point calibration curve was plotted. The concentrationrange that shows linear response to drug concentration was selected for calibration model setting.
Preparation of Standard Calibration Drug–Polymer Mixtures
A calibration set of 15 standard mixture solutions containing five drug concentrations (according toits linear calibration range) and three polymer level ratios (1:1, 1:2 and 1:0.5 w/w drug:polymer ratio),was made in 10 mL volumetric flasks from the standard stock solutions using a phosphate buffer withpH 7.5 as diluent for each polymer.
Preparation of Test Drug–Polymer Mixtures
An independent test set of five standard mixture solutions containing five drug concentrations(different from those used in the calibration set but still within the linear calibration range) and onepolymer level ratio (1:1 w/w drug:polymer) was made in 10 mL volumetric flasks from the standardstock solutions using a phosphate buffer with pH 7.5 as a diluent.
Data Collection
Each solution sample was prepared in duplicate and UV spectra of the calibration drug–polymermixtures and the test drug–polymer mixtures were collected over the selected wavelength range atroom temperature (25 ◦C). Each sample was run for three scans with a bandwidth of 1 nm, scanrate of 1 nm/s, time response of 1 s, and data interval of 1.0 point/nm. The test drug–polymermixtures were stored at room temperature and re-scanned after three and seven days. For the chitosantest mixture, samples were re-scanned after filtration via 3K Amicon Ultra-2 centrifugal filter deviceusing 40◦ fixed angle centrifuge for 60 min at 7500× g.
Chemometric Analysis
Spectral data collected were imported into Essential FTIR™ software (15th Edition, Operant LLC,Madison, WI, USA) for pre-treatment and chemometric modeling. Partial least square (PLS)regression analysis was applied to explore data and to develop calibration models for both polymers.The performance of the UV calibration model was evaluated with leave-one out cross validation (CV),in which one sample is removed from the calibration set at a time and the same sample is predicted byusing the calibration model built with the remaining samples. The appropriate number of PLS factors(principal components) for each model was chosen by adopting the root mean square error of crossvalidation (RMSECV), and the calibration coefficient (R2). The best prediction ability of the modelscorresponds to the lowest RMSECV and highest calibration coefficient (R2) [14].
Pharmaceutics 2017, 9, 7 4 of 13
Recovery Analysis
Clindamycin concentrations in the polymer test mixtures were assessed using the calibrationmodel of each polymer at zero time and after three and seven days of storage at temperatures of 25 ◦C.The drug concentrations at time zero were defined as 100%, and subsequent sample concentrationswere expressed as a percentage of these initial concentrations. Decreases in concentration of 10% ormore from initial concentration were considered to indicate instability.
2.2.2. Physico-Chemical Analysis
Preparation of Drug–Polymer Physical Mixtures and Blend Films
Physical mixtures of 1:1 w/w were prepared by mixing 50 mg clindamycin HCl with 50 mg of eachpolymer separately. Drug–polymer blend films were formed by using a simple solvent evaporationcasting method [15]. Distilled water was used as solvent for water-soluble substances (clindamycinand sodium alginate), while 0.5% acetic acid solution was used for the chitosan polymer. For bothclindamycin-alginate films and clindamycin-chitosan films, 5 mL of drug solution (5 mg/mL) wasmixed with 5 mL of polymer solution (5 mg/mL) to get a mixture of 1:1 w/w drug:polymer ratio.The mixture obtained was cast to glass petri-dishes and evaporated at room temperature for 48 h.
Differential Scanning Calorimetry (DSC) Thermal Analysis
The DSC thermograms for each of the following (drug alone, physical mixture, and drug–polymerblend films) were collected on a Perkin Elmer analyzer (Perkin Elmer, Waltham, MA, USA) equippedwith computer software program at a scanning rate of 10 ◦C·min−1. Each 10 mg sample was weighedand sealed in a flat bottomed aluminum pan, then heated from 30–450 ◦C in an atmosphere of nitrogen.
X-ray Diffraction Crystallography (XRD)
X-ray spectra for drug, physical mixture and drug–polymer blend films were measured usingPhilips X-ray diffraction equipment model PW/1710 (Philips, Amsterdam, The Neitherlands) withcopper tube anode, 40 Kv voltage, and 35 mA current generator. The diffraction patterns were obtainedover a range of 2θ angles from 2◦–50◦ at an angular speed of 0.02◦ per second.
Fourier Transform Infrared (FTIR) Spectral Analysis
Samples (clindamycin, physical mixtures, and blend films) were scanned at the functional groupregion (4000–1500 cm−1) using a Shimadzu FT-IR spectrometer (Shimadzu, Kyoto, Japan). The sampleswere mixed with 200 mg of KBr and the obtained disks were analyzed at a resolution of 4 cm−1.Each spectrum was the mean of 16 consecutive scans of the same sample.
2.2.3. Effect of Polymers on Clindamycin Anti-Bacterial Activity against Staphylococcus aureus
Bacterial Isolates and Culture Conditions
Staphylococcus aureus ATCC 6538 was obtained from the Microbiological Resources Centre(MIRCEN, Cairo, Egypt). Primary isolation was performed on selective nutrient agar supplementedwith sheep blood 10% (v/v). Following primary selective isolation, Staphylococcus aureus bacterial cellswere identified according to colony morphology and gram stain. Five drops of Staphylococcus aureussuspension was prepared in sterile distilled water to opacity of 0.5 McFarland standards (1.5 × 10⁸
colony forming unit/mL) [16].
Preparation of Sterile Stock Solutions (Drug or Polymer)
All stock solutions were sterilized by filtration with Millipore bacterial filters (0.22 µ membranesyringe filter), transferred into sterile tube with rubber cap (blood collection tube), and stored away
Pharmaceutics 2017, 9, 7 5 of 13
of light and heat. For water-soluble clindamycin and sodium alginate, 102.4 mg was accuratelyweighed and placed in a 10 mL volumetric flask and completed to 10 mL with distilled water toget a concentration of 10.24 mg/mL (10,240 µg/mL). For chitosan, 102.4 mg was placed in a 10 mLvolumetric flask and diluted with 0.5% acetic acid solution.
Preparation of Working Dilutions for Agar Susceptibility Tests
A conventional two-fold dilution scheme was used to prepare different concentration ranges ofantimicrobial agent (drug or polymer). Agar dilution susceptibility test was used as a comparativetesting to determine the minimum inhibitory concentration (MIC) of clindamycin, polymer (if any),and clindamycin-polymer 1:1 mixture blend. In a 50 mL sterile falcon tube, using sterile pipettes,1 mL volume of the prepared dilution series was added to 19 mL of sterile molten agar (nutrientagar with 10% sheep blood), mixed thoroughly, and poured into 90 mm sterile Petri dishes to geta final concentration in medium of 0.03–512 µg/mL. Blends of clindamycin-polymer were prepared bymixing 1 mL of each drug dilution with 1 mL of polymer of the same concentration (µg/mL) to geta mixture of 1:1 drug/polymer solution, then added to 18 mL of molten agar (20 mL total volume) tokeep a final drug concentration of 0.03–512 µg/mL. In addition, distilled water was used as controltest and 0.5% acetic acid solution as solvent control.
Bacterial Growth Inhibition Assay (Agar Dilution Susceptibility Method)
Five drops of Staphylococcus aureus suspension (equivalent to a no. 0.5 McFarland standard)was inoculated on agar plates containing different concentrations of drug, polymer, or a 1:1 blend.After 24 h of incubation 37 ◦C, Plates were examined visually, and the lowest concentration of antibioticshowing complete inhibition of bacterial growth was recorded as MIC.
3. Results and Discussion
3.1. UV-Spectroscopic Studies
3.1.1. Selection of Wavelength Range
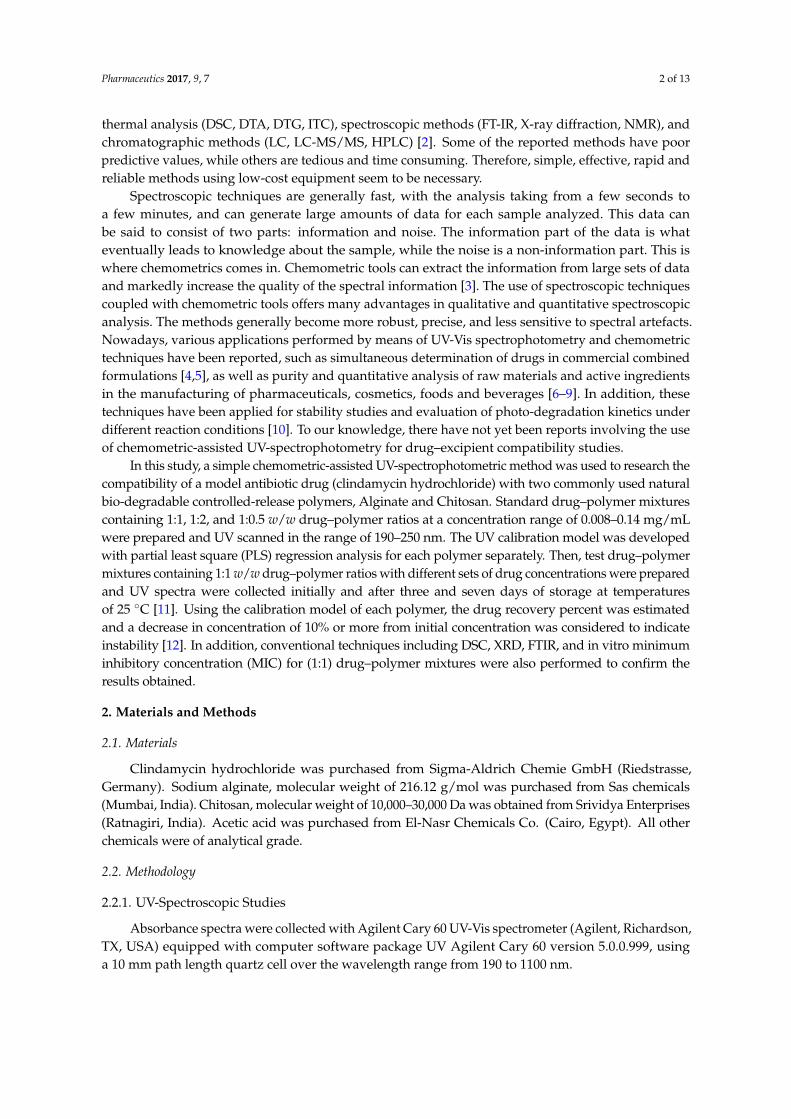
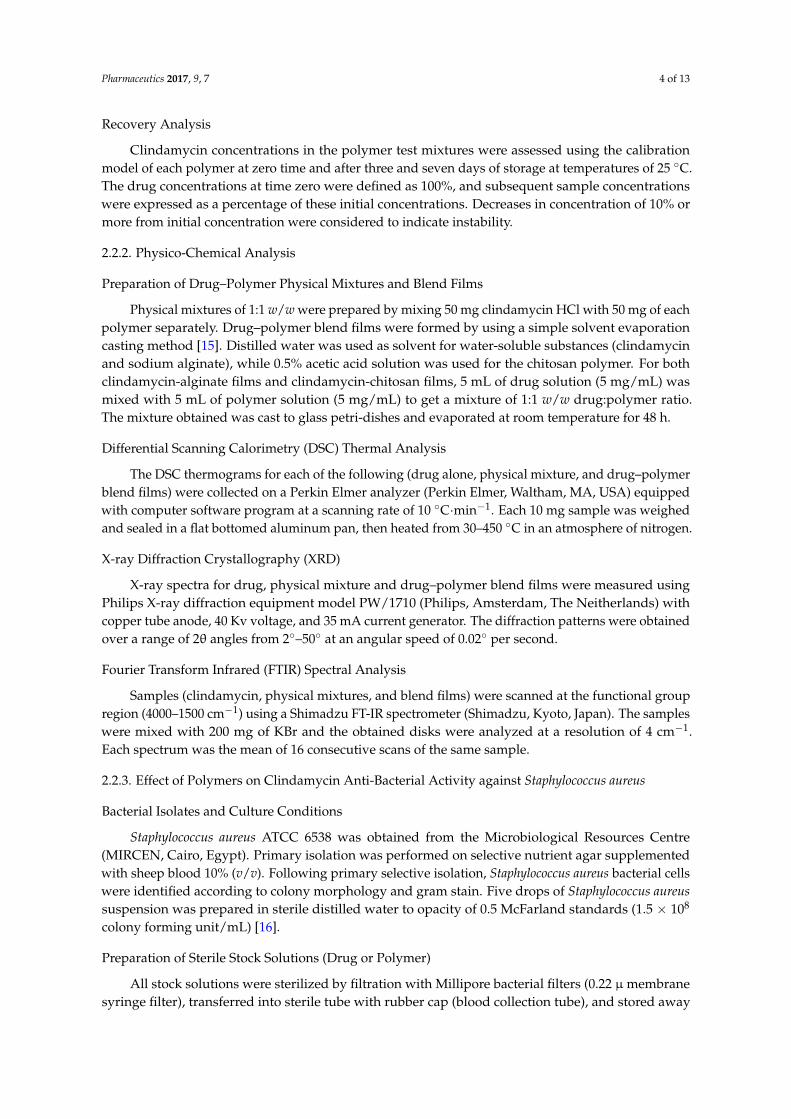
The spectrum for free clindamycin is shown in Figure 1. It is clear that clindamycin exhibitsa significant absorption signal in the 190–250 nm region which is mainly related to electronic transitionsinvolving pi (π), non-bonding (n) electrons of the carbonyl group, and hetero-atoms such as oxygen,nitrogen, or sulfur present in clindamycin molecules [3]. The wavelengths over 250 nm were discardeddue to the absence of absorption signals and because any absorbance values obtained at thesewavelengths would have introduced a significant amount of noise in the calibration matrix, therebydecreasing the chemometric model precision [17].
Pharmaceutics 2017, 9, 7 5 of 13
Preparation of Sterile Stock Solutions (Drug or Polymer)
All stock solutions were sterilized by filtration with Millipore bacterial filters (0.22 μ membrane syringe filter), transferred into sterile tube with rubber cap (blood collection tube), and stored away of light and heat. For water-soluble clindamycin and sodium alginate, 102.4 mg was accurately weighed and placed in a 10 mL volumetric flask and completed to 10 mL with distilled water to get a concentration of 10.24 mg/mL (10,240 μg/mL). For chitosan, 102.4 mg was placed in a 10 mL volumetric flask and diluted with 0.5% acetic acid solution.
Preparation of Working Dilutions for Agar Susceptibility Tests
A conventional two-fold dilution scheme was used to prepare different concentration ranges of antimicrobial agent (drug or polymer). Agar dilution susceptibility test was used as a comparative testing to determine the minimum inhibitory concentration (MIC) of clindamycin, polymer (if any), and clindamycin-polymer 1:1 mixture blend. In a 50 mL sterile falcon tube, using sterile pipettes, 1 mL volume of the prepared dilution series was added to 19 mL of sterile molten agar (nutrient agar with 10% sheep blood), mixed thoroughly, and poured into 90 mm sterile Petri dishes to get a final concentration in medium of 0.03–512 μg/mL. Blends of clindamycin-polymer were prepared by mixing 1 mL of each drug dilution with 1 mL of polymer of the same concentration (μg/mL) to get a mixture of 1:1 drug/polymer solution, then added to 18 mL of molten agar (20 mL total volume) to keep a final drug concentration of 0.03–512 μg/mL. In addition, distilled water was used as control test and 0.5% acetic acid solution as solvent control.
Bacterial Growth Inhibition Assay (Agar Dilution Susceptibility Method)
Five drops of Staphylococcus aureus suspension (equivalent to a no. 0.5 McFarland standard) was inoculated on agar plates containing different concentrations of drug, polymer, or a 1:1 blend. After 24 h of incubation 37 °C, Plates were examined visually, and the lowest concentration of antibiotic showing complete inhibition of bacterial growth was recorded as MIC.
3. Results and Discussion
3.1. UV-Spectroscopic Studies
3.1.1. Selection of Wavelength Range
The spectrum for free clindamycin is shown in Figure 1. It is clear that clindamycin exhibits a significant absorption signal in the 190–250 nm region which is mainly related to electronic transitions involving pi (π), non-bonding (n) electrons of the carbonyl group, and hetero-atoms such as oxygen, nitrogen, or sulfur present in clindamycin molecules [3]. The wavelengths over 250 nm were discarded due to the absence of absorption signals and because any absorbance values obtained at these wavelengths would have introduced a significant amount of noise in the calibration matrix, thereby decreasing the chemometric model precision [17].
Figure 1. UV spectrum of clindamycin HCl in phosphate buffer pH 7.5. Figure 1. UV spectrum of clindamycin HCl in phosphate buffer pH 7.5.
Pharmaceutics 2017, 9, 7 6 of 13
3.1.2. Selection of Concentration Range
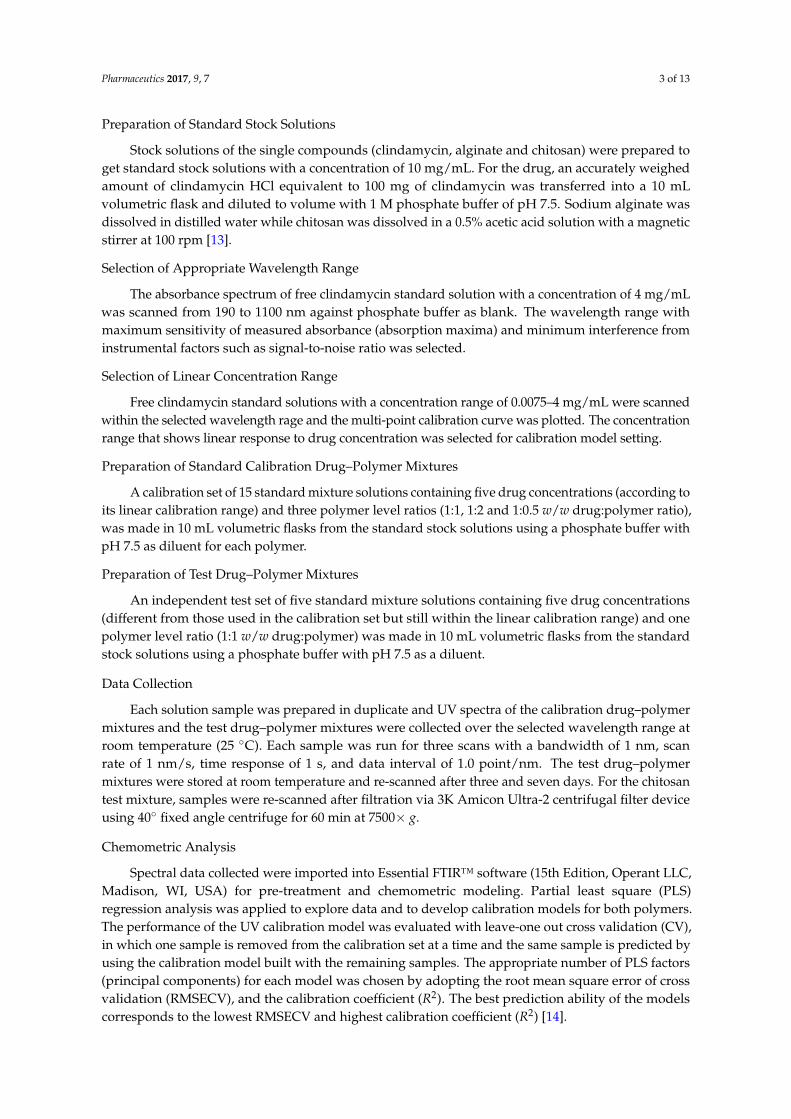
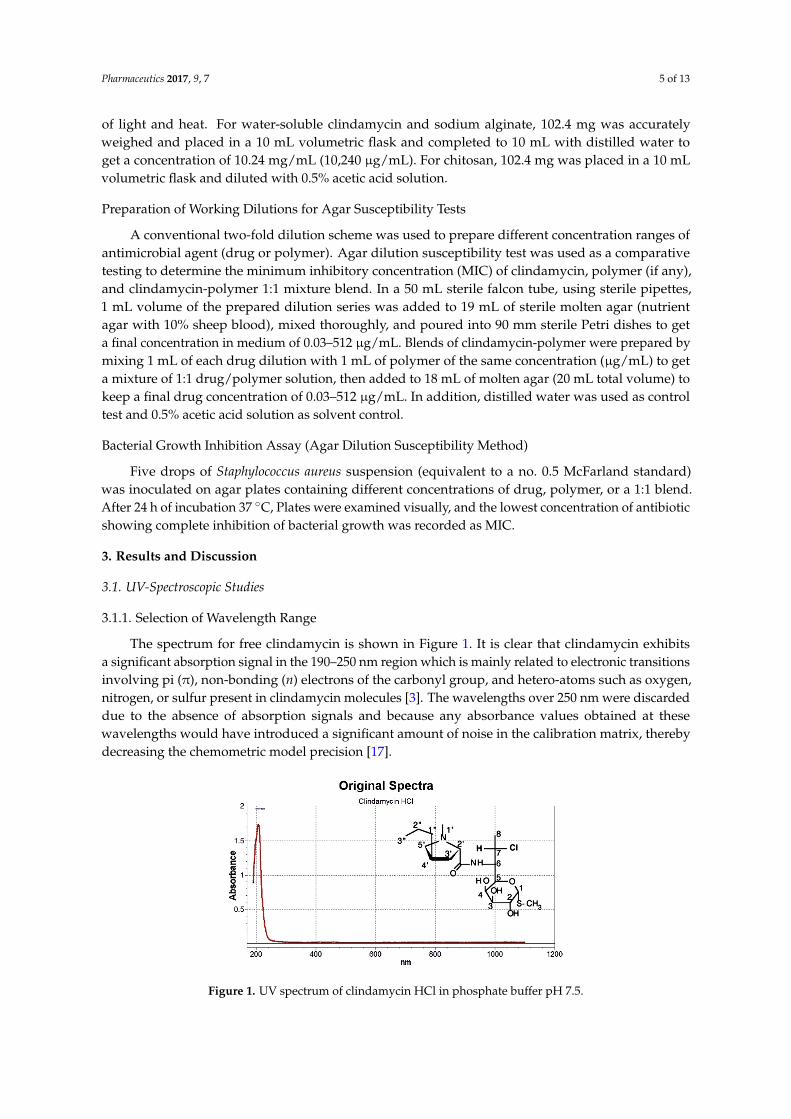
In accordance with Beer’s law, a linear relationship should exist between the absorbance andthe concentration, assuming the path length is kept constant. A multi-point calibration curve wasperformed using Essential FTIR™ software (Figure 2). The response of the drug was found to be linearin the concentration range of 0.008–0.14 mg/mL with a correlation coefficient of 0.982.
Pharmaceutics 2017, 9, 7 6 of 13
3.1.2. Selection of Concentration Range
In accordance with Beer’s law, a linear relationship should exist between the absorbance and the concentration, assuming the path length is kept constant. A multi-point calibration curve was performed using Essential FTIR™ software (Figure 2). The response of the drug was found to be linear in the concentration range of 0.008–0.14 mg/mL with a correlation coefficient of 0.982.
Figure 2. Multi-point calibration curve of clindamycin HCl at concentration range of 0.0075–4 mg/mL.
3.1.3. Preparation of Calibration and Test Drug–Polymer Mixtures
Fifteen standard calibration mixtures were prepared for each polymer (alginate and chitosan) containing five drug concentrations (0.008, 0.02, 0.06, 0.1, and 0.14 mg/mL) and three polymer level ratios (1:1, 1:2 and 1:0.5 w/w drug:polymer ratio) using a phosphate buffer at pH 7.5 as diluent. Five test mixtures were also prepared for each polymer containing five different drug concentrations (0.01, 0.03, 0.05, 0.08, and 0.12 mg/mL) and one polymer level ratio (1:1 w/w drug:polymer) using the same stock solutions. Each concentration was prepared in duplicate and the spectrophotometric readings were measured at a wavelength range of 190–250 nm by using phosphate buffer at a pH 7.5 as a blank.
3.1.4. Chemometric Analysis
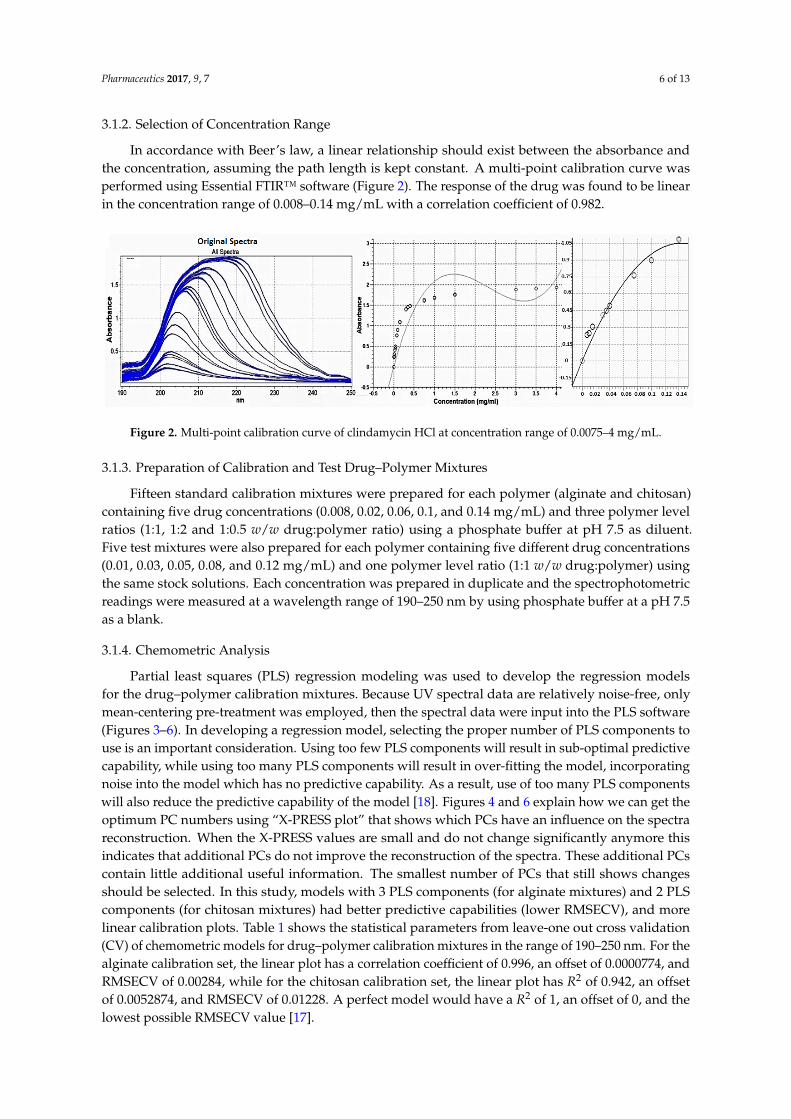
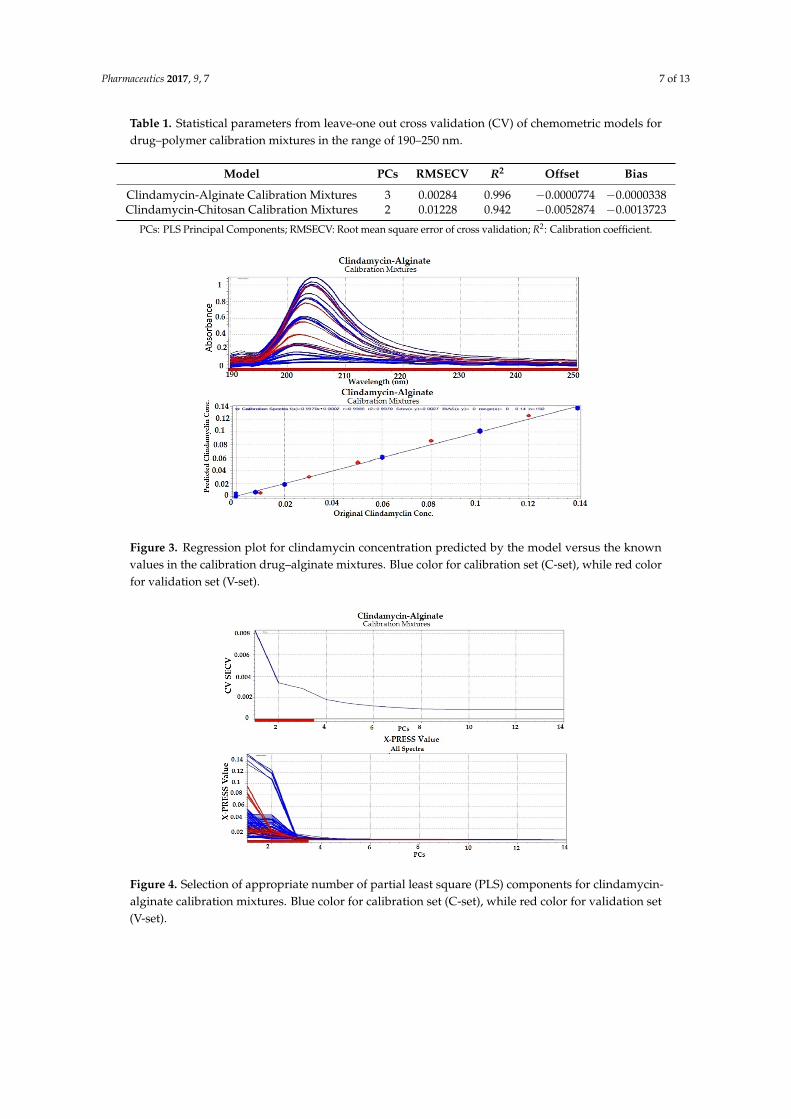
Partial least squares (PLS) regression modeling was used to develop the regression models for the drug–polymer calibration mixtures. Because UV spectral data are relatively noise-free, only mean-centering pre-treatment was employed, then the spectral data were input into the PLS software (Figures 3–6). In developing a regression model, selecting the proper number of PLS components to use is an important consideration. Using too few PLS components will result in sub-optimal predictive capability, while using too many PLS components will result in over-fitting the model, incorporating noise into the model which has no predictive capability. As a result, use of too many PLS components will also reduce the predictive capability of the model [18]. Figures 4 and 6 explain how we can get the optimum PC numbers using “X-PRESS plot” that shows which PCs have an influence on the spectra reconstruction. When the X-PRESS values are small and do not change significantly anymore this indicates that additional PCs do not improve the reconstruction of the spectra. These additional PCs contain little additional useful information. The smallest number of PCs that still shows changes should be selected. In this study, models with 3 PLS components (for alginate mixtures) and 2 PLS components (for chitosan mixtures) had better predictive capabilities (lower RMSECV), and more linear calibration plots. Table 1 shows the statistical parameters from leave-one out cross validation (CV) of chemometric models for drug–polymer calibration mixtures in the range of 190–250 nm. For the alginate calibration set, the linear plot has a correlation coefficient of 0.996, an offset of 0.0000774, and RMSECV of 0.00284, while for the chitosan calibration set, the linear plot has R2 of 0.942, an offset of 0.0052874, and RMSECV of 0.01228. A perfect model would have a R2 of 1, an offset of 0, and the lowest possible RMSECV value [17].
Figure 2. Multi-point calibration curve of clindamycin HCl at concentration range of 0.0075–4 mg/mL.
3.1.3. Preparation of Calibration and Test Drug–Polymer Mixtures
Fifteen standard calibration mixtures were prepared for each polymer (alginate and chitosan)containing five drug concentrations (0.008, 0.02, 0.06, 0.1, and 0.14 mg/mL) and three polymer levelratios (1:1, 1:2 and 1:0.5 w/w drug:polymer ratio) using a phosphate buffer at pH 7.5 as diluent.Five test mixtures were also prepared for each polymer containing five different drug concentrations(0.01, 0.03, 0.05, 0.08, and 0.12 mg/mL) and one polymer level ratio (1:1 w/w drug:polymer) usingthe same stock solutions. Each concentration was prepared in duplicate and the spectrophotometricreadings were measured at a wavelength range of 190–250 nm by using phosphate buffer at a pH 7.5as a blank.
3.1.4. Chemometric Analysis
Partial least squares (PLS) regression modeling was used to develop the regression modelsfor the drug–polymer calibration mixtures. Because UV spectral data are relatively noise-free, onlymean-centering pre-treatment was employed, then the spectral data were input into the PLS software(Figures 3–6). In developing a regression model, selecting the proper number of PLS components touse is an important consideration. Using too few PLS components will result in sub-optimal predictivecapability, while using too many PLS components will result in over-fitting the model, incorporatingnoise into the model which has no predictive capability. As a result, use of too many PLS componentswill also reduce the predictive capability of the model [18]. Figures 4 and 6 explain how we can get theoptimum PC numbers using “X-PRESS plot” that shows which PCs have an influence on the spectrareconstruction. When the X-PRESS values are small and do not change significantly anymore thisindicates that additional PCs do not improve the reconstruction of the spectra. These additional PCscontain little additional useful information. The smallest number of PCs that still shows changesshould be selected. In this study, models with 3 PLS components (for alginate mixtures) and 2 PLScomponents (for chitosan mixtures) had better predictive capabilities (lower RMSECV), and morelinear calibration plots. Table 1 shows the statistical parameters from leave-one out cross validation(CV) of chemometric models for drug–polymer calibration mixtures in the range of 190–250 nm. For thealginate calibration set, the linear plot has a correlation coefficient of 0.996, an offset of 0.0000774, andRMSECV of 0.00284, while for the chitosan calibration set, the linear plot has R2 of 0.942, an offsetof 0.0052874, and RMSECV of 0.01228. A perfect model would have a R2 of 1, an offset of 0, and thelowest possible RMSECV value [17].
Pharmaceutics 2017, 9, 7 7 of 13
Table 1. Statistical parameters from leave-one out cross validation (CV) of chemometric models fordrug–polymer calibration mixtures in the range of 190–250 nm.
Model PCs RMSECV R2 Offset Bias
Clindamycin-Alginate Calibration Mixtures 3 0.00284 0.996 −0.0000774 −0.0000338Clindamycin-Chitosan Calibration Mixtures 2 0.01228 0.942 −0.0052874 −0.0013723
PCs: PLS Principal Components; RMSECV: Root mean square error of cross validation; R2: Calibration coefficient.Pharmaceutics 2017, 9, 7 7 of 13
Figure 3. Regression plot for clindamycin concentration predicted by the model versus the known values in the calibration drug–alginate mixtures. Blue color for calibration set (C-set), while red color for validation set (V-set).
Figure 4. Selection of appropriate number of partial least square (PLS) components for clindamycin-alginate calibration mixtures. Blue color for calibration set (C-set), while red color for validation set (V-set).
Figure 5. Regression plot for clindamycin concentration predicted by the model versus the known values in the calibration drug–chitosan mixtures. Blue color for calibration set (C-set), while red color for validation set (V-set).
Figure 3. Regression plot for clindamycin concentration predicted by the model versus the knownvalues in the calibration drug–alginate mixtures. Blue color for calibration set (C-set), while red colorfor validation set (V-set).
Pharmaceutics 2017, 9, 7 7 of 13
Figure 3. Regression plot for clindamycin concentration predicted by the model versus the known values in the calibration drug–alginate mixtures. Blue color for calibration set (C-set), while red color for validation set (V-set).
Figure 4. Selection of appropriate number of partial least square (PLS) components for clindamycin-alginate calibration mixtures. Blue color for calibration set (C-set), while red color for validation set (V-set).
Figure 5. Regression plot for clindamycin concentration predicted by the model versus the known values in the calibration drug–chitosan mixtures. Blue color for calibration set (C-set), while red color for validation set (V-set).
Figure 4. Selection of appropriate number of partial least square (PLS) components for clindamycin-alginate calibration mixtures. Blue color for calibration set (C-set), while red color for validation set(V-set).
Pharmaceutics 2017, 9, 7 8 of 13
Pharmaceutics 2017, 9, 7 7 of 13
Figure 3. Regression plot for clindamycin concentration predicted by the model versus the known values in the calibration drug–alginate mixtures. Blue color for calibration set (C-set), while red color for validation set (V-set).
Figure 4. Selection of appropriate number of partial least square (PLS) components for clindamycin-alginate calibration mixtures. Blue color for calibration set (C-set), while red color for validation set (V-set).
Figure 5. Regression plot for clindamycin concentration predicted by the model versus the known values in the calibration drug–chitosan mixtures. Blue color for calibration set (C-set), while red color for validation set (V-set).
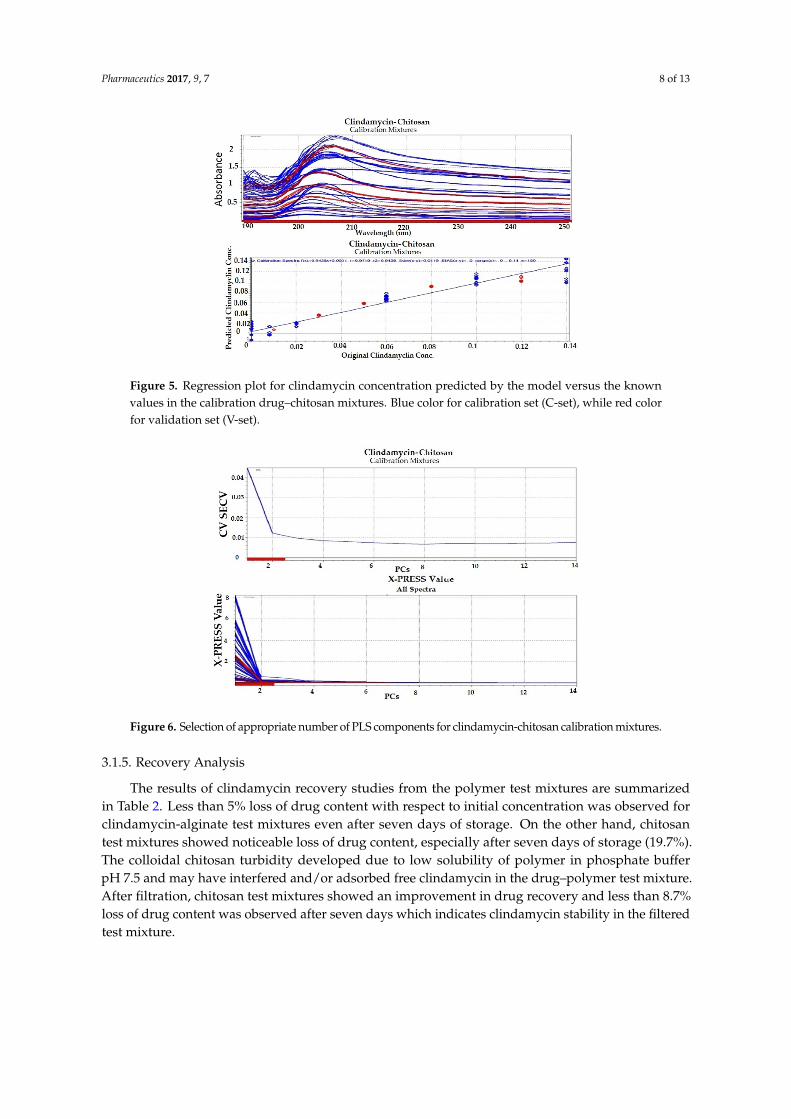
Figure 5. Regression plot for clindamycin concentration predicted by the model versus the knownvalues in the calibration drug–chitosan mixtures. Blue color for calibration set (C-set), while red colorfor validation set (V-set).Pharmaceutics 2017, 9, 7 8 of 13
Figure 6. Selection of appropriate number of PLS components for clindamycin-chitosan calibration mixtures.
Table 1. Statistical parameters from leave-one out cross validation (CV) of chemometric models for drug–polymer calibration mixtures in the range of 190–250 nm.
Model PCs RMSECV R2 Offset Bias Clindamycin-Alginate Calibration Mixtures 3 0.00284 0.996 −0.0000774 −0.0000338 Clindamycin-Chitosan Calibration Mixtures 2 0.01228 0.942 −0.0052874 −0.0013723
PCs: PLS Principal Components; RMSECV: Root mean square error of cross validation; R2: Calibration coefficient.
3.1.5. Recovery Analysis
The results of clindamycin recovery studies from the polymer test mixtures are summarized in Table 2. Less than 5% loss of drug content with respect to initial concentration was observed for clindamycin-alginate test mixtures even after seven days of storage. On the other hand, chitosan test mixtures showed noticeable loss of drug content, especially after seven days of storage (19.7%). The colloidal chitosan turbidity developed due to low solubility of polymer in phosphate buffer pH 7.5 and may have interfered and/or adsorbed free clindamycin in the drug–polymer test mixture. After filtration, chitosan test mixtures showed an improvement in drug recovery and less than 8.7% loss of drug content was observed after seven days which indicates clindamycin stability in the filtered test mixture.
Table 2. Recovery studies for clindamycin in (1:1) drug–polymer test mixtures.
Model
Clindamycin ConcentrationAverage Recovery (%) * ± (SD) **
Sample After 3 Days
After 7 Days
Clindamycin-AlginateCalibration Mixtures
Pure Clindamycin 99.1 ± 1.4 97.1 ± 0.6 Clindamycin-Alginate Test Mixtures 98.1 ± 2.9 95.4 ± 4.0
Clindamycin-Chitosan Calibration Mixtures
Pure Clindamycin 101.8 ± 1.5 100.6 ± 2.5 Clindamycin–Chitosan Test Mixtures 90.4 ± 3.0 81.3 ± 4.2
Clindamycin–Chitosan Test Mixtures after filtration 97.2 ± 2.1 91.3 ± 3.8 * In comparison with concentration at time zero; ** Average of duplicate samples with five concentrations.
Figure 6. Selection of appropriate number of PLS components for clindamycin-chitosan calibration mixtures.
3.1.5. Recovery Analysis
The results of clindamycin recovery studies from the polymer test mixtures are summarizedin Table 2. Less than 5% loss of drug content with respect to initial concentration was observed forclindamycin-alginate test mixtures even after seven days of storage. On the other hand, chitosantest mixtures showed noticeable loss of drug content, especially after seven days of storage (19.7%).The colloidal chitosan turbidity developed due to low solubility of polymer in phosphate bufferpH 7.5 and may have interfered and/or adsorbed free clindamycin in the drug–polymer test mixture.After filtration, chitosan test mixtures showed an improvement in drug recovery and less than 8.7%loss of drug content was observed after seven days which indicates clindamycin stability in the filteredtest mixture.
Pharmaceutics 2017, 9, 7 9 of 13
Table 2. Recovery studies for clindamycin in (1:1) drug–polymer test mixtures.
ModelClindamycin Concentration Average Recovery (%) * ± (SD) **
Sample After 3 Days After 7 Days
Clindamycin-AlginateCalibration Mixtures
Pure Clindamycin 99.1 ± 1.4 97.1 ± 0.6Clindamycin-Alginate Test Mixtures 98.1 ± 2.9 95.4 ± 4.0
Clindamycin-ChitosanCalibration Mixtures
Pure Clindamycin 101.8 ± 1.5 100.6 ± 2.5Clindamycin–Chitosan Test Mixtures 90.4 ± 3.0 81.3 ± 4.2
Clindamycin–Chitosan Test Mixtures after filtration 97.2 ± 2.1 91.3 ± 3.8
* In comparison with concentration at time zero; ** Average of duplicate samples with five concentrations.
3.2. Physico-Chemical Analysis
3.2.1. DSC Thermal Analysis and X-ray Diffraction
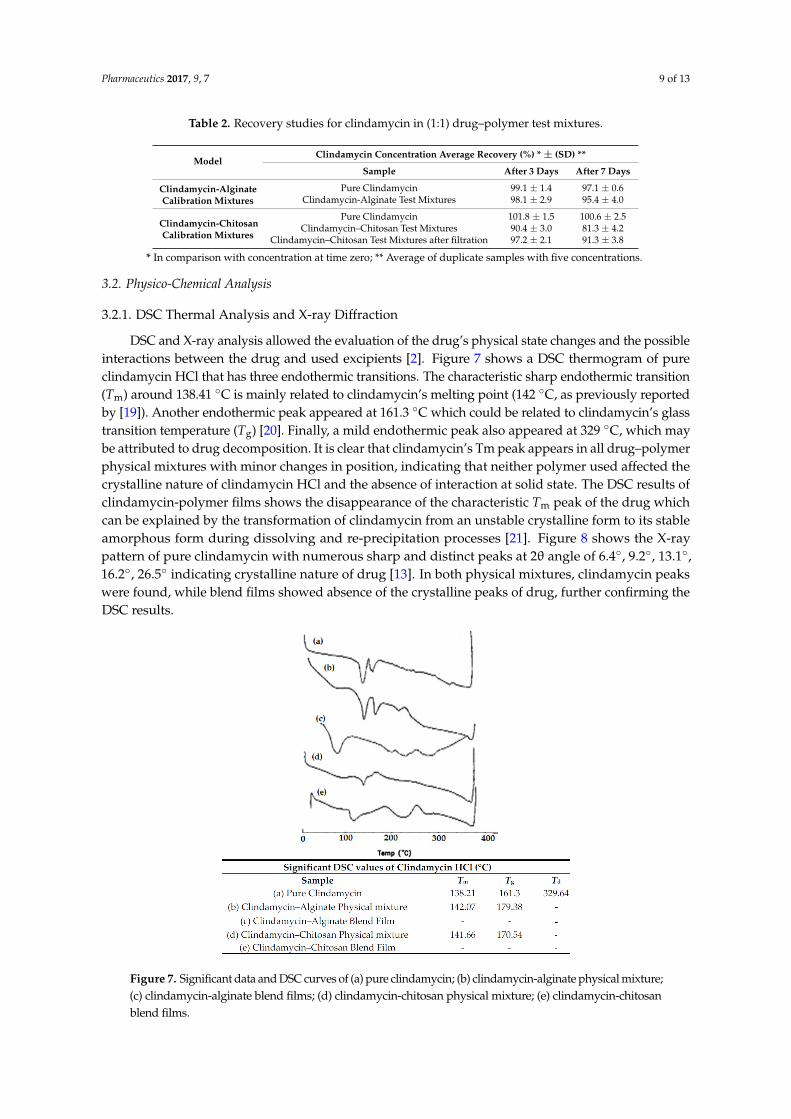
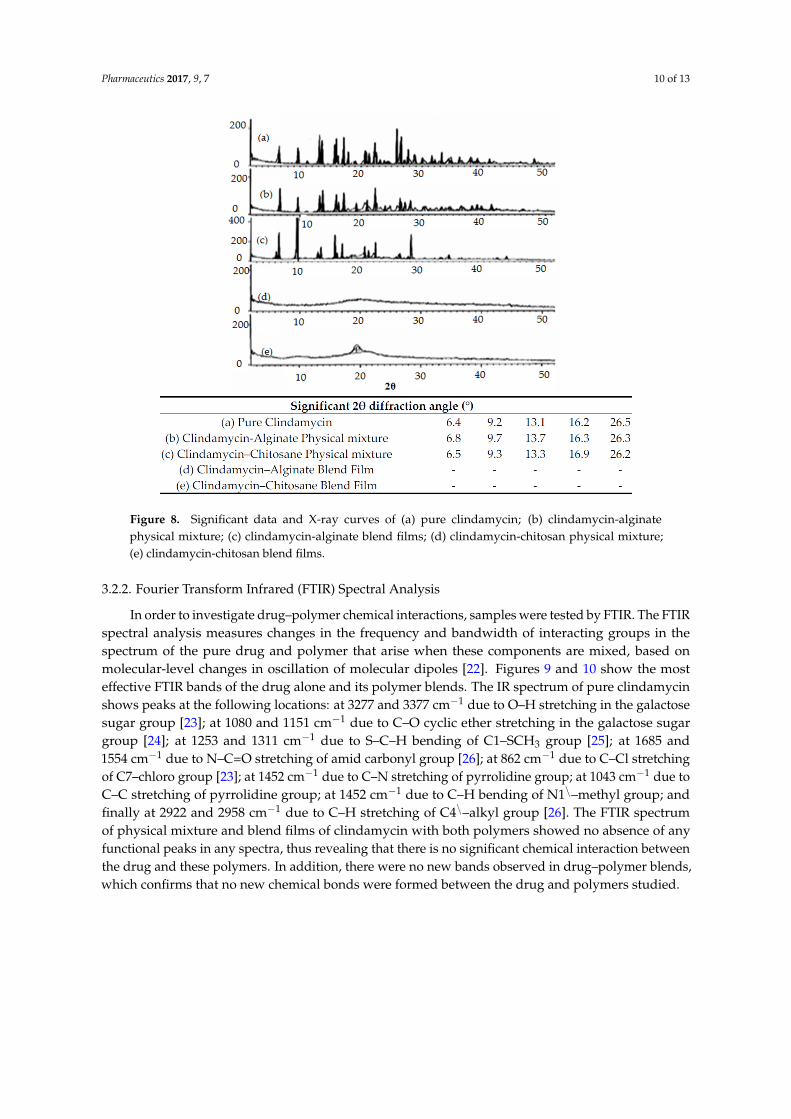
DSC and X-ray analysis allowed the evaluation of the drug’s physical state changes and the possibleinteractions between the drug and used excipients [2]. Figure 7 shows a DSC thermogram of pureclindamycin HCl that has three endothermic transitions. The characteristic sharp endothermic transition(Tm) around 138.41 ◦C is mainly related to clindamycin’s melting point (142 ◦C, as previously reportedby [19]). Another endothermic peak appeared at 161.3 ◦C which could be related to clindamycin’s glasstransition temperature (Tg) [20]. Finally, a mild endothermic peak also appeared at 329 ◦C, which maybe attributed to drug decomposition. It is clear that clindamycin’s Tm peak appears in all drug–polymerphysical mixtures with minor changes in position, indicating that neither polymer used affected thecrystalline nature of clindamycin HCl and the absence of interaction at solid state. The DSC results ofclindamycin-polymer films shows the disappearance of the characteristic Tm peak of the drug whichcan be explained by the transformation of clindamycin from an unstable crystalline form to its stableamorphous form during dissolving and re-precipitation processes [21]. Figure 8 shows the X-raypattern of pure clindamycin with numerous sharp and distinct peaks at 2θ angle of 6.4◦, 9.2◦, 13.1◦,16.2◦, 26.5◦ indicating crystalline nature of drug [13]. In both physical mixtures, clindamycin peakswere found, while blend films showed absence of the crystalline peaks of drug, further confirming theDSC results.
Pharmaceutics 2017, 9, 7 9 of 13
3.2. Physico-Chemical Analysis
3.2.1. DSC Thermal Analysis and X-Ray Diffraction
DSC and X-ray analysis allowed the evaluation of the drug’s physical state changes and the possible interactions between the drug and used excipients [2]. Figure 7 shows a DSC thermogram of pure clindamycin HCl that has three endothermic transitions. The characteristic sharp endothermic transition (Tm) around 138.41 °C is mainly related to clindamycin’s melting point (142 °C, as previously reported by [19]). Another endothermic peak appeared at 161.3 °C which could be related to clindamycin’s glass transition temperature (Tg) [20]. Finally, a mild endothermic peak also appeared at 329 °C, which may be attributed to drug decomposition. It is clear that clindamycin’s Tm peak appears in all drug–polymer physical mixtures with minor changes in position, indicating that neither polymer used affected the crystalline nature of clindamycin HCl and the absence of interaction at solid state. The DSC results of clindamycin-polymer films shows the disappearance of the characteristic Tm peak of the drug which can be explained by the transformation of clindamycin from an unstable crystalline form to its stable amorphous form during dissolving and re-precipitation processes [21]. Figure 8 shows the X-ray pattern of pure clindamycin with numerous sharp and distinct peaks at 2θ angle of 6.4°, 9.2°, 13.1°, 16.2°, 26.5° indicating crystalline nature of drug [13]. In both physical mixtures, clindamycin peaks were found, while blend films showed absence of the crystalline peaks of drug, further confirming the DSC results.
Figure 7. Significant data and DSC curves of (a) pure clindamycin; (b) clindamycin-alginate physical mixture; (c) clindamycin-alginate blend films; (d) clindamycin-chitosan physical mixture; (e) clindamycin-chitosan blend films.
Figure 7. Significant data and DSC curves of (a) pure clindamycin; (b) clindamycin-alginate physical mixture;(c) clindamycin-alginate blend films; (d) clindamycin-chitosan physical mixture; (e) clindamycin-chitosanblend films.
Pharmaceutics 2017, 9, 7 10 of 13Pharmaceutics 2017, 9, 7 10 of 13
Figure 8. Significant data and X-ray curves of (a) pure clindamycin; (b) clindamycin-alginate physical mixture; (c) clindamycin-alginate blend films; (d) clindamycin-chitosan physical mixture; (e) clindamycin-chitosan blend films.
3.2.2. Fourier Transform Infrared (FTIR) Spectral Analysis
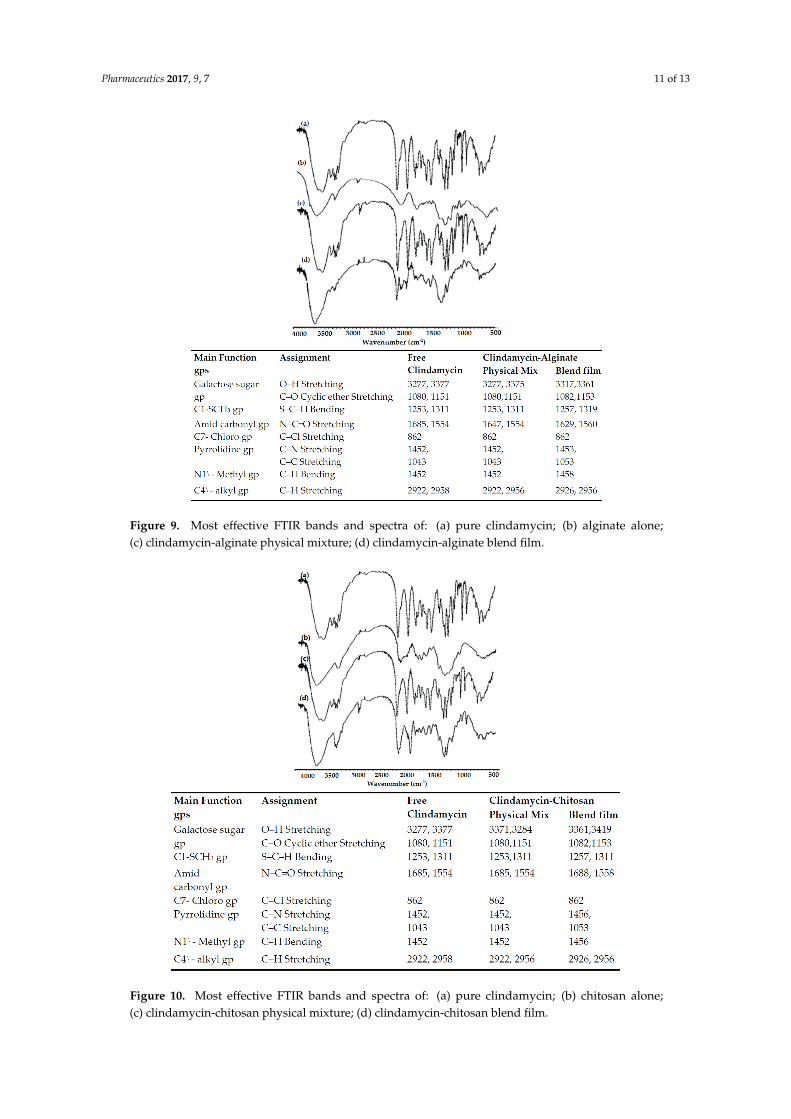
In order to investigate drug–polymer chemical interactions, samples were tested by FTIR. The FTIR spectral analysis measures changes in the frequency and bandwidth of interacting groups in the spectrum of the pure drug and polymer that arise when these components are mixed, based on molecular-level changes in oscillation of molecular dipoles [22]. Figures 9 and 10 show the most effective FTIR bands of the drug alone and its polymer blends. The IR spectrum of pure clindamycin shows peaks at the following locations: at 3277 and 3377 cm−1 due to O–H stretching in the galactose sugar group [23]; at 1080 and 1151 cm−1 due to C–O cyclic ether stretching in the galactose sugar group [24]; at 1253 and 1311 cm−1 due to S–C–H bending of C1–SCH3 group [25]; at 1685 and 1554 cm−1 due to N–C=O stretching of amid carbonyl group [26]; at 862 cm−1 due to C–Cl stretching of C7–chloro group [23]; at 1452 cm−1 due to C–N stretching of pyrrolidine group; at 1043 cm−1 due to C–C stretching of pyrrolidine group; at 1452 cm−1 due to C–H bending of N1\–methyl group; and finally at 2922 and 2958 cm−1 due to C–H stretching of C4\–alkyl group [26]. The FTIR spectrum of physical mixture and blend films of clindamycin with both polymers showed no absence of any functional peaks in any spectra, thus revealing that there is no significant chemical interaction between the drug and these polymers. In addition, there were no new bands observed in drug–polymer blends, which confirms that no new chemical bonds were formed between the drug and polymers studied.
Figure 8. Significant data and X-ray curves of (a) pure clindamycin; (b) clindamycin-alginatephysical mixture; (c) clindamycin-alginate blend films; (d) clindamycin-chitosan physical mixture;(e) clindamycin-chitosan blend films.
3.2.2. Fourier Transform Infrared (FTIR) Spectral Analysis
In order to investigate drug–polymer chemical interactions, samples were tested by FTIR. The FTIRspectral analysis measures changes in the frequency and bandwidth of interacting groups in thespectrum of the pure drug and polymer that arise when these components are mixed, based onmolecular-level changes in oscillation of molecular dipoles [22]. Figures 9 and 10 show the mosteffective FTIR bands of the drug alone and its polymer blends. The IR spectrum of pure clindamycinshows peaks at the following locations: at 3277 and 3377 cm−1 due to O–H stretching in the galactosesugar group [23]; at 1080 and 1151 cm−1 due to C–O cyclic ether stretching in the galactose sugargroup [24]; at 1253 and 1311 cm−1 due to S–C–H bending of C1–SCH3 group [25]; at 1685 and1554 cm−1 due to N–C=O stretching of amid carbonyl group [26]; at 862 cm−1 due to C–Cl stretchingof C7–chloro group [23]; at 1452 cm−1 due to C–N stretching of pyrrolidine group; at 1043 cm−1 due toC–C stretching of pyrrolidine group; at 1452 cm−1 due to C–H bending of N1\–methyl group; andfinally at 2922 and 2958 cm−1 due to C–H stretching of C4\–alkyl group [26]. The FTIR spectrumof physical mixture and blend films of clindamycin with both polymers showed no absence of anyfunctional peaks in any spectra, thus revealing that there is no significant chemical interaction betweenthe drug and these polymers. In addition, there were no new bands observed in drug–polymer blends,which confirms that no new chemical bonds were formed between the drug and polymers studied.
Pharmaceutics 2017, 9, 7 11 of 13Pharmaceutics 2017, 9, 7 11 of 13
Figure 9. Most effective FTIR bands and spectra of: (a) pure clindamycin; (b) alginate alone; (c) clindamycin-alginate physical mixture; (d) clindamycin-alginate blend film.
Figure 10. Most effective FTIR bands and spectra of: (a) pure clindamycin; (b) chitosan alone; (c) clindamycin-chitosan physical mixture; (d) clindamycin-chitosan blend film.
Figure 9. Most effective FTIR bands and spectra of: (a) pure clindamycin; (b) alginate alone;(c) clindamycin-alginate physical mixture; (d) clindamycin-alginate blend film.
Pharmaceutics 2017, 9, 7 11 of 13
Figure 9. Most effective FTIR bands and spectra of: (a) pure clindamycin; (b) alginate alone; (c) clindamycin-alginate physical mixture; (d) clindamycin-alginate blend film.
Figure 10. Most effective FTIR bands and spectra of: (a) pure clindamycin; (b) chitosan alone; (c) clindamycin-chitosan physical mixture; (d) clindamycin-chitosan blend film.
Figure 10. Most effective FTIR bands and spectra of: (a) pure clindamycin; (b) chitosan alone;(c) clindamycin-chitosan physical mixture; (d) clindamycin-chitosan blend film.
Pharmaceutics 2017, 9, 7 12 of 13
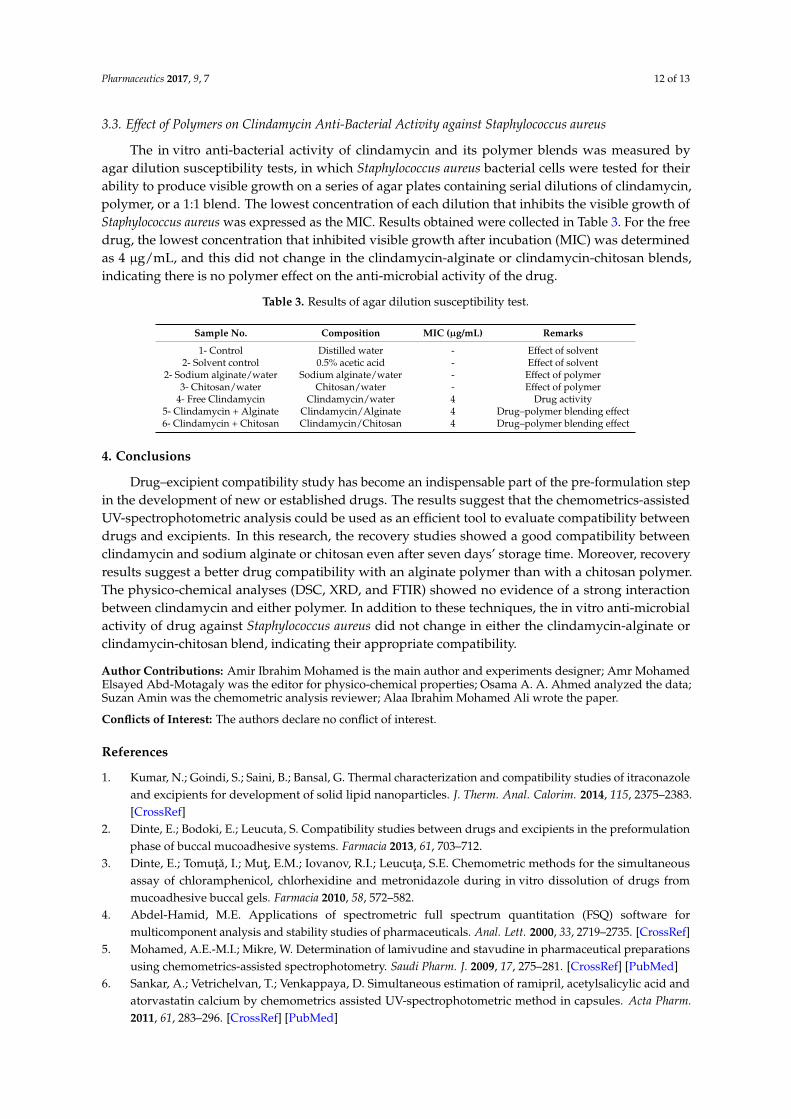
3.3. Effect of Polymers on Clindamycin Anti-Bacterial Activity against Staphylococcus aureus
The in vitro anti-bacterial activity of clindamycin and its polymer blends was measured byagar dilution susceptibility tests, in which Staphylococcus aureus bacterial cells were tested for theirability to produce visible growth on a series of agar plates containing serial dilutions of clindamycin,polymer, or a 1:1 blend. The lowest concentration of each dilution that inhibits the visible growth ofStaphylococcus aureus was expressed as the MIC. Results obtained were collected in Table 3. For the freedrug, the lowest concentration that inhibited visible growth after incubation (MIC) was determinedas 4 µg/mL, and this did not change in the clindamycin-alginate or clindamycin-chitosan blends,indicating there is no polymer effect on the anti-microbial activity of the drug.
Table 3. Results of agar dilution susceptibility test.
Sample No. Composition MIC (µg/mL) Remarks
1- Control Distilled water - Effect of solvent2- Solvent control 0.5% acetic acid - Effect of solvent
2- Sodium alginate/water Sodium alginate/water - Effect of polymer3- Chitosan/water Chitosan/water - Effect of polymer
4- Free Clindamycin Clindamycin/water 4 Drug activity5- Clindamycin + Alginate Clindamycin/Alginate 4 Drug–polymer blending effect6- Clindamycin + Chitosan Clindamycin/Chitosan 4 Drug–polymer blending effect
4. Conclusions
Drug–excipient compatibility study has become an indispensable part of the pre-formulation stepin the development of new or established drugs. The results suggest that the chemometrics-assistedUV-spectrophotometric analysis could be used as an efficient tool to evaluate compatibility betweendrugs and excipients. In this research, the recovery studies showed a good compatibility betweenclindamycin and sodium alginate or chitosan even after seven days’ storage time. Moreover, recoveryresults suggest a better drug compatibility with an alginate polymer than with a chitosan polymer.The physico-chemical analyses (DSC, XRD, and FTIR) showed no evidence of a strong interactionbetween clindamycin and either polymer. In addition to these techniques, the in vitro anti-microbialactivity of drug against Staphylococcus aureus did not change in either the clindamycin-alginate orclindamycin-chitosan blend, indicating their appropriate compatibility.
Author Contributions: Amir Ibrahim Mohamed is the main author and experiments designer; Amr MohamedElsayed Abd-Motagaly was the editor for physico-chemical properties; Osama A. A. Ahmed analyzed the data;Suzan Amin was the chemometric analysis reviewer; Alaa Ibrahim Mohamed Ali wrote the paper.
Conflicts of Interest: The authors declare no conflict of interest.
References
1. Kumar, N.; Goindi, S.; Saini, B.; Bansal, G. Thermal characterization and compatibility studies of itraconazoleand excipients for development of solid lipid nanoparticles. J. Therm. Anal. Calorim. 2014, 115, 2375–2383.[CrossRef]
2. Dinte, E.; Bodoki, E.; Leucuta, S. Compatibility studies between drugs and excipients in the preformulationphase of buccal mucoadhesive systems. Farmacia 2013, 61, 703–712.
3. Dinte, E.; Tomuta, I.; Mut, E.M.; Iovanov, R.I.; Leucuta, S.E. Chemometric methods for the simultaneousassay of chloramphenicol, chlorhexidine and metronidazole during in vitro dissolution of drugs frommucoadhesive buccal gels. Farmacia 2010, 58, 572–582.
4. Abdel-Hamid, M.E. Applications of spectrometric full spectrum quantitation (FSQ) software formulticomponent analysis and stability studies of pharmaceuticals. Anal. Lett. 2000, 33, 2719–2735. [CrossRef]
5. Mohamed, A.E.-M.I.; Mikre, W. Determination of lamivudine and stavudine in pharmaceutical preparationsusing chemometrics-assisted spectrophotometry. Saudi Pharm. J. 2009, 17, 275–281. [CrossRef] [PubMed]
6. Sankar, A.; Vetrichelvan, T.; Venkappaya, D. Simultaneous estimation of ramipril, acetylsalicylic acid andatorvastatin calcium by chemometrics assisted UV-spectrophotometric method in capsules. Acta Pharm.2011, 61, 283–296. [CrossRef] [PubMed]
Pharmaceutics 2017, 9, 7 13 of 13
7. Martelo-Vidal, M.; Vázquez, M. Classification of red wines from controlled designation of origin byultraviolet-visible and near-infrared spectral analysis. Ciênc. Téc. Vitivinic. 2014, 29, 35–43. [CrossRef]
8. Gomes, C.L.; Lima, A.C.A.; Cândido, M.C.L.; Silva, A.B.R.; Loiola, A.R.; Nascimento, R.F. MultivariateAnalysis of Perfumes by Ultraviolet Spectrophotometry. J. Braz. Chem. Soc. 2015, 26, 1730–1736. [CrossRef]
9. Terrile, A.E.; Marcheafave, G.; Oliveira, G.; Rakocevic, M.; Brunsd, R.; Scarminio, I. Chemometric analysisof UV characteristic profile and infrared fingerprint variations of Coffea arabica green beans under differentspace management treatments. J. Braz. Chem. Soc. 2016, 27, 1–10.
10. Sheraz, M.; Kazi, S.H.; Ahmed, S.; Qadeer, K.; Khan, M.F.; Ahmad, I. Multicomponent spectrometric analysisof riboflavin and photoproducts and their kinetic applications. Cent. Eur. J. Chem. 2014, 12, 635–642. [CrossRef]
11. Zhang, Y.; Xu, Q.A.; Trissel, L.A.; Williams, K.Y. Compatibility and stability of linezolid injection admixed withthree quinolone antibiotics. Ann. Pharmacother. 2000, 34, 996–1001. [CrossRef] [PubMed]
12. Bosso, J.A.; Townsend, R.J. Stability of clindamycin phosphate and ceftizoxime sodium, cefoxitin sodium,cefamandole nafate, or cefazolin sodium in two intravenous solutions. Am. J. Hosp. Pharm. 1985, 42, 2211–2214.[PubMed]
13. Kamble, M.S.; Mane, O.R.; Borwandkar, V.G.; Mane, S.S.; Chaudhari, P.D.; College, P.E.S.M. Formulationand evaluation of clindamycin HCL—Chitosan microspheres for dry powder inhaler formulation.Drug Invent. Today 2012, 4, 527–530.
14. Mohamed, A.I.; Ahmed, O.A.A.; Amin, S.; Elkadi, O.A.; Kassem, M.A. In vivo evaluation of clindamycinrelease from glyceryl monooleate-alginate microspheres by NIR spectroscopy. Int. J. Pharm. 2015, 494, 127–135.[CrossRef] [PubMed]
15. Nair, R.; Nyamweya, N.; G’onen, S.; Martínez-Miranda, L.J.; Hoag, S.W. Influence of various drugs on theglass transition temperature of poly(vinylpyrrolidone): A thermodynamic and spectroscopic investigation.Int. J. Pharm. 2001, 225, 83–96. [CrossRef]
16. Andrews, J.M. Determination of minimum inhibitory concentrations. J. Antimicrob. Chemother. 2001, 48(Suppl. S1), 5–16. [CrossRef] [PubMed]
17. De Luca, M.; Ioele, G.; Spatari, C.; Ragno, G. Optimization of wavelength range and data interval inchemometric analysis of complex pharmaceutical mixtures. J. Pharm. Anal. 2016, 6, 64–69. [CrossRef]
18. Chen, C.S.; Brown, C.W. A drug dissolution monitor employing multiple fiber optic probes and a UV/visiblediode array spectrophotometer. Pharm. Res. 1994, 11, 979–983. [CrossRef] [PubMed]
19. Johnson, M.L.; Uhrich, K.E. Concurrent release of admixed antimicrobials and salicylic acid fromsalicylate-based poly(anhydride-esters). J. Biomed. Mater. Res. A 2009, 91, 671–678. [CrossRef] [PubMed]
20. Daihom, B.; Alayoubi, A.; Ma, D.; Wang, L.; Mishra, S.; Helms, R.; Almoazen, H. Development and physicochemicalcharacterization of clindamycin resinate for taste masking in pediatrics. Drug Dev. Ind. Pharm. 2016. [CrossRef][PubMed]
21. Mostafavi, S.; Karkhane, R.; Riazi-Esfahani, M.; Dorkoosh, F.; Rafiee-Tehrani, M.; Tamaddon, L. Thermoanalyticalcharacterization of clindamycin-loaded intravitreal implants prepared by hot melt extrusion. Adv. Biomed. Res.2015, 4, 147. [CrossRef] [PubMed]
22. Qiao, M.; Chen, D.; Ma, X.; Liu, Y. Injectable biodegradable temperature-responsive PLGA-PEG-PLGAcopolymers: synthesis and effect of copolymer composition on the drug release from the copolymer-basedhydrogels. Int. J. Pharm. 2005, 294, 103–112. [CrossRef] [PubMed]
23. Brown, L.W.; Beyer, W.F. Clindamycin Hydrochloride. Anal. Profiles Drug Subst. 1981, 10, 75–91.24. Kacuráková, M. FT-IR study of plant cell wall model compounds: pectic polysaccharides and hemicelluloses.
Carbohydr. Polym. 2000, 43, 195–203. [CrossRef]25. Bergo, V.; Mamaev, S.; Olejnik, J.; Rothschild, K.J. Methionine changes in bacteriorhodopsin detected by FTIR
and cell-free selenomethionine substitution. Biophys. J. 2003, 84, 960–966. [CrossRef]26. Bharathi, C.; Jayaram, P.; Raj, J.S.; Kumar, M.S.; Bhargavi, V.; Handa, V.K.; Dandalaa, R.; Naidub, A.
Identification, isolation and characterization of impurities of clindamycin palmitate hydrochloride. J. Pharm.Biomed. Anal. 2008, 48, 1211–1218. [CrossRef] [PubMed]
© 2017 by the authors; licensee MDPI, Basel, Switzerland. This article is an open accessarticle distributed under the terms and conditions of the Creative Commons Attribution(CC-BY) license (http://creativecommons.org/licenses/by/4.0/).