Embed Size (px)
Citation preview
Io
LC
a
ARRAA
KPDZE
1
fwapSiphKyiat2idca
0d
Biosensors and Bioelectronics 35 (2012) 180– 185
Contents lists available at SciVerse ScienceDirect
Biosensors and Bioelectronics
jou rn al h om epa ge: www.elsev ier .com/ locate /b ios
nvestigation of DNA damage treated with perfluorooctane sulfonate (PFOS)n ZrO2/DDAB active nano-order film
iping Lu ∗, Laihui Xu, Tianfang Kang, Shuiyuan Chengollege of Environmental and Energy Engineering, Beijing University of Technology, Beijing 100124, China
r t i c l e i n f o
rticle history:eceived 12 December 2011eceived in revised form 8 February 2012ccepted 20 February 2012vailable online 7 March 2012
eywords:FOSNA damagerO2
a b s t r a c t
The interactions between DNA and small molecules with planar heterocyclic structure were indicated inprevious researches. This study investigated the interactions between PFOS with linear chain structureand DNA. A new phenomenon of DNA damage due to PFOS using electrochemistry technique was proved.The data was obtained on a modified glassy carbon electrode, on which didodecyldimethylammoniumbromide (DDAB), ZrO2 and calf thymus DNA were immobilized layer-by-layer. Electrochemical responseof DNA damage caused by PFOS was detected by differential pulse voltammetry (DPV) using methyleneblue (MB) as electro-active indicator. The current of MB attenuated obviously after DNA/ZrO2/DDAB/GCEwere incubated in PFOS. The shift of MB reduction peak potential indicates that PFOS is bound withDNA in groove probably by the first step of hydrophobic interaction and then the second step of inter-
lectrochemical calation into the base of DNA. X-ray photoelectron spectroscopic (XPS) was used to elucidate in detailthe intercalation of PFOS into DNA and the formation of hydrogen bond between PFOS and DNA base.Electrochemical quartz crystal microbalance (EQCM) proved the formation of adducts of DNA and PFOS.Moreover, electrochemical impedance spectroscopy (EIS) indicates that the PFOS influence DNA struc-ture and attenuate DNA charge transport. These results demonstrate that PFOS intercalated into DNA doinduce DNA base damage.
. Introduction
Perfluorinated compounds (PFCs), like perfluorooctane sul-onate (PFOS) and perfluorooctanoic acid (PFOA) in particular,hich are widely used in textiles, leathers, lubricants, electronic
nd photographic devices and foam fire extinguishers, have beenolluting the global ecosystem in various ways (Giesy et al., 2002;ohlenius et al., 1994). The high-energy carbon fluorine bondsn PFCs, which make PFCs have a high degree of environmentalersistence and bio-accummulation, are strong enough to resistydrolysis, photolysis, biodegradation and metabolism (Giesy andannan, 2001; Butenhoff et al., 2006; Fromme et al., 2007). In recentears, much attention has been focused on understanding their tox-cology. Several researches have shown that PFCs are well absorbedfter oral uptake and are primarily found by biological methods inhe liver, plasma, and kidney (Midasch et al., 2006; Apelberg et al.,007; So et al., 2006). The analyses in our research via electrochem-
stry, UV–vis and XPS technology indicate that PFOS do induce DNA
amage, quite contrary to the findings of Tsuda et al. who con-luded that PFOA rather than PFOS shows DNA damage by cometssay (Kawamoto et al., 2010). Therefore, apart from biological∗ Corresponding author. Tel.: +86 10 6739 1659; fax: +86 10 6739 1983.E-mail address: [email protected] (L. Lu).
956-5663/$ – see front matter © 2012 Elsevier B.V. All rights reserved.oi:10.1016/j.bios.2012.02.043
© 2012 Elsevier B.V. All rights reserved.
methods, more methods on molecular level are needed to furtherstudy the interaction mechanism between PFOS and DNA. The aimof the present study is to find the interaction sites between DNAand PFOS. By low cost electrochemical sensors with sensitivity andselectivity, the study was a pilot study to develop valid analyticalmethods for the toxic mechanisms on molecular level via a simpleavenue (Boal and Barton, 2005).
Before the investigation of DNA damage by electrochemicalindicator MB, it is important to have a clear understanding of theinteraction between DNA and MB. MB is a heterocyclic aromaticorganic dye that prefers to bind beside GC base pairs of DNA viaintercalation. It was reported that the interacting between ct-DNAwith 42% GC base pairs also used in this study and MB presentsintercalation binding type at low ionic strength (Kelley and Barton,1997; Tuite and Norden, 1994).
DDAB, a simple artificial cationic lipid, was widely used in thestudies of bio-membrane models. Resembling those lipid mem-branes in living cells, DDAB can form multiple bilayer films bycasting its solution onto electrodes (Rusling and Nassar, 1993), andthe produced multiple bilayer can act as a membrane to be usedpotentially as controller of permeability and electrochemical reac-
tions (Li et al., 2003). Zirconia is a non-toxic inorganic oxide withthermal stability, chemical inertness (Fang et al., 1997). ZrO2 hasbeen prepared as DNA probe for its strong affinity with phosphategroup (Liu et al., 2002). In this study, we present a well recognition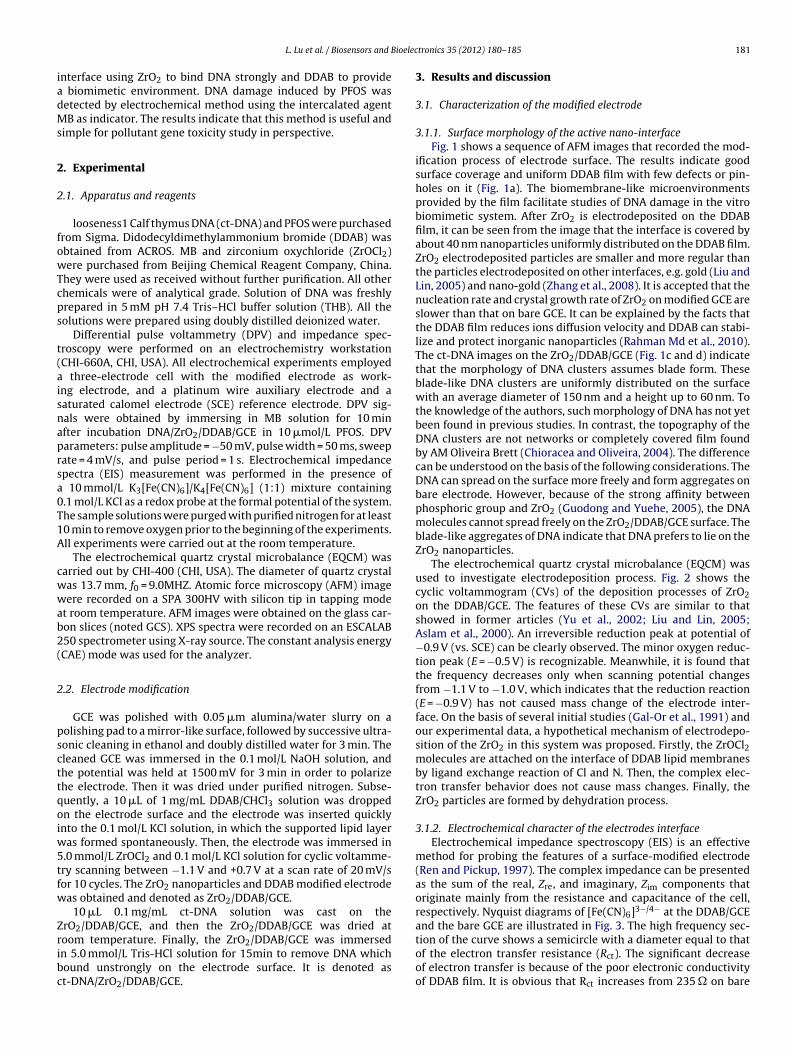
ioelec
iadMs
2
2
fowTcps
t(aisnaprsa0T1A
cwwab2(
2
pscttqoiw5tfw
Zribc
L. Lu et al. / Biosensors and B
nterface using ZrO2 to bind DNA strongly and DDAB to provide biomimetic environment. DNA damage induced by PFOS wasetected by electrochemical method using the intercalated agentB as indicator. The results indicate that this method is useful and
imple for pollutant gene toxicity study in perspective.
. Experimental
.1. Apparatus and reagents
looseness1 Calf thymus DNA (ct-DNA) and PFOS were purchasedrom Sigma. Didodecyldimethylammonium bromide (DDAB) wasbtained from ACROS. MB and zirconium oxychloride (ZrOCl2)ere purchased from Beijing Chemical Reagent Company, China.
hey were used as received without further purification. All otherhemicals were of analytical grade. Solution of DNA was freshlyrepared in 5 mM pH 7.4 Tris–HCl buffer solution (THB). All theolutions were prepared using doubly distilled deionized water.
Differential pulse voltammetry (DPV) and impedance spec-roscopy were performed on an electrochemistry workstationCHI-660A, CHI, USA). All electrochemical experiments employed
three-electrode cell with the modified electrode as work-ng electrode, and a platinum wire auxiliary electrode and aaturated calomel electrode (SCE) reference electrode. DPV sig-als were obtained by immersing in MB solution for 10 minfter incubation DNA/ZrO2/DDAB/GCE in 10 �mol/L PFOS. DPVarameters: pulse amplitude = −50 mV, pulse width = 50 ms, sweepate = 4 mV/s, and pulse period = 1 s. Electrochemical impedancepectra (EIS) measurement was performed in the presence of
10 mmol/L K3[Fe(CN)6]/K4[Fe(CN)6] (1:1) mixture containing.1 mol/L KCl as a redox probe at the formal potential of the system.he sample solutions were purged with purified nitrogen for at least0 min to remove oxygen prior to the beginning of the experiments.ll experiments were carried out at the room temperature.
The electrochemical quartz crystal microbalance (EQCM) wasarried out by CHI-400 (CHI, USA). The diameter of quartz crystalas 13.7 mm, f0 = 9.0MHZ. Atomic force microscopy (AFM) imageere recorded on a SPA 300HV with silicon tip in tapping mode
t room temperature. AFM images were obtained on the glass car-on slices (noted GCS). XPS spectra were recorded on an ESCALAB50 spectrometer using X-ray source. The constant analysis energyCAE) mode was used for the analyzer.
.2. Electrode modification
GCE was polished with 0.05 �m alumina/water slurry on aolishing pad to a mirror-like surface, followed by successive ultra-onic cleaning in ethanol and doubly distilled water for 3 min. Theleaned GCE was immersed in the 0.1 mol/L NaOH solution, andhe potential was held at 1500 mV for 3 min in order to polarizehe electrode. Then it was dried under purified nitrogen. Subse-uently, a 10 �L of 1 mg/mL DDAB/CHCl3 solution was droppedn the electrode surface and the electrode was inserted quicklynto the 0.1 mol/L KCl solution, in which the supported lipid layer
as formed spontaneously. Then, the electrode was immersed in.0 mmol/L ZrOCl2 and 0.1 mol/L KCl solution for cyclic voltamme-ry scanning between −1.1 V and +0.7 V at a scan rate of 20 mV/sor 10 cycles. The ZrO2 nanoparticles and DDAB modified electrodeas obtained and denoted as ZrO2/DDAB/GCE.
10 �L 0.1 mg/mL ct-DNA solution was cast on the
rO2/DDAB/GCE, and then the ZrO2/DDAB/GCE was dried atoom temperature. Finally, the ZrO2/DDAB/GCE was immersedn 5.0 mmol/L Tris-HCl solution for 15min to remove DNA whichound unstrongly on the electrode surface. It is denoted ast-DNA/ZrO2/DDAB/GCE.tronics 35 (2012) 180– 185 181
3. Results and discussion
3.1. Characterization of the modified electrode
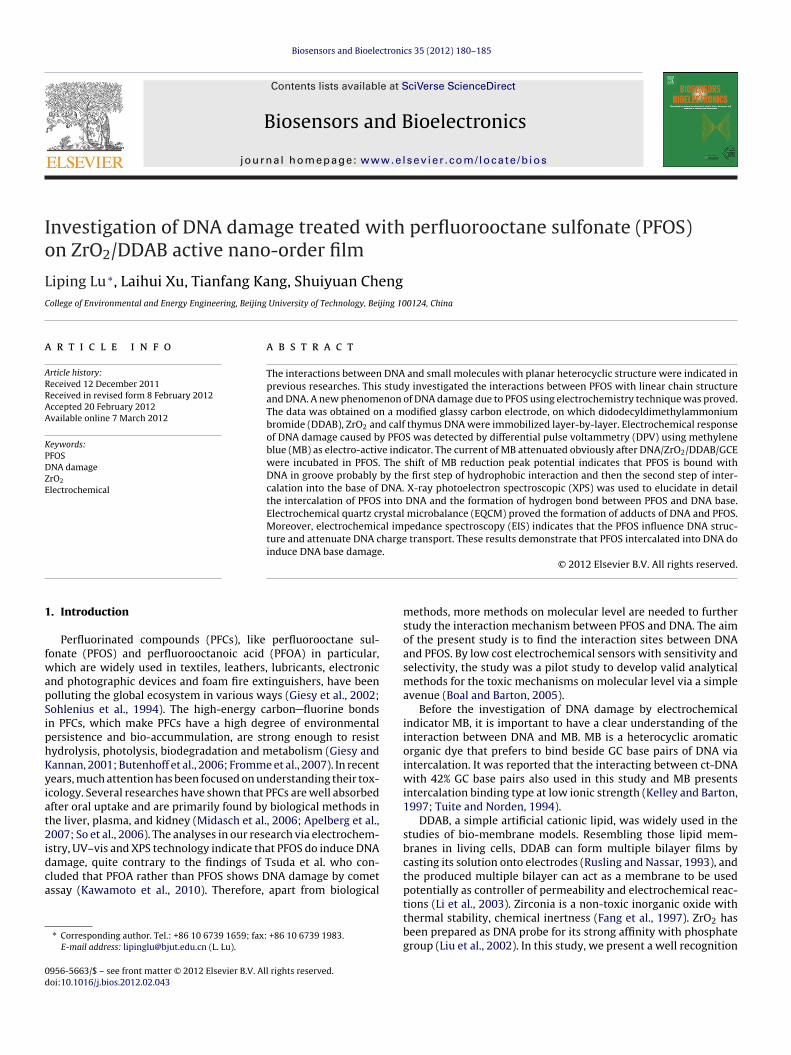
3.1.1. Surface morphology of the active nano-interfaceFig. 1 shows a sequence of AFM images that recorded the mod-
ification process of electrode surface. The results indicate goodsurface coverage and uniform DDAB film with few defects or pin-holes on it (Fig. 1a). The biomembrane-like microenvironmentsprovided by the film facilitate studies of DNA damage in the vitrobiomimetic system. After ZrO2 is electrodeposited on the DDABfilm, it can be seen from the image that the interface is covered byabout 40 nm nanoparticles uniformly distributed on the DDAB film.ZrO2 electrodeposited particles are smaller and more regular thanthe particles electrodeposited on other interfaces, e.g. gold (Liu andLin, 2005) and nano-gold (Zhang et al., 2008). It is accepted that thenucleation rate and crystal growth rate of ZrO2 on modified GCE areslower than that on bare GCE. It can be explained by the facts thatthe DDAB film reduces ions diffusion velocity and DDAB can stabi-lize and protect inorganic nanoparticles (Rahman Md et al., 2010).The ct-DNA images on the ZrO2/DDAB/GCE (Fig. 1c and d) indicatethat the morphology of DNA clusters assumes blade form. Theseblade-like DNA clusters are uniformly distributed on the surfacewith an average diameter of 150 nm and a height up to 60 nm. Tothe knowledge of the authors, such morphology of DNA has not yetbeen found in previous studies. In contrast, the topography of theDNA clusters are not networks or completely covered film foundby AM Oliveira Brett (Chioracea and Oliveira, 2004). The differencecan be understood on the basis of the following considerations. TheDNA can spread on the surface more freely and form aggregates onbare electrode. However, because of the strong affinity betweenphosphoric group and ZrO2 (Guodong and Yuehe, 2005), the DNAmolecules cannot spread freely on the ZrO2/DDAB/GCE surface. Theblade-like aggregates of DNA indicate that DNA prefers to lie on theZrO2 nanoparticles.
The electrochemical quartz crystal microbalance (EQCM) wasused to investigate electrodeposition process. Fig. 2 shows thecyclic voltammogram (CVs) of the deposition processes of ZrO2on the DDAB/GCE. The features of these CVs are similar to thatshowed in former articles (Yu et al., 2002; Liu and Lin, 2005;Aslam et al., 2000). An irreversible reduction peak at potential of−0.9 V (vs. SCE) can be clearly observed. The minor oxygen reduc-tion peak (E = −0.5 V) is recognizable. Meanwhile, it is found thatthe frequency decreases only when scanning potential changesfrom −1.1 V to −1.0 V, which indicates that the reduction reaction(E = −0.9 V) has not caused mass change of the electrode inter-face. On the basis of several initial studies (Gal-Or et al., 1991) andour experimental data, a hypothetical mechanism of electrodepo-sition of the ZrO2 in this system was proposed. Firstly, the ZrOCl2molecules are attached on the interface of DDAB lipid membranesby ligand exchange reaction of Cl and N. Then, the complex elec-tron transfer behavior does not cause mass changes. Finally, theZrO2 particles are formed by dehydration process.
3.1.2. Electrochemical character of the electrodes interfaceElectrochemical impedance spectroscopy (EIS) is an effective
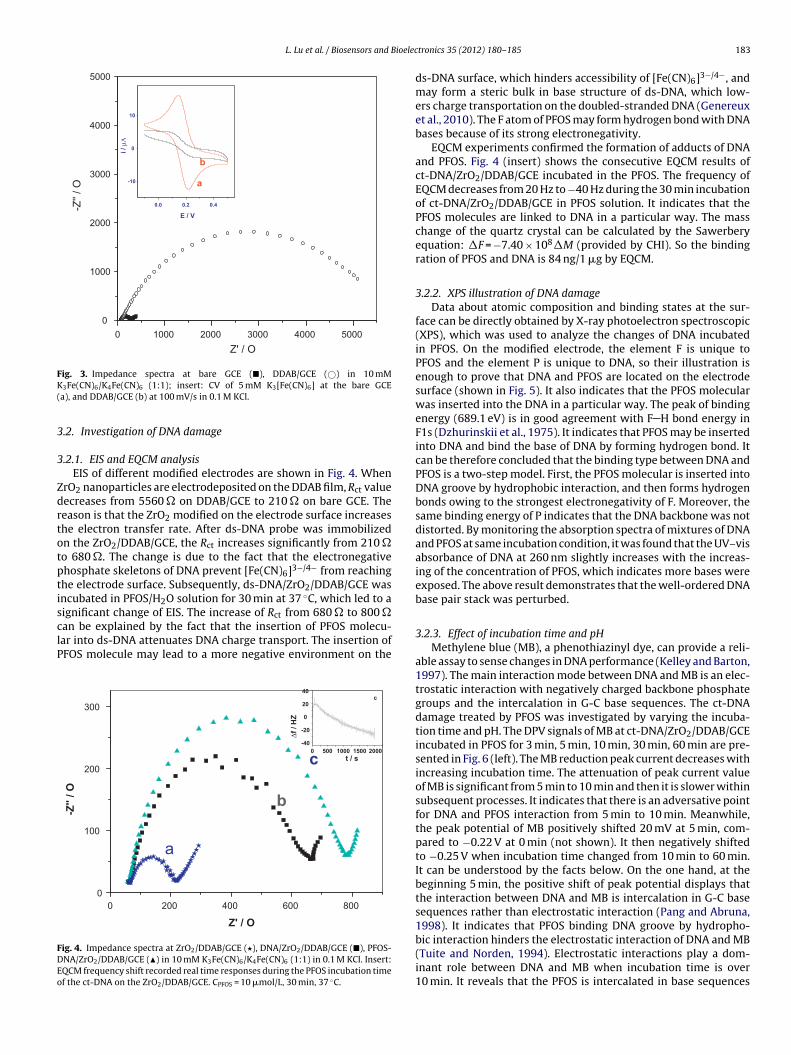
method for probing the features of a surface-modified electrode(Ren and Pickup, 1997). The complex impedance can be presentedas the sum of the real, Zre, and imaginary, Zim components thatoriginate mainly from the resistance and capacitance of the cell,respectively. Nyquist diagrams of [Fe(CN)6]3−/4− at the DDAB/GCEand the bare GCE are illustrated in Fig. 3. The high frequency sec-
tion of the curve shows a semicircle with a diameter equal to thatof the electron transfer resistance (Rct). The significant decreaseof electron transfer is because of the poor electronic conductivityof DDAB film. It is obvious that Rct increases from 235 � on bare
182 L. Lu et al. / Biosensors and Bioelectronics 35 (2012) 180– 185
rO2 on
Grsapi
F5
Fig. 1. AFM image, (a): DDAB layer on the GCS; (b): nano-Z
CE to 5560 � on DDAB/GCE. Meanwhile, the cyclic voltammet-ic responses of the bare GCE and DDAB/GCE in 5 mM K3[Fe(CN)6]
olution containing 0.1 M KCl show the same results(insert). Themperometric response of the electrode decreases and the peak-to-eak separation between cathodic and anodic waves of K3[Fe(CN)6]ncreases, which can be explained by the fact that DDAB film
0.50.0-0.5-1.0
0.0
0.2
0.4
0.6
i / m
A
E / V
a b
ig. 2. Cyclic voltammograms (left) and electrochemical quartz crystal microbalance (rig mmol/L; CKCl: 0.1 mol/L; scan rate: 20 mV/s, 10 cycles).
the DDAB/GCS; (c and d): ct-DNA on the ZrO2/DDAB/GCS.
prevents the electron transfer of Fe(CN)63+ on the surface of elec-
trode. Thereby, it is confirmed that the lipid membrane has been
successfully formed on the surface. Moreover, the well-orderedlayer of DDAB film was also identified by small angle X-ray diffrac-tion (XRD) (not shown). The high Bragg diffraction peak indicatesthe DDAB film is uniform (Gong and Lin, 2003).0.50.0-0.5-1.0-80 00
-60 00
-40 00
-20 00
0
Δ f /
HZ
E / V
ht) of a glass carbon electrode modified with DDAB in the ZrOCl2 solution (CZrOCl2 :
L. Lu et al. / Biosensors and Bioelec
5000400030002000100000
1000
2000
3000
4000
5000-Z
'' / O
Z' / O
0.40.20.0
-10
0
10i /
μΑ
E / V
a
b
FK(
3
3
ZdrtotptisclP
FDEo
ig. 3. Impedance spectra at bare GCE (�), DDAB/GCE (©) in 10 mM3Fe(CN)6/K4Fe(CN)6 (1:1); insert: CV of 5 mM K3[Fe(CN)6] at the bare GCE
a), and DDAB/GCE (b) at 100 mV/s in 0.1 M KCl.
.2. Investigation of DNA damage
.2.1. EIS and EQCM analysisEIS of different modified electrodes are shown in Fig. 4. When
rO2 nanoparticles are electrodeposited on the DDAB film, Rct valueecreases from 5560 � on DDAB/GCE to 210 � on bare GCE. Theeason is that the ZrO2 modified on the electrode surface increaseshe electron transfer rate. After ds-DNA probe was immobilizedn the ZrO2/DDAB/GCE, the Rct increases significantly from 210 �o 680 �. The change is due to the fact that the electronegativehosphate skeletons of DNA prevent [Fe(CN)6]3−/4− from reachinghe electrode surface. Subsequently, ds-DNA/ZrO2/DDAB/GCE wasncubated in PFOS/H2O solution for 30 min at 37 ◦C, which led to aignificant change of EIS. The increase of Rct from 680 � to 800 �
an be explained by the fact that the insertion of PFOS molecu-ar into ds-DNA attenuates DNA charge transport. The insertion ofFOS molecule may lead to a more negative environment on the80060040020000
100
200
300
-Z''
/ O
Z' / O
a
b
c2000150010005000
-40
-20
0
20
40
Δf /
HZ
t / s
c
ig. 4. Impedance spectra at ZrO2/DDAB/GCE (�), DNA/ZrO2/DDAB/GCE (�), PFOS-NA/ZrO2/DDAB/GCE (�) in 10 mM K3Fe(CN)6/K4Fe(CN)6 (1:1) in 0.1 M KCl. Insert:QCM frequency shift recorded real time responses during the PFOS incubation timef the ct-DNA on the ZrO2/DDAB/GCE. CPFOS = 10 �mol/L, 30 min, 37 ◦C.
tronics 35 (2012) 180– 185 183
ds-DNA surface, which hinders accessibility of [Fe(CN)6]3−/4−, andmay form a steric bulk in base structure of ds-DNA, which low-ers charge transportation on the doubled-stranded DNA (Genereuxet al., 2010). The F atom of PFOS may form hydrogen bond with DNAbases because of its strong electronegativity.
EQCM experiments confirmed the formation of adducts of DNAand PFOS. Fig. 4 (insert) shows the consecutive EQCM results ofct-DNA/ZrO2/DDAB/GCE incubated in the PFOS. The frequency ofEQCM decreases from 20 Hz to −40 Hz during the 30 min incubationof ct-DNA/ZrO2/DDAB/GCE in PFOS solution. It indicates that thePFOS molecules are linked to DNA in a particular way. The masschange of the quartz crystal can be calculated by the Sawerberyequation: �F = −7.40 × 10⁸�M (provided by CHI). So the bindingration of PFOS and DNA is 84 ng/1 �g by EQCM.
3.2.2. XPS illustration of DNA damageData about atomic composition and binding states at the sur-
face can be directly obtained by X-ray photoelectron spectroscopic(XPS), which was used to analyze the changes of DNA incubatedin PFOS. On the modified electrode, the element F is unique toPFOS and the element P is unique to DNA, so their illustration isenough to prove that DNA and PFOS are located on the electrodesurface (shown in Fig. 5). It also indicates that the PFOS molecularwas inserted into the DNA in a particular way. The peak of bindingenergy (689.1 eV) is in good agreement with F H bond energy inF1s (Dzhurinskii et al., 1975). It indicates that PFOS may be insertedinto DNA and bind the base of DNA by forming hydrogen bond. Itcan be therefore concluded that the binding type between DNA andPFOS is a two-step model. First, the PFOS molecular is inserted intoDNA groove by hydrophobic interaction, and then forms hydrogenbonds owing to the strongest electronegativity of F. Moreover, thesame binding energy of P indicates that the DNA backbone was notdistorted. By monitoring the absorption spectra of mixtures of DNAand PFOS at same incubation condition, it was found that the UV–visabsorbance of DNA at 260 nm slightly increases with the increas-ing of the concentration of PFOS, which indicates more bases wereexposed. The above result demonstrates that the well-ordered DNAbase pair stack was perturbed.
3.2.3. Effect of incubation time and pHMethylene blue (MB), a phenothiazinyl dye, can provide a reli-
able assay to sense changes in DNA performance (Kelley and Barton,1997). The main interaction mode between DNA and MB is an elec-trostatic interaction with negatively charged backbone phosphategroups and the intercalation in G-C base sequences. The ct-DNAdamage treated by PFOS was investigated by varying the incuba-tion time and pH. The DPV signals of MB at ct-DNA/ZrO2/DDAB/GCEincubated in PFOS for 3 min, 5 min, 10 min, 30 min, 60 min are pre-sented in Fig. 6 (left). The MB reduction peak current decreases withincreasing incubation time. The attenuation of peak current valueof MB is significant from 5 min to 10 min and then it is slower withinsubsequent processes. It indicates that there is an adversative pointfor DNA and PFOS interaction from 5 min to 10 min. Meanwhile,the peak potential of MB positively shifted 20 mV at 5 min, com-pared to −0.22 V at 0 min (not shown). It then negatively shiftedto −0.25 V when incubation time changed from 10 min to 60 min.It can be understood by the facts below. On the one hand, at thebeginning 5 min, the positive shift of peak potential displays thatthe interaction between DNA and MB is intercalation in G-C basesequences rather than electrostatic interaction (Pang and Abruna,1998). It indicates that PFOS binding DNA groove by hydropho-
bic interaction hinders the electrostatic interaction of DNA and MB(Tuite and Norden, 1994). Electrostatic interactions play a dom-inant role between DNA and MB when incubation time is over10 min. It reveals that the PFOS is intercalated in base sequences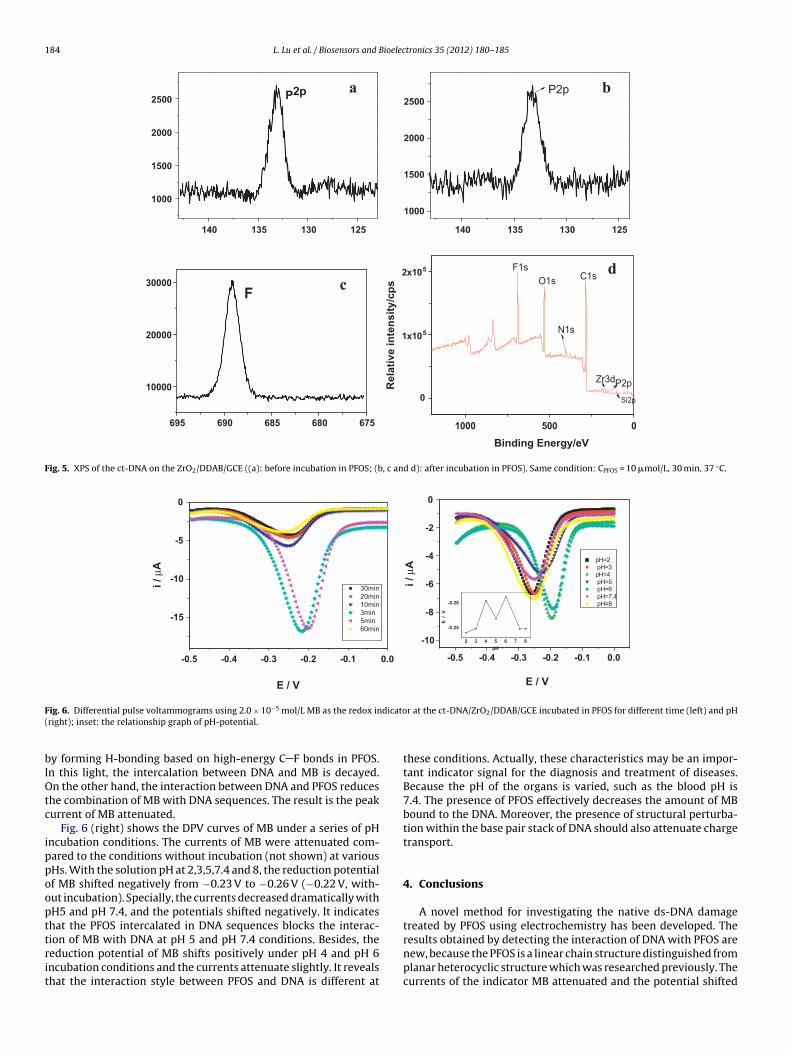
184 L. Lu et al. / Biosensors and Bioelectronics 35 (2012) 180– 185
125130135140
1000
1500
2000
2500 P2p
125130135140
1000
1500
2000
2500P2p
675680685690695
10000
20000
30000F
05001000
0
1x10⁵
2x10⁵
Rel
ativ
e in
tens
ity/c
ps
Binding Energy/eV
F1sC1sO1s
P2pSi2p
Zr3d
N1s
b a
cd
Fig. 5. XPS of the ct-DNA on the ZrO2/DDAB/GCE ((a): before incubation in PFOS; (b, c and d): after incubation in PFOS). Same condition: CPFOS = 10 �mol/L, 30 min, 37 ◦C.
0.0-0.1-0.2-0.3-0.4-0.5
-15
-10
-5
0
i / μ
A
E / V
30min 20min 10min 3min 5min 60min
0.0-0.1-0.2-0.3-0.4-0.5
-10
-8
-6
-4
-2
0
i / μ
A
E / V
pH=2 pH=3 pH=4 pH=5 pH=6 pH=7.4 pH=8
F dicato(
bIOtc
ippoopttrit
ig. 6. Differential pulse voltammograms using 2.0 × 10⁻⁵ mol/L MB as the redox inright); inset: the relationship graph of pH-potential.
y forming H-bonding based on high-energy C F bonds in PFOS.n this light, the intercalation between DNA and MB is decayed.n the other hand, the interaction between DNA and PFOS reduces
he combination of MB with DNA sequences. The result is the peakurrent of MB attenuated.
Fig. 6 (right) shows the DPV curves of MB under a series of pHncubation conditions. The currents of MB were attenuated com-ared to the conditions without incubation (not shown) at variousHs. With the solution pH at 2,3,5,7.4 and 8, the reduction potentialf MB shifted negatively from −0.23 V to −0.26 V (−0.22 V, with-ut incubation). Specially, the currents decreased dramatically withH5 and pH 7.4, and the potentials shifted negatively. It indicateshat the PFOS intercalated in DNA sequences blocks the interac-
ion of MB with DNA at pH 5 and pH 7.4 conditions. Besides, theeduction potential of MB shifts positively under pH 4 and pH 6ncubation conditions and the currents attenuate slightly. It revealshat the interaction style between PFOS and DNA is different atr at the ct-DNA/ZrO2/DDAB/GCE incubated in PFOS for different time (left) and pH
these conditions. Actually, these characteristics may be an impor-tant indicator signal for the diagnosis and treatment of diseases.Because the pH of the organs is varied, such as the blood pH is7.4. The presence of PFOS effectively decreases the amount of MBbound to the DNA. Moreover, the presence of structural perturba-tion within the base pair stack of DNA should also attenuate chargetransport.
4. Conclusions
A novel method for investigating the native ds-DNA damagetreated by PFOS using electrochemistry has been developed. The
results obtained by detecting the interaction of DNA with PFOS arenew, because the PFOS is a linear chain structure distinguished fromplanar heterocyclic structure which was researched previously. Thecurrents of the indicator MB attenuated and the potential shifted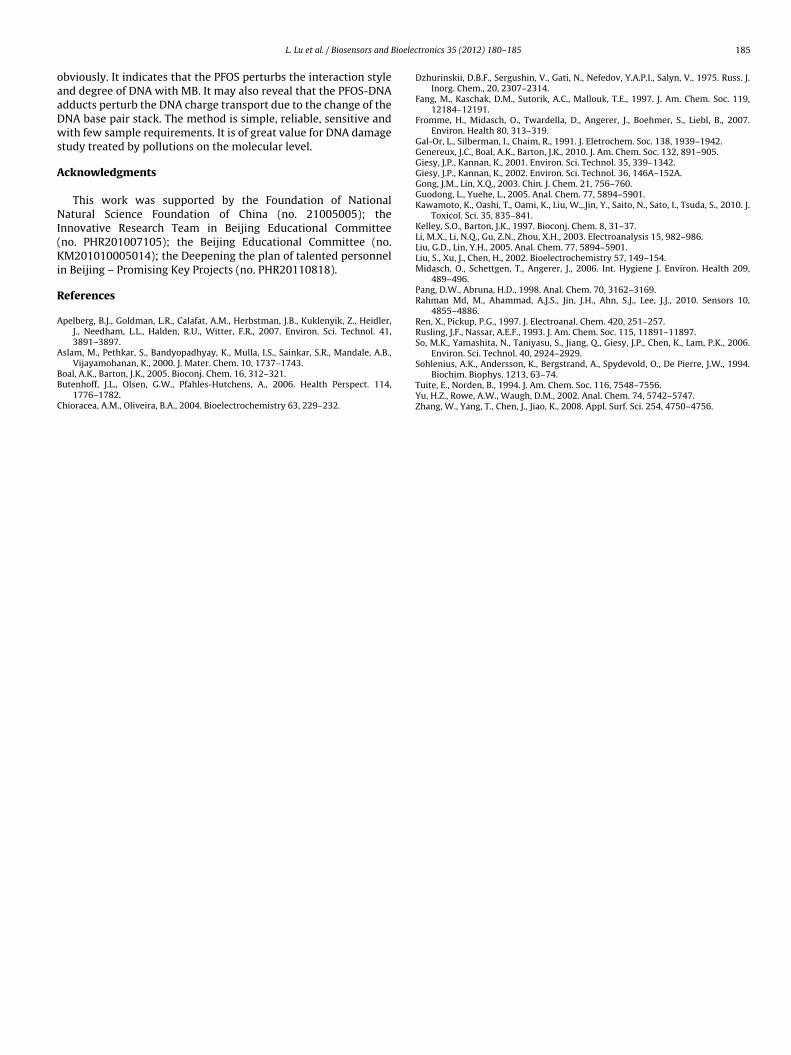
ioelec
oaaDws
A
NI(Ki
R
A
A
BB
C
L. Lu et al. / Biosensors and B
bviously. It indicates that the PFOS perturbs the interaction stylend degree of DNA with MB. It may also reveal that the PFOS-DNAdducts perturb the DNA charge transport due to the change of theNA base pair stack. The method is simple, reliable, sensitive andith few sample requirements. It is of great value for DNA damage
tudy treated by pollutions on the molecular level.
cknowledgments
This work was supported by the Foundation of Nationalatural Science Foundation of China (no. 21005005); the
nnovative Research Team in Beijing Educational Committeeno. PHR201007105); the Beijing Educational Committee (no.M201010005014); the Deepening the plan of talented personnel
n Beijing – Promising Key Projects (no. PHR20110818).
eferences
pelberg, B.J., Goldman, L.R., Calafat, A.M., Herbstman, J.B., Kuklenyik, Z., Heidler,J., Needham, L.L., Halden, R.U., Witter, F.R., 2007. Environ. Sci. Technol. 41,3891–3897.
slam, M., Pethkar, S., Bandyopadhyay, K., Mulla, I.S., Sainkar, S.R., Mandale, A.B.,
Vijayamohanan, K., 2000. J. Mater. Chem. 10, 1737–1743.oal, A.K., Barton, J.K., 2005. Bioconj. Chem. 16, 312–321.utenhoff, J.L., Olsen, G.W., Pfahles-Hutchens, A., 2006. Health Perspect. 114,
1776–1782.hioracea, A.M., Oliveira, B.A., 2004. Bioelectrochemistry 63, 229–232.
tronics 35 (2012) 180– 185 185
Dzhurinskii, D.B.F., Sergushin, V., Gati, N., Nefedov, Y.A.P.I., Salyn, V., 1975. Russ. J.Inorg. Chem., 20, 2307–2314.
Fang, M., Kaschak, D.M., Sutorik, A.C., Mallouk, T.E., 1997. J. Am. Chem. Soc. 119,12184–12191.
Fromme, H., Midasch, O., Twardella, D., Angerer, J., Boehmer, S., Liebl, B., 2007.Environ. Health 80, 313–319.
Gal-Or, L., Silberman, I., Chaim, R., 1991. J. Eletrochem. Soc. 138, 1939–1942.Genereux, J.C., Boal, A.K., Barton, J.K., 2010. J. Am. Chem. Soc. 132, 891–905.Giesy, J.P., Kannan, K., 2001. Environ. Sci. Technol. 35, 339–1342.Giesy, J.P., Kannan, K., 2002. Environ. Sci. Technol. 36, 146A–152A.Gong, J.M., Lin, X.Q., 2003. Chin. J. Chem. 21, 756–760.Guodong, L., Yuehe, L., 2005. Anal. Chem. 77, 5894–5901.Kawamoto, K., Oashi, T., Oami, K., Liu, W.,.Jin, Y., Saito, N., Sato, I., Tsuda, S., 2010. J.
Toxicol. Sci. 35, 835–841.Kelley, S.O., Barton, J.K., 1997. Bioconj. Chem. 8, 31–37.Li, M.X., Li, N.Q., Gu, Z.N., Zhou, X.H., 2003. Electroanalysis 15, 982–986.Liu, G.D., Lin, Y.H., 2005. Anal. Chem. 77, 5894–5901.Liu, S., Xu, J., Chen, H., 2002. Bioelectrochemistry 57, 149–154.Midasch, O., Schettgen, T., Angerer, J., 2006. Int. Hygiene J. Environ. Health 209,
489–496.Pang, D.W., Abruna, H.D., 1998. Anal. Chem. 70, 3162–3169.Rahman Md, M., Ahammad, A.J.S., Jin, J.H., Ahn, S.J., Lee, J.J., 2010. Sensors 10,
4855–4886.Ren, X., Pickup, P.G., 1997. J. Electroanal. Chem. 420, 251–257.Rusling, J.F., Nassar, A.E.F., 1993. J. Am. Chem. Soc. 115, 11891–11897.So, M.K., Yamashita, N., Taniyasu, S., Jiang, Q., Giesy, J.P., Chen, K., Lam, P.K., 2006.
Environ. Sci. Technol. 40, 2924–2929.
Sohlenius, A.K., Andersson, K., Bergstrand, A., Spydevold, O., De Pierre, J.W., 1994.Biochim. Biophys. 1213, 63–74.Tuite, E., Norden, B., 1994. J. Am. Chem. Soc. 116, 7548–7556.Yu, H.Z., Rowe, A.W., Waugh, D.M., 2002. Anal. Chem. 74, 5742–5747.Zhang, W., Yang, T., Chen, J., Jiao, K., 2008. Appl. Surf. Sci. 254, 4750–4756.


![Ceramic Coating [Tio2-Zro2] on Aluminium 6061t6 for Anti](https://img.pdfslide.us/doc/110x75/577cc6801a28aba7119e69ce/ceramic-coating-tio2-zro2-on-aluminium-6061t6-for-anti.jpg)