Embed Size (px)
Citation preview
Investigation of the chemistry of 1-hydroxyacetone by Fourier transform infrared spectroscopy
by Susan Hm-Major
Department of Food Science and Agricultural Chemistry Macdonald Campus of McGill University
A thesis submitted to the Faculty of Graduate Studies and Research in partial hlfillment of the requirements
of the degree of Master of Science
OSusan Harty-Major, 1997
National Library Bibliothèque nationale du Canada
Acquisitions and Acquisitions et Bibliographic Services services bibliographiques
395 Wellington Street 395, rue Wellington Ottawa ON K I A ON4 Ottawa ON K I A ON4 Canada Canada
Your hle Votre réference
Our file Nofre rel6rence
The author has granted a non- exclusive licence allowing the National Library of Canada to reproduce, loan, distribute or sel1 copies of ths thesis in microform, paper or electronic formats.
The author retains ownership of the copyright in Uiis thesis. Neither the thesis nor substantial extracts fiom it may be printed or othewise reproduced without the author's permission.
L'auteur a accordé une licence non exclusive permettant à la Bibliotheque nationale du Canada de reproduire, prêter, distribuer ou vendre des copies de cette thèse sous la fome de microfiche/film, de reproduction sur papier ou sur format électronique.
L'auteur conserve la propriété du droit d'auteur qui protège cette thèse. Ni la thèse ni des extraits substantiels de celle-ci ne doivent être imprimés ou autrement reproduits sans son autorisation.

TABLE OF CONTENTS
......................................................................................................................... Abstract IV ........................................................................................................................... Résumé V
......................................................................................................... Acknowledgments VI ............................................................................................................... List of Tables VI1
.......................................................................................................... List of Figures VI11 .............................................................................................................. List of Schemes X
CHAPTER 1 . INTRODUCTION ................................................................................... 1
1 . 1 Introduction ............................................................................................................ 1 1.2 Objectives of This Study ........................................................................................... 2
CHAPTER 2 . LITERATURE REVlEW ........................................................................ 3
2.1 Introduction to Maillard Reaction ............................................................................. 3 2.2 Browning .................................................................................................................. 4 2.3 Chemical Changes During the Maillard Reaction ....................................................... 5
2.3.1. Early Stage ................................................................................................... 6 2.3 .2 . Advanced Stage ............................................................................................. 9 2.3.3. Final Stage ................................................................................................... 16
2.4 Conditions Affecting the MaiIlard Reaction ............................................................. 17 2.5 Kinetics of the Maillard Reaction ............................................................................ 20 2.6 Methods of Analysis ............................................................................................... 22
2.6.1 . Introduction ................................................................................................. 22 2.6.2. FTIR Spectroscopy ................................................................................... 2 3
2.6.2.1 . Pnnciples ............................................................................................. -23 2.6.2.2. Instrumentation ..................................................................................... 29 . . 2.6.2.3. Applications ......................................................................................... - 3 2
2.7 Carbonyl-Amine Interaction in Model Systems ........................................................ 34
CHAPTER 3 . EXPERIMENTAL ................................................................................. 36
3.1 Materials ................................................................................................................. 36 3.2 Sample Preparation ............................................................................................ -36
3.2.1 . Band Assignment s of a-Hydroxycarbonyls ............................................ 3 6
3.2.1.1. 1 -Hydroxyacetone ............................................................................... -36 3.2.1.2. 1 -Hydroxy-2-butanone .......................................................................... 38 3.2.1 . 3 . Glyceraldehyde .................................................................................... -39 3.2.1.4. Dihydroxyacetone ................................................................................ 4 0
. ...................................................................................... 3.2.1 5. Glycoaldehyde 40 3.2.2. Molar Absorptivity of the Carbonyl Band of 1 -Hydroxyacetone ................... 41 3.2.3. Dimerization and Enolization of Short Chain a-Hydroxycarbonyls ............... 41
3.2.3.1 Effect of Concentration on Dimer Formation ........................................ 41 3 .2.3.2. Effect of Temperature on Dimer Dissociation ........................................ 42 3.2.3.3. Effect of Solvent on Enolization ............................................................ 42 3.2.3.4. Effect of Temperature on Enolization .................................................... 42
3 .2.4. Carbonyl-Amine Reactions ......................................................................... 43 3.2.4.1 . I -Hydroxyacetone/Pyrrolidine .............................................................. 4 3 3.2.4.2. Glyceraldehyde/Proline ......................................................................... 43 3.2.4.3. Glyceraldehyde/Glycine ........................................................................ 44 3.2.4.4. 1 -Hydroxyacetone/Proline .................................................................... 45
3.3 Instrumentation - FTIR ........................................................................................... 47
CHAPTER 4 . PEAK ASSIGNMENTS OF SHORT CHAIN a.HYDROXYCARBONYLS ................................................................ 49
4.1 Introduction ............................................................................................................ 49 4.1.1 . 1 -Hydroxyacetone ........................................................................................ 49 4.1.2. Dihydroxyacetone ........................................................................................ 51 4.1.3. Glyceraldehyde ............................................................................................ 52
4.2 ResuIts and Discussion ............................................................................................ 54 4.3 Molar Absorptivity Calculations of the Carbonyl Band of 1 Hydroxyacetone .......... 64
. 4.3.1 Introduction ................................................................................................. 64 4.3.2. Results and Discussion ................................................................................. 64
CHAPTER 5 . DIMERIZATION AND ENOLIZATION OF SHORT CHAIN a-HYDROXYCARBONYL COMPOUNDS ......................................... 67
5.1 Introduction ............................................................................................................ 67 5.2 Results and Discussion ............................................................................................ 68
5.2.1. Effect of Concentration on Dimer Formation ............................................... 68 5.2.2. Effect of Temperature on Dimer Formation ................................................. 70 5.2.3. Effect of Solvent on Enolization ...........................,................................. 73 5.2.4. Effect of Temperature on Enolization ...................................................... 7 4

........................... CHAPTER 6 . MONITORING CARBONYL-AMINE REACTIONS 76
............................................................................................................ 6.1 Introduction 76 ........................................................................................... 6.2 Results and Discussion - 8 0
........................................................................................ 6.2.1 . Peak Assignments 80 .................................. 6.2.1 - 1 . 1 -Hydroxyacetone/Pyrrolidine Mode1 Systems - 8 0
................................................. 6.2.1 .2 . Glyceraldehyde/Glycine Mode1 System 87 6.2.2. Reaction Rate of 1 -Hydroxyacetone with Pyrrolidine ................................. 90 6.2.3. Synthesis of Rearrangement Products .......................................................... 94
..................................................................................... CHAPTER 7 . CONCLUSION 96
.................................................................................................................... References -98

Abstract
The process by which foods are browned during baking and roasting is attributed to the
Maillard reaction. The interaction of the a-hydroxycarbonyl moiety of a reducing sugar with an
amino compound can result in a complex series of changes. The identification and isolation of the
key intermediates, known as the Amadon rearrangement product (ARP) and Heyns reamgement
product (HRP), can provide a greater understanding of the browning process.
Fourier transform infiared (FTIR) analysis of 1-hydroxyacetone provided qualitative and
quantitative information of the behavior of this a-hydroxycarbonyl cornpound in various aqueous
and non-aqueous solutions.
The carbonyl peaks (in the 1750-1700 cm" absorption region) due to the kero and
nldeh-vdo forms of 1-hydroxyacetone (acetol) in the pure state and in deuterium oxide @,O) were
assigned. Upon addition of the acid-base catalysts (triethylamine, 5 % NaOD and 5 % DC1)
additional peaks were detected in the alkene region (1700-1650 cm*') due to the formation of
enediols by enolization. The examination of analogous hydroxycarbonyl structures (1 -hydroxy-2-
butanone, giyceraldehyde, glycoaldehyde and dihydroxyacetone) provided the rneans to confirm the
assignments of the carbonyl and enediol bands.
The integrated intensity of the carbonyl peak of 1 -hydroxyacetone centered at 1 720 cm-'
was determined for dilute solutions in D20. The integrated molar absorptivity of the carbonyl band
was calculated to be 3674 L/mol/cm. In addition, the effect of concentration and temperature on
dimer dissociation was investigated. The effect of solvent and temperature on enolization was also
studied. Time run analysis of the carbonyl-amine reaction of 1-hydroxyactone with pyrrolidine
provided the basis for a kinetic study of the rearrangement process in the early stage of Maillard
reaction.

Résumé
Le processus par lequel les aliments brunissent pendant la cuisson est attribué à la réaction
de Maillard. L'interaction de la portion a-hydroxycarbonyle du sucre réducteur avec un composé
amine peut produire une série complexe de changements. L'identification et 1 'isolement des
intermédiaires clés, connus sous le nom des produits de réarrangement d'Amadori (ARP) et des
produits de réarrangement de Heyns (HRP), peuvent aider à une rneiIleure comprehension du
procédé de brunissement.
L'analyse par spectroscopie infrarouge à transformée de Fourier (FTIR) du 1-
hydroxyacétone a permis d'obtenir des informations a la fois quantitatives et qualitatives sur le
comportement de ce composé oc-hydroxycarbonyle en solutions aqueuses et non- aqueuses.
Les bandes anribuables aux carbonyles (dans la région 1750-1700 cm-') dues aux formes
céto- et aldéhydo- du 1-hydroxyacétone (acétol) à l'état pur et dans l'oxyde de deutérium (D20) ont
été assignées. Suite à l'ajout du catalyste acide-base (triéthylarnine, 5 % NaOD et 5% DCI) des
bandes d'absorption additionnelles ont été détectées dans la région des alcènes (1 700-1650 cm"')
dues a la formation d'enediols par énolisation. L'examen de structures hydroxycarbonyles
analogues ( 1 -hydroxy-2-butanone, glyceraldéhyde, glycoaldéhyde et dihydroxyacétone) ont permis
de confirmer l'attribution des bandes carbonyIes et enediols.
L'intensité intégrée du pic du I hydroxyacétone, centré à 1720 cm", a été mesuré pour des
solutions diluées de DrO. L'absorptivité moléculaire intégrée de la bande du carbonyle a été
calculée comme étant 3674 L/mol/cm. De plus, l'effet de la concentration et de la température sur
la dissociation des dimeres a été examiné. Des analyses en fonction du temps de la réaction entre
carbonyle et aminé du 1-hydroxyacétone avec la pyrrolidine ont permis l'établir des fondements
pour une étude de la cinétique des procédés de réarrangernent dans les stages précoces de la
réaction de Maillard.

Acknowledgments
1 would like ta thank Dr. V. A. Yaylayan for his supervision and guidance, as well
as Dr. A. A. Ismail for his advise in my research. In addition 1 would like to thank my
husband Victor Major, my children Jason and Laura for their patience and support
together with my mother Mrs. Jeannette Harty who has always encouraged me in my
education. I would also like to express a note of appreciation to my colleagues, Anahita
and Janie as well as the secretanal staff in the Food Science Department, Lise and
Barbara.
Finally, at this tirne 1 would like to indicate my gratitude to NSERC for funding.
,.y List of Tables .&
Table 1: Carbonyl absorption bands (cm-') of I -hydroxyacetone and 1 -hydroxy-Zbutanone in different solvents
Table 2: Carbonyl absorption bands (cm'') of short chain hydroxycarbonyls in different solvents
Table 3 : Integrated band intensity of the carbonyl peak (1 700-1 730 cm-') of 1 -hydroxyacetone at different concentrations at room temperature
Table 4: lntegrated band intensities of the carbonyl peak centered at 1720 cm-' of 1 -hydroxyacetone at different concentrations at 30 OC
Table 5: Integrated band intensities of the carbonyl peak centered at 1720 cm-' of 1 -hydroxyacetone at different concentrations at 60 OC
Table 6: Effects of temperature on non carbonyl forms of 1 -hydroxyacetone
List of Figures
Figure 1:
Figure 2:
Figure 3 :
Figure 4:
Figure 5 :
Figure 6:
Figure 7:
Figure 8:
Figure 9:
Fipre 10:
Figure 1 1 :
Figure 12:
Figure 1 3:
Figure 14:
Figure 1 5:
Figure 16:
Advanced Stage of Maillard Reaction
Neat I -hydroxyacetone (acetol) with no spacer
Neat 1 -hydroxyacetone (acetol) on 3M disposable IR card (Type 6 1 )
Polyethylene substrate contained on 3M IR card (Type 61)
Second derivative spectnirn of neat 1 -hydroxyacetone (acetol)
Solvent effect on the absorption of carbonyl group of acetol(2 % solution)
Second derivative spectra of 2 % acetol solutions - in DzO and triethylamine
Second derivative spectra of neat I -hydroxyacetone (acetol) - before and after addition of NaBH4
Second derivative spectra of glyceraldehyde in DzO (diIute and concentrated)
Plot of integrated band intensity of the carbonyl peak (1 700-1 730 CE') versus concentration of 1 -hydroxyacetone
Variation of % non-carbonyI forrns with concentration (1 -hydroxyacetone at 30 O C )
Solutions of 1 -hydroxyacetone in D20
Solutions of 1 -hydroxyacetone in D20 (DzO subtracted from spectra)
Temperature effects on 10 % solutions of 1 -hydroxyacetone in 5 % DCl
Difference spectra of time mn study of cooled and vortexed 1 -hydroxyacetone and pyrrolidine: final spectrum minus initial (Expeiiment 1)
Second derivative spectra of the reaction of cooled and vortexed I -hydroxyacetone and pyrrolidine - time run spectra (Experiment 1)

Figure 17:
Figure 18:
Figure 19:
Figure 20a:
Figure 20b:
Figure 2 1 :
Figure 22:
Figure 23 :
Fizure 24:
Figure 25:
Fisure 26a:
Figure 26b:
Figure 27:
Figure 28:
Second derivative spectra of the reaction of cooled and vortexed 1 -hydroxyacetone/pyrrolidine reaction product + D2O (Experiment 1)
Second derivative spectra of the reaction of cooled and vortexed 1 -hydroxyacetone/pyrrolidine reaction product + D20 (Experiment 1)
Second derivative spectra of the time-run reaction at room temperature, between 1 -hydroxyacetone and pyrrolidine (Experiment II)
Reaction at room temperature of 1-hydroxyacetone and pyrrolidine in the ce11 (time run spectra, carbonyl region, Experiment III)
Reaction at room temperature of 1 -hydroxyacetone and pyrrolidine in the ce11 (time run spectra, Experiment 111)
Second derivative spectra of the reaction of room temperature 1-hydroxyacetone and pyrrolidine in ce11 - time mn spectra (Experiment 111)
Glyceraldehyde-glycine reaction in DzO
~l~ceraldeh~de-['~~]~l~cine reaction in D20
Glyceraldehyde-glycine methyl ester reaction in D20
Glyceraldehydefn-amylamine reaction: neat and in triethylamine
Variation of the intensity of the carbonyl region (1 75 1-1 686 cm-') with time
Variation of the intensity of the enediol region (1 686- 1600 cm-') with time
Variation of the intensity of the ARP and HRP associated peaks with time
Glyceraldehyde/proline crystalline product in D20

List of Schemes
Scheme 1:
Scheme 2:
Scheme 3:
Scheme 4:
Scheme 5:
Scheme 6:
Scheme 7:
Scheme 8:
Scheme 9:
t Schemel O:
A Schemel 1 :
Scheme 12:
Scheme 1 3 :
Scheme 14:
Scherne 15:
Scheme 16:
Scheme 17:
Early stage of the Maillard reaction involving glucose and an amino acid
Formation of ARP through Arnadori rearrangement
Formation of HRP through Heyns rearrangement
Lobry de Bruyn-Alberda van Ekenstein transformation
Degradation of Amadori compounds - Pathways 1 and 11
Strecker Degradation - Pathway II1
Formation of a-dicarbonyl compounds
Transamination reaction of the Schiff base - Pathway IV
Radical formation in the reaction of a suçar with an amino acid - Pathway VI
Enolization and dirnerization of I -hydroxyacetone
Tautornerization of I -hydroxy-Zbutanone
Short chain a-hydroxycarbonyl dimers and monomers
Glyceraldehyde-dimeric and dissociated foms
Silylation of 1 -hydroxyacetone with trimethylchlorosilane
Initial stage of the Maillard reaction of Cz reducing sugar analogs
Glyceraldehyde-glycine rearrangement mechanism
Proposed reaction mechanism of 1-hydroxyacetone with pyrrolidine
Chapter 1
introduction
1.1 Introduction
One of the important consequences of the thermal processing of foods is the
generation of flavors and colors. An explanation of non-enzymatic browning was first
proposed by L.C. Maillard (Maillard, 19 12). The so-named Maillard reaction describes a
series of reactions which are initiated by the interaction of a reducing sugar and an amino
compound, that results in the formation of brown pigments and numerous compounds
responsible for the texture and flavor. The Maillard reaction has also been found to be
associated with physiological changes such as aging, diabetes and cataract formation. The
key intermediate compounds in the Maillard reaction are the Arnadori rearrangement
Product, an aminoketose and the Heyn's rearrangement Product, an aminoaldose. These
rearrangement products are the precursors to the various compounds formed during the
Maillard reaction.
The study of chemical reactions involving simple sugar analogues such as acetol
and amino compounds can simplify the study and at the same time provide valuable
information towards the understanding of the Maillard reaction. The recent applications of
Fourier transform infiared spectroscopic (FTIR) analysis of carbohydrates have provided a
convenient, rapid and inexpensive way of monitoring structural changes during chemical
reactions.

1.2 Obiectives of This Studv
The objectives of this study are (1) to employ FTlR as a means to study the
chemistry of the a-hydroxycarbonyl moiety of reducing sugars by using short chain a-
hydroxycarbonyl analogs to overcome the problem of herniacetal or hemiketal formation
in hexoses. (2) to study the effect of temperature, concentration and solvent on
dimerkation and enolization associated with such moieties. (3) to develop a methodology
for the kinetic analysis of a carbonyl-amine reaction.

Chapter 2
Literahire Review
2.1 Introduction to the Maillard Reaction
The publication of the works of Louis Camille Maillard in 191 2 (Maillard, 191 2)
initiated the ongoing research into the chemistry of non-enzymatic browning. Today, the
flavors and aromas formed during heat treatment of foods are explained by the Maillard
reaction. Studies of the Maillard reaction are important in the food industry since they
can provide a better understanding of the generation of the flavors, aromas and colors
associated with the browning of baked and roasted foods.
The Maillard reaction is comprised of many complex steps, sorne of which are still
not understood. An important transformation dunng the initial phase of the Maillard
reaction is the formation of an aminoketose known as the Amadon rearrangement product
(abbreviated ARP) or an aminoaldose referred to as the Heyn's rearrangement product
(HRP). The subsequent reactions of these intermediates are responsible for the various
compounds produced in the Maillard reaction.
The initial step in the Maillard reaction involves a carbonyl-amine interaction. This
reaction between a carbonyl rnoiety and an amino cornpound is also observed in enzymatic
reactions as well as in biological systems. The Maillard reaction is known to be involved in
aging and diabetes (Monnier et al., 1990), cataract formation (Monnier and Cerami, 1983)
and the treatment of sickle-ce11 anemia (Acharya et al., 1983).
2.2 Browning
Duting storage and preparation of food there are numerous complex chemical
transformations which can occur. The phenornenon of browning in foods is associated
with a change in the aroma, taste, color and nutritional value of the food. There are three
processes which can occur as a result of food processing: amino-carbonyl reactions,
cararnelization and oxidative changes.
Carbonyl-amine reactions which are the most cornmon in food preparation,
normally occur when reducing sugars and compounds having free amino groups, such as
amino acids, peptides and proteins are heated. The numerous steps which occur in this
non-enzymatic browning process are referred to as the Maillard reaction. The brown
color which is associated with baked, broiled and roasted foods is due to the presence of
the colored polymers called melanoidins.
Caramelization is a reaction which takes place when pure sugars are heated at high
temperatures. There are however, many steps which occur in both the Maillard and
caramelization reactions. Caramelization involves reactions of sugars in the absence of
amino acids. In the Maillard reaction, once the sugar has reacted with the amino acid, it
subsequently undergoes many similar changes that pure suyars undergo at higher
temperatures.
Browning can also occur through enzyme-catalyzed oxidation of food
components. Polyphenol oxidase is probably found in most plant tissues, but especially in
such foods as apples, bananas, potatoes, tea leaves, coffee beans and tobacco leaves
(Whitaker, 1985). In enzymatic browning, polyphenol oxidases cause oxidation of

polyphenol systems which react further to produce brown-red pigments. This browning
causes the undesirable color, taste and loss of nutrient quality that food handlers associate
with the bruising of h i t s and vegetables. Oxidation is also partially responsible for the
destruction of vitamin C (ascorbic acid). One of the many degradation pathways of
ascorbic acid includes its autoxidation to form dehydroascorbic acid which can lead to the
formation of brown pigments (Villota and Hawkes, 1992).
Despite the fact that the aroma and taste of baked foods are pleasing, the browning
process can sometimes have detrimental effects. Destruction of vitamins and proteins due
to the transformations involved in the Maillard reaction can lead to a reduction in the
nutritional value of foods. It has also been speculated that some of the products forrned
during the Maillard reaction in fned or broiled meats and fish may be weak carcinogens.
(Barnes et al., 1983, Sosnovsky at al., 1993).
2.3 Chernical Changes During the Maillard Reaction
The initial research of the Maillard reaction was carried out with reducing sugars
and amino acids to produce the dark brown products known as melanoidins. A broader
view of the process includes the reaction of any a-hydroxycarbonyl group with amines,
amino acids, peptides and proteins. Since these reactions can follow complex pathways, it
is helpful to make use of mode1 systems to study the Maillard reaction in which a specific
carbonyl compound is reacted with a specific amino group. A long standing review of the
Maillard reaction was reported by Hodge in 1953. The reaction can be classified
according to its three stages of development: early, intermediate (or advanced) and final.

The key intermediates in the initial stage are the Amadori and Heyn's reanangement
product S. These stable products are important precursors to Maillard reaction products.
The initial stage involves the addition of the amino compound to the open-chain
form of the reducing sugar as shown in Scheme 1. This condensation is followed by the
loss of a molecule of water to form a Schiff base, which then undergoes cyclization to the
corresponding N-substituted aldosylamine (Scheme 1).
+ 1-I,N - CH- COOH
- I R
Schiff hase
Scheme 1 : Early stage of the Maillard reaction involving glucose and an arnino acid

The N-substituted aldosylamine is transformed into a ketose by a process called Arnadori
rearrangement as shown in Scheme 2. As a result, the original aldose is transfomed into a
1-amino-1-deoxy-Zketose called the Amadori Rearrangement Product (ARP). In a
similar process, an original ketose is transformed into an aminoaldose called the Heyn's
Rearrangement Product (HRP)(Scheme 3). The rearrangement is acid catalyzed by the
carboxyl group of the amino acid. The rearrangement is considered to be a key reaction
for browning due to the role of the AHRPs (Amadori and Heyn's Rearrangement
Products) as a flavor precursors.
To form the ARP the furanose form of the giycosylamine (1) undergoes a ring
opening to form (2). This appears to be the rate determining step of the Amadon
rearrangement (Baltes, 1982). By acid catalysis, the imminium ion (3) is formed which is
converted into the enaminoi form (4). By base catalysis the enarninol rearranges into the
ARP in the open-chain form (5) which is in equilibrium with the corresponding hemiacetal
form (5). Subsequent steps which lead to the completion of the Maillard reaction are
initiated from the open-chain form of the ARP (Baltes, 1982). However, there has been a
suggestion by Yaylayan (1990) that there is the possibility that the Maillard reaction can
also progress by direct dehydrations of the cyclic form of the ARP.
The reaction of an amine with a ketose to form an aminoaldose (HRP) is shown in
Scheme 3.

H-C-OH 1 I
HO-C-H
H-;-OH 1 I
H - C 1
CH20H
H-6-OH I 1,. fH-(1CvOH 2
H O - C - H 1 I HO-C-H
H - C - O H t I H-C-OH
H - C - O H I 1 H-C-OH CH,OH I
CH,OH
2 - 3 Schiff Basc Cation of Schiff Base
-1 1- A
C-OH 7 I
H O - C - H I
H-C-OH I
I C=O I
H O - C - H 1
H-C-OH 1
H-C-OH I
CH,OH
Scheme 2: Formation of ARP through Amadon rearrangement

CH,OI-I I -
C=O I
1-IO-C-H 1
H-C-OH I
M-C-OH I
CH,OI J
D-liuctose
CI4,OI-1 CFJOH 1 - I
R-HN-c-OH R-N-C I I +RN2: HO-C-H
-Ho HO -C - H L Y C ~ ~ O "
2 7 1 7 I
1-1- C -OH H-C-OH I I
H - C - 01-1 H-C-OH + HO &"*R
I I C-OH
SchiîT base ketosamine
H + HO-c-H HO-c-H I i CI-I,OI-I -H' HO-C-H ,HO-C-H ,OH
O-lF 1 7 I A
1-1 - C - OH 7 I 7 7 Il-C-OH 1-1 - C - OH 1
1 I I H-C-OH NI+ K & C I H,OH M-C-014 CI-I,OI-I I C H,OH
I HO H - C - OH H-C-OH
I H-C-OH
l 140 CH,OH
= Schilt' hase Cation of Scliff base en01 Somi
0x0 fonn (lm)
Scheme 3: Formation of HRP through Heyn's rearrangement

The Lobry de Bmyn-Alberda van Ekenstein transformation (Scheme 4) is another
process by which an aldose can be transformed into a ketose. This transformation is base
catalyzed and proceeds through enediol intemediates as shown in Scheme 4.
I r = O CMOI I CI ZOH CI r,or 1
H-C-OH C -- OH C-O C-011 --
HO-C-H 1-IO-C-H =~r HO-C-1-1 ---. HO-C
El-C-OH H - C - OH H-C-OH 1-1 - - OH
H-C-QH H-C-OH H-C-O11 FI-C -OH
CH,OII cr-r,o~r CH~OI 1 c?r,o~r
Scheme 4: Lobry de Bruyn-Alberda van Ekenstein transformation
2.3.2. Advanced Stage
The sequence of changes which constituie the advanced stage of the Maillard
reaction are shown in Figure 1. The main pathways of degradation of the Arnadori
compound, as outlined by Hodge (1953), are 1,2 enolization (1); a-hydroxycarbonyl
(reductone), short chah carbonyl and dicarbonyl formation by 2,3 enolization (II); and

1 J A A A A 4 A
sarrolay orrprrn + i03 + sap,Cyapp
t ~0!]t3pl3~8aa Jaq33Jl
u t , III * sl,~iroqlo.lrp .A
i L *- si,irioqm upxp ~ ~ r i s s~,irroq~oaisoip,iq-x,
A A
iio!ssg iio!loip.iqap rroyrxipiasin'q
S[OTXI3-'E'Z A
A A
II
piinodiiio3 oirnuv + m 3 i i ~ 3ir!xiiipq

Strecker degradation (III). The various pathways depend on the pH of the reaction
solution, the basicity of the amine attached to the sugar and the temperature. Different
pathways involve numerous steps which lead to the formation of volatile or soluble
substances. The final stage which follows produces the insoluble brown polymers,
melanoidins.
Pathways 1 and II lead to the degradation of the ARP by enolization. In neutral or
acidic aqueous solutions, furan derivatives are formed through pathway 1. Under alkaline
conditions ARPs mainly follow pathway II to fom smaller carbonyl compounds. For
pathway 1, in slightly acidic solutions (generally pH 5.0 and lower) the degradation of the
ARP involves 1,2 enolization (Scheme 5). In this pathway, the 1,2-enolization produces
an eneaminol which subsequently undergoes 8-elimination of the C-3 hydroxyl group.
Upon hydrolysis of the amine (b) there is the formation of an intermediate 3-deoxyosone
(c). Some evidence has been reported (Yaylayan and Huyghues-Despointes, 1994) that 3-
deoxy-2-hexulose has stability because it exists mainly in the cyclic fonn. Successive
dehydrations produce structure (d) and furan derivatives (e). The description of the
degradation in Scheme 5 is very focused to lead to the formation of melanoidins however
there are other possible reactions. For example, compounds (a) to (e) are reactive species
which, in addition to forming fumirals, can also undergo fi-agmentation and interaction
with each other to form low-molecular-weight cornpounds.
The second dehydration pathway begins with the 2,3 enolization of the ARP
(Scheme 5). This occurs in less acidic conditions, usually due to the presence of amines.
Followins 2,3 enolization there is a loss of the amine to give the enolic fom (g) of the 1-
deoxy-2,3-dicarbonyl intermediate (h) referred to as 1 -deoxyosone. The reaction can

continue to give fission products such as a-hydroxycarbonyls, carbonyls and dicarbonyls.
As in the case of 1,2 enolization, the fission products are in low yield and the intermediate
deoxyosones are highly reactive and dark-colored polymeric materials are produced dunng
the degradation.
A third possible pathway towards melanoidin formation is the Strecker degradation
(Scheme 6) in which a-amino acids are transfonned into aldehydes, containing one
carbon less than the original amino acid and a-aminoketones with the liberation of carbon
dioxide. The amino ketones produced are the precursors of pyrazines (Rizzi, 1987). The
amino acids react with the a-dicarbonyls and other conjugated dicarbonyl compounds
produced by the breakdown of the Arnadori compound in pathways I and II to fom Schiff
bases (a). The Schiff base enolizes into an amino acid derivative that is easily
decarboxylated. The new Schiff base (b) that is produced has one carbon less than its
precursor (a). Further hydrolytic cleavage results in the formation of an amine (c) and an
aldehyde or so called Strecker aldehyde (d) which corresponds to the original amino acid
with one carbon atom less. Under acidic conditions the eneaminol (b) releases ammonia
and a- hydroxycarbonyl reactive intermediates. The ammonia can then react iùrther with
dicarbonyl compounds producing pyrroles.
The aldehydes fomed are a source of brown pigments as they can condense with
various other compounds present in the reaction solution. The amino ketones (c) which
are produced are known to spontaneously fonn pyrazines in high yields i t ~ sile (R iu i ,
1987). Pyrazines contribute directly to the roasted or cooked flavor of rnany foodstuffs
such as beef products, cocoa, coffee and peanuts. However, browning aroma formation is
dependent on temperature. Higher temperature can cause the amino acid to be degraded

by pathways other than that of Strecker degradation such that amines and ammonia
formed by decarboxylation and deamination provide fùrther reactants to produce
compounds such as pyrazines (Roberts and Acree, 1994).
I- 1 I
R - C - NI-1, + R'- CI-IO I
/C, R O
Scheme 6: Strecker Degradation - Pathway 111
The cl-dicarbonyls which enable this Strecker degradation to occur are derived
from various sources. As mentioned previously, the Amadon and Heyn7s products
degrade to produce deoxyosones. It is also possible to bypass the AHRPs by the sequence
described by Ledl (1 990). As shown in Scheme 7, the amine catalyzes the enolization of

the sugar. The en01 can isomerize back to the aldose or form a ketose. Subsequent water
elimination can produce deoxyosones. The deoxyosones are the precursors of many
heterocyclic compounds associated with flavors. Under conditions of low water content
and pH 3 to 6, the pathway through Amadori rearrangement predominates. However, in
aqueous basic mode1 systems, the a-dicarbonyl products are fomed by bypassing the
ARPs.
FI-C-OH I I I
I d C-OH
7 2 C=O
I 7 1 A C-OH
HO-C-H 7 I I
I HO-7-H HO-7-H HO-C H-C-OH
I I
I H-c-OH I H-C-OH I H-C-OH R I
R R R aldosc cm1 kctosc cnol
HC-O I C=O
1 H-C-H
I H-C-OH
I R
C=O I c=o I
H-C-OH I
H2C- OH 1 C=O I
C = O I
H - C - H I
R
Scheme 7: Formation of a-dicarbonyl compounds

There is another possible pathway (IV) for the Maillard reaction by which the
Schiff bases derived fiom sugars and arnino acids may undergo a transamination reaction
thereby bypassing the Amadori rearrangement to yield non-reducing amino sugars
(alditols) (Scheme 8) (Davidek et al., 1 990). After the migration of the C=N double bond
followed by hydrolysis with H20, the amino acid is converted into the correspondin3 0x0
acid (b) and the sugar into a non-reducing amino sugar (a). The 0x0 acid continues to
react with another amino acid resulting in decarboxylation and liberation of an aldehyde by
Strecker degradation (pathway 111).
R 1 R
N - CH-COOH I I i N=C-COOH N H 2
CH I I
I y 2 CH, H-C-OH I -
1 - H-C-OH +H,O H-C-OH HO-C-H 7 I __=f
I HO-C-H
+ R-C-COOH 1 HO-C-H II
H-C-OH I 1
H-C-OH O
1 H-C-OH H-C-OH I I
1 H-C-OH H-C-OH CH,OH I I
CH,OH CH,OH Sclii ff basc (a) (b)
RI- CH-COOH I
amino acid aldchvde
Scheme 8: Transamination reaction of the Schiff base - Pathway IV

Another pathway(V1) has been proposed by Namiki and Hayashi (1983) in which
radicals produced in the early stage of the Maillard reaction are transformed into colored
compounds, without the formation of Amadori compounds, as outlined in Scheme 9. The
process is initiated by retroaldol cleavage of the Schiff base followed by bimolecular
condensation of the two-carbon fragments (a) to form the N-Nt-disubstituted
dihydropyrazine (c). Oxidation leads to the radical cation (d) and further oxidation foms
very reactive pyrazinium salts (e) which are quickly transformed into colored compounds.
It has also been pointed out by Kato et al. (1988) that, in addition, Amadori compounds
themselves can undergo retroaldol reactions.
CHO I
1 l
CI 101-1 CI IOH ~ ~ I C - O I ~ ' HC =O I CMOI 1
I
sugûr Schi If basc
Scheme 9: Radical formation in the reaction of a sugar with an amino acid - Pathway V1

An alternative route to dehydration of the ARP has been suggested by Yaylayan
(1 990). On the basis that almost 98% of the ARP exists in the cyclic form, it seems likely
that the degradation proceeds from the cyclic form. Following successive dehydration of
the hctopyranose tautorner of the ARP the intermediate pyrylium or pyrylium betaines
can be formed. These pydium ions can be involved in the production of various aroma
producing heterocyclic cornpounds or continue to polymerize in the formation of
melanoidins.
A fifih pathway to melanoidins is described by Burton and McWeeny (1964)
whereby the amino group is doubly substituted with the sugar component to produce a
diketose-amino compound. Subsequent transformations produce furfural-derived
melanoidins. This process seems to prevail when there is a high sugar to nitrogen ratio
under relatively low pH conditions.
2.3.3 Final Stage
The brown color which is associated with baked, roasted and cooked foods is
produced when some of the intermediates fi-om the advanced stage polymerize to form
brown melanoidin pigments. Through the numerous pathways of the advanced stage there
are many reactive intermediates produced hence a wide variety of flavors can be formed.
In the formation of aromas in the Maillard reaction , a considerable number of volatile
compounds (N- and S- heterocyclic) are generated and many of these are well known
today. However, the structure of the high molecular weight polymeric melanoidins is not
yet known. A complete understanding has yet to be developed.

2.4 Conditions Affectinp the Maillard Reaction
In addition to the type of the reacting carbonyl and amino compounds, other
factors which affect the Maillard reaction are temperature, pH of the medium, water
content as well as the presence of other substances such as oxygen, metals and sulfur
dioxide.
The results of the Maillard reactions are temperature dependent in such a way that
an increase in temperature of 10 "C increases the reaction rate 2 to 3 times; as in the
majoi-ity of organic reactions. The reaction can take place at elevated, normal or reduced
temperatures. The temperature dependence of the Maillard reaction is not the same for
different amino acids with the same reducing sugar (Holmes, 1970). Also, the types of
Maillard products formed is dependent on temperature (Roberts, 1 994).
At domestic cooking temperatures, the Maillard reaction produces the desired
results of improved flavor and brown color of foodstuffs. However there can be
detrimental effects such as those observed when milk powder is improperly stored, due to
a reaction between lactose and the lysine component of casein. The lysine residue, through
Arnadori rearrangement, becornes bound to the lactose hence the nutritional availability of
the lysine is destroyed. The amount of lysine loss increases significantly with an increase
in temperature.
It has been suggested that mutagenic products are formed at elevated
temperatures. It is believed that there is a correlation between mutagenesis and
carcinogenesis (Mauron, 198 1). Mutagens have been found in commercial beef extracts as
well as in ground beef hamburgers cooked at temperatures in excess of 150-200 OC, as on
a metal grill of a BBQ.
The pH of the reaction medium has an effect on the Maillard reaction. The
intensity of the reaction increases in an almost linear way within the pH range of 3 to 8,
and as a rule, it becomes a maximum (indicated by maximum coloration) in the alkaline
range of pH of 9 to 10 (Ashoor and Zent, 1984). The increase in reaction rate at higher
pH is expected since the initial step of the Maillard reaction is base-catalyzed. The
reactivity of the amino group in the amino acid varies with pH due to the relationship
between the pH and the arnount of the unprotonated form of the arnino acid. At higher
pH, there is a greater percent of amino acid in the unprotonated form, therefore, more
amino acid can react with the reducinç sugar.
Variations in the water content of the reactants results in changes in the browning
rate. Most browning reactions reach a maximum rate of reaction at water activity of
about 0.6-0.8 (Labuza and Saltmarch, 1981). Below 0.3 and above 0.8 the rate is
decreased. Water is naturally present in most food systems however it may not always be
available to react due to such factors as the polar nature and physical state of the water;
the mobility of the reactants and the possible presence of water binding agents.
The rate of the Maillard reaction is influenced by the nucleophilic strength of the
amine. Arnino acids with more than one potential reacting nitrogen group such as lysine
(Wolff et al., 1977), histidine and tryptophan (Labuza and Baisier, 1992) are assumed to
be more reactive. As well, the type of sugar involved in the Maillard reaction also plays a
role in the reactivity. The concentration of the acyclic or open-chain form of the reducing
sugar determines the reactivity since it is only the acyclic form with fiee aldose or ketose

group that can react. Burton and McWeeny (1963) found that pentoses are more reactive
than hexoses. Also, pH influences the amount of acyclic form present such that the
amount of open-chain form increases with increasing pH for most sugars (Labuza and
Baisier, 1992).
The stoichiometry of the Maillard reaction indicates that the susar and amine react
in a ratio of one to one, however studies have been done relating any possible increase in
reaction rate due to an excess of reducing sugar over the amino compound (O'Brien and
Morrissey, 1989, Wolfrom et al., 1974). Baisier and Labuza (1992) concluded in their
study of varying concentrations of glucose and glycine at pH 7.0 and 37 "C that the
absolute concentration in addition to the molar ratios affect the rate constant, as predicted
by the kinetics of this bimolecuiar reaction. The browning rate increases when an
additional amount of either substrate is added until the molar ratio is so high (or so Iow)
that the substrate in lower concentration becomes limiting.
The nature of the solvent also influences the rate of the reaction. The dielectric
properties and viscosity affect the rate of transfer of protons - a necessary phenornenon for
the mutorotation of the reducing sugar. Differences were observed in the mutorotation
kinetics of glucose and fnictose in H 2 0 vs. D20 (Kaanane and Labuza, 1989). Warrnbier
et al. (1976) found a change in browning rate when glycerol was added to the aqueous
mode1 system (of 0.52 water activity) of glucose and lysine.
The presence of other substances such as oxygen, salts and some metal ions can
play a role in the browning reaction. In some cases the presence of oxygen results in a less
intense brown coloration due to the degradation of melanoidins to colorless products
(Davidek, 1990). Oxospecies of suliùr in oxidation state IV, i.e. S02, HSOY', S O ~ - ~ and
~ 2 0 5 . ~ (collectively referred to as the S(1V) series) are used as chemical additives for
retarding non-enzymatic browning reactions in foods (Wedzicha and Vakalis, 1988) with
the presence of water-miscible non-electrolytes affecting the equilibrium concentration of
the individual S(1V) oxospecies (Wedzicha et al., 1992). On the other hand, the rate of
the reaction can be increased in the presence of phosphates and citrates and some metal
ions such as cu2' and ~e~ ' (~av idek , 1990). Yet, other metal ions such as sn2' and ~ n * '
can inhibit the reaction. Some metal ions only partially affect the rate (Adrian, 1974).
2.5. Kinetics of the Maillard Reaction
Studies on the kinetic behavior of the components in the Maillard reaction can be
used to gain information related to the stoichiometry and mechanism of the browning
reaction. As previously mentioned however, the Maillard reaction is complex and several
reactions rnay occur simultaneously thus the kinetics cannot be described by a simple
mathematical expression. As well, the reaction rate is dependent on pH and water activity
of the reaction system. For a pure system with no interference, the rate constant should
increase by a factor of ten for each unit pH increase (Labuza, 1994).
There can be different criteria used in the rneasurement of the rate of the Maillard
reaction. It is possible to consider three factors: the rate of browning; the rate of loss of
sugars and amino acids; and the rate of formation of the key intermediate Amadon and
Heyn's rearrangement products. When focusing on the AHRPs the rate of accumulation
of the products and the rate of disappearance of the products can be monitored.

The loss of sugar or amine in the early stages of the Maillard reaction follows
second-order kinetics in which the rate is dependent on the loss of both the sugar and the
amine. This is based on the assumption that the reversal of Schiff base formation was well
as the amount of amine recycling via Strecker degradation is negligible (Labuza and
Baisier, 1992). If the concentration of the sugar or amino acid is in excess, the system can
be treated as a pseudo first-order reaction, dependent on the reactant which is not in
excess.
In order to reduce the complications in rate analysis due to carbonyl-amine side-
reactions and regeneration of amine from the Amadori product (Labuza and Massura,
1990) it is advantageous to focus on the kinetics of the formation and/or loss of ARP
rather than the sugar or amine (Yaylayan and Huyghes-Despointes, 1994). The
interconversion of sugars and the decomposition of AHRPs by enolization produces
enediol intermediates. Measurements of the concentration of these alkene intermediates
can be used to obtain a rate constant for this interconversion (Hall and Knowles, 1975).

2.6. Methods of Analvsis
2.6.1. Introduction
The Maillard reaction is a complex, multi-step reaction. As a result, detection of
reactants, intermediates and products can be difficult. The different cornpounds which can
be detected have varying chemical and physical properties. Combinations of
chrornatographic and spectroscopic analyses in addition to chemical methods of
characterization have been used to study the various components of the reaction.
Gas chromatography is a valuable method for analysis of stable, volatile
compounds. Since many of the compounds produced by the Maillard reaction are volatile
they can be detected and identified by comparison with spectra of known structures.
Coupled GC/MS and GC/MS-MS spectrometry is very effective because it provides rapid
identification of the chrornatographic peaks (Yaylayan and Mandeville, 1994). The
pyrolysis of Amadori products coupled to GCMS (Py/GC/MS) has also been used as a
convenient method of studying the Maillard reaction (Huyghes-Despointes et al., 1994).
In HPLC (High Performance Liquid Chromatography) the liquid mobile phase
allows the separation and recovery of fractions which are not readily volatilized. The
advantage over GC lies in the fact that the nonvolatile water soluble compounds can be
anal yzed directly without being first derivatized. This method of anal ysis is particularly
usefùl for Amadori and Heyn's products that are polar molecules containing ionic groups.
Bonded aminopropyl columns have been used to separate carbohydrates. However, there
is some interference of the ionized carbonyl group of the amino acid and the ARPs with

the protonated groups on the aminopropyl columns. Reversed-phase (RP) columns have
been used successfvlly in the separation of Maillard reaction products (Yaylayan and
Forage, 1 99 1 ). Y aylayan and Huyghes-Despointes (1 994) were successful in the
simultaneous detection of the various products of the Maillard reaction using an HPLC
with a diode array detector coupled in parallel to a fluorescence and electrochemical
detector.
2.6.2. FTIR S~ectroscow
Fourier transformed infiared (FTIR) spectroscopy incorporates the science of
interferometry with the basic principles of infiared (IR) spectroscopy. The interferometer
is the key component of the instrumentation. The use of FTIR in vanous fields of science,
includinç Food Science, has shown potential in both qualitative and quantitative analyzes.
2.6.2.1. Principles of FTI R Spectrosco~y
Infrared spectroscopy is based on the interaction of matter and infrared radiation.
Functional groups in the infrared region absorb within a certain wavelengh region
corresponding to the vibrational frequencies of their covalent bonds. The infrared region
of the electrornagnetic spectrum includes wavelengths between 1 -1 00 pm or wavenumbers
10 000- 100 cm-'. The mid infrared region is in the 400-4000 cm-' ranse. Two different
modes of vibration can be recognized in a spectrum. Firstly, each functional group in a
molecule can produce an absorption band in the mid IR range of 4000- 1600 cm" range.

Secondly, the molecule as a whole has a complete absorption spectmm, located around
1600-700 cm-', which is unique, the so-called "fingerprint" of the molecule. Spectral
libraries which contain infiared spectra for many compounds can be used for cornparison
purposes. In a mixture, the absorbing compounds produce the combined spectra of the
compounds present in the mixture. The wavelength of energy absorbeci by a molecule is
related to the fiequency by the following equation:
where c = speed of light h = wavelength v = fiequency
The fiequency of the radiation is directly related to the amount of electromagnetic
radiation by equation (2):
where E = energy per quantum of radiation h = Planck's constant v = fi-equency
The wavelengt h values used by spectroscopist s are often expressed in reciprocal
wavenumbers according to equation (3):
s = ilh (3)
where s = wavenumber h = wavelength

L J
The amount of radiation absorbed by a sample is related by the Beer's law as follows:
where A = absorbance E = rnolar absorptivity C = concentration I = cell path length
It is also possible to collect spectral results in terms of per cent transmittance (%T) such
that absorbance (A) and transmittance (T) can be related by equation 6:
and Beer's law is expressed as:
where T = transmittance E = molar extinction coefficient C = concentration i = cell path length
Beer's law shows a linear relationship between the intensity of a spectral band and the
concentration of each component in the sample. However, deviations from linearity may
occur as a result of the efects of stray radiation, insufficient resolution and chernical
effects (Griffiths and de Haseth, 1986).
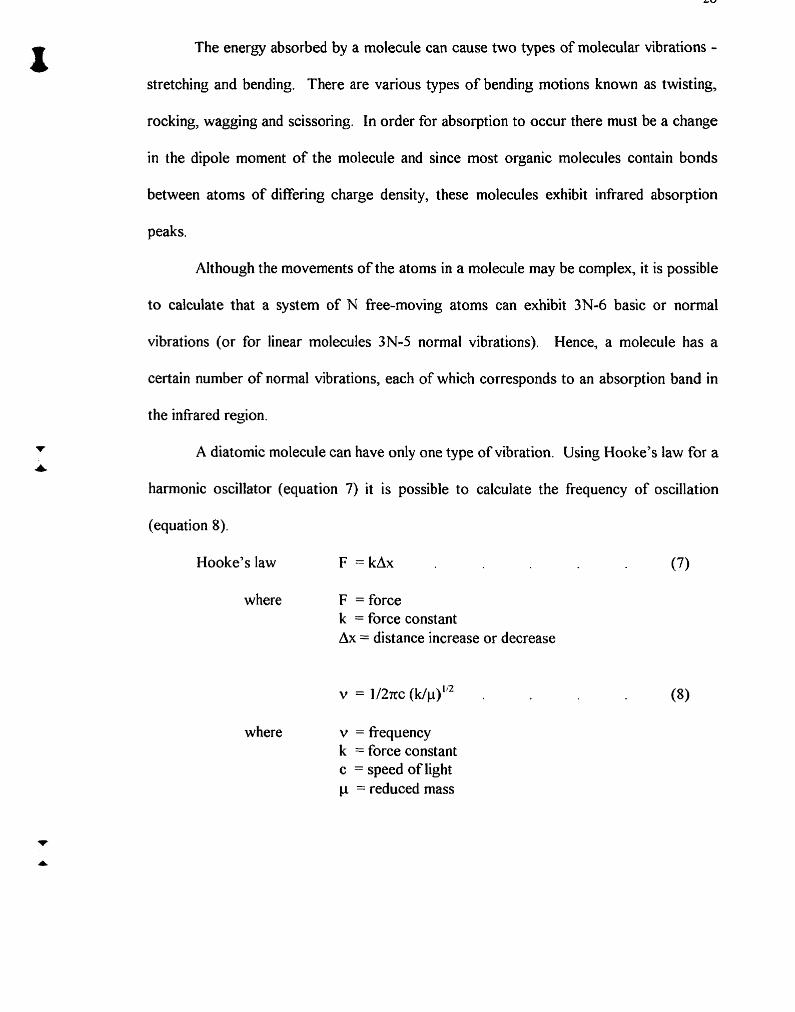
The energy absorbed by a molecule can cause two types of molecular vibrations -
stretching and bending. There are various types of bending motions known as twisting,
rocking, wagging and scissoring. In order for absorption to occur there must be a change
in the dipole moment of the molecule and since most organic molecules contain bonds
between atoms of diffenng charge density, these molecules exhibit infiared absorption
peaks.
Although the movements of the atoms in a molecule may be cornplex, it is possible
to calculate that a system of N fiee-moving atoms can exhibit 3N-6 basic or normal
vibrations (or for linear molecules 3N-5 normal vibrations). Hence, a molecule has a
certain number of normal vibrations, each of which corresponds to an absorption band in
the infi-ared reçion.
A diatomic molecule can have only one type of vibration. Using Hooke's law for a
harmonic oscillator (equation 7) it is possible to calculate the frequency of oscillation
(equation 8).
Hooke's law F = kAx (7)
where F = force k = force constant Ax = distance increase or decrease
where v = fiequency k = force constant c = speed of light p = reduced mass

The reduced mass of the two masses mi and m;? is found from equation 9:
Additional absorption bands known as overtones and combinations can occur but
these bands are weak. Overtones are bands at multiples of a fundamental fiequency.
Combination bands occur at frequencies which are the sum or difference of two or more
fiindamental frequencies.
Characteristic band frequencies can be shifted due to such factors as electrical
effects, steric effects, phase changes and hydrogen bonding (Hadzi, 1963). Hydrogen
bonding plays a large role in most biological studies due to the prevalence of water itself
and O-H, N-H, S-H and P-H groups in most systems. Hydrogn bonding weakens
chernical bonds between atoms and therefore is responsible for shifts to lower frequencies
and broadening in absorption bands. Intermolecular hydrogen bonding, which involves the
association of two or more molecules, can be distinguished fiom intramolecular hydrogen
bonding (bonding between atoms within the same molecule) in FTIR spectra.
Intermolecular hydrogen bonds are reduced upon dilution with a non-polar solvent.
Whereas, intramolecular hydrogen bonds are unaffected by dilution (Hallam, 1963).
For hydrogen-bonded species dissolved in an inert medium, an equilibrium exists
between the rnonomeric and the n-meric (associated) species. Using the intensity of the
absorption bands of the monomer and n-mer it is possible to determine the equilibrium
constant, K, for the association according to the equation ( 1 0)

where C , = concentration of n-mer Cl = concentration of monomer n = number of associated species
In the particular case of dimerization, the equilibrium expression becomes:
where CZ = concentration of dimer
CI = concentration of rnonomer
The monomeric concentration can be calculated using Beer's law. The concentration of
the n-mer may not be calculated fiom Beer's law unless the molar absorptivity of the n-
mer is known (Hallam, 1963). However, it is possible to calculate the concentration of the
n-mer using the relation between the total concentration of the solute (C) and the
concentration of the monomer (Cl) as follows:
The equilibrium between the monomer and associated species is temperature dependent.
A temperature rise favors dissociation, hence an increase in the concentration of the
monomer. A temperature increase of 20 O C is sufficient to cause an appreciable change in
the monomeric concentration (Hallam, 1 963).
A valuable feature of FTlR is the ability of the software to carry out various
mathematical operations such as spectral subtraction, deconvolution and derivatization.
Using spectral subtraction it is possible to isolate the spectmm of a desired component in a
mixture. For instance, water which is present in most biological systems, absorbs in the
3650-2930 cm-' and 1750-1580 cm-' ranges causing interference with the O-H and C=O
regions, respectively. By subtracting a spectrum of water fiom that of an aqueous
solution, the spectrum of the solute can be resolved. Deconvolution can be utilized as a
method of studying overlapping band contours. By applying Fourier self-deconvolution
the interferogram, the inverse Fourier transform of the spectmm to be deconvolved, is
multiplied and a new interferogram is used to produce a new spectrum with greater
resolution (Kauppinen et al., 1981). Fourier transforms can also be used for the
computation of derivative spectra. The second-derivative FTIR spectrum seems to have
been most applied in attempts to resolve overlapping bands (Griffiths and de Haseth,
1986).
2.6.2.2. Instrumentation
An FTIR instrument consists of the following basic components: an IR radiation
source, an interferometer, a sample holder, an intemal reference laser and a detector. An
interferometer, rather than a grating monochrometer, is employed to obtain a spectmm.
The spectrum obtained, called an interferogram, is converted through the use of a
cornputer and the mathematical operation known as Fourier transformation into an
infiared spectrum relating absorbance to fiequency (Christian, 1994).
The benefits of FTIR spectrometry over a grating spectrometer are three-fold.
The so-called Jacquinot advantage relates to the greater throughput of a Fourier
spectrometer over that of a dispersion instrument. The throughput of a system is
determined by the power received through the optical system at the detector. It is
calculated as the product of the area of the beam and its solid angle at any focus (Griffiths
and de Haseth, 1986). Another benefit of FTIR is the Fellgett's advantage or multiplex
advantage. Since the intefierorneter measures al1 fiequencies simultaneously Fellgett's
advantage can be used to obtain an entire spectrum in a very short time as well as improve
the signal-to-noise ratio for a given resolution. A third benefit, the Connes advantage,
relates to the precision obtained by using a laser to measure frequencies. Any potential
alignment problerns of the laser can be handled by the Fourier transform software
calibration routines (Pomeranz and Meloan, 1987).
The interferometer which is used in today's FTIRs is designed on the basis of the
first interferometer which was built by Michelson over 100 years ago (Grifliths and de
Haseth, 1986). The interferometer consists of a beam splitter, a moving rnirror and a fixed
rnirror. IR radiation ffom the source is split into two beams reflected by mirrors and then
retums along the same path and recombines to produce an interference pattern of al1
wavelengths in the beam. The interference pattern of the radiation from the two beams
passing through the sarnple changes with time as the moving mirror is continuously
scanned at a linear velocity. The result is an interferogram which is a measure of the
energies which reach the detector as a function of the optical path difference between the
two bearns. The motion of the moving mirror is monitored by the intemal reference laser.
Liquid samples are applied to a cell which is placed in a ce11 holder within the
instrument. The cell must be transparent in the wavelength region being measured and the
material used to make the ce11 must not be soluble in the analyte. Cells may be composed
of salts such as NaCl, BaFz, CaF2 and ZnS. There is a specific cutoff frequency for each of
the different window materials available, below which the radiation will not be transmitted.
For FTIR studies which require a change in temperature, a thennostated cell mount can be
utilized. The heating of the ce11 holder is controlled by a thermocouple. The sample cools
when the heater is tumed off and the IR instrument is purged with dry air.
The ce11 path length is dependent on the distance between the windows. The path
length is fixed by placing a spacer, composed of Teflon or copper, between the windows.
If a variable path length is desired, a variable path length ce11 can be employed. Water
absorbs fairly strongly in the regions of 3700-3050 cm-' and approximately 1640 cm-'.
The presence of water therefore in most biochemical samples may interfere in a spectrum.
It is possible to reduce these problems caused by water by using a shorter path length (<IO
pm) or an attenuated total reflectance (ATR) accessory (Griffiths and de Haseth, 1986).
A new type of cell, available from the 3M Company, is cornposed of a thin sheet of
polyethylene mounted on a disposable card. Different types of polyethylene film are
available, the type being chosen so that there is no interference of absorption range being
investigated and that of the polyethylene. The substrate is absorbed in the film. The matt
finish on the film serves to reduce fiinging.

Lnfiared spectroscopy is used for identification and structural analysis as well as
for quantitative analysis. The intensity of the absorption signal being proportional to the
concentration of the absorbing species. In the food industry, FTIR has been used in such
studies as the analysis of the major components of milk (van de Voort, 1988), fat and
protein composition of meats (van de Voort, 1992), isolated ~rcfi~s bonds in fats and oils
(Safar et al., 1994), carbohydrates in cereal samples (Olinger and GriRths, 1993) and
suçar structures (Yaylayan et al., 1994).
Since the IR spectrum of a compound is characteristic of that compound, it may be
used for identification just as physical constants such as melting point, refractive index and
optical rotation. Spectral comparisons are normally made in dilute solutions since pure
compounds which crystallize in different foms have different solid-phase spectra
(Kobayashi et al., 1976). The determination of molecular structure using FTIR is
somewhat more subjective. Through comparisons of different compounds with similar
functional groups under varying environmental conditions it is possible to postulate
molecular structures. Accurate measurement of a sample's concentration and of the
thickness of the absorbing specimen can allow calculation of a compound's absorptivity on
the basis of Beer's law. The absorptivity value can then be used to determine an unknown
concentration of the sample in the same cell.
Relating to the study of sugars, there have been some reports of applications of
FTlR in their analysis. FTIR has been used in the determination of dextrose equivalent
(DE) and dry substance (solids) measures in corn syrup (Fuller et al., 1990). Van de

Voort (1992) proposed the use of FTIR as a means of identification of juices and their
adulteration. ATWFTIR was usefùl in the detection of fats, proteins and sugars in
sweetened condensed milk (Nathier-Dufour et al., 1995). The adsorption of carbonyl
compounds on outgassed silica was determined by FTIR in order to characterize the
thermodynamics of H-bonding (Allian et al., 1995). lnfrared studies of the dimeric
structures of 1,3-dihydroxyacetone and glyceraldehyde lead to the detection of monomeric
and dimeric molecules (Kobayashi et al., 1976). Partial assignments of the IR and Raman
bands were made. In the FTIR spectra of a solid smoke flavouring preparation extract,
absorption bands due to reducing carbonyl groups appeared (Guillen and Manzanos,
1 996).
In an examination of 42 monosaccharides and related compounds using GC-FT-
IR, unique spectra were obtained for the differing compounds and their isomeric forms,
allowing unambiçuous identification (Veness and Evans, 1996). However, no
relationship was seen between the observed spectra and the anomeric form. Sugar
determination in foods with high carbohydrate content (e.g. sugars in honey) by HPLC or
LC using diode array detectors, FTIR detectors and enzyme reactors is of benefit in
separation systems (Wittkowski, 1992). Infiared spectroscopy was one of the methods
put to use in the confirmation of the chemical structure of a genotoxic agent denved from
the reaction of tyrosine and glucose in the presence of sodium nitrate (Wang et al., 1995).
The detection of the tautomeric forms of reducing sugars is advantageous in the
elucidation of the reaction mechanism of the Maillard reaction. A temperature rise
produced an increase in the carbonyl band of the k e ~ o sugar of D-hctose due to the
presence of a greater amount of the acyclic form; the temperature effects being greater at

basic pH than neutral pH values (Yaylayan et al., 1993). The identity of the carbonyl
adsorption peak centered at 1728 cm" of D-hctose was confirmed by isotopic
substitution using ~ - [2 -~~~] fn i c tose . Yaylayan and Ismail (1995) studied several aldoses
and ketoses and were able to detect the carbonyl band (1700-1 750 cm-') as well as an
alkene band (1 630-1680 cm-'). Enediol(ate) intermediates are important, being part of the
Maillard reaction and other biological processes such as enzyme aütivity (Hamilton and
Creighton, 1992) and the autoxidation of reducing sugars (Thomalley et al., 1984). The
absorption band centered at 1650 cm", due to the double bond character of the enediol
intermediate formed in the Lobry de Bruyn-Alberda van Ekenstein transformation reaction
of reducing sugars, was discovered to be sensitive to temperature and pH (Yaylayan et al.,
1 994).
2.7 Carbonyl-Amine Interaction in Model Svstems
The formation of AHRPs is a process which occurs naturally in many biophysical
systems. However, in vivo investigations are complicated by the multiplicity of
cornponents and decomposition pathways of the Maillard reaction and the presence of a
vast variety of functional groups and linkages in most biological processes. Model
systems are used for studies of browning reactions between materials of a-
hydroxycarbonyl compounds and amino-containing materials (Hodge, 1953). The results
of the simulated reactions can be extrapolated to the relationships and conditions in foods
and in the human organism. Aqueous solutions of the sugar and the amino component
have been investigated to simulate general conditions in foods and in i?iiw, whereas fusion

of the reactants is more appropriate for studies of the processes occumng during roasting
(Ledl and Schleicher, 1990). In some experiments, Amadon products are separated from
the results obtained by heating the reactants in water ancilor alcohols (Yaylayan and
Huyghes-Despointes, 1994). Since glucose is the most prevalent reducing sugar present
in living systems it is often used in model studies. Some examples of studies relating to
Food Science inciude, the aroma of baked bread produced in the glucose-proline reaction
(Roberts and Acree, 1994); the effect of time and temperature on model proline/glucose
reactions which simulate food processes such as puffing of grains, popping of popcorn,
extrusion of cereals, roasting of coffee and toasting in a toaster (Stahl and Parfiment,
1994); the roast aroma formed by heating glucose with histidine (Gi and Baltes, 1993).
Some pathways of decomposition of glucose, AHRPs and AHRP derivatives can
produce shorter chain hydroxycarbonyl fragments (C3 and C4 sugar analogues)(Yaylayan
and Huyghes-Despointes, 1994). These short chain units themselves can react in the
system to form more rearrangement products. Therefore, it is appropriate to conduct
carbonyl-amine mechanistic studies using such hydroxycarbonyl reactants as
glyceraldehyde, I -hydroxyacetone and 1,3-dihydroxyacetone. For example,
glyceraldehyde was used as a simple aldose to model higher sugar autoxidative processes
(Thornalley et al., 1984); the effectiveness of Maillard reaction products (MRPs) in
reduction of lipid oxidation in precooked meat was measured using prefonned MRPs of
glucose and dihydroxyacetone (Bedinghaus and Ockerman, 1995); slyceraldehyde and
glucose Schiff base adducts with the amino group of hemoglobin were compared (Acharya
et al., 1983).
Chapter 3
Experimental
3.1 Materials
Al1 reagents and chernicals were purchased fiom Aldrich Chemical Company,
Milwaukee, Wisconsin and used without further purification. Al1 solvents used were of
WPLC grade.
3.2 Sampte Preparation
3.2.1. Band Assienments of a-Hydroxvcarbonyls
3.2. t .l. 1-Hydroxyacetone
A 10 pl sample of neat 1 -hydroxyacetone (acetol) (93 %, mw 74.08, d 1.082) was
scanned with no spacer. A 0.0073 g (0.19 mmol) of sodium borohydride (mw 37.83) was
added to 109 pl (1.6 mmol) of acetol and the sample scanned with no spacer. A 28.8 pl
(1 -6 mmol) of D20 was added to the mixture of acetol and sodium borohydride and the
sample was scanned with no spacer. Another 10 pl sample of neat acetol was scanned on
a 3M disposable IR card. The sample was scanned at room temperature immediately and
after 10 minutes. A small amount of sodium borohydride was added to the acetol on the
IR card and the sample scanned. A drop of D20 was added to the IR card with the acetol
and sodium borohydride and the sample scanned.
A 2 % (2 mg1100 pl) solution of acetol in D a was prepared by dissolving 14.8
pl (16 mg) of acetol in 800 pl of 40. A sample of D20 was scanned. A 2 %

(2mg/100pI) solution of acetol in triethylamine (mw 101.19, d 0.726) was prepared by
dissolving 14.8 pl (16 mg) of acetol in 800 pl of triethylamine. A sample of tnethylamine
was scanned. A catalytic amount (1 pl) of triethylamine was added to a 2 % (2 mg/] 00 pl)
solution of acetol in 40 solution prepared by dissolving 29.6 pl (32 mg) of acetol in
1600 VI of D20. A 20 % (20 mg/100 pl) solution of acetol in H20 was prepared by
dissolving 37.0 pl (40 mg) of acetol in 200 1.11 of HzO. A sample of HzO was scanned. A
40 % (40 mg11 00 pl) solution of acetol in acetonitrile (mw 41 .OS, d 0.786) was prepared
by dissolving 370 pl (400 mg) of acetol in 1000 pl of acetonitrile. A sample of acetonitrile
was scanned. A 10 % (10 rng/100 pl) solution of acetol in acetonitrile was prepared by
dissolving 92.4 pl (1 00 mg) of acetol in 1 O00 pl of acetonitrile. A catalytic amount (1 0
pl) of triethylamine was added to the 1 O % solution of acetol in acetonitrile.
A solution in acetonitrile was prepared by dissolving 92.4 pl (1.35 mmol) of acetol
and 188 pl (1.35 mmol) of triethylamine in 1000 pl of acetonitrile. A second solution in
acetonitrile was prepared by dissolving 1026 pl (8.1 mmol) of tnmethylchlorosilane (mw
108.64, d 0.856) in 600 pl of acetonitrile. The trimethylchlorosilane solution was added in
300 pl amounts to the acetol solution with stirring at room temperature. The resulting
solid was dissolved by adding an additional 800 pl of acetonitrile to the reaction mixture
and subsequently an additional 46.2 pl (0.68 mmol) of acetol was added to the mixture.
The final reaction product was scanned. A 5 % (5 mdlOO pl) solution of
trimethylchlorosilane in acetonitrile was prepared by dissolving 1 1.7 p1 of
trimethylchlorosilane in 200 pl of acetonitde. A catalytic amount (1 0 pl) of triethylamine
was added to the solution of trimethylchlorosilane in acetonitrile.

A 4 % (4 mg/100 pl) solution of acetol in dioxane was prepared by dissolving 7.40
pl (8.0 1 mg) of acetol in 200 pl of dioxane (mw 88.1 1, d 1.034). A sample of pure
dioxane was scanned. A 5 % (5 m d l O0 pl) NaOD solution was prepared by adding 100
pl NaOD (40 5% NaOD in D20, 99.9 % atom %D) to 700 pl DzO. A 10 % (10
mg/100pI) solution of acetol in 5 % NaOD was prepared by dissolving 18.5 pl (20.0 mg)
acetol in 200 y1 5 % NaOD. A 5 % (5 mg/100pl) DCI solution was prepared by adding
100 pl DCI (35 % DCI in &O, 99.9 atom %D) to 600 pl of D20. A 10 % (10
mg/lOOpI) solution of acetol in 5 % DCI was prepared by 18.5 pl (20.0 mg) of acetol in
200 pl 5 % DCI solution. The sample was scanned for a temperature run (30-85 OC, 5 O C
increments, 1 0 minutes between).
A neat sample of 1 -hydroxy-2-butanone (mw 88.1 1, d 1.026) was scanned with no
spacer. A 2 % (2 mdlOO pl) 1-hydroxy-2-butanone solution in triethylamine was
prepared by dissolving 15.6 pl (16 mg) of 1-hydroxy-2-butanone in 800 pl of
triethylamine. A 10 % (1 0 mg1 00 pl) 1 -hydroxy-2-butanone solution in triethylamine was
prepared by dissolving 19.5 pl (20 mg) of 1-hydroxy-2-butanone in 200 pl of
triethylamine. A 20 % (20 msJ100 pl) solution of 1-hydroxy-Zbutanone in D20 was
prepared by dissolving 39.0 pl (40 mg) of 1 -hydroxy-2-butanone in 200 pl of D20.
A 2 % (2 mg/100 pl) solution of glyceraldehyde in 40 was prepared by
dissolving 0.0297 g of DI.-glyceraidehyde ( 98 % , mw 90.08) in 1300 pl of D20. A 10 %
(1 0 mg1 00 pl) solution of glyceraldehyde in D20 was prepared by adding 0.2009 g of
glyceraldehyde t o 2000 pl of D20. The solution was heated with stirring until al1 the solid
was dissolved. The solution was left to cool to room temperature. A 20 % (20 mg1100
pl) solution of glyceraldehyde in 40 was prepared by adding 0.2000 g of glyceraldehyde
to 2000 pl of 10 % glyceraldehyde in DZO. The solution was heated with stirring until al1
the solid was dissolved. The solution was lefk to cool to room temperature. A 57 % (57
mdlOO pl) solution of glyceraldehyde in D20 was prepared by adding 0.4002 g of
glyceraldehyde to 700 pl of D2O. The solution was heated with stirring until al1 the solid
was dissolved. The solution was left to cool to room temperature.
A 5 mg of sodium borohydride was added to a 100 pl volume of 57 %
glyceraldehyde solution in D20. The mixture was lefi to stand until bubbling ceased. A
5 pl of triethylamine was added to 100 pl of 20 % glyceraldehyde in D20. The sample
was scanned at room temperature and 50 O C . A 40 % (40 mg/100 pl) solution of
glyceraldehyde in 5 % NaOD was prepared by dissolving 0.0408 g of glyceraldehyde in
100 pl of 5 % NaOD solution. A 10 % (10 mg/100 pl) solution of glyceraldehyde in
methyl sulfoxide (dimethyl sulfoxide, DMSO) was prepared by dissolving 0.0195 g of
glyceraldehyde in 200 pl of dimethyl sulfoxide (rnw 78.13, d 1.101). The sample was
scanned at 75 O C for a time nin of 50 spectra, 10 minutes/spectrurn.

3.2.1.4. Dihvdroxvacetone
A 80 % (80 mg11 00 pl) solution of dihydroxyacetone (dimer) in D20 was prepared
by dissolving 0.160 g of dihydroxyacetone (1,3 -dihydroxy-2-propanone, dimer , 97 %)
(mw 180.16) in 200 pl of D20. A 40 % (40 mdlOO pl) solution of dihydroxyacetone
(dimer) was prepared by adding 100 pl of D20 to 100 pl sample of 80 %
dihydroxyacetone solution. The sample was scanned at room temperature and 60 O C .
A 5 % (5 rng/100 pl) solution of dihydroxyacetone (dimer) in triethylamine was
prepared by dissolving 0.0106 g of dihydroxyacetone (dimer) in 200 pl of triethylamine
and a drop of &O. The sample was scanned at 50 O C . A 40 % (40 mdlOO pl) solution
of dihydroxyacetone (dimer) in 5 % NaOD was prepared by dissolving 0.021 5 g of
dihydroxyacetone (dimer) in 50 pl of 5 % NaOD. The sample was scanned at room
temperature and 50 O C .
3.2.1 .S. Givcoaldehyde
A 20 % (20 mgl100 pl) solution of glycoaldehyde in D20 was prepared by
dissolving 0.0395 g of glycoaldehyde (2,5-dihydroxy-1,4-dioxane; hydroxyacetaldehyde
dimer)(mw 120.10) in 200 pl of 40. The sample was scanned at room temperature,
50 O C and 70 OC.

3.2.2. Molar Absor~tivitv of the Carbonvl Band of 1-Hvdroxvacetone
A 4 % (4 mg1 00 pl) solution of acetol in DZO was prepared by dissolving 14.8 pl
(16 mg) of acetol in 400 pl D20. Serial dilutions of the 4 % solution were made to
produce solutions of concentrations 2 %, 1 %, 0.5 % and 0.25 % or 0.270, 0.1 3 5, 0.0675
and 0.0340 mol/L, respectively. Infiared spectra were collected in duplicate at room
temperature and 60 "C using a 25 pm Teflon spacer.
3.2.3. Dimerization and Enolization of Short Chain a-Hydroxvcrirbonvls
3.2.3.1. Effect of Concentration on Dimer Formation
A sample of neat acetol was scanned with no spacer. A 80 % (80 mç/100 pl,
10.80 molk) solution of acetol was prepared by dissolving 148 pl (160 mg) of acetol in
200 pl of D20 and a sample was scanned with no spacer. A 40 % (40 rng/100 pl, 5.40
mom) solution of acetol was prepared by 100 pl of 80 % acetol in 100 pl of D20. A
20 % (20 mg1100 pl, 2.70 molk) solution of acetol was prepared by dissolving 100 pl of
40 % acetol in 100 pl of DzO. A 10 % (10 mg100 pl, 1.350 mol/L) solution of acetoi
was prepared by dissolving 100 pl of 20 % acetol in 100 pl of 40. A 5 % (5mg/100 pl,
0.628 moliL) solution of acetol was prepared by dissolving 100 pl of 10 % acetol in 100
pl of DzO. Infiared spectra were collected in duplicate at 30 "C.
3.2.3.2. Effect of Tem~erature on Dimer Dissociation
The neat, 80 %, 40 %, 20 %, 10 %, and 5 % samples of acetol described in section
3.2.3.1. were scanned in duplicate at 30 "C and 60 O C . The 80 % and 40 % samples of
dihydroxyacetone described in section 3.2.1.4. were scanned at room temperature and 60
O C . The 20 % glycoaldehyde solution described in section 3.2.1 S. was scanned at room
temperature, 50 "C and 70 O C .
3.2.3.3. Effect of Solvent on Enolization
The 2 % solutions of acetol in D20 and triethylamine described in section 3.2.1.1.
were scanned at 30 OC. The 10 % solutions of acetol in acetonitrile before and aller the
addition of a catalytic amount of triethylamine described in section 3.2.1 . l . were scanned
at 30 "C. The 1 O % solutions of acetol in NaOD and DCl described in section 3.2.1.1.
were scanned at room temperature.
The solution in triethylamine of acetol and trimethylchlorosilane described in
section 3.2.1.1. was scanned at room temperature for a time nin of 50 spectra with 10
minutes/spectmm.
3.2.3.4. Effect of Temperature on Enolization
The 2 % solution of acetol in triethylamine described in section 3.2.1.1. was
scanned at 30 "C, 50 O C and 60 OC. The 10 % solution of acetol in DCI described in

section 3.2.1.1. was scanned at room temperature and 70 "C.
The 40 % solution of dihydroxyacetone in NaOD described in section 3.2.1.4. was
scanned at 30 O C and 50 "C.
3.2.4. Carbonvl-Amine Reactions
3.2.4.1. 1 -Hvdroxvacetone/Pyrrolidine
A 60.3 pl of pyrrolidine (mw 7 1 .12, d 0.86 1 )(0.73 mmol) was added to 50 pl of
acetol (0.73 mmol) in a vial. The time of mixing was noted and the reactants in the via1
shaken on a mixer. The sample was scanned at room temperature for a time run of 20
spectra with 4 minuteslspectnim. A 60.3 pl of ice cooled pyrrolidine (mw 71.12, d
0.86)(0.73 mmol) was added to 50 p1 of ice cooled acetol(0.73 mrnol) in a vial. The time
of mixing was noted and the reactants in the vial shaken on a mixer. The sample was
scanned at room temperature for a time run of 37 spectra with 2 minutes/spectnim. A 20
pl of D20 was added to the reaction vial upon completion of the time run analysis and the
sample scanned.
A 10 pl of pyrrolidine was added to 10 pl of acetol on the window of the IR ceIl.
The time of addition was noted and the sample scanned at room temperature for a time
mn of 43 spectra with 2 minutes/spectnim.
3.2.4.2. Glvceraldehvdef Proline
A 1.790 g (0.0199 mol) of DI,-glyceraldehyde and 2.2944 g (0.0199 mol) amount
of proline (mw 1 1 5.1 3) was added to 40 ml of methanol . The mixture was stirred at
room temperature for 3 hours and refngerated ovemight- The resulting crystals were

collected by filtration and recrystallized in methanol/water (1 : 1, v/v).
The melting point of the crystalline product, measured using electrotherrnal
melting point apparatus, was 115 O C . The meiting points provided by the supplier for
glyceraldehyde and proline are 145 OC and 2 15 OC, respectively. The yield of the reaction
was 7.5 %.
The product was detected by TLC on silica gel flexible sheets (J.T. Baker) using a
mobile phase of I -butanol/methanol/acetic acid (1 : 1 : 2, v/v); standards of proline in
methanol and glyceraldehyde in methanol; and detection reagents of ninhydrin (4 %
solution of ninhydrin in methanol) for the amino acid and tetrazolium (3 % solution of 2,
3, 5-tiiphenyl-2H-tetrazolium chloride in methanol) for the carbonyl compounds. The
proline migrated slower than the glyceraldehyde and the reaction product. However, it
was not possible to distinguish the glyceraldehyde form the product, perhaps due to the
large sirnilarity in polarity of the two species.
A 10 % solution of the glyceraldehyde-proline ARP was made by dissolving
0.0050 g of ARP in 50 pl of D2O. The sample was scanned at room temperature.
A 100 pl (0.634 mmol) of 57 % glyceraldehyde solution described in section
3.2.1.3. was added to 0.0467 g of glycine (aminoacetic acid, mw 75.07) ( 0.622 mmol) in
200 pl of &O. A 0.0 120 g (0.167 mmol) of glycine was added to 1 50 pl (0.334 mmol) of
20% glyceraldehyde solution prepared as described in section 3 -2.1.3.
A 50 pl (0.317 mmol) arnount of 57 % glyceraldehyde solution was added to

0.0226 g (0.297 mmol) of [ ' * ~ ] ~ l ~ c i n e (mw 76.06) in 100 pl of D20. A 50 pl (0.3 17
mmol) of 57 % glyceraldehyde solution was added to 0.0189 g (0.156 mmol) of glycine
methyl ester hydrochloride (rnw 156.56) in 100 pl of DzO. A 25.9 pl (0.223 mmol) of
n-amylamine (mw 87.16, d 0.75) was added to 100 pl (0.223 mmol) of 20 %
glyceraldehyde solution.
A 250 pl (3.65 mmol) of 1-hydroxyacetone (acetol) and 0.451 5 g (3.92 mmol) of
proline were mixed in 10 ml of methanol at room temperature for 1 hour and refi-igerated
overnight. The solvent was evaporated on the rotary evaporator. The resulting crystals
were dissolved in hot dichloromethane and the resulting solution left at room temperature
for 1 hour and then refngerated for 1 hour. The solvent was evaporated on the rotary
evaporator. The resulting crystals were dissolved in hot methanol and left at room
temperature for 2 days afier which time only a dark polymenc material was observed.
A solution of 250 pl (3.65 mmol) of acetol in 5 ml of methanol was cooled on ice.
A 0.4435 g (3.85 rnmol) of proline was dissolved in 5 ml of methanol. The proline
solution was added in 0.5 ml increments every 30 seconds. The mixture was lefi on ice for
1.5 hours and refi-igerated for 2 days. The solvent volume was reduced by rotary
evaporation and the remaining solution refrigerated for 2 days. Ether was added until the
solution became cioudy and then the mixture was refngerated. The crystals were collected
by filtration and recrystallized in methanol. The progress of the reaction was followed by
TLC using mobile phases of 1 -butanol/methano~acetic acid (1 : 1 : 2, vlv) and ethyl

acetate/methanol/acetic acid (40:60:0.5, v/v); standards of proline and acetol in methanol;
and detection reagents of ninhydrin for proline and tetrazolium, diluted DNP (2,4-
dinitrophenylhydrazine) or acidified DNP (with added HCl) for the product. The melting
point of the crystals was observed to be > 150 O C , resembling the melting point of
unreacted impure proline (melting point 228 O C ) .
A 500 p1 (7.30 mmol) of acetol was dissolved in 5 ml of methanol. A 0.840 g
(7.30 mmol) of proline was added to 5 ml of methanol and warrned on a hot plate until
completely dissolved. The mole ratio of acetol to proline was 1: 1 . The proline solution
was added to the acetol solution and refluxed at 60 O C for 4 hours. The progress of the
reaction was followed by TLC every 15 minutes using mobile phases of 1 -
butanol/methanollacetic acid (1 : 1 2 v/v) and ethyl acetatelmethanollacetic acid
(20:80:0.5, vlv); standards of proline and acetol in methanol; and detection reagents of
ninhydnn for proline and charred H z S O l (2 % in ethanol) for acetol and the product. The
reaction flask was refngerated overnight. Ether was added until the solution became
cloudy. The mixture was left at room temperature and then refi-igerated overnight. The
resulting crystals were scraped off the flask and the melting point measured.
A 500 pl (7.30 mmol) of acetol was dissolved in 5 ml of methanollwater (955,
v/v). A 0.840 g (7.30 rnmd) of proline was added to 5 ml of methanol/water (955, vlv)
containing 223 p1 (1.6 mmol) triethylamine (mw 101.19, d 0.726) and 20 pl thiophenol.
The mole ratio of acetol to proline was 1 : 1. The proline solution was added to the acetol
solution and stirred for 30 minutes. Subsequently, 20 pl of thiophenol and 0.0819 g (0.77
mmol) of malonic acid (mw 104.06) was added and the reaction mixture left to stir for 30
minutes. Two more 20 pl arnounts of thiophenol were added at 30 minute intervals. The

reaction mixture was left stimng at room temperature for 1 hour, then cooled in an
icehock salt mixture and refiigerated overnight. Ether was added until the solution
became cloudy. The precipitate was collected by gravity filtration and the melting point
measured. The filtrate was refiigerated, the liquid was decanted and the melting point of
resulting crystals was measured.
A 2 ml (0.0292 mol) of acetol was added to 0.840 g (0.00730 mol) of proline
dissolved in 10 ml of methanol at room temperature. The mole ratio of acetol to proline
was 4: 1 . The progress of the reaction was followed by TLC after 5, 20 and 60 minutes
using a mobile phase of ethyl acetate/methanol/acetic acid (20: 80: 0.5, v/v); standards of
proline and acetol in methanol; and detection reagents of ninhydrin for proline and charred
H2SOd (2 % in ethanol) for acetol and the product. After 1.5 hours 10 pl of thiophenol
was added and the solution left at room temperature ovemight. Ether was added until the
solution became cloudy. The solution was heated until clear and refiigerated for 5 days.
The resulting crystals were collected by filtration, dissolved in methanol and left
uncovered at room temperature. The filtrate was refiigerated for 3 days.
3.3 Instrumentation - FTlR
Samples were scanned on a Nicolet 8210 Fourier transform infiared
spectrophotometer in a CaF2 ce11 with a 25 pm Teflon spacer at room temperature unless
otherwise specified. The system was purged with dry air in order to minimize water vapor
and COz interferences and equipped with a deuterated triglycine sulfate (DTGS) detector.
The temperature of the specimen was regulated with an Ornega temperature controller

connected to the IR ce11 holder. Some sarnples were scanned on a 3M disposable IR card
(Type 61). A total of 128 scans at 4 cm-' resolution were coadded. The FTIR data was
processed by using OMNIC version 2.0 or GRAMSI3 86 version 3 .O 1 . Second-order
derivatization was perfomed using the Savitsky-Golay function (9 points) unless
otherwise specified.

Chapter 4
Peak Assignments of Short Chain a-Hydroxycarbonyls
4.1. Introduction
The assignment of the carbonyl bands is useful in the study of carbohydrates and
particularly in the study of the reactions of reducing sugars in the Maillard reaction. The
different tautomeric forms of a carbonyl compound can be detected by FTIR (Yaylayan
and Ismail, 1992). The effects of solvent, temperature and concentration are also evident.
The importance of monitoring the carbonyl group lies in the fact that it is the major
functional group that undergoes chernical changes.
The major reducing sugars involved during the Maillard reaction are hexoses such
as glucose and hctose. However, due to the presence of furanose and pyranose forms,
the a-hydroxycarbonyl rnoieties in the sugars are not evident. The open forrn exists only
in less than 1 % of the total concentration of the sugar. To overcoms this problern short
chain analogs, in which cyclization is not possible, can be used, to follow structural
chanses in a-hydroxycarbonyls due to dimerization, enolization or reactions with amines.
The C? a-hydroxycarbonyl species such as 1-hydroxyacetone (acetol) (1) can
undergo enolization and dimerization to yield the structures illustrated in Scheme 10.
Under alkaline conditions, the keto form of 1-hydroxyacetone (1) exists in equilibrium
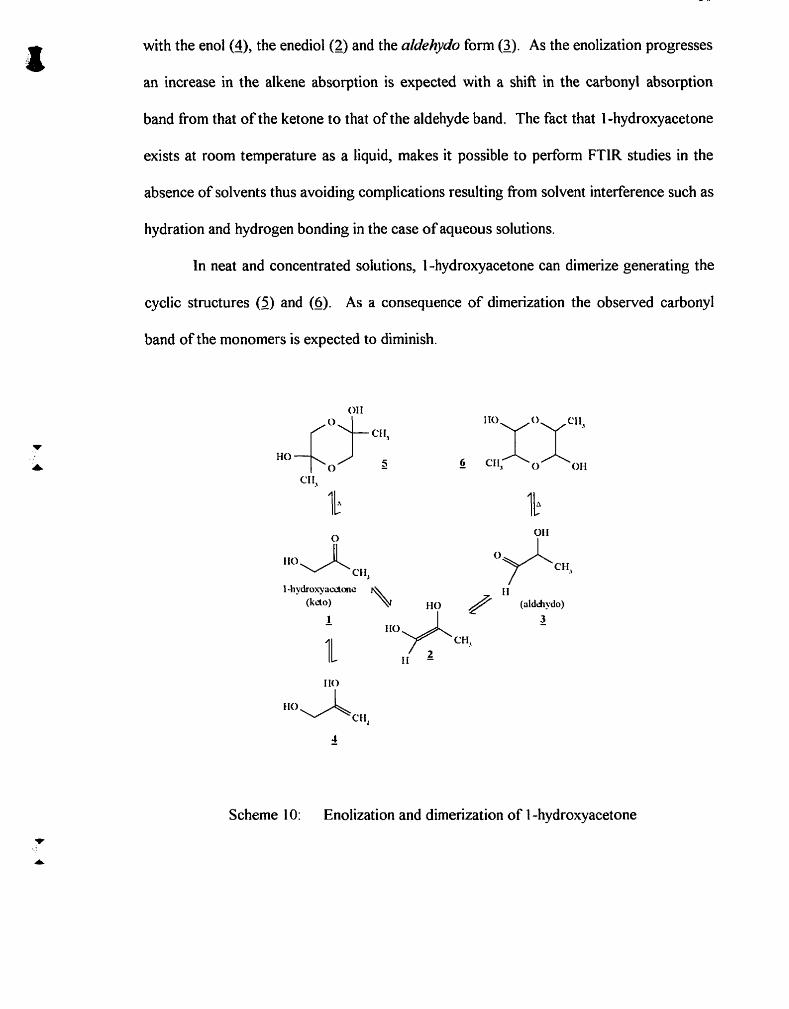
with the enol(9, the enediol(2) and the aldehydo fonn (a). As the enolization progresses
an increase in the alkene absorption is expected with a shift in the carbonyl absorption
band from that of the ketone to that of the aldehyde band. The fact that 1-hydroxyacetone
exists at room temperature as a liquid, makes it possible to perform FTIR studies in the
absence of solvents thus avoiding complications resulting fiom solvent interference such as
hydration and hydrogen bonding in the case of aqueous solutions.
In neat and concentrated solutions, I -hydroxyacetone can dimerize generating the
cyclic structures (5) and (6). As a consequence of dimerization the observed carbonyl
band of the monomers is expected to diminish.
Scheme 10: Enolization and dimerization of 1 -hydroxyacetone

A related a-hydroxycarbonyl compound is the C4 analog 1-hydroxy-2-butanone
(Scheme 11). Base catalyzed 1,2 enolization of the keto form (7) yields the enediol (8)
and the nldehydo tautorner (9). Due to the similarity in the structures of 1-
hydroxyacetone and 1 -hydroxy-2-butanone the carbonyl and enediol absorptions should be
similar in both compounds.
Scheme 1 1 : Tautomerization of 1 -hydroxy-2-butanone
4.1 -2. Dihydroxvacetone
Similarities in the structures of dirnenc dihydroxyacetone, glycoaldehyde (m) and
dioxane (l2) are illustrated in Scheme 12. The Ca compounds formed by the dissociation
of the dihydroxyacetone dimer (l3) are the keto monomer (l4) and the nldehydo
monomer (l6). Glycoaldehyde dimer (hydroxyacetaldehyde dimer) (10) can dissociate to
produce a C3 a-hydroxyaldehyde (1) with no possibility of ketone formation. The fact
that glycoaldehyde is commercially available is usehl in that it can be used for cornparison
with postulated dimers in other a-hydroxycarbonyl compounds.
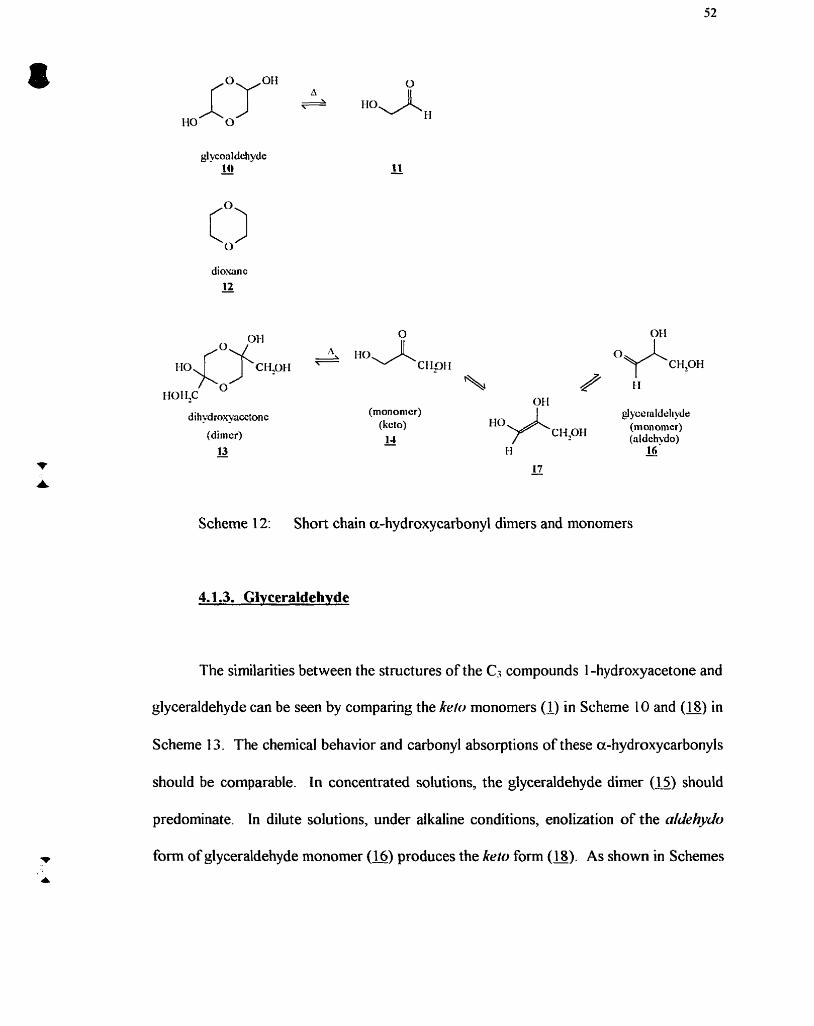
diosanc 12 -
di hydrosjacctonc
(dimcr) 13 -
(monomcr) (kcto)
14 -
oq C HzOH
% // H
glyceraldcliyde
C I ~ ~ I - 1 (ni ononier) (aldehydo) II - 16
17 -
Scheme 12: Short chah a-hydroxycarbonyl dimers and monomers
4.1.3. Givceraldehvde
The similanties between the structures of the C3 compounds 1 -hydroxyacetone and
glyceraldehyde can be seen by comparing the kefo rnonomers (1) in Scheme 10 and (18) in
Scheme 13. The chernical behavior and carbonyl absorptions of these a-hydroxycarbonyls
should be comparable. In concentrated solutions, the glyceraldehyde dimer (l5) should
predominate. In dilute solutions, under alkaline conditions, enolization of the nIdebydo
forrn of glyceraldehyde monomer (l6) produces the krto forrn (fi). As shown in Schemes

12 and 13, the ketose of glyceraldehyde (l8) is the same as the keto monomer (l4)
produced by the dissociation of dihydroxyacetone (dimer).
gly ccmldchydc (di mer)
H glyceraldehydc (kcio)
(mono mer) 18
8 - (aldehydo)
Scheme 13: Glyceraldehyde - dimeric and dissociated foms

4.2 Results and Discussion
The spectrum of acetol (neat) in Figure 2 shows the prominent carbonyl peak
centered at 1720 cm". The spectrum was scanned without a spacer thereby reducing the
pathlength and the absorbance of the signal.
4000 3500 3000 2500 2000 1500 1 O00 Absorbance f Wavenumber (cm-1) Overlay X-Zoom CURSOR
Res= 4
Figure 2: Neat 1-hydroxyacetone (acetol) with no spacer
The spectrum of acetol (neat) obtained on a 3M disposable IR card (Type 61) is shown in
Figure 3. Figure 4 is the spectrum provided by the 3M Company of the microporous
polyethylene substrate used in the manufacture of the Type 61 card. The high C-H
stretching absorbencies of the substrate would interfere with any analysis in the regions
29 18-2849 cm'.

Figure 3 :
4000 3500 3000 3500 2000 15130 1000 Absorbance 1 Wavenumber (cm-1) Overlay X-Zoom CURSOR
Res= 4
Figure 4:
Neat 1 -hydroxyacetone (acetol) on 3M disposable IR card (Type 6 1)
Polyethylene substrate contained on 3M IR card (Type 61)

The second derivatives of the spectra can provide usehl information. The peaks in
the carbonyl region obtained fiom the second derivative can be assigned to the different
isomers of the carbonyl compound as well as any enediol structures which are present.
The two peaks observed in the carbonyl region of the spectrum of neat acetol obtained on
the 3M IR card as shown in Figure 5 are assigned to the keto (1726 cm-') and the
aldehydo (1702 cm-') forms. The order of the aldehyde and ketone absorptions is
consistent with that reported for other alpha-hydroxy carbonyl compounds (Yaylayan and
Ismail, 1995).
02
- 04 . 1800 1750 1700 1650 1600
Absorbante / Wavenumber (cml) Overlay X-Zoom CURSOR Res= 4
Figure 5: Second derivative spectrum of Neat 1 -hydroxyacetone (acetol)
In solution, the position and intensity of the carbonyl peak changes (Figure 6). In
D20, the carbonyl peak is shified to a lower wavenumber due to the eEects of hydrogen
bonding. In triethylamine, due to base catalyzed enolization new peaks are observed in the
alkene region at 1684, 1662 and 1633 cm-' which are consistent with those reported for
other alpha-hydroxy carbonyl compounds (Yaylayan and Ismail, 1995). In addition, due
to the base catalysis of enolization, aldrhydo carbonyl (1724 cm-') absorption in
triethylamine becomes prominent .

- + . . 1780 1760 1740 1720 1700 1680 1660 1640 1620
Absorbance f Wavenurnber (cm-1) Overlay X-Zoom CURSOR Res= 4
Figure 6: Solvent effect on the absorption of carbonyl group of acetol(2 % solution)
The 2nd derivative of these spectra are shown in Figure 7, which indicates further solvent
effects. In D20, only one peak is observed due to the ketone. The C=O of the aldehyde is
hydrated in the aqueous solution (Yaylayan et al., 19931, resulting in a new OH group or a
deuterated OD group. The ketone peak is shifted due to hydrogen bonding to, 1720
cm". In triethylarnine, the two carbonyl peaks are assigned as the ketone at 1734 cm-' and
the aldehyde at 1724 cm".
The spectra of acetol before and afier the addition of the reducing agent sodium
borohydride are shown in Figure 8. An overall decrease is observed in the intensity of the
carbonyl peak as a result of the borohydride reduction. The second derivative spectra in
Figure 8 indicate that as a result of the borohydnde reduction the decrease in peak height
is greater for the peak at 1702 cm-' than the peak at 1726 cm". Since the reduction by

N a B a is more favored for an aldehyde than a ketone group (Solomons, 1984). These
results confirm the assignment of the aldehyde at 1702 cm-' and the ketone at 1726 cm"'.
-.O1 , 1 BO0 1750
Absorbance / Wavenumber (cm-1)
2 %in 020
2 % in triethylamine
1650 1600 Overlay X-Zoom CURSOR
Res= 4
Fiwre 7: Second derivative spectra of 2 % acetol solutions - in D20 and triethylamine
- 04 1800 1750
Absorbance / Wavenumber @ml)
acetol + NaBH4
1650 1600 Overlay X-Zoom CURSOR
Res= 4
Figure 8: Second derivative spectra of neat 1 -hydroxyacetone (acetol) - before and after addition of NaBH4

Acid-base catalyzed enolization is also observed in solutions of NaOD and DCI
with new peaks appearing at 1670 and 1651 cm" in NaOD and at 1665 cm" in DCI.
Acetonitrile is a good aprotic solvent, however it displayed interference in parts of the
carbonyl region under study.
The carbonyl absorption bands for 1 -hydroxyacetone and its analogues are
summanzed in Tables 1 and 2. The structures of 1-hydroxyacetone (1) and 1-hydroxy-2-
butanone (7) are similar however only one carbonyl peak is observed in neat 1-hydroxy-2-
butanone perhaps due to the diminished acidity of a-hydrogens or because the aldehyde is
easily dimerized in the neat sample. The single peak due to the ketone observed for the 20
% solution of 1-hydroxy-2-butanone in D20 is explained by the fact that under these
aqueous conditions, either enolization is not favored to produce the aldehyde or any
aldehyde which is present is hydrated. The two carbonyl peaks at 1733 cm-' and 1721 cm-'
which are observed for the solution in triethylamine are assigned to the ketone and
aldehyde, respectively. The downward shift of the ketone carbonyl absorption fiom 1733
cm1 in triethylamine to 171 8 cm" in DzO, is due to the eflects of hydrogen bonding. The
catalysis of enolization under basic conditions with the solvent triethylamine is verified by
the presence of the enediol peaks at 1690, 1663 and 1636 cm-' and the two carbonyl
peaks. The various enediol peaks observed can be explained by the presence of the
different possible stereoisorners and conformers formed as a result of enolization
(Y aylayan and Ismail, 1995).

Table 1 : Carbonyl absorption bands (cm-') of 1 -hydroxyacetone and 1 -hydroxy-2-butanone in different solvent s
eiîediol 1 -h y d roxgacetone
CH3CN CH3CN + tnethylamine CH3CN + triethylamine + TMSi diosane 5 % NaOD 5 % DCI at rom temperature 5 5% DCl at 70 OC
keto 1 a/dehhydo
1
Neai
Trict_hylamine DzO
1725 1725
1760. 1724 1755. 17261s)
1715 1719 1715
1719 n.0. 11.0.
1733 1721 1690. 1663. 1636 1718 n.0. 11.0.
n.0. = not obscrvcd s = solvcnt n a = not applicable sli = shouIder \v = wcak
s n. o. 1714
1704(~) 1698 1697 n.0.
s n.0.
1699. 1622 n.0.
1670. 165 1 11.0.
1665

Table 2: Carbonyl absorption bands (cm-') of short chain hydroxycarbonyls in different solvents
In Figure 9, the contrast between the second derivatives (1 1 points) of the spectra
of a dilute (2 %) solution of glyceraldehyde in D20 at 30 O C and 40 "C shows that the
aldehydo form (at 1708 cm-')(&) is only apparent at a higher temperature due to the
weaker hydrogen bonding at elevated temperatures. The broad keto (l8) peak between
1740 - 1720 cm-' shows a few absorptions (see Table 2), this being the result of
enediol 1
1688, 1672(sh), 1664 1691. 1661 1691. 1661 1691. 1661 1691. 1661 1691. 1661 1691. 1661 1691. 1661
glyceraldchyde
D20 (2 %) aat 30 O C D20 (2 %) at 40 OC D20 (57 %) at 40 OC D20 + NaBH, D20 (20 %) + triethylamine at 30 OC DzO (20 %) + triethylamine at 50 OC 5 % NaOD DMSO at 75 OC for 2 hours
glycoaldehyde
D20 (20 %) at 30 O C D20 (20 Yo) at 50 O C
D 2 0 (20 %) at 70 "C
keto
1737(&), 1729 1737(*). 1733 (hl, 1729
1733 n.0.
af leh-vdo
n.0. 1708 n.0. 11.0.
n-a. n-a. n.a.
1733(sh). 1727 i
1733 1733
174O(si1)
di hydroxyacetone
D20 (40 %) at 60 O C
Trietliylamine + D20 5 % NaOD at 30 OC 5 ?4 NaOD ai 50 OC
n.0. nao. 11.0.
1730
1727 1744. 1727 1714. 1727
1691. 1664 1701. 1664 1701. 1664
n.0. = not observed s = solvent n-a. = no8 applicable sh = shoulder w = w a k
1736 1734 1734 11.0.
1725gt1) 1723(~h) 1720(~h) 1725(~)
n.0. n.0.
1688. 1662 1689. 1660
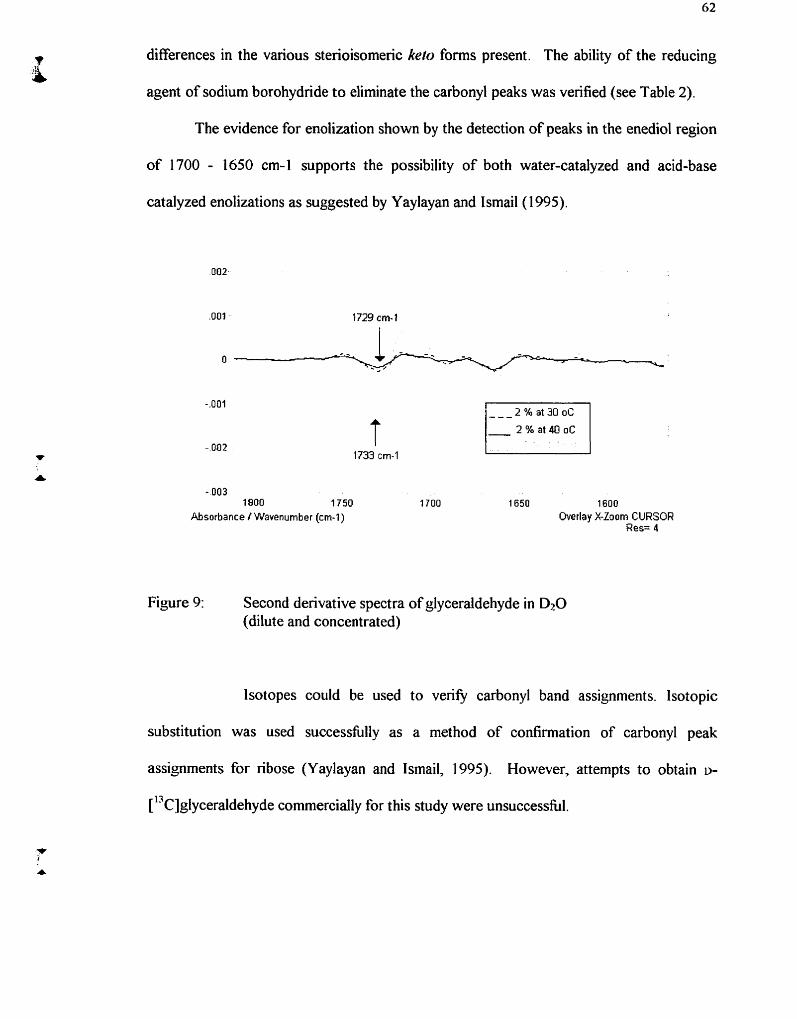
differences in the various sterioisomeric keto fonns present. The ability of the reducing
agent of sodium borohydride to elirninate the carbonyl peaks was verified (see Table 2).
The evidence for enolization shown by the detection of peaks in the enediol region
of 1700 - 1650 cm4 supports the possibility of both water-catalyzed and acid-base
catalyzed enolizations as suggested by Yaylayan and Ismail(1995).
- 003 1900 1750 1700 1650 1600
Absorbante / Wavenumber (cm-1) Overlay XZoom CURSOR Res= 4
Figure 9: Second derivative spectra of glyceraldehyde in DzO (dilute and concentrated)
Isotopes could be used to ver@ carbonyl band assignments. Isotopic
substitution was used successfully as a method of confirmation of carbonyl peak
assignments for ribose (Yaylayan and Ismail, 1995). However, attempts to obtain u-
[ ' ~ ~ ~ l ~ c e r a l d e h ~ d e commercially for this study were unsuccessful.

The carbonyl peak of the aldehydo monomer (11) of glycoaldehyde dimer (m) measured at 30 O C is observed at 1727 cm-'. As the temperature is increased to 50 and
70 O C a new peak is observed at 1744 cm-' due to oxidation to a carboxylic acid moiety.
Dihydroxyacetone dimer (l3) can dissociate to produce the keto monomer (l4)
which absorbs at 1736 cm" and the aldehydo monomer which absorbs at 1725 cm". The
keto (l8) and aldehydo (o) monomen of glyceraldehyde dimer (l5) absorb at 1736 cm"
and 1729 cm-', respectively. The appearance of the same peak at 1736 cm-' for
glyceraldehyde and dihydroxyacetone in DzO is confirmation that the ketose (l4) of
dihydroxyacetone is the same as the ketose ('8) of glyceraldehyde.
No peaks were observed in the alkene region for dihydroxyacetone dimer in
aqueous solution. The peak at 1725 cm-' is only a shoulder due to the fact that enolization
is not favored under these neutral conditions and any aldehyde which is present would be
hydrated in the aqueous solution. Evidence of base catalyzed enolization in NaOD
solution is provided by the detection of peaks at 1688 cm-' and 1662 cm-'. In the study of
dihydroxyacetone in triethylamine, the solid would not dissolve in the 2 % triethylamine
solution until some drops of 40 were added. There are no peaks observed in the alkene
region in this alkaline solution. The fact that the dihydroxyacetone was not soluble in 2 %
triethylamine and no alkene peaks are observed suggests that enolization was not favored
under t hese conditions.
4.3 Molar Absor~tivitv Calculations of the Carbonvl Band of 1-Hvdroxvacetone
4.3.1. Introduction
The detection of the carbonyl absorption bands of the various a-hydroxycarbonyl
units as outlined in section 4.2. verifies the presence of each tautomer, however, in order
to make any quantitative studies related to the amount of carbonyl present it is necessary
to determine the molar absorptivity of the carbonyl group. The molar absorptivity can be
used to calculate the concentration of the carbonyl group and hence the concentration of
open forms of the reducing sugars.
1 -Hydroxyacetone (acetol) cannot cyclize, however due to dimerization occurring
in higher concentrations the linearity of Beer's Law relating measured concentration and
absorbance will not hold. Hence it is important to determine a range of dilute
concentrations for which Beer's Law is applicable.
4.3.2. Results and Discussion
The integrated band intensity in the region 1700-1 730 cm-' for the carbonyl peak
of 1-hydroxyacetone centered at 1720 cm-' was determined for solutions in D 2 0 ranging
in concentrations fiom 2 % to 0.25 % (0.270 moVL to 0.034 mol/L). The results are
shown in Table 3.
At each concentration, the duplicate results at room temperature and 60 O C were
found to agree well with each other and the average value is recorded. The dependence of
absorptivity of the carbonyl band on temperature should be negligible (Yaylayan et al.,
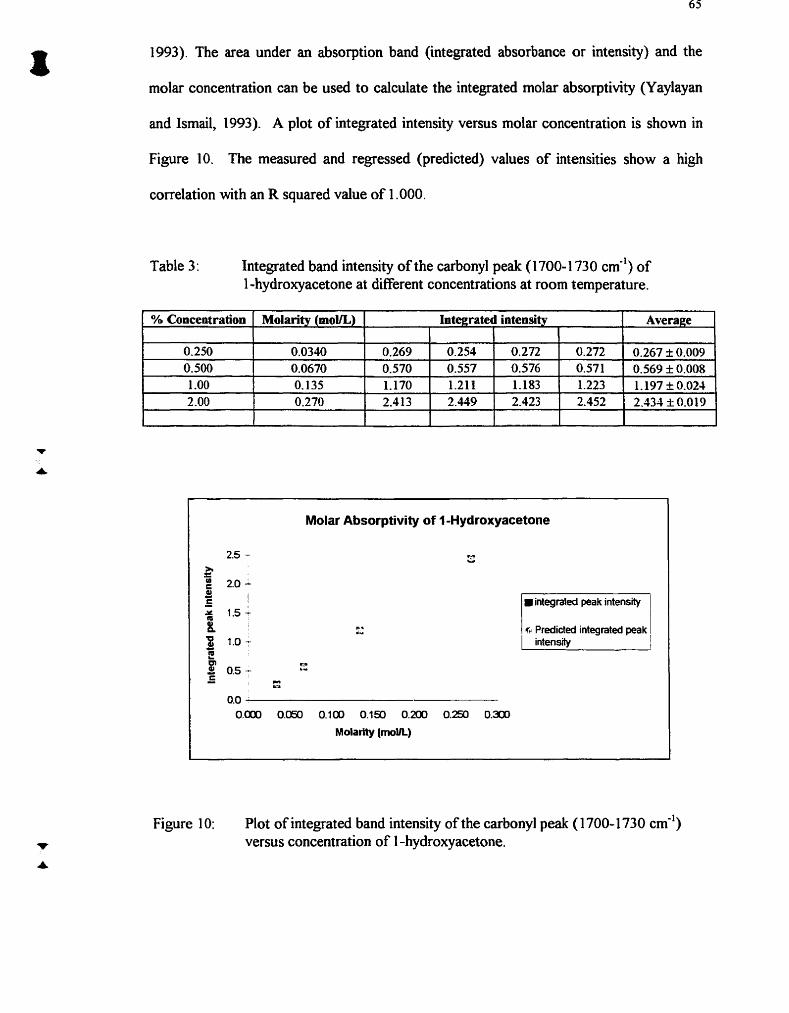
1993). The area under an absorption band (integrated absorbance or intensity) and the
molar concentration can be used to calculate the integrated rnolar absorptivity (Yaylayan
and Ismail, 1993). A plot of integrated intensity versus molar concentration is shown in
Figure 10. The measured and regressed (predicted) values of intensities show a high
correlation with an R squared value of 1.000.
Table 3 : Integrated band intensity of the carbonyl peak (1 700-1 730 cm-') of 1 -hydroxyacetone at different concentrations at room temperature.
Molar Absorptivity of 1 -Hydroxyacetone
I
inkrated peak intensrîy
! G Predicted integrated peak !
% Concentration
1 intensiiy
Interatcd intensity I I I
Molarity ( m o n )
Figure 10: Plot of integrated band intensity of the carbonyl peak (1 700- 1730 cm-') versus concentration of 1 -hydroxyacetone.
Average
Calculations using the slope of the line (9.185) obtained in Figure 10 and a value of the
pathlength of 0.0025 cm, showed that the integrated molar absorptivity of the carbonyl
band of 1-hydroxyacetone in 9 0 is 3674 L/mol/cm. It is not possible to ven@ this value
with any literature values however fùrther studies could be made with dilute solutions of
1-hydroxyacetone at a pathlength other than 0.0025 cm, e.g. 0.0050 cm. Other
hydroxycarbonyl compounds similar to 1 -hydroxyacetone could also be investigated. The
absorptivity values should al1 compare in at least magnitude.
Chapter 5
Dimerization and Enolization of Short Chain a-Hydroxycarbonyl Compounds
The occurrence of dimerization can be demonstrated using FTlR by the
appearance, over time, of new peaks due to the presence of absorbing groups in the
dimeric species which are not present in the rnonomer (Kobayashi et al., 1976), and by
observing a decrease in the intensity of monomer specific peaks as a result of dimerization.
The effects due to temperature and/or time on the dissociation/association process can be
followed by observing any changes in the spectnim due to temperature or time factors.
The proposed dimeric and tautomeric forms of 1-hydroxyacetone are shown in
Scheme 10. The C=O bonds present in the rnonomers (1) and (3) and the C-O-C bonds
present in the dimers (2) and (6) could be used to distinguish the different forms. Based
on the differences in these structures, the spectnim of the monomer should show an
absorption band due to C=O (1750-1700 cm-') and C-O stretching vibrations of C-O-H
(-1000 cm-'), as well as CH; and CH2 deformations (-1400 cm-') and OH bending
(-1 200 cm-'). Whereas, the dimeric form should exhibit C-O-C absorptions (-1 090 cm-').
Enolization of reducing sugars can be detected when absorption in the carbonyl
region 1750-1 700 cm-' is decreased and absorption in the alkene region 1680-1 630 cm-' is
increased (Yaylayan and Ismail, 1995). The effects due to solvent and temperature on the
enediol can be rnonitored by observing spectral changes in the enediol region. Additional
evidence for the presence of enediols could be provided by the trapping reaction of
trimethylchlorosilane with the endiolate anion to form trimethyl en01 ethers (Solomons,
1993). The presence of these trapped enediols can be verified by the detection of alkene
absorption peaks.
The combined effects of dimerization and enolization on a carbonyl containing
compound c m be observed by noting any changes in the peak intensity or absorption of
the carbonyl group. The observed peak intensity of the carbonyl group (Aob) and the
molar absorptivity can be used to calculate the molar concentration (Mc,,,) of the carbonyl
containing species present in a sample. The difference between the measured molarity
(Mm) and calculated molarity (Mcalc), expressed as (Mm-Mc,!,), can be used to assiçn a
percent of non carbonyl containing species (dimeric and enediol forrns) present in a
sample.
5.2 Results and Discussion
5.2.1. Effect of Concentration on Dimer Formation
The integrated band intensity (A) for the carbonyl peak of 1-hydroxyacetone (93
%) centered at 1720 cm'' was determined in duplicate for solutions in DzO (at 30 O C )
ranging in concentrations from 80.0 % to 5.00 % (10.0 mol/L to 0.628 mol/L). From the
duplicate results, the average integrated peak intensity (&bs) was obtained and recorded in
Table 4.
The difference between the rneasured molarity (Mm) and the calculated molarity
(Mcaic) is attributed to the loss of carbonyl peak intensity due to the presence of non-
carbonyl foms of 1-hydroxyacetone, such as, dimers (5) and (6) or enediols (2) and (4).

However, under these neutral aqueous conditions at arnbient temperature it is fair to
assume that the formation of alkenes is not favorable (Yaylayan and Ismail, 1995). The
relative amount of non carbonyl f o m present is proportional to concentration (R squared
value of 0.952). A plot of the measured and regressed (predicted) % non carbonyl forms
versus molarity is shown in Figure 1 1.
Table 4: Integrated band intensities of the carbonyl peak centered at 1720 cm-' of 1-hydroxyacetone at different concentrations at 30 O C
Conc = concentration: M = molarity; m = measured; A = integrated peak intensity: obs = observed
% Conc M m Male % non carbonyl
calc = calculated
5 .O0 10.0 20.0
Change in carbonyl forms of 1-hydroxyacetone (30 OC)
Measured molarity (moUL)
(moUL) 0.628 1.26 2.51
I % non carbony l
1; Redicled % non carbonyl 1
4.741 9.800 18.112
40.0 80.0
Figure 1 1 : Variation of % non-carbonyl forrns with concentration (1 -hydroxyacetone at 30 OC)
34.720 6 1.296
5 .O2 10.0
(mon) 0.5 16 1.07 1.97 3.78 6.67
(moiK.) 0.112 O. 193 0.538
forms 17.8 15.3 21.4
1.240 3.327
24.7 33.3

An attempt was made to identiQ any other changes in the spectra occurring as a
result of increases in concentration with respect to any region other than that of the
carbonyl band centered at 1720 cm". The spectra for 1 -hydroxyacetone of 80 %, 40 %
and 5 % concentrations are shown in Figure 12. For the sake of clanty, the region 2790-
1980 cm" was truncated fiom the spectra and for cornparison purposes, al1 were offset at
1900 cm-' to zero.
The peak centered at 1210 cm-' is the result of absorption due to 1-
hydroxyacetone as well as the solvent D20. The spectrum of water was subtracted and
the results are shown in Figure 13. The 12 10 cm-' band shows a decrease in absorbance
with an increase in the concentration of solution. The fact that this signal does not
increase as the concentration of the 1-hydroxyacetone is increased suggests that this peak
is related to the concentration of the monomer. The 121 0 cm-' peak can be assigned to
OH bending of the CHI-OH (1" alcohoi) group of the monomers (1) and (3). As
dimerization occurs, a decrease is observed in the signal at 12 10 cm-' while increases are
detected for the signals due to the OH bending of the hydroxyl group of the cyclic
hemiacetal (6)(1192 cm'') and C-O-C stretching absorptions (1 090 cm").
5.2.2. Effect of Tem~erature on Dimer Dissociation
The integrated band intensity (A) for the carbonyl peak of 1-hydroxyacetone (93
%) centered at 1720 cm-' was determined in duplicate for solutions in DzO (at 60 OC)
ranging in concentrations fiom 80.0 % to 5.00 % (10.0 moVL to 0.628 mol/L). The
average integrated peak intensity (&h) was obtained fiom the duplicate results. The %


non carbonyl form is proportional to concentration (Table 5) with a R squared value of
0.946.
Table 5: Integrated band intensities of the carbonyl peak centered at 1720 cm-' of 1 -hydroxyacetone at different concentrations at 60 OC
The change in the amount of non carbonyl forrns present in relation to a change in
temperature are summarized in Table 6. The increase in temperature causes the dimer to
dissociate and hence a loss in the % non carbonyl forms present. The difference between
Conc = concentration: M = niolarity; rn = mcasured: A = intcgratcd pcak intcnsity; obs = obsenrcd: calc = calculatcd
Mc& (mollL) 0.528 1 .O9 2.01 3.87 6.9 1
Aob*
4.848 10.001 18.491
, 35.503
Oh Conc
5.00 10.0 20.0 40.0
% non carbonyl forms at 60 O C and 30 O C included in Table 6 is a fairly constant absolute
Mm (mol/L)
0.628 1.26 2.51 5.02
value of 1.7 , with the exception of the results for the 80 % solution. This indicates that
Mm-Mculc (moIfL)
O. 100 O. 171 0.497 1.155
80.0
the effect of temperature on % non carbonyl forms is not dependent on the concentration
% non carbonyl forms 16.0 13.6 19.8 23.0
10.0 1 63.141
of the solution.
3,093 1 30.9
Table 6: Effects of temperature on non carbonyl foms of 1 -hydroxyacetone
1 % Concentration 1 % non carbonyl 1 % non carbonyl 1 % Differencc 1

The effect of temperature is also observed for the peaks in the region 1282-1000
cm-' assigned to OH bending of the CH2-OH (1" alcohol) group of the monomers (1) and
(3) ( 1 2 10 cm-'), OH bending of the hydroxyl group of the cyclic hemiketal(5) ( 1 1 94 cm-')
and C-O-C stretching absorptions (1090 c d ) .
Aqueous (D20) solutions of three analogous dimers scanned at 30 "C and 60 OC
were chosen for this study; 1-hydroxyacetone (40 %), dihydroxyacetone (40 %) and
glycoaldehyde (20 %). The spectrum of DzO was subtracted fiom each spectmm and the
resulting second derivative spectra compared. The results showed an increase in the peak
at 1 2 10 cm-' at the higher temperature for 1 -hydroxyacetone,dihydroxyacetone and
glycoaldehyde. This is consistent with the fact that as the dimer dissociates at the elevated
temperature the signal assigned to OH bending of the monomer is greater.
Decreases were observed for the peaks at 1194 cm-' for 1-hydroxyacetone and
1 177 cm-' for dihydroxyacetone as a result of the temperature increase. This confirms the
assignment of this reçion to the signal due to OH bending of the hydroxyl group of the
hemiketal dimer. The absence of a peak in this region for glycoaldehyde is explained by
the fact that glycoaldehyde dimer has a hemiacetal group not a hemiketal.
A decrease was also observed for the peak at 1090 cm" for 1-hydroxyacetone and
dihydroxyacetone and at 1060 cm"' for glycoaldehyde at the higher temperature.
Dissociation of the dimer at the elevated temperature causes the signal C-O-C stretching
of the dimer to dirninish.
5.2.3. Effect of Solvent on Enolization
As previously described in section 4.2, enolization is not observed in dilute
aqueous solutions of 1 -hydroxyacetone. However peaks are observed in the region
assigned to alkene absorption (Y aylayan and Ismail, 1 995) under alkaline conditions with
triethylamine at 1684, 1662 and 1633 cm" and with NaOD at 1670 and 165 1 cm" as well
as under acidic conditions with DCl at 1665 cm-'. The shift in the peaks in NaOD in
cornparison to triethylarnine is due to the formation of sodium salts of the endiolate ions.
More alkene bands are detected in the presence of the basic catalysts triethylamine and
NaOD than in the presence of the acid catalyst DCI since bases are more effective catalysts
of enolization.
An attempt was made to contrast the effect of acid-base catalyzed enolization of 1-
hydroxyacetone due to triethylamine in the aprotic solvent acetonitrile and the protic
solvent D20. As tabulated in section 4.2 (Table l), acetonitrile causes solvent interference
in the region assigned to alkene absorption as the result of a srnall but wide peak between
1664-1600 cm-'. However when the solvent spectrum was subtracted fiom the sample
spectrurn no absorption was detected in the alkene region. This is explained by the fact
that in water hydrogen bonds serve to stabilize the enediols (Yaylayan and Ismail, 1995).
Althoush both water and acetonitrile are polar, the acetonitrile lacks a functional group
that can serve as a proton donor in hydrogen bonding.
Silylation of 1 -hydroxyacetone by the action of trimethylchlorosilane under alkaline
conditions can be used to trap any alkene structures present (Scheme 14). The reaction of
t~methylchlorosilane with each of the hydroxyl groups of the enediol (2) yields the

Scheme 14: Silylation of 1 -hydroxyacetone with trirnethylchlorosilane
monosilylated structures (@) and (20). In the presence of excess trimethylchlorosilane al1
possible hydroxyl groups would be silylated producing the disilylated structure (a). Only
the cis form of structure (a) is shown in Scheme 14. The di01 (4) resulting fiom the 2,3
enoiization of (1) can react with excess of trimethylchlorosilane to produce the disilylated
structure (22). However, one would expect that 1,2 enolization to form the more
substituted alkene (2) would be more favorable than 2,3 enolization yielding the alkene
(4).
Silylation of the hydroxyl group is irreversible and over time in the presence of an
excess amount of ti-imethylchlorosilane there should be an accumulation of these trapped
derivatized alkenes. The data collected in the time run analysis of the reaction indicated a
decrease in absorption at 1714 cm-' (assigned to the carbonyl group) and an increase at
1699 cm-' (assigned to the silylated enediol group) at successive 10 minute intervals. This
confirms that as the enediol is trapped by silylation the amount of carbonyl present
decreases in an atternpt to balance the enolization equilibrium. The inspection of the
region between 1800-1 600 cm-' revealed that acetonitrile shows a broad absorption band
in 1664-1600 cm-' region and no absorptions were detected due to either triethylamine or
trimethylchlorosilane. However, since successive spectra were compared, any solvent
interference would be constant.
5.2.4. Effect of Temperature on Enolization
The acid-base catalyzed enolization of 1-hydroxyacetone is observed in DCI and
NaOD solutions as well as in triethylamine (Table 1). The effect of temperature was
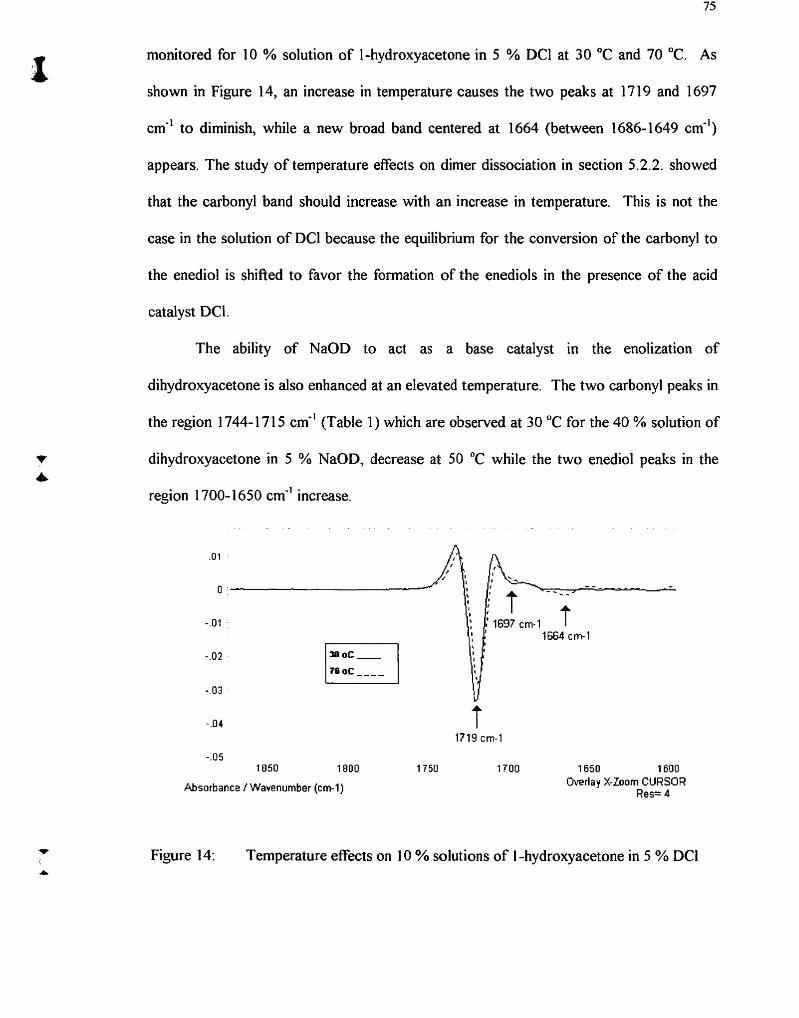
monitored for 10 % solution of 1-hydroxyacetone in 5 % DCl at 30 O C and 70 OC. As
shown in Figure 14, an increase in temperature causes the two peaks at 17 19 and 1697
cm" to diminish, while a new broad band centered at 1664 (between 1686-1649 cm-')
appears. The study of temperature effects on dimer dissociation in section 5.2.2. showed
that the carbonyl band should increase with an increase in temperature. This is not the
case in the solution of DCI because the equilibriurn for the conversion of the carbonyl to
the enediol is shified to favor the formation of the enediols in the presence of the acid
catalyst DCI.
The ability of NaOD to act as a base catalyst in the enolization of
dihydroxyacetone is also enhanced at an elevated temperature. The two carbonyl peaks in
the region 1 744- 171 5 cm-' (Table 1) which are observed at 30 O C for the 40 % solution of
dihydroxyacetone in 5 % NaOD, decrease at 50 O C while the two enediol peaks in the
region 1 700- 1 650 cm-' increase.
Absorbance t Wavenumber (cml)
Figure 14: Temperature effects on 10 % solutions of 1 -hydroxyacetone in 5 % DCl

Chapter 6
Monitoring Carbonyl-Amine Reactions
6.1 Introduction
The interaction of a reducing sugar with an amino compound, can be monitored by
studying the changes observed in the carbonyl region (1800-1700 cm-') of the infi-ared
spectra. Detection of the key intermediates ARP and HRP, formed by Amadori or Heyn's
rearrangements, can be used as an indication of the progress of the Maillard reaction.
The kinetics of the initial stage (Scheme 15) of a carbonyl-amine reaction can be studied in
a mode1 system by monitoring the carbonyl region of a C3 reducing sugar or its derivative
with an amino compound. In the presence of excess amine, the rearrangement product
can react fùrther to fonn an enediamine as shown in Scheme 15.
11-c-011 il
ençdiol c - 0 1 1 1 R
AKI'
<INR',
t IRP
C-NK', I
Scheme 1 5: Initial stage of the Maillard reaction of C; reducing sugar analogs
K - CI 1, ( I -1iydrosyaccioiic) K

The initial attempt to investigate the reaction between glyceraldehyde and glycine,
using commercially available [ " ~ ] ~ l ~ c i n e to monitor the effect of isotopic substitution in
the imine region (1690-1635 cm"), was not successfùl due to the interference of the
strong carboxylate band of glycine (Scheme 1 6).
C = O I
H,COI 1
h a d o r i Kcarrangemcnt Product (AR 1')
Schiff Rase
2 7
I-IL = N - CE1,COOI 1 I CH- 01 1 iminc
I
Scheme 1 6: Glyceraldehyde-glycine rearrangernent mechanism

Modifications using analogous reacting species were made in order to optimize
this carbonyl-amine mode1 system. Acetol (1-hydroxyacetone) and pyrrolidine were
chosen on the basis of the following criteria:
Since both these reagents are liquids there is no need for the use of solvents
such as H20, DzO, acetonitrile or dioxane which can interfere due to hydration
effects or the appearance of overlapping absorption bands
The pyrrolidine acts both as a diluent and as a base catalyst as well as being a
nucleophile.
Since pyrrolidine is a secondaty amine it is less reactive than a primary amine.
It is easier to monitor the kinetics of a chemical reaction if it is slowed down.
The use of pyrrolidine eliminates the interference of the carboxylate band that
covers the enediol region, due to proline.
The reaction involving both the okdehydo and kero forms of 1-hydroxyacetone with
pyrrolidine to form the HRP and ARP rearrangement products is shown in Scheme 17.
Since equimolar concentrations of reactants were used, furîher reaction of the AHRPs to
form an enediamine is not expected. On the basis of the proposed reaction mechanism in
Scheme 17, peaks may be detected in the alkene regjoion due to unreacted enediol(2) or the
alkenes ( 2 l ) and (22) pprduced by enolization of the rearrangement products.
To estimate the initial rate of this reaction, experiments were performed both at
room temperature and below room temperature. As demonstrated below, the reaction
between pyrrolidine and acetol is quite fast and could only be observed at -2 O C . It is
estimated that the reaction at this temperature is over in around 6 minutes.


In expenment 1, the ice-cooled reagents (-2 "C) were added to a vial, vortexed for
20 seconds and a sample removed for time-run analysis. At the lower temperature,
dissociation of the dimeric 1 -hydroxyacetone and subsequent enolization of the monomers
present should be hindered. Dilution of the 1-hydroxyacetone to 50 % in pyrrolidine is
achieved by vortexing. This should cause dissociation of the dimer as well as the initiation
of the carbonyl-amine reaction.
In experiment II the reagents were added to a vial at room temperature (27 OC),
vortexed and a sample removed for time-run analysis. At the time of the first scan, the
monorneric 1-hydroxyacetone has reacted to a greater extent than in Experiment 1, due to
temperature differences.
In experiment III, the reagents at room temperature were added directly to the IR
cell; I -hydroxyacetone first followed by pyrrolidine which formed a layer on top. Without
vortexing, the rate of the pyrrolidine reaction is limited by the rate of diffusion. lt is
expected, in this case, that upon dissociation the keto monomer shouId react imrnediately
with the pyrrolidine, preventing enolization to proceed to produce the aldehydo forms.
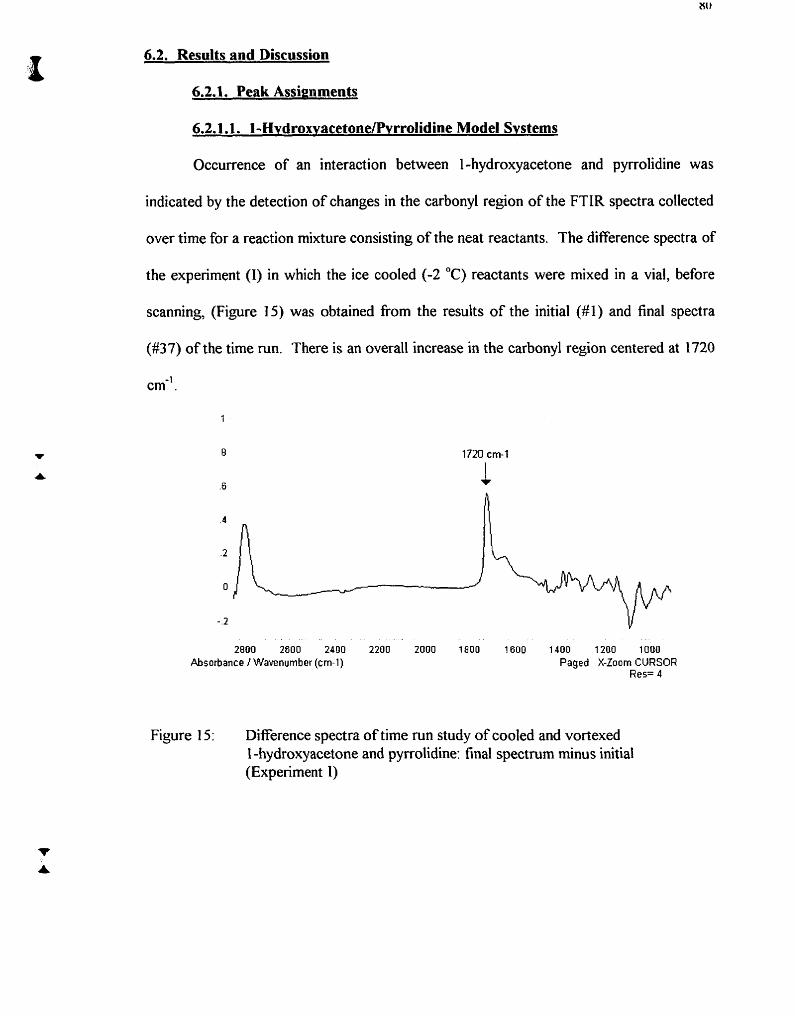
6.2. Results and Discussion
6.2.1. Peak Assimments
6.2.1.1. I -HydroxvacetonelPvrrolidine Mode1 Svstems
Occurrence of an interaction between 1-hydroxyacetone and pyrrolidine was
indicated by the detection of changes in the carbonyl region of the FTIR spectra collected
over time for a reaction mixture consisting of the neat reactants. The difference spectra of
the experiment (1) in which the ice cooled (-2 "C) reactants were mixed in a vial, before
scanning, (Figure 15) was obtained fiom the results of the initial (#1) and final spectra
(#37) of the time run. There is an overall increase in the carbonyl region centered at 1720
cm" .
2800 2600 2400 2200 2000 1800 1600 1400 1200 1000 Absorbante I Wavenumber (cm-1) Paged X-Zoom CURSOR
Res= 4
Figure 15: Difference spectra of time run study of cooled and vortexed 1 -hydroxyacetone and pyrrolidine: final spectrum minus initial (Experirnent 1)

The second derivative of the time run spectra, collected every 2 minutes, indicate
that the observed changes in the carbonyl region are very fast (FigureIo). Initially
(spectrum #1) the ketone (1, 1728 cm") and aldehyde (1, 1710 cm') isomers of 1-
hydroxyacetone are present in the reaction mixture. In spectrum #3, the resulting ARP
(Z) (a ketone) and HRP (l9) (an aldehyde) appear at 1724 and 17 12 cm-', respectively.
1750 1740 1730 1720 1710 17DO Absorbante / Wavenumber (cm-1)
1690 1680 Overlay X-Zoom CURSOR
Res= 4
Figure 16: Second derivative spectra of the reaction of cooled and vortexed 1-hydroxyacetone and pyrrolidine - tirne run spectra (Experiment 1)
A small amount of D20 was added to the reaction via1 afker the final spectrum had
been collected, in an attempt to ver@ the assignment of the aldehyde (l9) peak in the
product. The amount of water added was srna11 enough to contribute to a dilution factor
of only 15 %. As shown in Figure 17, the aldehyde peak disappears due to hydration and

only the ketone (20) peak at 1719 cm-' is observed. This peak is shifled to a lower
wavenumber due to hydrogen bonding. Figure 17 also shows the increase in the peak
centered at 1650 cm' and the appearance of a new peak at 1595 cm-'. The presence of
the 1650 cm-' peak, in the alkene region, rnay be due to the eneaminol (a) or (z) formed
by the enolization of the rearrangement products (I9) and (20). The new peak detected at
1595 cm-' could arise fiom the carboxylate ion of the carboxylic acid produced by the
oxidation of the aldehyde.
-.O3 1724 cm-1 1712 cm-1 l 171 9 cm-1
- 04 1800 1750 1700
Absorbance I Wavenumber [cm-1) 1600 1550
Overlay X-Zoom CURSOR Res= 4
Figure 17: Second derivative spectra of the reaction of cooled and vortexed 1 -hydroxyacetone/pyrrolidine reaction product + D20 (Experiment 1)

Absorbaoce I Wavenumber (cm-1) Overlay X-Zoom CURSOR Reç= 4
Figure 18: Second derivative spectra of the reaction of cooled and vortexed 1 -hydroxyacetone/pyrrolidine reaction product + DzO (Experiment 1)
An additional change in the time run spectra of the 1 -hydroxyactone/pyrrolidine
reaction in the 2800 cm-' region was observed (Figure 15). The change at 2808 cm" is
possibly due to the appearance of the doublet which is known to appear at 2820 and 2720
cm-' due to CH stretching of the aldehyde (o). Further evidence that the peak at 2808
cm-' is due to the aldehyde (HRP) (o) formed is the effect of added water to the reaction
via1 (Figure 18). Upon addition of DzO, the peak at 2808 cm-' is diminished. Hydration
of the aldehyde would account for a drop in intensity of this aldehyde peak although it was
not possible to detect any changes due to OH or OD groups of the hydrated aldehyde. It
is also possible that the dilution, by a factor of 15 %, due to the addition of the water
could cause the aldehyde peak to diminish to a small extent.
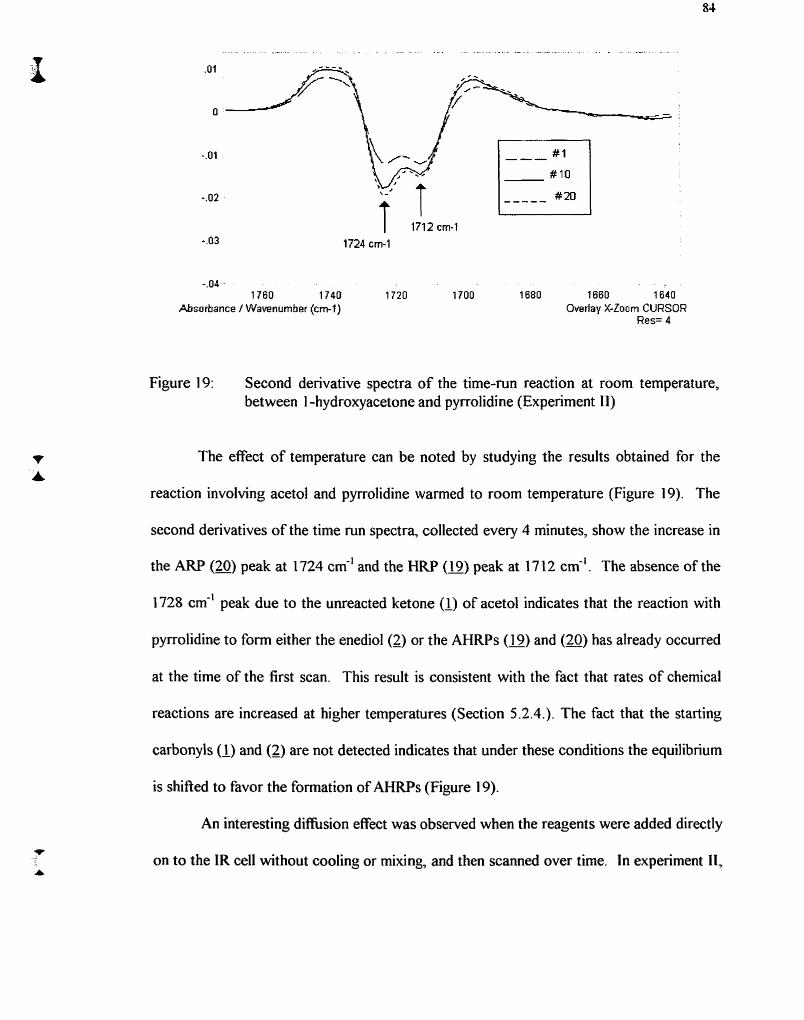
1680 1660 1640 Overiay X-Zoom CURSOR
Res= 4
Fiyre 19: Second derivative spectra of the time-run reaction at room temperature, between 1 -hydroxyacetone and pyrrolidine (Experiment II)
The effect of temperature can be noted by studying the results obtained for the
reaction involving acetol and pyrrolidine wanned to room temperature (Figure 19). The
second derivatives of the time run spectra, collected every 4 minutes, show the increase in
the ARP (a) peak at 1724 cm-' and the HRP (l9) peak at 17 12 cm-'. The absence of the
1728 cm-' peak due to the unreacted ketone (1) of acetol indicates that the reaction with
pyrrolidine to form either the enediol(2) or the AHRPs (o) and (20) has already occurred
at the tirne of the first scan. This result is consistent with the fact that rates of chernical
reactions are increased at higher temperatures (Section 5.2.4.). The fact that the starting
carbonyls (1) and (2) are not detected indicates that under these conditions the equilibrium
is shifted to favor the formation of AHRPs (Figure 19).
An interesting difision effect was observed when the reagents were added directly
on to the IR ce11 without cooling or mixing, and then scanned over time. In experiment II,
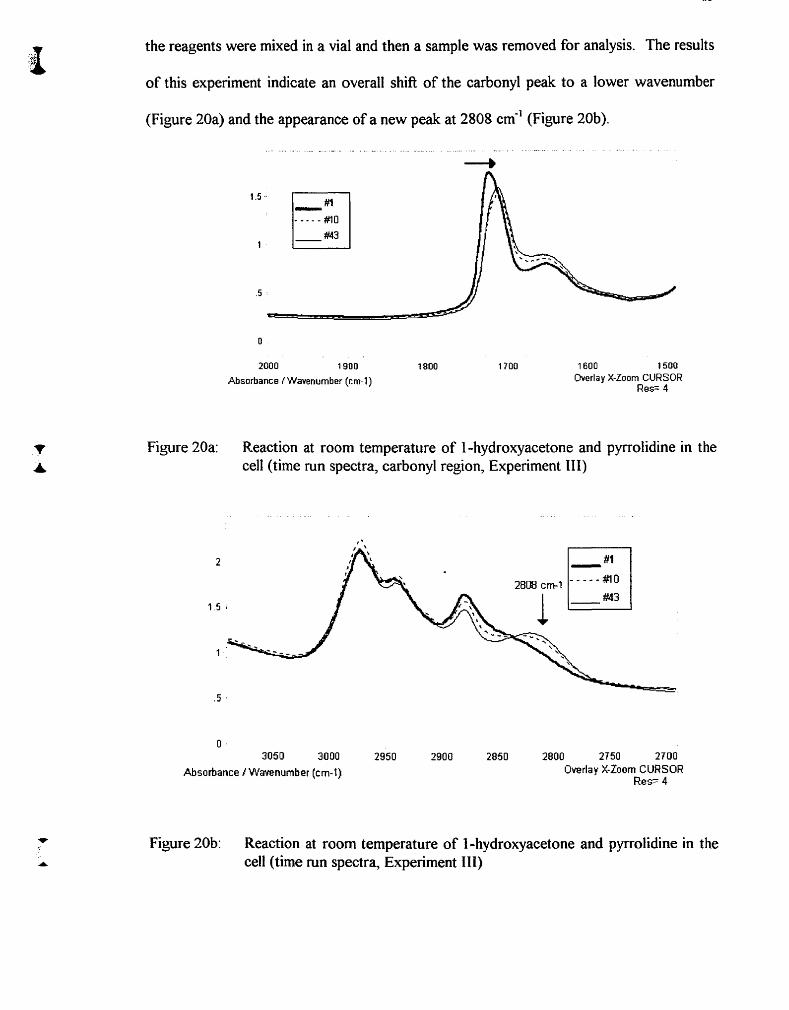
the reagents were mixed in a via1 and then a sample was removed for analysis. The results
of this experiment indicate an overall shifk of the carbonyl peak to a lower wavenumber
(Figure 20a) and the appearance of a new peak at 2808 cm-' (Figure 20b).
2000 1900 1800
Absorbance / Wavenumber (cm-1)
1700 1600 15UO Overlay X-Zoom CURSOR
Res= 4
Figure 20a: Reaction at room temperature of 1-hydroxyacetone and pyrrolidine in the cell (time run spectra, carbonyl region, Experiment 111)
O 3050 3000 2950 2900 2850 2800 2750 2700
Absorbante / Wavenumber (cm-1) ûverlay X - h m CURSOR Re= 4
Figure 20b: Reaction at room temperature of 1 -hydroxyacetone and pyrrolidine in the ceIl (tirne mn spectra, Expenment III)

The second derivatives obtained fiom the spectra of the above reaction (Figure 2 1)
indicate the presence of a large peak due to the ketone monomer (1) at 1728 cm" and a
small peak at 17 10 cm-' due its aldehydo form (3). Over time, the peak at 1728 cm"
decreases while a new peak appears at 171 2 cm-'. Under these reaction conditions the
dirneric form (Scheme 17) of acetol dissociates into the ketone (1, 1728 cm-') in the
presence of pyrrolidine, which reacts to form the HRP (l9) indicated by the appearance of
a peak at 1712 cm? These spectra show the immediate reaction of pyrrolidine with the
ketone (1) to form (o). Due to the diffusion effect, the rate of the amine reaction
becomes faster that that of enolization. As a result, the limited keto monomer which is
present reacts preferentially with pyrrolidine to fom the HRP (o). This explains the fact
that in the final scan the intensity of the peak at 1724 cm-' is almost equal to that of the
1712 cm'' peak. These results are different than those obtained for the final scan of the
initially vortexed reaction (Experiment 11, Figure 1 9) in which the signal at 1 724 cm" for
the ARP (20) is greater than for the HRP (l9) at 1712 cm-'.
The results of these three experirnents with acetol and pyrrolidine under different
temperature and mixing conditions allow for the cornparison of their effect on equilibrium.
At lower temperature, dissociation and enolization are hindered, thus the initial rate of
formation of the HRP (i9, 17 12 cm") is greater under the conditions of experiment 1 than
at an elevated temperature in experiment II. Under the sarne conditions of temperature,
mixing can affect the efficiency with which enolization occurs. Mixing enables the
pyrrolidine to be miscible and hence exert its catalytic effect on enolization. As a result, in
experiment 11 more of the aldehydo form (3, 1710 cm-') is present initially than in

experiment 111 . This results in a higher average rate of formation of ARP (20, 1724 cm")
under the conditions of experiment 11.
-.O4 1728 cm-1 1712 cm-1
1724 cm-1
1780 1760 1740 1720 1700 Absorbance / Wavenumber (cml)
1640 1620 Oveday X-Zoom CURSOR
Res= 4
Figure 2 1 : Second derivative spectra of the reaction of room temperature 1 -hydroxyacetone and pyrrolidine in ceIl - time run spectra (Experiment III)
6.2.1.2. Glvceraldehvde/Glvcine Mode1 Svstem
Some difficulties were experienced in preparing the concentrated glyceraldehyde
solution (57 % in D20). The solution had to be heated in order to dissolve the
glyceraldehyde. Upon cooling the glyceraldehyde remained in solution. Attempts to use
other solvents were not successful as glyceraldehyde is not soluble in acetonitrile and the
carbonyl peak is not observed for glyceraldehyde in DMSO, at room temperature.
The intensity of the carbonyl peak in the resulting spectra of the reaction mixture
in DzO is small (Figure 22). The dissociation of the glyceraldehyde dirner solution is small

due to the stability of the hemiacetal bonds of the dimer (Kobayashi et al., 1976). Only
one carbonyl peak was observed at 1732 cm-' which is assigned (Table 2) to the ketone
isomer of glyceraldehyde (18). The aldehyde (l6) peak is hydrated in aqueous solution
(Hall and Knowles, 1975). The results in Figure 22 also show that the intensity of the
carbonyl peak at 1732 cm-' is too small in cornpanson to the peak of the carboxylate
group of the amino acid at 1620 cm-'. The adjustment of the mole ratio of glyceraldehyde
to glycine fiom 1 : 1 to 2: 1 did not provide beneficial results (Figure 22).
4
2:l mol
1:1 mol - I
1800 1700 1600 1500 1400 1300 1200 1100 ID00 Abcmrbanco l Wavenumber (cm-1) Overlay X-Zoorn CURSOR
Res= 4
Figure 22: Glyceraldehyde-glycine reaction in D20
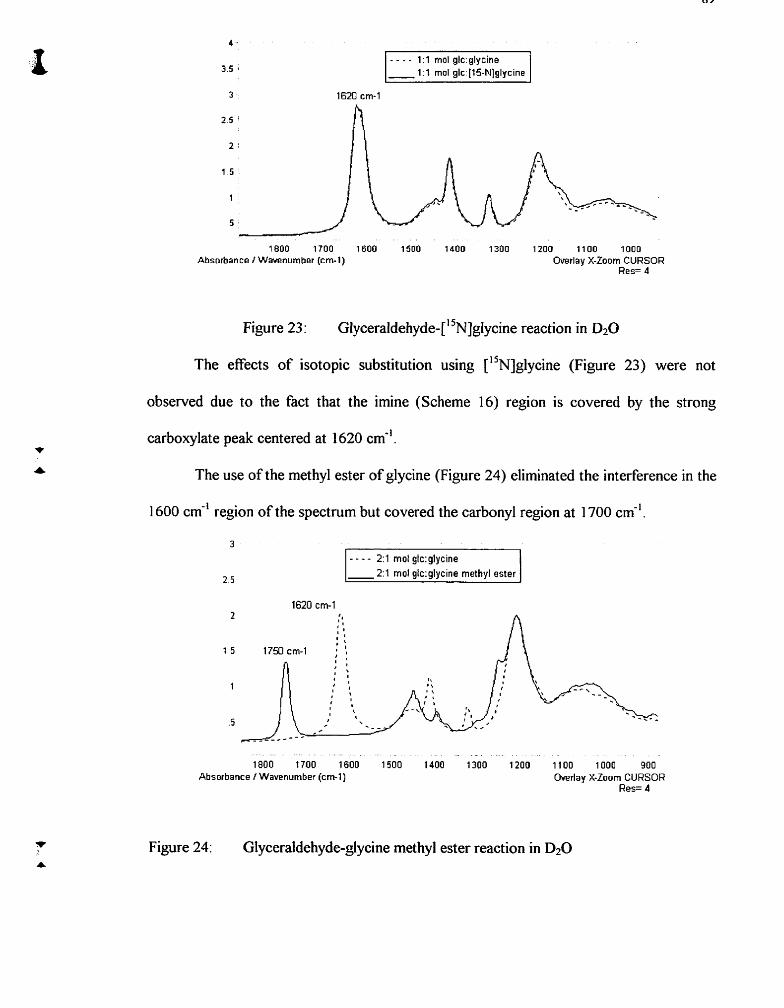
- - - - 1 : 1 mol glc: glycine 1 :1 mol glc.[l5-Nlglycine 1
l e00 1700 1600 1500 1400 1300 1200 1100 1000 Absorbance I Wavenumber (cm-1) Oirerlay X-Zoom CURSOR
Res= 4
Figure 23: ~l~ceraldeh~de-['~~]~l~cine reaction in DzO
The effects of isotopic substitution using [lS~]glycine (Figure 23) were not
observed due to the fact that the imine (Scheme 16) region is covered by the strong
carboxylate peak centered at 1620 cm".
The use of the methyl ester of glycine (Figure 24) eliminated the interference in the
1 600 cm-' region of the spectrum but covered the carbonyl region at 1 700 cm".
- - - - 2:1 mol glc:glycine
2:l mol g1c:glycine methyl ester
- - 1800 1700 1600 1500 1400 1300 1200 1100 1000 900
Absorbance / Wavenumber (cm-1) Overlay X-Zoom CURSOR Res= 4
Figure 24: Glyceraldehyde-glycine rnethyl ester reaction in D20
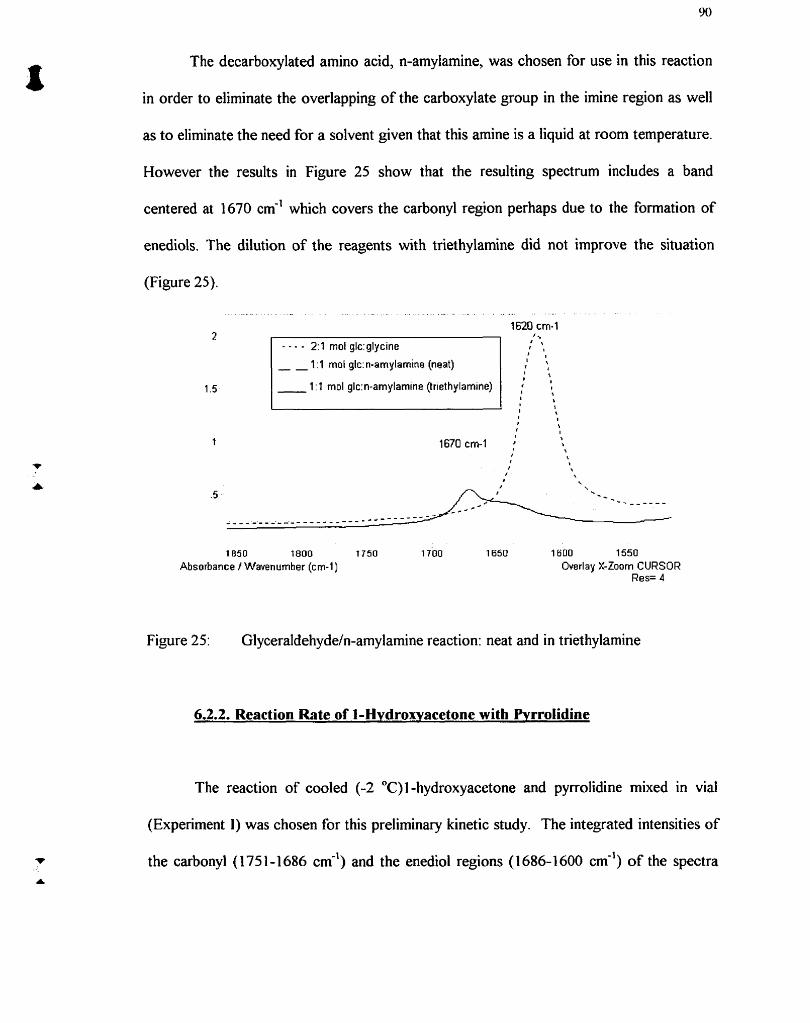
The decarboxylated amino acid, n-amylamine, was chosen for use in this reaction
in order to eliminate the overlapping of the carboxylate group in the imine region as well
as to eliminate the need for a solvent given that this amine is a liquid at room temperature.
However the results in Figure 25 show that the resulting spectmm includes a band
centered at 1670 cm-' which covers the carbonyl region perhaps due to the formation of
enediols. The dilution of the reagents with triethylamine did not improve the situation
(Figure 25).
.- - - 1620 cm-1
2 ' \
1
' 9
1.1 mol glc: n-amy lamine (neat) 1 \
', 1.5
1850 1800 1750 1 7'00 165U 16'00 1550 Absorbance / Wavenumber (cm-1) Overlay X-Zoom CURSOR
Res= 4
Figure 25: Glyceraldehyde/n-arnylamine reaction: neat and in triethylamine
6.2.2. Reaction Rate of 1-Hvdroxvacetone with Pvrrolidine
The reaction of cooled (-2 OC)l-hydroxyacetone and pyrrolidine mixed in via1
(Experirneni 1) was chosen for this prelirninary kinetic study. The integrated intensities of
the carbonyl (1751 -1686 cm-') and the enediol regions (1 686-1600 cm-') of the spectra

showed a steady increase over the course of the reaction in the overall intensity of both
bands (Figure 26a and 26b). The piots in Figure 26a and 26b are based on the results of
the first 40 minutes of the time run. No change in this trend was observed for the
remaining 32 minutes of the experiment.
The neat sample of 1-hydroxyacetone used in this reaction has a high
concentration of dimer. After mixing with the pyrrolidine, the kero (lJ and the aktkhydo
(3) monomers are detected in the reaction mixture (Section 6.2.1.1 .). Upon reaction with
the pyrrolidine the formation of the ARP (î0) and HRP (l9) is also detected in the
reaction mixture (Section 6.2.1.1 .). Despite the fact that the carbonyls (1) and (3) are
consurned an increase is observed in the intensity of the total carbonyl band as a result of
the formation of the ARP (20) and HRP (l9) (Figure 26a).
Cooled and mixed >r I=
1 -hydroxyacetone and pyrrolidine II> c (Experiment 1) 01 = 25.0 -j -
O 4 8 12 16 20 24 28 32 36 40
time (min)
Fisure 26a: Variation of the intensity of the carbonyl region (1 75 1- 1686 cm") with time

Cooled and mixed l-hydroxyacetone and pynolidine
(Experiment 1)
tirne (min)
Figure 26b: Variation of the intensity of the enediol region ( 1686-1600 cm") with time
The presence of the enediol (2) or the enaminols (a) and (22) can contribute to
the 1650 cm1 peak observed in the enediol region. However? the enediol (2) should not
accumulate durinç the course of the reaction. The enarninols, on the other hand should
increase in concentration during the same period. The difference spectrum in Fisure 15
shows that an increase in the carbonyl-enediol resions is accompanied by a decrease in the
region between 1400- 1000 cm". The largest decrease was detected at 1 100 and 1020 cm'
1 . These bands could be the outcome of the losses related to C-O stretching vibrations
which would occur as the rearrangement products are fomed.
The second denvative spectra of the cooled 1 -hydroxyacetone/pyrroIidine reaction
initiated in the via1 (Figure 27) indicated the presence of two peaks (Section 6.2.1.1 .).
The plot of the integrated peak heights against time (Figure 27) showed an overall
increase over time in both carbonyl peaks. The initial rate of formation of the ARP (20) at
1724 cm-' is slower than that of the HRP (l9) at 17 12 cm-'. M e r 12 minutes the rate of
formation of the ARP becomes greater than that of the HP. At the beginning of the

reaction the pyrrolidine reacts quickly with the keio monorner (1) to produce the HRP
(o) at 1712 cm-'. The pyrrolidine also assists in the base catalyzed enolization of the k m
monomer (1) to yield the aldehydo monomer (3). The reaction of pyrrolidine with the
aldehyde is preferred over the reaction with the ketone for s t e k reasons. The
consumption of the aldehyde shifts the enolization equilibrium in the direction of the
formation of more aldehyde which reacts quickly with the pyrrolidine to produce more
HRP (20). Hence, in the first 12 minutes the HRP accumulates at a faster rate than the
ARP. Once the ketone is consumed in the first 12 minutes of the reaction the formation of
the HRP (20, 1724 cm-') exceeds that of the ARP (l9, 17 12 cmm1).
Cooled and vortexed 1 -hydroxyacetone and pyrrolidine
(Experiment 1)
O 4 8 12 16 20 24 28 32 36 40
tirne (min)
Figure 27: Variation of the intensity of the ARP and HRP associated peaks with time
The distinction between the carbonyl peaks of the reacting a-hydroxycarbonyls (1)
and (3) and the rearrangement products (l9) and (z) is only visible in the second
derivative spectra and not in the original time run spectra. If the integrated areas are
measured for each carbonyl peak in the spectra of the time run analysis the molar

absorptivity value of the carbonyl band of 1-hydroxyacetone which was calculated in
Section 4.3.2. could be used to determine the concentration of each carbonyl species
present in the reaction mixture as well as a rate of reaction.
Modifications could be made to the reaction conditions in order to monitor the
disappearance of the reacting carbonyls and the appearance of the AHRPs. The reaction
occurs too quickly at room temperature when the reagents are rnixed to detect the loss of
the 1 -hydroxyacetone. The results obtained with the cooled reactants applied directly to
the ce11 window produced some evidence of the loss of the reacting monomers however
more detaiied kinetic studies could be undertaken if the reaction is slowed down or the
scans collected more frequently.
6.2.3. Svnthesis of Rearraneement Products
The spectrurn of the crystalline product of the reaction of glyceraldehyde and
proline dissolved in D20 is shown in Figure 28. The single carbonyl peak observed at 1743
cm-' can be assigned to a ketone structure (ARP) since any aldehyde would be hydrated in
the presence of water.
The precipitates collected in the reactions of acetol and proline were difficult to
recrystallize and consisted mainly of unreacted proline. Although the reaction produces a
yellow color and an odor of butter popcorn, the ARP could not be isolated. The odor
producing substance would probably not be abundant (based on the 7.5 5% yield of
glyceraldehyde and proline) and may be volatilized with any solvents used in the synthesis.

The effects due to polymerization of the rearrangement product may also interfere with
the formation and isolation of any ARP formed.
- . .. . ,- -
O 3500 3000 2500 2000 1500 1000
Absorbance I Wavenumber (cm-1) Overlay X-Zoom CURSOR Res= 4
Figure 28: Glyceraldehyde/proline crystalline product in DzO

Chapter 7
Conclusion
The use of FTIR in this study of the Maillard reaction provided a valuable means
of analysis of the mechanism by which the key intermediate Amadon and Heyn's
rearrangement products are forrned. The results obtained were both qualitative and
quantitative. The carbonyl and enediol peak assignments discovered for 1 -hydroxyacetone
and the other analogous C3 reducing sugars which were chosen for this investigation
allowed for the recognition of the changes that take place in a carbonyl-amine reaction.
The influence of solvent and temperature in the behavior of these reducing sugars is also
an important factor in the Maillard reaction. The knowledge of the role of solvent and
temperature can be used to optimize the reactions conditions for future situations in food
research and food processing. The calculated value for the molar absorptivity of the
carbonyl band of 1 -hydroxyacetone can be usefiil in the determination of the concentration
of carbonyl functional groups present in a sample.
The principle material investigated in this study was 1 -hydroxyacetone. The
rationale for this choice was based on the goal of using an a-hydroxycarbonyl which
would remain in the open chain form and not cyclize. For the larger reducing sugars there
is only a small amount of the open chain form nomally present. The reduced intensity of a
carbonyl group would hinder this FTIR study regarding the changes occumng in the
region. Water was selected as the solvent in rnany of the experiments since in the cooking
process the Maillard reaction occurs in an aqueous environment. However, in some cases

it was advantageous to study a carbonyl-amine reaction without a solvent and 1-
hydroxyacetone was an ideal choice since it is a liquid at room temperature.
The results of this work show that FTIR is a tool which can be used as a method
for the rapid of identification of the changes which can occur in the absorbing groups of a
compound in a chernical reaction. This technique also is useful in comparative studies
between related substances. The experimental parameters developed in this study could
be used to conduct kinetic analysis and calculate rate constants of the reactions.
References
Acharya, A. S.; Sussman, L. G.; Manning, J. M., Schiff Base Adducts of Glyceraldehyde with Hemoglobin, J. Xiol. Chem., 1983, 258(4), 2296-2302.
Adrian, J., Nutritional and Physiological Consequences of the Maillard Reaction, WorId Re\< Ntrtr. Dietelics, 1974, 19, 7 1-1 22.
Allian, M., Berelle, E., Ugliengo, P., Spano, G. and Gamone, E., Infiared Spectroscopy Study of the Adsorption of Carbonyl Compounds on Severely Outgassed Silica - Spectroscopic and Thermodynamic Results, Latgmirir, 1995, 1 1(12), 48 1 1-48 17.
Ashoor, S.H. and Zent, J.B., Maillard Browning of Common Amino Acids and Sugars, .l. Food SC., 1 984,49, 1 206- 1 207.
Baisier, W.M. and Labuza, T.P., Maillard Browning Kinetics in a Liquid Mode1 System, .J. Agr. Food Chem., 1992,40(5), 707-71 3.
Baltes, W., Chemical Changes in Food by the Maillard Reaction, I;ood ('hem., 1982; 9: 59-73.
Barnes, W., Spingarn, N.E., GaMe-Gould, C., Vuolo, L.L., Wang, Y.Y. and Weisburger, J.H., Mutagens in Cooked Foods: Possible Consequences of the Maillard Reaction, in Thr Mnillnrd lteactiot~ i t ~ fio& m d N~ltritiotz Waller, G. R. and Feather, M. S., Eds., ACS Symp. Senes No 2 15, Washington, D.C: ACS 21 5, 1983,485-506.
Bedinghaus, A.J. and Ockerman, H.W., Antioxidative Maillard Reaction Products From Reducing Sugars and Free amino Acids in Cooked Ground Pork Patties, ./. Food Sc., 1 995, 60(5), 992-995.
Burton, H.S. and McWeeny, D.J., Nonenzymatic Browning Reactions: Condensation of Sugar Stability, Natirre, 1963, 197, 266-268.
Burton, H.S. and McWeeny, D.J., Non-Enzymatic Browning: Routes to the Production of Melanoidins from Aldoses and Amino-Compounds, ('hem. Id., 1964; 462-463.
Christian, G., Amly/icd Chemistry, John Wiley and Sons, New York, 1994,438.
Davidek, J., Velisek, J. and Pokorny, Chernical Chcu~ges Wrring Food Pt-ocessitg Dev. Food Sc. 2 1, Elsevier, New York, 1990, 123.
Fuller, M.P., Gary, M.C. and Stanek, Z., An FTIR liquid analyzer, Am. Irih., 1990, 22, 58-69.

Gi, U. S. and Baltes, W ., Model Reactions on Roast Aroma Formation. 14. Formation of 2-Acetylpyrido[3,4-cI]imidazole by Heating of Glucose with Histidine, .!. Agric. Food Chem., 1993,4 1,644-646.
Griffiths, P. R. and de Haseth, J .A., fitrrier Transform It,frned Sprc~rometry, John Wiley and Sons, New York, 1986,249.
Guillen, M.D, and Manzanos, M.J., Study of the Components of a Solid Smoke Flavouring Preparation, Food Chem., 1 996, 5 5(3), 25 1 -257.
Hadzi, D., Characteristic Features in the Spectra of Organic Molecules, in hfrn-red Specmcopy and MolecziIarStr1~c?t~re, Davies, M., Ed., Elsevier, New York, 1963, 226- 269.
Hall, A. and Knowles, J.R., The Uncatalyzed Rates of Enolization of Dihydroxyacetone Phosphate and of Glyceraldehyde 3-Phosphate in Neutra1 Aqueous Solution. The Quantitative Assessrnent of the Effectiveness of an Enzyme Catalyst, Riohernzstry, 1975, 14(19), 4348-4352.
Hallam, H E , Hydrogen Bonding and Solvent Effects, in It~frared Spcc?roscopy a d MoleoilarSlrtrcrtrre, Davies, M . , Ed., Elsevier, New York, 1 963, 405-440.
Hamilton, D.S. and Creighton, D.J., Inhibition of Glyoxalase 1 by the Enediol Mimic S-(N- Hydroxy-N-methylcarbamoyl)gluathione: The Possible basis of tumor-Selective Anticancer Strategy, .l. Biol. C h . , 1992,267, 24933-24936.
Hodge, J.E., Chemistry of Browning Reactions in Model Systems, .l. Agric. I;ood. Chcnt., 1 953; 1 : 928-943.
Holmes, A.W., Chernical and Physical Changes During Food Processing, in l'roceedîtzgs SOS/70 7Aird Irzfen~atiot~n/ (hrgresd Food Scie,lce a d ï e c h t d o ~ , Stewart, G. F . and Willey, CL., Eds.,Institute of Food Technologists, Washington D.C., 1970, 604-61 2.
Huyghues-Despointes, A. and Yaylayan, V. A., A multidetector HPLC system for the analysis of Amadori and other Maillard reaction intermediates, F.ood Chem., 1994, 51, 109-1 17.
Kaanane, A. and Labuza, T.P., The Maillard Reaction in Foods, in ;The MailIardI<eoctio~l hl Aghg L>inhrtrs ntd NtrMtim, Baynes J. W . and Monnier, V.M., Eds., A. R. Liss Press, New York, 1989, 301 -327.
Kato, Y., Matsuda, T., Kato, N. And Nakoamura, R., Browning and Protein Polymerization Induced by Amino-Carbonyl Reaction of Ovalbumin with Glucose and Lactose, J. A@c. fi+md Chem., 1988, 36,806-809.

Kauppinen, J.K., Moffat, D. J., Mantsch, H.H. and Cameron, D.G., Fourier Transforms in the Computation of Self-Deconvolved and First-Order Derivative Spectra of Overlapped Band Contours, And. Chem., 198 1,53(9), 1454- 1457.
Kobayashi, Y., Igarashi, T., Takahashi H. and Higasi, K., Infiared and Raman Studies of the Dimeî-ic Structure of 1,3-Dihydroxyacetone, D(+)- and DL-Glycerladehyde, .J. Mol. SWuct., 1976, 3 5 , 85-99.
Labuza, T.P., Interpreting the Complexity of the Kinetics of The Maillard Reaction, in Maillard Reactions irr Chemistty, Food and He&, Labuza, T . P., Reineccius, G. A., Monnier, V., O'Brien, J. and Baynes, J., Eds., Royal Soc. of Chem., Cambridge, 1994, 176-181.
Labuza, T.P. and Baisier, W.M., The Kinetics of Nonenzymatic Browning, in Physical Chentistry qf Foo& Schwartzberg, H.G. and Hartel, R.W., Eds., Marcel Decker, New York, 1 992, 595-649.
Labuza, T.P. and Saltmarch, M., Kinetics of Browning and Protein Quality Loss in Whey Powders During Steady State and Nonsteady State Storage Conditions, .J. Food Sc.. 198 1, 47,92-96.
Ledl, F., Chemical Pathways of the Maillard Reaction, in The Maillord Reaction hl Food Pmssitrg, H~matt Nii».itim atrd Phy.rio/ogy, Finot, P.A., Aeschbacher, H. U., Hurrell, R. F. and Liardon, R., Eds., Birkhauser Verlag, Basel, 1990, 19-42.
Ledl, F. and Schleicher, E., New Aspects of the Maillard Reaction in Foods and in the Human Body, Ar~gew. Chem. h t . (Etrgf. W.), 1990, 29(6), 565-706.
Massaro, S.A. and Labuza, T.P., Browning and Amino Acid Loss in Mode1 Total Parenteral Nutrition Solutions, .l. Food Sc., 1 990, 55(3), 82 1 -826.
Mauron, J., The Maillard Reaction in Food; A Critical Review fi-om the Nutritional Standpoint, Prog. Food Ntrtri. Sci., 198 1 ; Vol. 5: 5-3 5.
Maillard, L.C., Action des acides aminés sur les sucres; formation des mélanoidines par voie methodique, Comt>ul. Rrrld, 1 9 1 2,154,66.
Monnier, V.M., Sell, D.R., Miyata, S. and Nagaraj, R.H., The Maillard Reaction as a Theory of Asing, in The MniIInrd Reactiotl in Food Pruce.ssiirg, H~trrnnr~ N t i f r i h ~ m d Physioiogy, Finot, P.A., Aeschbacher, H. U., Hurrell, R. F. and Liardon, R., Eds., Birkhauser Verlag, Basel, 1990,393-4 14.
Monnier, V.M. and Cerami, A., Detection of Nonenzymatic Browning Products in the Human Lens, Biorhim. Riuphys. Acta, 1983, 760 (l), 97-103.

Namiki, M. and Hayashi, T., A New Mechanism of the Maillard Reaction Involving Sugar Fragmentation and Free Radical Formation, in The Muillard Reaciimz in Foods a ~ d Nutrilio~l, Waller, GR. and Feather, M. S., Eds., ACS Symp. Series No 2 1 5, Washington, D.C: ACS 21 5, 1983,21-46..
Nathier-Dufour, N., Sedrnan, J. and van de Voort, F R . , A rapid ATWFRIR quality control rnethod for the determination of fats and solids in sweetened condensed milk, Mi Ichwissei~schaft, 1 995, 50(8), 462-466.
O'Brien, J.O. and Morrissey, P. A., Nutntional and Toxicological Aspects of the Maillard Browning Reaction in Foods, Crii. Rev. 111 f i o d Sci. ami NI&. , 1989,28(3), 2 1 1 -248.
Olinger, J.M. and Grifiths, P.R., Effects of Sample Dilution and Particle SizelMorphology on Difise Refelction Spectra of Carbohydrate Systems in the Near- and Mid-Infared. Part 1: Single Analytes, Apyl. S&xfmc., 1993, 47(6), 687-694.
Pomeranz, Y. and Meloan, C.E., i4x.d Ai>n/ysis:Theory and /'rnclice, Van Nostrand Reinhold Co., New York, 1987, p. 129.
Riui, G. P., New Aspects on the Mechanism of Pyrazine Formation in the Strecker Degradation of Arnino Acids, in I;lavow Science aitd Techmlqy , Martens, M., Dalen, G.A. and Russwurm Sr., H., Eds., John Wiley and Sons Ltd., New York, 1987, pp. 23-28.
Roberts, D. and Acree, T., Gas Chromatography-Olfactometry of Glucose-Proline Maillard Reaction Product s, rïhermnl/y Geiternfeid I;lnvor.s of Microwave ai~d I~xtrt~sio~z Processes, ACS Symposium Series , 543, 1994; American Chemical Society: Washington D.C., p. 71-79.
Solomons, G., Fb~idarneitfa/s of Organic Ch i s f ry , 4'h ed., John Wiley & Sons? New York, 1984, p. 453.
Sosnovsky, G., Gnewuch, C.T. and Ryoo, ES., In Search of New Anticancer D N ~ L XXV: Role of N-Nitrosated Amadori Compounds Derived fiom Glucose-Amino Acid Conjugates in Cancer Promotion of Inhibition, .l. Phnrm. Sci., 1993, 82(6), 649-656.
Stahl, H. D. and Parliment, T. H., Formation of Maillard Products in the Proline-Glucose Mode1 S ystem. High-Temperature Short-Time Kinetics, Therina/& Ge~wraled f i v v r s of Micrownw and Exfrm-ioit Processes, AC S Symposium Series , 543, 1 994; American Chemical Society: Washington D. C., Chapter 20.
Thomalley, P., Wolff, S., Crabbe, J. and Stern, A., the autoxidation of glyceraldehyde and other simple monosaccharides under physiological conditions catalyzed by buffer ions., Riochim. Riophys. Acta, 1984, 797,276-287.

van de Voort, F.R, Fourier transform infiared spectroscopy applied to food analysis, Food R ~ s . I M , 1992, 25, 397-403.
van de Voort, F.R., Ng-Kwai-Hang, K.F. and Moxley, J.E., Factors affecting direrences in milk fat test results obtained by the Babcock, Rose-Gottlieb and infiared methods and in protein test from infiared milk analysis, J. Bairy Sc.. 1987, 71, 290-298.
Veness, R.G. and Evans, C. S., Identification of Monosaccharides and Related Compounds by Gas Chromatography Fourier Transform lnfrared Spectroscopy of Their Trimethylsilyl Ethers, J Chromatography, 1996, 721(1), 165-172.
Vernin, G., Debrauwer,L., Vemin, G.M.F., Zamkotsian, R.M., Metzger,., Larice, J.L. and Parkanyi, C., Heterocycles by thermal degradation of Amadon intermediates, in OH- I;lnvor.s NI Foods and Reverages, C haralambous, G., Ed., Elsevier, Amsterdam, 1 992, 567.
Villota, R. And Hawkes, J.G., Reaction Kinetics in Food Systems, in Haridhook qf Food fiigit~eeririg , Heldman, D.R. and Lund, D.B., Eds., Marcel Dekker, Inc., New York, 1992, 39- 144.
Wang., C.J., Huang, H.P., Tseng, T.H., Lin, Y.L. and Shiow, S.J., N-Nitrso-N-(3-Keto- 1,2 Butanedio1)-3'-Nitrotyramine - A New Genotoxic Agent Derived From the Reaction of Tyrosine and gGucose in the Presence of Sodium Nitrite, Arch. of Tux., 1995, 70(1), 10-1 5.
Warmbier, H.C., Schnickels, R.A. and Labuza, T.P., Nonenzymatic Browning Kinetics in the Intermediate Model System: EfFect of Glucose to Lysine Ratio, .J. Food Sc., 1976, 41, 98 1-983.
Wedzicha, B.L. and Vakalis, N., Kinetics of the sulfite inhibited Maillard reaction: the effect of sulfite ion, Food Chem.. 1 988, 27, 2SM7 1.
Wedzicha, B.L., Bellion, I.R., and Goddard, S.J., Infiared and ultraviolet spectra of sulfur(1V) oxospecies in water-non-electrolyte mixtures, Food Cheni.. 1 992,44, 165- 1 7 1.
Whitaker, J.R., Mechanisms of Oxidoreductoses Important in Food Component Modification in, Chernicd 0mttge.s iii Food Dwirig Y r ~ ~ e ~ s ~ i i ~ g , Richardson,T.and FinelyJ., Eds., Westport, Conn., AV1 Pub. Co., 1 985, 12 1-1 76.
Wittkowski, R., Components in Foods With High Carbohydrate Content, in High perforrnmce liqriid chromntogra@y food c o ~ z ~ i aird re.search. Galensa, R. and Matissek, R., Eds., Behr's Verlag, Hamburg, Germany, 1992, 87-1 17.
Wolff, J-C., Thompson, D.R. and Reineccius, G. A., Initial Losses of Available Lysine in Model Systems, J. Food Sc., 1977,42(6), 1 540- 1 544.

Wolfiom, M.L., Kashimura, N. and Horton, D., Factors Atfecting the Maillard Browning Reaction Between Sugars and Arnino Acids. Studies on the Nonenzyrnatic Browning of Dehydrated Orange Juice, .l. Agit. Food Chem., 1 974,22(5), 796-800.
Yaylayan, V., In Search of Alternative Mechanisms for the Maillard Reaction, Treitck h o d Sci. Techol., 1 990; July : 20-22.
Yaylayan, V. A. and Huyghues-Despointes, A., Chemistry of Amadon Rearrangement Products: Analysis, Synthesis, Kinetics, Reactions, and Spectroscopie Properties, Cril. Rev. in FodScz . Nirtr., 1994; 34 (4): 321-369.
Yaylayan, V.A. and Ismail, A.A., Determination of the effect of temperature on the concentration of k m form of D-fructose by FT-IR spectroscopy, .l. O1nrh. Chem., 1992, 11(2), 149-158.
Yaylayan, V.A. and Ismail, A.A., Investigation of the enolization and carbonyl group migration in reducing sugars by FTlR spectroscopy, Carbohydr. Rm, 1995, 276, 253- 265.
Yaylayan, V.A., Ismail, A.A. and Huyghes-Despointes, A., Investigation of the Acyclic Forms of Reducing Sugars and Amadori Products by FTIR Spectroscopy, in Mailiard I<enctiot~s NI C'hemisrry, Food and Henlth, Labuza, T.P., Reineccius, G.A., Monnier, V., OYBrien,J. and Baynes, J., Eds., Royal Soc. of Chem., Cambridge, 1994,69-73.
Yaylayan, V. A., Ismail, A. A. and Mandeville, S., Quantitative determination of the effect of pH and temperature on the k e ~ o form of D-fructose by FT IR spectroscopy, (Clrbohydr. Res., 1993,248,355-360.
APPLIEEZI A IMAGE. Inc - = 1653 East Main Street - -. - Rochester. NY 14609 USA -- -- - - Phone: 71 61482-0300 -- -- - - Fa: 71 61288-5989
6 1993. Applied Image. Inc.. All Rights Rese~ed


![Reminder Fourier Basis: t [0,1] nZnZ Fourier Series: Fourier Coefficient:](https://img.pdfslide.us/doc/110x75/56649d395503460f94a13929/reminder-fourier-basis-t-01-nznz-fourier-series-fourier-coefficient.jpg)


![[PPT]Convolution, Fourier Series, and the Fourier …social.cs.uiuc.edu/.../lectures/Convolution_Fourier.ppt · Web viewConvolution, Fourier Series, and the Fourier Transform CS414](https://img.pdfslide.us/doc/110x75/5b911edf09d3f2b6628d8b14/pptconvolution-fourier-series-and-the-fourier-web-viewconvolution-fourier.jpg)