Embed Size (px)
Citation preview
Investigation of Basalt Woven Fabrics for Military
Applications
by David M. Spagnuolo, Eugene Napadensky, Tomoko Sano,
and James P. Wolbert
ARL-TR-5815 November 2011
Approved for public release; distribution is unlimited.
NOTICES
Disclaimers
The findings in this report are not to be construed as an official Department of the Army position unless so designated by other authorized documents. Citation of manufacturer’s or trade names does not constitute an official endorsement or approval of the use thereof. Destroy this report when it is no longer needed. Do not return it to the originator.
i
Army Research Laboratory Aberdeen Proving Ground, MD 21005-5069
ARL-TR-5815 November 2011
Investigation of Basalt Woven Fabrics for Military
Applications
David M. Spagnuolo, Eugene Napadensky, Tomoko Sano,
and James P. Wolbert Weapons and Materials Research Directorate, ARL
Approved for public release; distribution is unlimited.
ii
REPORT DOCUMENTATION PAGE Form Approved OMB No. 0704-0188
Public reporting burden for this collection of information is estimated to average 1 hour per response, including the time for reviewing instructions, searching existing data sources, gathering and maintaining the data needed, and completing and reviewing the collection information. Send comments regarding this burden estimate or any other aspect of this collection of information, including suggestions for reducing the burden, to Department of Defense, Washington Headquarters Services, Directorate for Information Operations and Reports (0704-0188), 1215 Jefferson Davis Highway, Suite 1204, Arlington, VA 22202-4302. Respondents should be aware that notwithstanding any other provision of law, no person shall be subject to any penalty for failing to comply with a collection of information if it does not display a currently valid OMB control number.
PLEASE DO NOT RETURN YOUR FORM TO THE ABOVE ADDRESS.
1. REPORT DATE (DD-MM-YYYY)
November 2011 2. REPORT TYPE
Final 3. DATES COVERED (From - To)
4. TITLE AND SUBTITLE
Investigation of Basalt Woven Fabrics for Military Applications 5a. CONTRACT NUMBER
5b. GRANT NUMBER
5c. PROGRAM ELEMENT NUMBER
6. AUTHOR(S)
David M. Spagnuolo, Eugene Napadensky, Tomoko Sano, and James P. Wolbert 5d. PROJECT NUMBER
5e. TASK NUMBER
5f. WORK UNIT NUMBER
7. PERFORMING ORGANIZATION NAME(S) AND ADDRESS(ES)
U.S. Army Research Laboratory ATTN: RDRL-WMM-A Aberdeen Proving Ground, MD 21005-5069
8. PERFORMING ORGANIZATION REPORT NUMBER
ARL-TR-5815
9. SPONSORING/MONITORING AGENCY NAME(S) AND ADDRESS(ES)
10. SPONSOR/MONITOR’S ACRONYM(S) 11. SPONSOR/MONITOR'S REPORT NUMBER(S)
12. DISTRIBUTION/AVAILABILITY STATEMENT
Approved for public release; distribution is unlimited.
13. SUPPLEMENTARY NOTES
14. ABSTRACT
This report investigates the use of basalt fibers in a composite along with SC-15 epoxy resin for ballistic protection. Basalt fibers are not known as a ballistic material but rather as a structural one. Even though basalt fibers are not expected to outperform some of the higher ballistic performing materials such as the aramid and polyethylene fibers; however, due to the lower manufacturing costs, basalt fibers are an interesting alternative. The objective of this project was to gain a basic understanding of the properties of basalt fibers and their potential use for certain military applications. Therefore, some of the basic mechanical tests were used as a tool to compare properties to an S-2 glass epoxy system. The same was true for the ballistic tests that were performed. The basic mechanical tests used for comparative studies were flexural, tensile, and short-beam shear strength. The basalt epoxy composites compared well with S-2 properties. Fragment tests were also investigated for two areal densities, 1-psf and 5-psf systems, using a 17- and 44-gn fragment simulating projectile (FSP), respectively. Again, the basalt epoxy performed well for these tests as compared to an S-2 similar system. 15. SUBJECT TERMS
Basalt, epoxy, S-2 glass, ballistic, V50
16. SECURITY CLASSIFICATION OF: 17. LIMITATION OF ABSTRACT
UU
18. NUMBER OF PAGES
28
19a. NAME OF RESPONSIBLE PERSON David M. Spagnuolo
a. REPORT
Unclassified b. ABSTRACT
Unclassified c. THIS PAGE
Unclassified 19b. TELEPHONE NUMBER (Include area code) 410-306-0770
Standard Form 298 (Rev. 8/98) Prescribed by ANSI Std. Z39.18
iii
Contents
List of Figures iv
List of Tables iv
Acknowledgments v
1. Introduction 1
2. Test Methodology 2
2.1 Materials ..........................................................................................................................2
2.2 Composite Fabrication ....................................................................................................3
2.3 Mechanical Testing .........................................................................................................5
2.4 Energy Dispersive Spectroscopy .....................................................................................6
2.5 Ballistic Testing ...............................................................................................................6
3. Results 7
3.1 Mechanical Testing .........................................................................................................7
3.2 EDS Discussion .............................................................................................................12
3.3 Ballistic Testing .............................................................................................................13
4. Conclusions 14
5. References 16
Appendix. Average Values and Standard Deviations for All Mechanical Tests 17
List of Symbols, Abbreviations, and Acronyms 18
Distribution List 19
iv
List of Figures
Figure 1. Basalt rock. ......................................................................................................................1
Figure 2. Three weave styles investigated. .....................................................................................3
Figure 3. Typical VARTM process. ...............................................................................................4
Figure 4. Short-beam shear test experimental set-up. .....................................................................6
Figure 5. Typical flexural plot for basalt-epoxy composite. ...........................................................8
Figure 6. Flexural modulus basalt vs. S-2 glass/epoxy. ..................................................................8
Figure 7. Flexural strength basalt vs. S-2 glass/epoxy....................................................................9
Figure 8. Short beam shear basalt vs. S-2 glass/epoxy. ................................................................10
Figure 9. Modulus of elasticity for basalt vs. S-2 glass/epoxy. ....................................................11
Figure 10. Ultimate tensile strength basalt vs. S-2 glass/epoxy. ..................................................12
Figure 11. V50 for 17-gn FSP.......................................................................................................13
Figure 12. V50 for 44-gn FSP.......................................................................................................14
List of Tables
Table 1. Product information. .........................................................................................................3
Table 2. Test methods and ply counts. ............................................................................................5
Table 3. Mechanical test data normalized to S-2 glass/epoxy. .....................................................12
Table A-1. Average values and standard deviations for all mechanical tests. ...............................17
v
Acknowledgments
Special thanks go out to a great group of technicians who did all the dirty work fabricating and machining the composite test coupons: Mike Neblett, Rob Miller, Matt Gilley, Fred Racine and Mike Thompson. Thanks to all the helping hands working out at the Survivability/Lethality Analysis Directorate (SLAD) Peep site, with a special thanks to Rob Kinsler and Rick Kane. We also thank John Brown, David Gray, and Paul Moy for all the mechanical testing portion of this work. For those who we may have missed, thank you so much for all your help in acquiring the info within.
vi
INTENTIONALLY LEFT BLANK.
1
1. Introduction
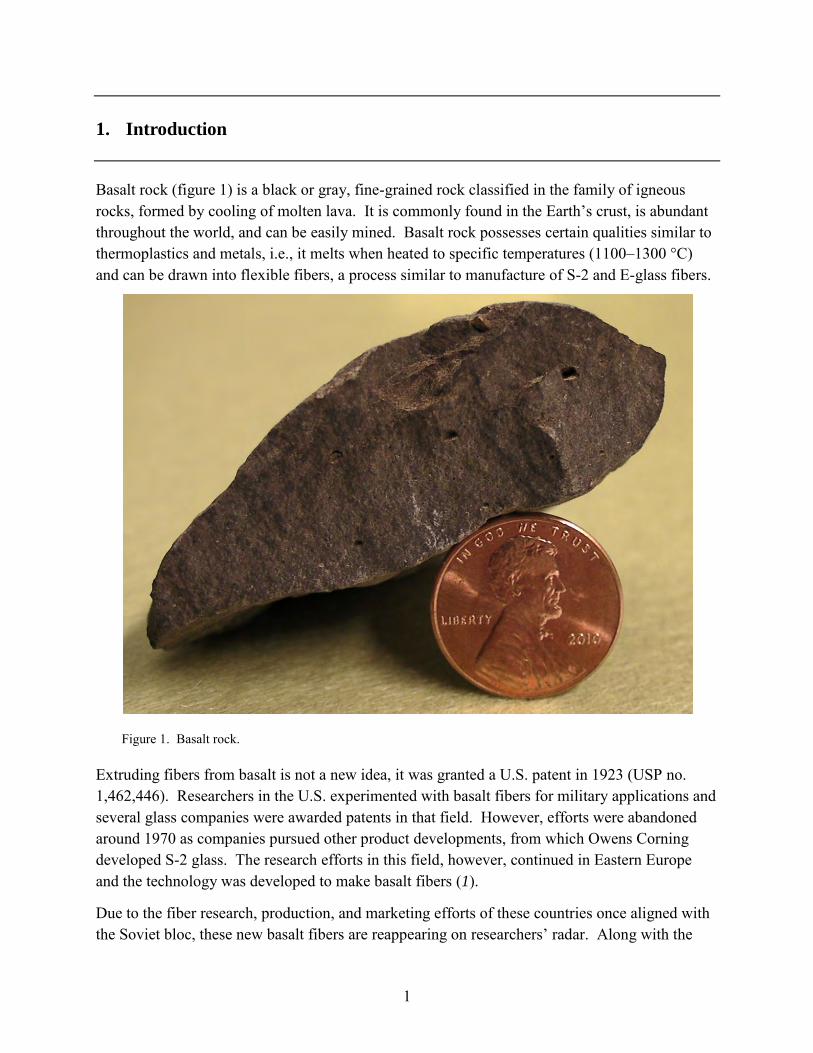
Basalt rock (figure 1) is a black or gray, fine-grained rock classified in the family of igneous rocks, formed by cooling of molten lava. It is commonly found in the Earth’s crust, is abundant throughout the world, and can be easily mined. Basalt rock possesses certain qualities similar to thermoplastics and metals, i.e., it melts when heated to specific temperatures (1100–1300 °C) and can be drawn into flexible fibers, a process similar to manufacture of S-2 and E-glass fibers.
Figure 1. Basalt rock.
Extruding fibers from basalt is not a new idea, it was granted a U.S. patent in 1923 (USP no. 1,462,446). Researchers in the U.S. experimented with basalt fibers for military applications and several glass companies were awarded patents in that field. However, efforts were abandoned around 1970 as companies pursued other product developments, from which Owens Corning developed S-2 glass. The research efforts in this field, however, continued in Eastern Europe and the technology was developed to make basalt fibers (1).
Due to the fiber research, production, and marketing efforts of these countries once aligned with the Soviet bloc, these new basalt fibers are reappearing on researchers’ radar. Along with the
2
obvious uses as toughening and insulation material, it is claimed that the fibers are naturally resistant to ultraviolet (UV) and high-energy electromagnetic radiation, maintain their properties in cold temperatures, and provide excellent acid resistance (2).
The fibers are produced in a continuous process, similar to that for making glass fibers. The basalt material is initially fed into a heating furnace, followed by gravity fed through a bushing, and finally gathered into a single strand of continuous filament basalt fiber. The material is then quenched with a water-based sizing and packaged for sale (3). At this time, the industry is capable of producing large quantities of inexpensive basalt fiber with various well-defined and controlled fiber diameters.
There are certain things about basalt that make it attractive and economically comparable with production of glass fibers, like S-2. Part of the process in the production of high quality glass fibers involves addition of ingredients such as aluminum and other minerals needed to create the desired chemical and physical properties of the final product. Additional steps and ingredients will always increase production cost. Since natural basalt already contains these ingredients, these steps are eliminated from the manufacturing process. There are also reports that being a product of volcanic activity, the fiberization process is more environmentally safe than that of glass fiber. Basalt is, however, more abrasive than glass. So in order to reduce excessive wear and tear on the bushings during the fiber manufacturing process, they will need to be redesigned using a more durable material (1).
Since basalt fabrics are fairly new for Army applications and currently in limited use, selection of different types and weights of fabric were considered for this study. The main goal is to obtain different vendor products and perform the evaluation assuming that a lighter fabric or style may be better suited for smaller threats. This report discusses, in detail, the results of the evaluation of basalt woven rovings with SC-15 epoxy resin composite plates with regard to their mechanical and ballistic properties and how they compare to S-2 glass with SC-15 epoxy resin composite plates. While the basalt fiber itself was manufactured by the same company (Kamenny Vek), the weaving into fabric was done elsewhere and procured through four different vendors. This allows us to evaluate the effect different fabric manufacturing processes and styles has on the final properties of the composites as well as provides a general comparison of basalt fibers to S-2 glass for potential Army applications.
2. Test Methodology
2.1 Materials
The raw material was purchased from Martintek U.S.A. (Batesburg-Leesville, SC), Hexcel Corporation (Sequin, TX), BGF Industries Inc. (Greensboro, NC), and Sudaglass Fiber Technology Inc. (Houston, TX). All of these vendors use basalt filaments manufactured and

3
supplied by Kamenny Vek. These fabrics were infused with SC-15 epoxy resin (Applied Poleramic Inc., Benica, CA) at the U.S. Army Research Laboratory (ARL). Composite plates were fabricated at two areal densities and the average fiber volume was 45%.
The materials obtained from each vendor are listed in table 1.
Table 1. Product information.
Vendor Product Nomen. Weight
(oz/yd2)
Weave Style Designation
Martintek B1600612 25 Plain MT Hexcel XC2024 8.7 8 harness satin XC BGF BS240 24 5 × 5 plain BS Sudaglass BT11 26 2/2 twill SD
Figure 2 shows the three different weave styles—the 8-harness satin weave, a plain weave, and a 2/2 twill weave—looking from left to right. Basalt fabrics tend to be brownish in color due to the high iron content.
Figure 2. Three weave styles investigated.
2.2 Composite Fabrication
One of the claims of basalt is how easily the fabric wets out, which enables fast impregnation, making it well suited for processes such as resin transfer molding (RTM), infusion, molding, and pultrusion (1).
The resin infusion process was done with SC-15 epoxy resin, a two-phase cycloaliphatic amine resin. This particular resin system is widely used for ballistic plates by the U.S. Army, BAE
4
Systems, the University of Delaware, and several phase II Small Business Innovation Research (SBIR) contracts.
Typical vacuum-assisted resin transfer molding (VARTM) involves layering up plies of unimpregnated fabric cut to size or preformed and vacuum bagged it with the appropriate number of resin feed and vent lines. The pressure differential, along with the evacuated plies, stimulates resin impregnation of the preform (4, 5).
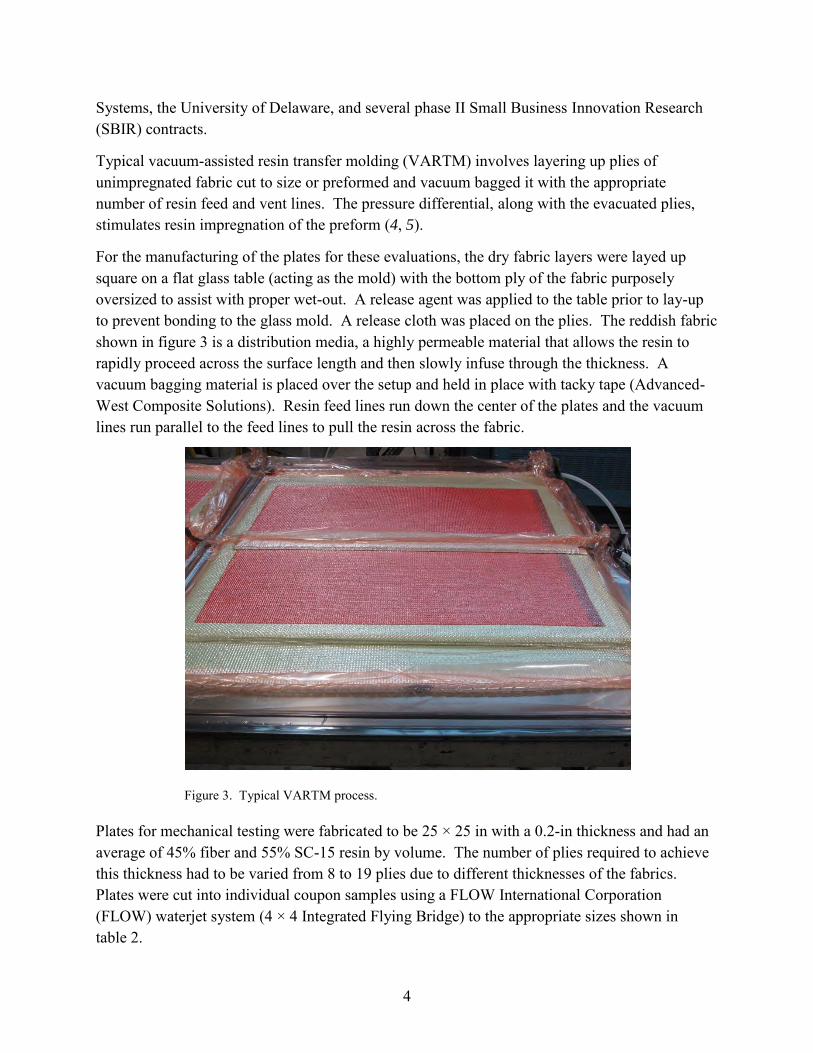
For the manufacturing of the plates for these evaluations, the dry fabric layers were layed up square on a flat glass table (acting as the mold) with the bottom ply of the fabric purposely oversized to assist with proper wet-out. A release agent was applied to the table prior to lay-up to prevent bonding to the glass mold. A release cloth was placed on the plies. The reddish fabric shown in figure 3 is a distribution media, a highly permeable material that allows the resin to rapidly proceed across the surface length and then slowly infuse through the thickness. A vacuum bagging material is placed over the setup and held in place with tacky tape (Advanced-West Composite Solutions). Resin feed lines run down the center of the plates and the vacuum lines run parallel to the feed lines to pull the resin across the fabric.
Figure 3. Typical VARTM process.
Plates for mechanical testing were fabricated to be 25 × 25 in with a 0.2-in thickness and had an average of 45% fiber and 55% SC-15 resin by volume. The number of plies required to achieve this thickness had to be varied from 8 to 19 plies due to different thicknesses of the fabrics. Plates were cut into individual coupon samples using a FLOW International Corporation (FLOW) waterjet system (4 × 4 Integrated Flying Bridge) to the appropriate sizes shown in table 2.
5
Table 2. Test methods and ply counts.
Test Method Reinforcement Matrix Plies Dimensions
(mm/in)
ASTM D790
Hexcel SC-15 19 203 × 25 × 5 (8 × 1 × 0.2) BGF SC-15 8
Martintek SC-15 9 Sudaglass SC-15 9
ASTM D2344
Hexcel SC-15 19 38 × 13 × 5 (1.5 × 0.5 × 0.2) BGF SC-15 8
Martintek SC-15 9 Sudaglass SC-15 9
ASTM D638
Hexcel SC-15 19 165 × 13 × 5 (6.5 × 0.5 × 0.2) BGF SC-15 8
Martintek SC-15 9 Sudaglass SC-15 9
Plates for ballistic testing were fabricated separately due to different requirements. Using the VARTM process described earlier, plates with two different areal densities (1- and 5-psf) were fabricated to evaluate 0.22-cal. (17-gn) and 0.30-cal. (44-gn) tests.
2.3 Mechanical Testing
Flexural properties were obtained using the American Society for Testing and Materials (ASTM) D790 Method, Standard Test Methods for Flexural Properties of Unreinforced and Reinforced Plastics for Insulating Materials (6). This method also includes high-modulus composite testing. One side of the beam is loaded in compression while the supported side is in tension. A shear stress also exists at the neutral axis, but this component is usually minimized by making the test specimen long relative to the thickness (7). Five samples, in the form of rectangular bars, were cut to the following dimensions, 8 × 10 × 0.2 in, for each material group. A span-to-depth ratio of 40:1 was used. The samples were conditioned for a minimum of 48 h at 23 ± 2 °C and 50% ± 5% relative humidity. Tests were performed on an Instron 5500 series load frame, Model 1125, to measure properties such as flexural strength and flexural modulus. Both are indicators of how a material will behave under bending conditions
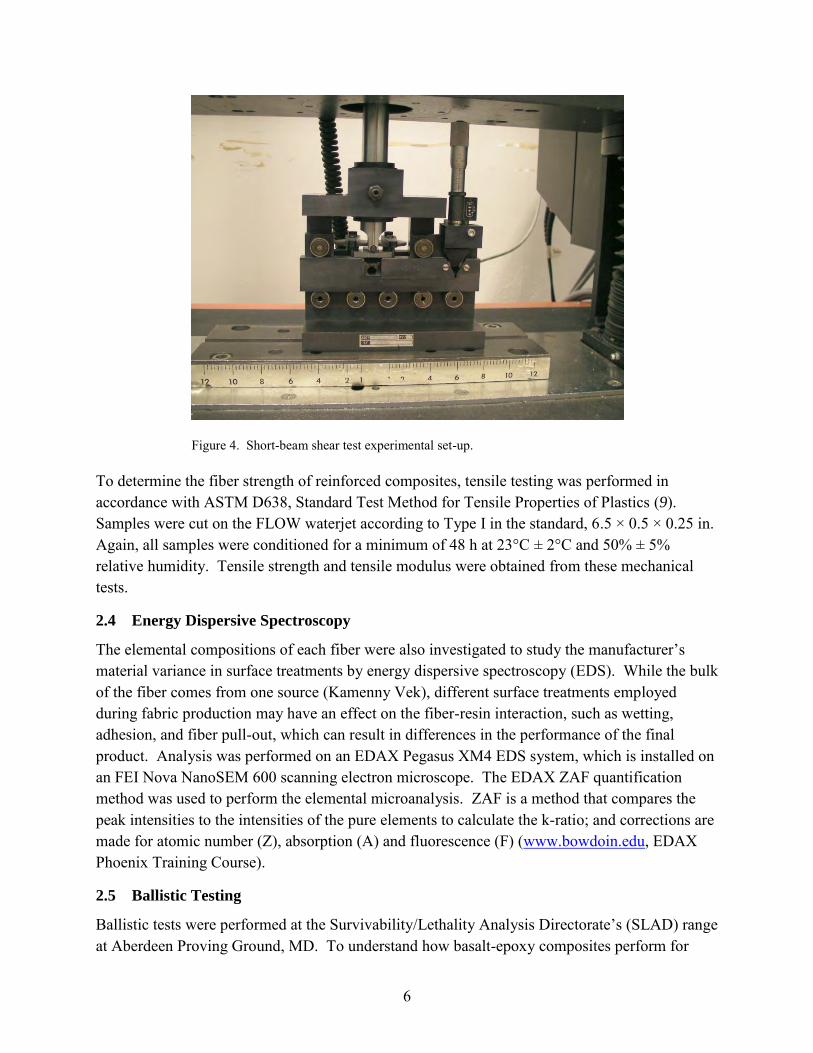
Short-beam shear strength was determined by using ASTM D2344, Standard Test Method for Short-Beam Strength of Polymer Matrix Composite Materials and Their Laminates (8). This method determines the short-beam strength of high-modulus fiber-reinforced composite materials by testing a short beam machined from a curved or flat laminate in 3-point bending. Beams were machined to 1.5 × 0.5 × 0.2 in from flat plates and five tests were run for each of the basalt materials. The samples were conditioned for a minimum of 48 h at 23 ± 2 °C and 50% ± 5% relative humidity. The Instron 5500 load frame, model 1125, was used for the short-beam shear testing as well. Figure 4 shows the short-beam shear test fixture in the Instron load frame.
6
Figure 4. Short-beam shear test experimental set-up.
To determine the fiber strength of reinforced composites, tensile testing was performed in accordance with ASTM D638, Standard Test Method for Tensile Properties of Plastics (9). Samples were cut on the FLOW waterjet according to Type I in the standard, 6.5 × 0.5 × 0.25 in. Again, all samples were conditioned for a minimum of 48 h at 23°C ± 2°C and 50% ± 5% relative humidity. Tensile strength and tensile modulus were obtained from these mechanical tests.
2.4 Energy Dispersive Spectroscopy
The elemental compositions of each fiber were also investigated to study the manufacturer’s material variance in surface treatments by energy dispersive spectroscopy (EDS). While the bulk of the fiber comes from one source (Kamenny Vek), different surface treatments employed during fabric production may have an effect on the fiber-resin interaction, such as wetting, adhesion, and fiber pull-out, which can result in differences in the performance of the final product. Analysis was performed on an EDAX Pegasus XM4 EDS system, which is installed on an FEI Nova NanoSEM 600 scanning electron microscope. The EDAX ZAF quantification method was used to perform the elemental microanalysis. ZAF is a method that compares the peak intensities to the intensities of the pure elements to calculate the k-ratio; and corrections are made for atomic number (Z), absorption (A) and fluorescence (F) (www.bowdoin.edu, EDAX Phoenix Training Course).
2.5 Ballistic Testing
Ballistic tests were performed at the Survivability/Lethality Analysis Directorate’s (SLAD) range at Aberdeen Proving Ground, MD. To understand how basalt-epoxy composites perform for
7
possible use as body protection and/or vehicle applications, two areal densities were chosen, 1- and 5-psf. To obtain V50 values (velocity at which the probability of penetration of an armor material is 50%) (10), a 17-gn fragment simulating projectile (FSP) was used on the low areal density plates (1-psf). To represent some of the larger fragment threats, a 44-gn FSP (0.30 cal.) was used to obtain V50’s against 5-psf plates.
3. Results
3.1 Mechanical Testing
The following nomenclature is used for each vendor’s material: Hexcel (XC), Martintek (MT), Sudaglass (SD), BGF (BS), and S2-glass (S-2). The average values and standard deviations for all mechanical tests are shown in the appendix.
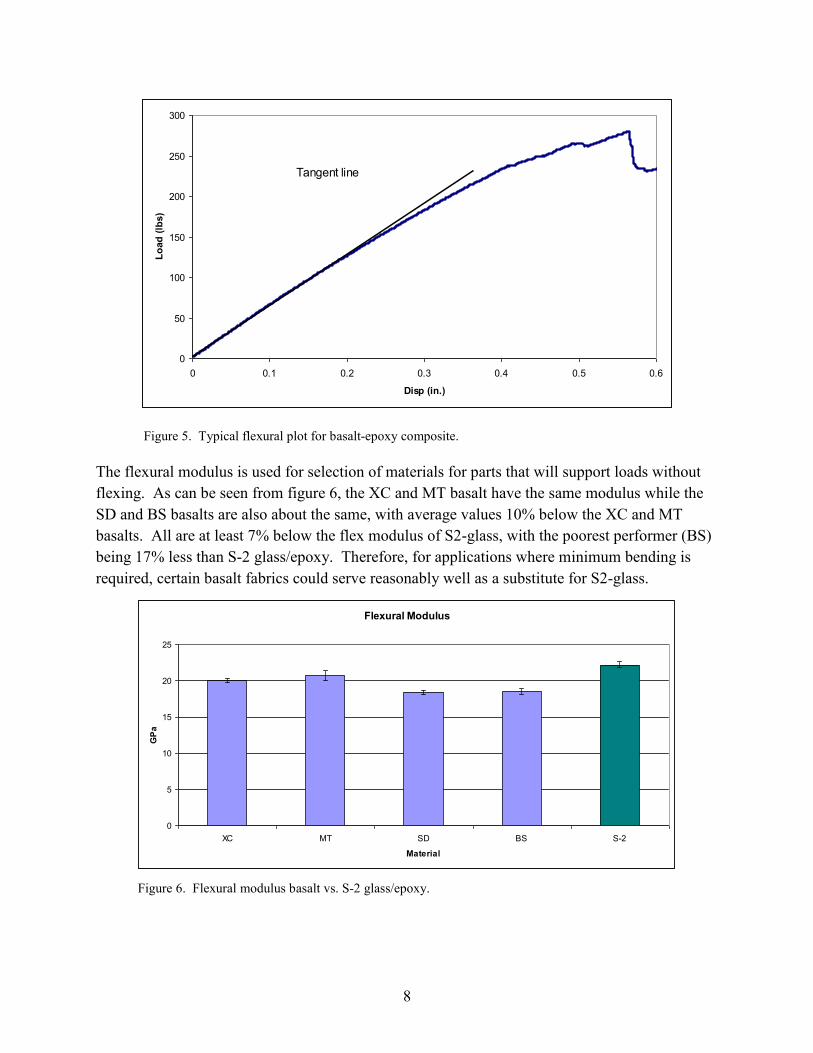
Experimental data were obtained using the Standard Test Methods for Flexural Properties of Unreinforced and Reinforced Plastics for Insulating Materials (ASTM D790). The modulus of elasticity (EB) is the ratio of the elastic limit, stress, to a corresponding strain. It was determined by drawing a tangent to the steepest initial straight-line portion of the load deflection curve and using the following equation:
EB = L3m/4bd3 (1)
where
EB = modulus of elasticity in bending,
L = support span,
b = width of the beam,
d = depth (thickness) of the beam, and
m = slope of the linear portion of the load versus displacement graph.
The average values are displayed for each material. Figure 5 shows a typical load-displacement curve displaying the tangent line through the linear portion of the graph.
8
Figure 5. Typical flexural plot for basalt-epoxy composite.
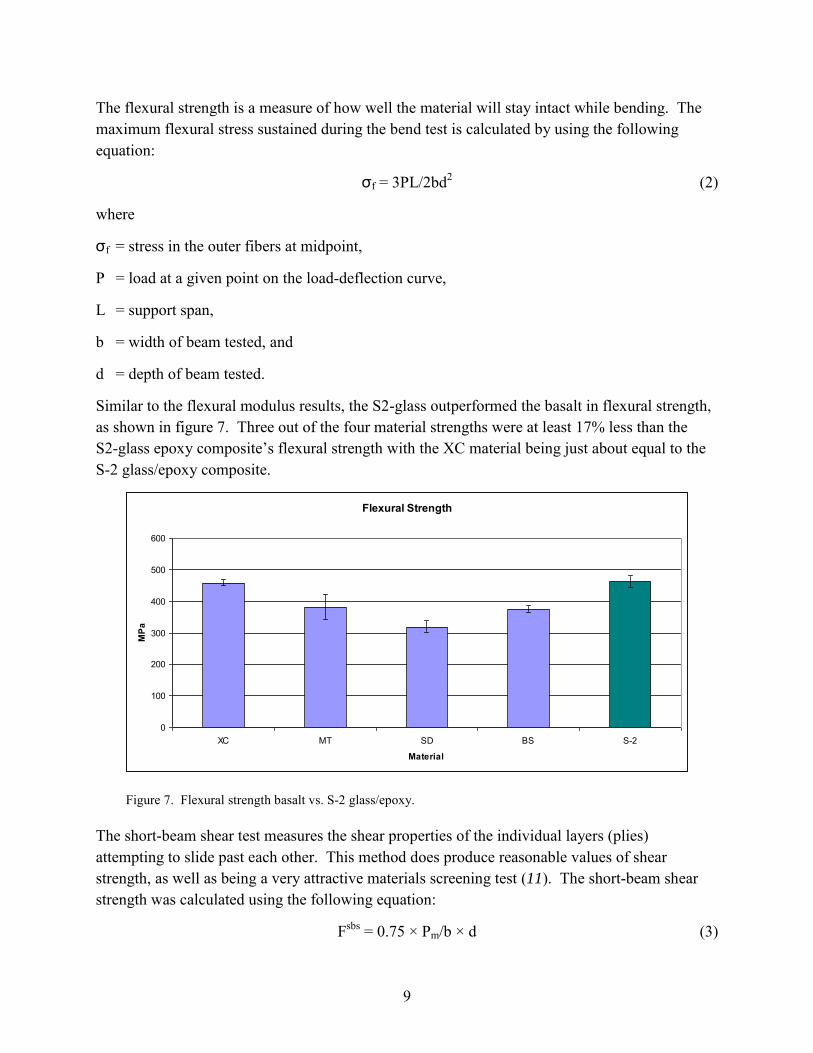
The flexural modulus is used for selection of materials for parts that will support loads without flexing. As can be seen from figure 6, the XC and MT basalt have the same modulus while the SD and BS basalts are also about the same, with average values 10% below the XC and MT basalts. All are at least 7% below the flex modulus of S2-glass, with the poorest performer (BS) being 17% less than S-2 glass/epoxy. Therefore, for applications where minimum bending is required, certain basalt fabrics could serve reasonably well as a substitute for S2-glass.
Figure 6. Flexural modulus basalt vs. S-2 glass/epoxy.
0
50
100
150
200
250
300
0 0.1 0.2 0.3 0.4 0.5 0.6
Disp (in.)
Load
(lbs
)Tangent line
Flexural Modulus
0
5
10
15
20
25
XC MT SD BS S-2
Material
GPa
9
The flexural strength is a measure of how well the material will stay intact while bending. The maximum flexural stress sustained during the bend test is calculated by using the following equation:
σf = 3PL/2bd2 (2)
where
σf = stress in the outer fibers at midpoint,
P = load at a given point on the load-deflection curve,
L = support span,
b = width of beam tested, and
d = depth of beam tested.
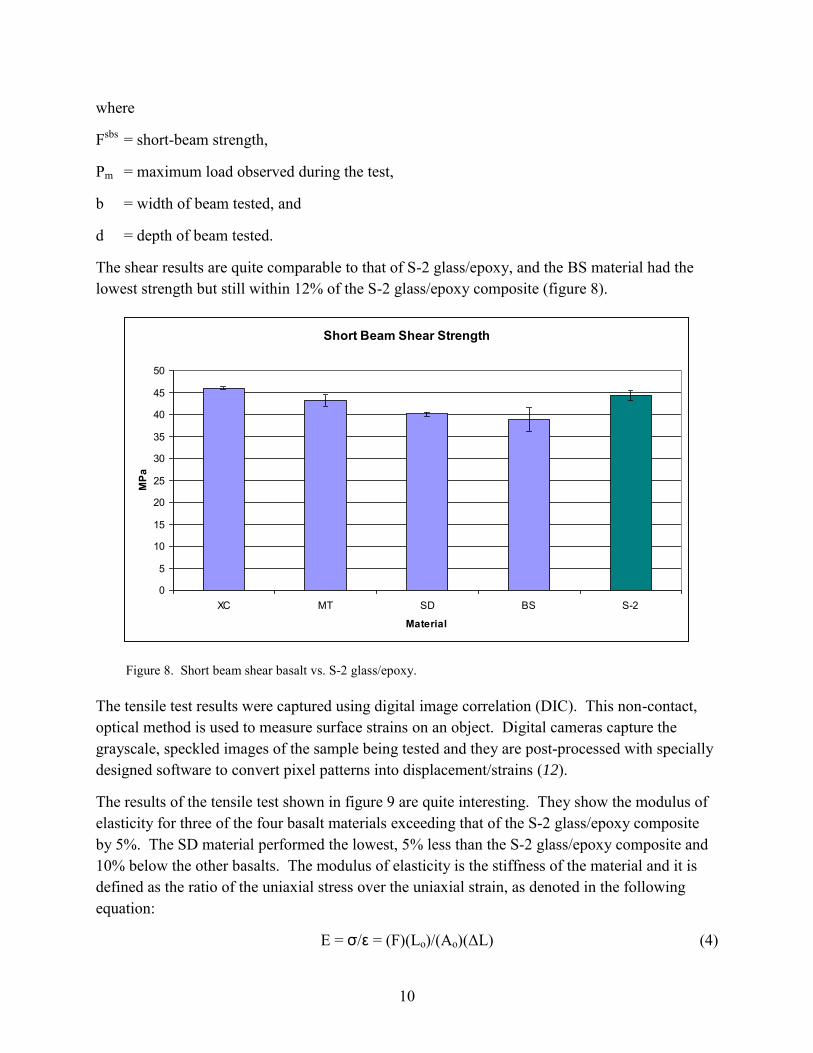
Similar to the flexural modulus results, the S2-glass outperformed the basalt in flexural strength, as shown in figure 7. Three out of the four material strengths were at least 17% less than the S2-glass epoxy composite’s flexural strength with the XC material being just about equal to the S-2 glass/epoxy composite.
Figure 7. Flexural strength basalt vs. S-2 glass/epoxy.
The short-beam shear test measures the shear properties of the individual layers (plies) attempting to slide past each other. This method does produce reasonable values of shear strength, as well as being a very attractive materials screening test (11). The short-beam shear strength was calculated using the following equation:
Fsbs = 0.75 × Pm/b × d (3)
Flexural Strength
0
100
200
300
400
500
600
XC MT SD BS S-2
Material
MPa
10
where
Fsbs = short-beam strength,
Pm = maximum load observed during the test,
b = width of beam tested, and
d = depth of beam tested.
The shear results are quite comparable to that of S-2 glass/epoxy, and the BS material had the lowest strength but still within 12% of the S-2 glass/epoxy composite (figure 8).
Figure 8. Short beam shear basalt vs. S-2 glass/epoxy.
The tensile test results were captured using digital image correlation (DIC). This non-contact, optical method is used to measure surface strains on an object. Digital cameras capture the grayscale, speckled images of the sample being tested and they are post-processed with specially designed software to convert pixel patterns into displacement/strains (12).
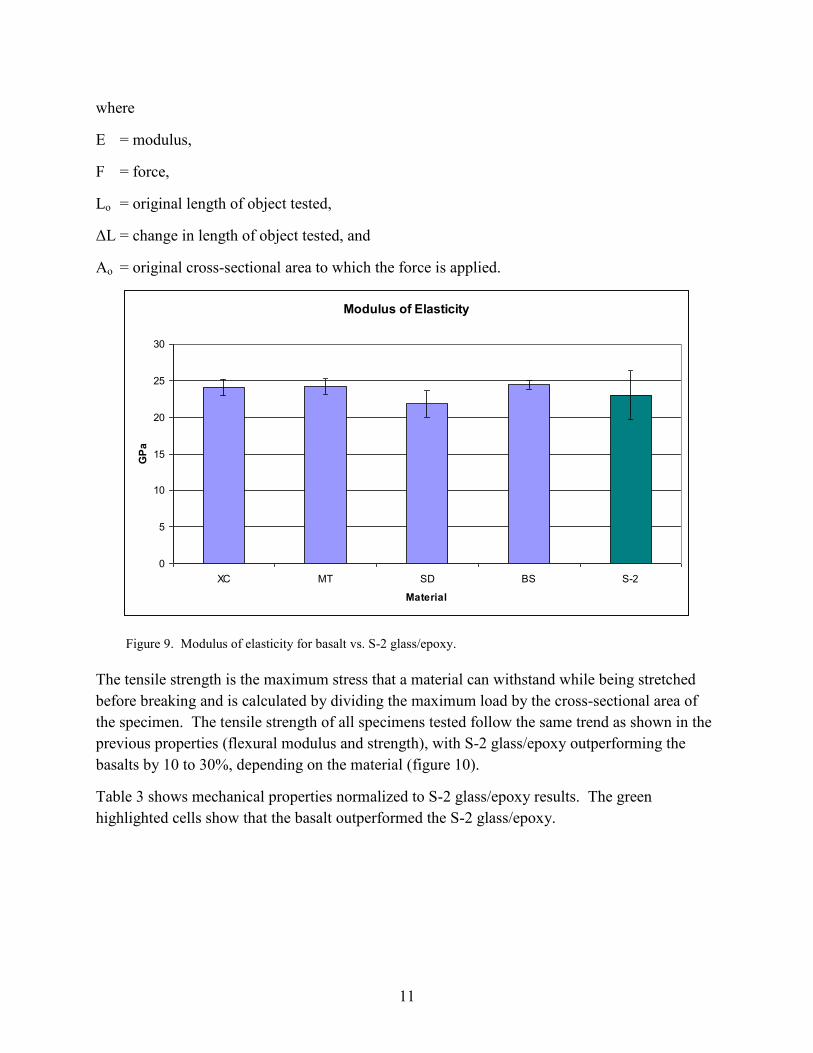
The results of the tensile test shown in figure 9 are quite interesting. They show the modulus of elasticity for three of the four basalt materials exceeding that of the S-2 glass/epoxy composite by 5%. The SD material performed the lowest, 5% less than the S-2 glass/epoxy composite and 10% below the other basalts. The modulus of elasticity is the stiffness of the material and it is defined as the ratio of the uniaxial stress over the uniaxial strain, as denoted in the following equation:
E = σ/ε = (F)(Lo)/(Ao)(ΔL) (4)
Short Beam Shear Strength
0
5
10
15
20
25
30
35
40
45
50
XC MT SD BS S-2
Material
MPa
11
where
E = modulus,
F = force,
Lo = original length of object tested,
ΔL = change in length of object tested, and
Ao = original cross-sectional area to which the force is applied.
Figure 9. Modulus of elasticity for basalt vs. S-2 glass/epoxy.
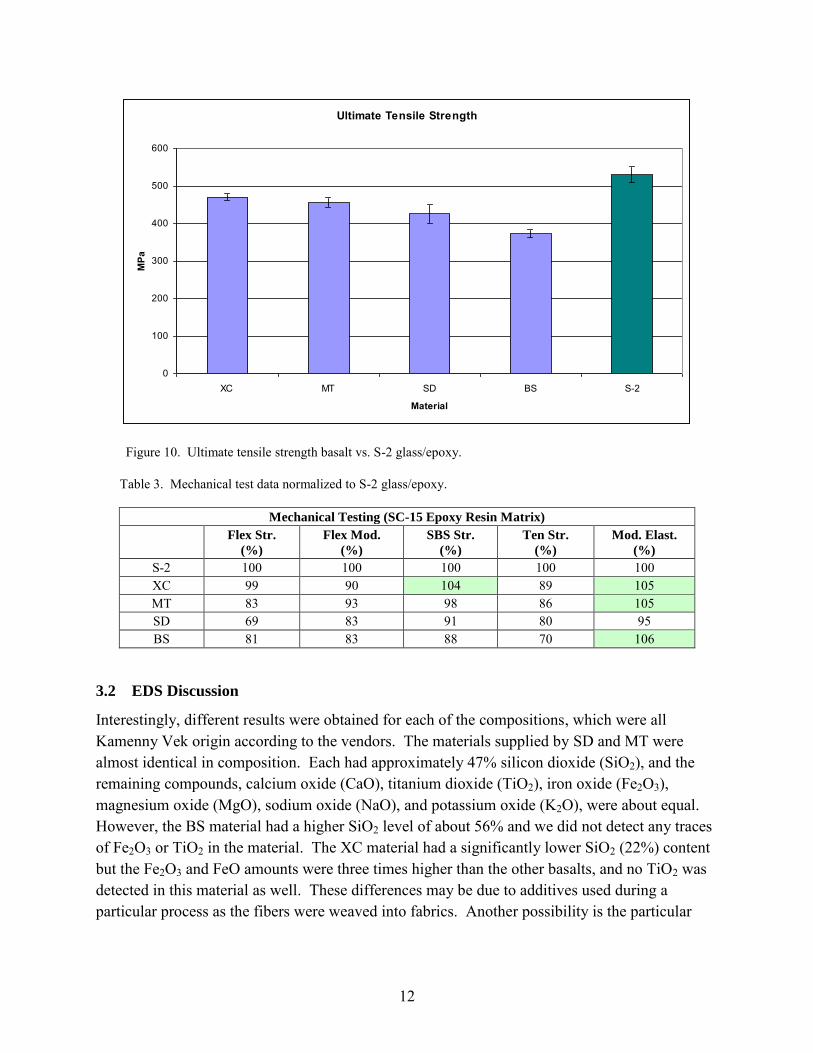
The tensile strength is the maximum stress that a material can withstand while being stretched before breaking and is calculated by dividing the maximum load by the cross-sectional area of the specimen. The tensile strength of all specimens tested follow the same trend as shown in the previous properties (flexural modulus and strength), with S-2 glass/epoxy outperforming the basalts by 10 to 30%, depending on the material (figure 10).
Table 3 shows mechanical properties normalized to S-2 glass/epoxy results. The green highlighted cells show that the basalt outperformed the S-2 glass/epoxy.
Modulus of Elasticity
0
5
10
15
20
25
30
XC MT SD BS S-2
Material
GPa
12
Figure 10. Ultimate tensile strength basalt vs. S-2 glass/epoxy.
Table 3. Mechanical test data normalized to S-2 glass/epoxy.
Mechanical Testing (SC-15 Epoxy Resin Matrix)
Flex Str.
(%)
Flex Mod.
(%)
SBS Str.
(%)
Ten Str.
(%)
Mod. Elast.
(%)
S-2 100 100 100 100 100 XC 99 90 104 89 105 MT 83 93 98 86 105 SD 69 83 91 80 95 BS 81 83 88 70 106
3.2 EDS Discussion
Interestingly, different results were obtained for each of the compositions, which were all Kamenny Vek origin according to the vendors. The materials supplied by SD and MT were almost identical in composition. Each had approximately 47% silicon dioxide (SiO2), and the remaining compounds, calcium oxide (CaO), titanium dioxide (TiO2), iron oxide (Fe2O3), magnesium oxide (MgO), sodium oxide (NaO), and potassium oxide (K2O), were about equal. However, the BS material had a higher SiO2 level of about 56% and we did not detect any traces of Fe2O3 or TiO2 in the material. The XC material had a significantly lower SiO2 (22%) content but the Fe2O3 and FeO amounts were three times higher than the other basalts, and no TiO2 was detected in this material as well. These differences may be due to additives used during a particular process as the fibers were weaved into fabrics. Another possibility is the particular
Ultimate Tensile Strength
0
100
200
300
400
500
600
XC MT SD BS S-2
Material
MPa

13
origin or grade of the mined raw material (basalt). Causes responsible for these differences in chemical composition are being investigated.
3.3 Ballistic Testing
Figure 11 displays the 1-psf ballistic data for the four basalt-epoxy materials normalized to the S-2 glass epoxy results tested against the 17-gn FSP. The basalt composites performed just as well as the S-2 system. The SD and MT were equivalent to S-2, with the BS material only 6% lower. The XC material performed the worst, but that was a lightweight fabric with a tight 8-harness satin weave. The tight weave of this fabric may have been more difficult to wet-out with resin during the impregnation process causing the lower V50 results. E-glass results for 17-gn testing were added to see how the basalt compares with it.
Figure 11. V50 for 17-gn FSP.
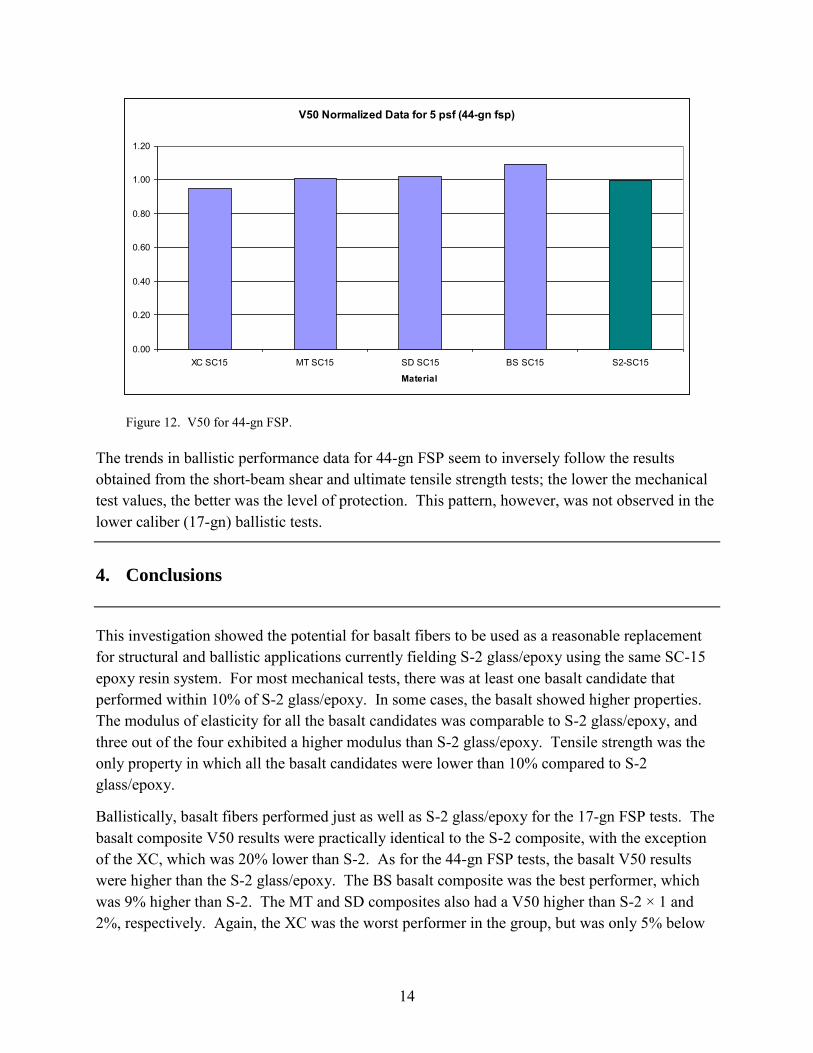
Ballistic tests were performed on 5-psf areal density panels for the same materials, but against the 44-gn FSP. The V50 results are shown in figure 12 normalized to an S-2 glass system. The basalt composite plates compare very well to the S-2 glass/epoxy composite plates for the 44-gn FSP threat. Three out of the four basalt composites had the same or better V50 as that of S-2, with the BS basalt composite outperforming S-2 by 9%. The XC basalt performed the worst of the group, as was the case with the 17-gn FSP testing on the 1-psf plates. As mentioned before, this is most likely due to the lightweight, tight weave of the XC fabric. Still, the performance of the XC composite was within 10% of the V50 of the other materials.
V50 Normalized Data for 1 psf (17-gn fsp)
0.00
0.20
0.40
0.60
0.80
1.00
1.20
XC SC15 MT SC15 SD SC15 BS SC15 S2 SC15 E-glass SC15
Material
14
Figure 12. V50 for 44-gn FSP.
The trends in ballistic performance data for 44-gn FSP seem to inversely follow the results obtained from the short-beam shear and ultimate tensile strength tests; the lower the mechanical test values, the better was the level of protection. This pattern, however, was not observed in the lower caliber (17-gn) ballistic tests.
4. Conclusions
This investigation showed the potential for basalt fibers to be used as a reasonable replacement for structural and ballistic applications currently fielding S-2 glass/epoxy using the same SC-15 epoxy resin system. For most mechanical tests, there was at least one basalt candidate that performed within 10% of S-2 glass/epoxy. In some cases, the basalt showed higher properties. The modulus of elasticity for all the basalt candidates was comparable to S-2 glass/epoxy, and three out of the four exhibited a higher modulus than S-2 glass/epoxy. Tensile strength was the only property in which all the basalt candidates were lower than 10% compared to S-2 glass/epoxy.
Ballistically, basalt fibers performed just as well as S-2 glass/epoxy for the 17-gn FSP tests. The basalt composite V50 results were practically identical to the S-2 composite, with the exception of the XC, which was 20% lower than S-2. As for the 44-gn FSP tests, the basalt V50 results were higher than the S-2 glass/epoxy. The BS basalt composite was the best performer, which was 9% higher than S-2. The MT and SD composites also had a V50 higher than S-2 × 1 and 2%, respectively. Again, the XC was the worst performer in the group, but was only 5% below
V50 Normalized Data for 5 psf (44-gn fsp)
0.00
0.20
0.40
0.60
0.80
1.00
1.20
XC SC15 MT SC15 SD SC15 BS SC15 S2-SC15
Material
15
the V50 performance of S-2 glass/epoxy. This indicates that basalt fibers may be considered as a replacement candidate for S-2 glass/epoxy composites in some ballistic applications.
In addition to ballistic protection, basalt also has comparable mechanical properties and flammability resistance properties. These properties show that basalt could be suitable for structural applications such as backing plates for vehicle armor systems.
Comparison of various mechanical tests to the resulting ballistic properties indicate that the differences in modulus of elasticity does not provide any significant insight on final ballistic properties; two materials with vastly different results performed practically identically against a 17-gn ballistic threat. Short-beam shear and ultimate tensile strength tests, on the other hand, showed a small inverse relationship to protection against higher caliber threats; the lower the test values, the better the level of protection. This pattern, however, was not observed in the lower caliber (17-gn) ballistic tests.
Further studies with basalt fabrics should be performed with a quasi-isotropic design in an effort to improve the mechanical and ballistic performance. Verification of basalt as a backing plate should be investigated with a more substantial caliber threat. Also more research needs to be done in the area of chemical composition of the fiber; this study was more of a surface analysis rather than an analysis of the bulk fiber itself.
16
5. References
1. Basalt Fibers: Alternative to Glass? Composites Technology August 2006.
2. Nolf, J.-M. Basalt Fibres Fire Blocking Textiles, Basaltex R&D Department, Masureel Group, Wevelgem, Belgium, TUT N 49–3rd Quarter 2003.
3. Swink, M. Continuous Filament Basalt A Unique Fiber Capable of Leadership in High Temperature Applications. Techtextil North America Symposium, Atlanta, GA, April 2002.
4. Seemann, W. H. Plastic Transfer Molding Techniques for the Production of Fiber Reinforced Plastic Structures. U.S. Patent 4,902,215, 1990.
5. Rigas, E. J.; Mulkern, T. J.; Walsh, S. M.; Nguyen, S. P. Effects of Processing Conditions
on Vacuum Assisted Resin Transfer Molding Process (VARTM); ARL-TR-2480; Weapons and Materials Research Directorate, U.S. Army Research Laboratory: Aberdeen Proving Ground, MD, 2001.
6. ASTM D 790-03. Standard Test Methods for Flexural Properties of Unreinforced and Reinforced Plastics and Electrical Insulating Materials. Annu. Book ASTM Stand.
7. Adams, D. F. Test Methods for Composite Materials – Seminar Notes, December 1988.
8. ASTM D 2344-00. Standard Test Method for Short-Beam Strength of Polymer Matrix Composite Materials and Their Laminates. Annu. Book ASTM Stand.
9. ASTM D 638-03. Standard Test Method for Tensile Properties of Plastics. Annu. Book
ASTM Stand.
10. MIL-STD-662F. Department of Defense Test Method Standard V50 Ballistic Test for Armor 18 December 1997.
11. Adams, D., Dr. The Short Beam Shear Test. High-Performance Composites, July 2006.
12. Moy, P.; Whittie, S. D.; Foster, M.; Quabili, A. Experimental Technique Using a Modified
V-Notched Rail Shear Fixture on Woven S2-Glass; U.S. Army Research Laboratory: SAMPE, May 2010.
17
Appendix. Average Values and Standard Deviations for All Mechanical Tests
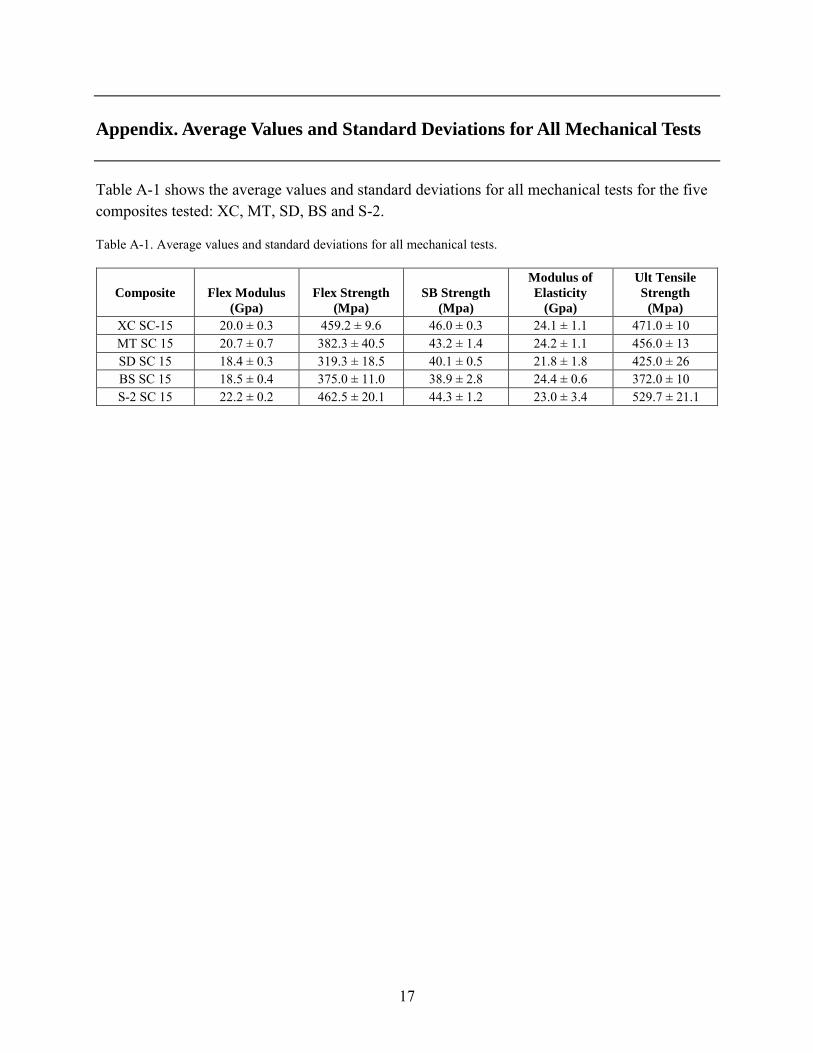
Table A-1 shows the average values and standard deviations for all mechanical tests for the five composites tested: XC, MT, SD, BS and S-2.
Table A-1. Average values and standard deviations for all mechanical tests.
Composite
Flex Modulus
(Gpa)
Flex Strength
(Mpa)
SB Strength
(Mpa)
Modulus of
Elasticity
(Gpa)
Ult Tensile
Strength
(Mpa)
XC SC-15 20.0 ± 0.3 459.2 ± 9.6 46.0 ± 0.3 24.1 ± 1.1 471.0 ± 10 MT SC 15 20.7 ± 0.7 382.3 ± 40.5 43.2 ± 1.4 24.2 ± 1.1 456.0 ± 13 SD SC 15 18.4 ± 0.3 319.3 ± 18.5 40.1 ± 0.5 21.8 ± 1.8 425.0 ± 26 BS SC 15 18.5 ± 0.4 375.0 ± 11.0 38.9 ± 2.8 24.4 ± 0.6 372.0 ± 10 S-2 SC 15 22.2 ± 0.2 462.5 ± 20.1 44.3 ± 1.2 23.0 ± 3.4 529.7 ± 21.1
18
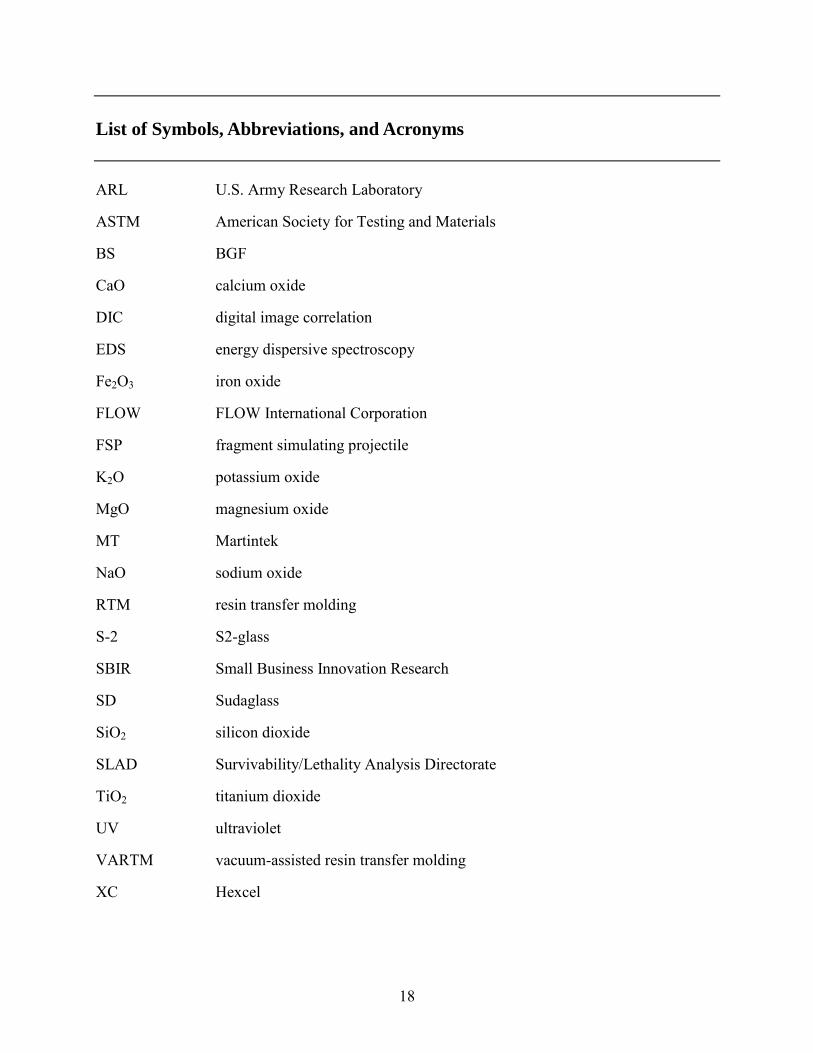
List of Symbols, Abbreviations, and Acronyms
ARL U.S. Army Research Laboratory
ASTM American Society for Testing and Materials
BS BGF
CaO calcium oxide
DIC digital image correlation
EDS energy dispersive spectroscopy
Fe2O3 iron oxide
FLOW FLOW International Corporation
FSP fragment simulating projectile
K2O potassium oxide
MgO magnesium oxide
MT Martintek
NaO sodium oxide
RTM resin transfer molding
S-2 S2-glass
SBIR Small Business Innovation Research
SD Sudaglass
SiO2 silicon dioxide
SLAD Survivability/Lethality Analysis Directorate
TiO2 titanium dioxide
UV ultraviolet
VARTM vacuum-assisted resin transfer molding
XC Hexcel
NO. OF COPIES ORGANIZATION
19
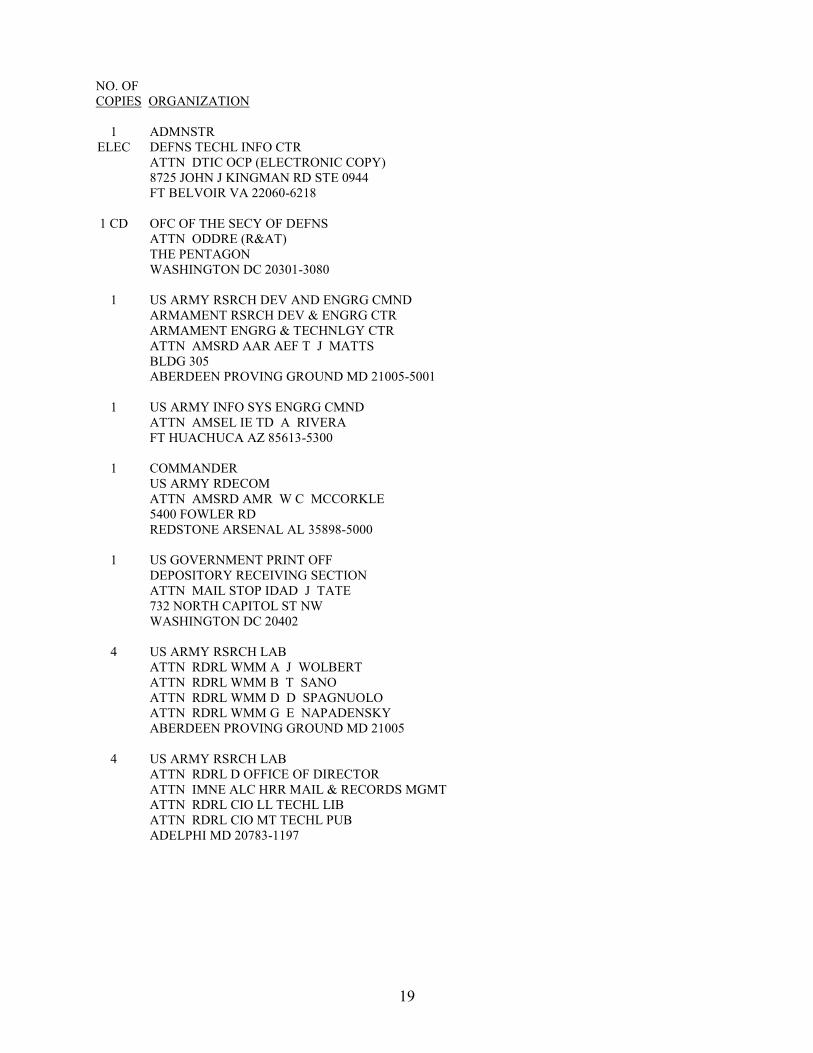
1 ADMNSTR ELEC DEFNS TECHL INFO CTR ATTN DTIC OCP (ELECTRONIC COPY) 8725 JOHN J KINGMAN RD STE 0944 FT BELVOIR VA 22060-6218 1 CD OFC OF THE SECY OF DEFNS ATTN ODDRE (R&AT) THE PENTAGON WASHINGTON DC 20301-3080 1 US ARMY RSRCH DEV AND ENGRG CMND ARMAMENT RSRCH DEV & ENGRG CTR ARMAMENT ENGRG & TECHNLGY CTR ATTN AMSRD AAR AEF T J MATTS BLDG 305 ABERDEEN PROVING GROUND MD 21005-5001 1 US ARMY INFO SYS ENGRG CMND ATTN AMSEL IE TD A RIVERA FT HUACHUCA AZ 85613-5300 1 COMMANDER US ARMY RDECOM ATTN AMSRD AMR W C MCCORKLE 5400 FOWLER RD REDSTONE ARSENAL AL 35898-5000 1 US GOVERNMENT PRINT OFF DEPOSITORY RECEIVING SECTION ATTN MAIL STOP IDAD J TATE 732 NORTH CAPITOL ST NW WASHINGTON DC 20402 4 US ARMY RSRCH LAB ATTN RDRL WMM A J WOLBERT ATTN RDRL WMM B T SANO ATTN RDRL WMM D D SPAGNUOLO ATTN RDRL WMM G E NAPADENSKY ABERDEEN PROVING GROUND MD 21005 4 US ARMY RSRCH LAB ATTN RDRL D OFFICE OF DIRECTOR ATTN IMNE ALC HRR MAIL & RECORDS MGMT ATTN RDRL CIO LL TECHL LIB ATTN RDRL CIO MT TECHL PUB ADELPHI MD 20783-1197
20
INTENTIONALLY LEFT BLANK.

![Flexural Behaviour of Basalt Fiber Reinforced Concrete ... · Basalt rock can also make basalt rock, chopped basalt fiber, basalt fabrics and continuous filament wire [9]. Basalt](https://img.pdfslide.us/doc/110x75/5e8d373fa059ea2b69053027/flexural-behaviour-of-basalt-fiber-reinforced-concrete-basalt-rock-can-also.jpg)