Embed Size (px)
Citation preview

INVESTIGATION OF ANTIOXIDANT ACTIVITIES OF FRUIT JUICES AND HERBAL TEAS AND THEIR ANTIMICROBIAL EFFECTS ON PROTEUS
MIRABILIS
A THESIS SUBMITTED TO THE GRADUATE SCHOOL OF NATURAL AND APPLIED SCIENCES
OF MIDDLE EAST TECHNICAL UNIVERSITY
BY
YE�İM KÜMBET
IN PARTIAL FULLFILLMENT OF THE REQUIREMENTS FOR
THE DEGREE OF MASTER OF SCIENCE IN
BIOCHEMISTRY
SEPTEMBER 2010

Approval of the thesis:
INVESTIGATION OF ANTIOXIDANT ACTIVITIES OF FRUIT JU ICES AND HERBAL TEAS AND THEIR ANTIMICROBIAL EFFECTS ON PROT EUS
MIRABILIS
submitted by Yeşim KÜMBET in partial fulfillment of the requirements for the degree of Master of Science in Biochemistry Department, Middl e East Technical University by, Prof. Dr. Canan Özgen ________________ Dean, Graduate School of Natural and Applied Sciences Prof. Dr. Mesude İşcan ________________ Head of Department, Biochemistry Dept., METU Assoc. Prof. Dr. Nursen Çoruh Supervisor, Chemistry Dept., METU ________________ Assist. Prof. Dr. A. Gülçin Sağdıçoğlu Celep _______________ Co-Supervisor Industrial Arts Dept., Gazi University Examining Committee Members: Prof. Dr. Mesude İşcan _____________________ Biology Dept., METU Prof. Dr. Musa Doğan _____________________ Biology Dept., METU Prof. Dr. Alev Bayındırlı _____________________ Food Engineering Dept., METU Assoc. Prof. Dr. Nursen Çoruh _____________________ Chemistry Dept., METU Assist. Prof. Dr. A. Gülçin Sağdıçoğlu Celep _____________________ Family and Consumer Sci. Dept., Gazi University Date: 17.09.2010
iii
I hereby declare that all information in this docum ent has been obtained and presented in accordance with academic rules and ethical conduct. I also declare that, as required by these rules and c onduct, I have fully cited and referenced all material and results that are not original to the this work. Name, Last name: Yeşim KÜMBET Signature :
iv
ABSTRACT
INVESTIGATION OF ANTIOXIDANT ACTIVITIES OF FRUIT JUICES AND
HERBAL TEAS AND THEIR ANTIMICROBIAL EFFECTS ON PROTEUS
MIRABILIS
KÜMBET, Yeşim
M.Sc., Department of Biochemistry
Supervisor : Assoc. Prof. Dr. Nursen ÇORUH
Co-Supervisor: Assist. Prof. Dr. A. Gülçin SAĞDIÇOĞLU CELEP
September 2010, 65 pages
Herbal teas and fruit juices used in our regular diet may have importance in
the protective treatment of some infectious diseases. In this study, selected
dietary beverages were investigated for their antioxidant capacities and
antimicrobial activities against Proteus mirabilis, a well known bacteria in
urinary tract infections.
Herbal teas; sage (Salvia fruticosa Mill), anise (Pimpinella anisum L.),
rosehip (Rosa canina L.), camomile (Anthemis arvensis L.) and fruit juices;
grape (Vitis vinifera L.), orange (Citrus sinensis L.), peach (Prunus persica
L.), and pomegranate (Punica granatum L.) were chosen as samples of
regular diets. Selected fruit juices and aqueous infusion tea extracts,
lyophilised to dryness, were used throughout this study. Antioxidant

v
capacities of the extracts were carried out by using 2,2’-azinobis-(3-
ethylbenzothiazoline-6-sulfonic acid) radical scavenging (ABTS) and 2,2-
diphenyl-1-picrylhydrazyl radical scavenging (DPPH) methods along with the
determination of total phenolic compounds in the extracts.
Antimicrobial activities of extracts were determined by disc diffusion test,
minimum inhibitory concentration (MIC) and minimum bactericidal
concentration (MBC) methods.
Among the herbal teas, sage infusion extract has displayed the highest
radical scavenging capacity with ABTS EC50 value of 5.152 mg/mL, DPPH
EC50 value of 0.072 mg/mL and with its high phenolic content of 0.411
mg/mg gallic acid equivalence. Among the fruit juices pomegranate has
revealed significantly high DPPH EC50 and TEAC values 0.924 mg/mL and
0.552 mmol/g, respectively. Peach juice has been found with the highest total
phenolic amount of 0.067 mg/mg gallic acid equivalent.
Antimicrobial activities of herbal teas were correlating with antioxidant
capacity studies, whereas sage infusion tea extract exhibited 3 mg/mL of
minimum inhibitory concentration (MIC) and 6 mg/mL of minimum
bactericidal concentration (MBC). Rosehip was also found as an effective
antimicrobial agent with a minimum inhibitory concentration value of 3
mg/mL. In the meantime, there was no significant difference in the zone
inhibition of herbal tea infusion extracts. In case of fruit juices grape and
pomegranate may be effective antimicrobials in P. mirabilis infections with
0.75 mg/mL MIC and 6 mg/mL MBC, respectively at the same time both
juices revealed significantly high inhibition zones with 11 mm.
Keywords: Proteus mirabilis, urinary tract infection, extraction, antioxidant,
antimicrobial activity
vi
ÖZ
MEYVE SUYU VE BİTKİ ÇAYLARININ ANTİOKSİDAN AKTİVİTELERİNİN
İNCELENMESİ VE PROTEUS MİRABİLİS ÜZERİNE ANTİMİKROBİYAL
ETKİLERİ
KÜMBET, Yeşim
Yüksek Lisans, Biyokimya Bölümü
Tez Yöneticisi: Doç. Dr. Nursen ÇORUH
Ortak Tez Yöneticisi: Yrd. Doç. Dr. A.Gülçin SAĞDIÇOĞLU CELEP
Eylül 2010, 65 sayfa
Günlük diyette kullanılan bitki çayları ve meyve suları, bazı enfeksiyon
hastalıklarının koruyucu tedavisinde önem arz edebilmektedir. Bu çalışmada,
bazı diyetsel içeceklerin antioksidan kapasiteleri ve idrar yolları
enfeksiyonuna yol açtığı bilinen bir patojen olan Proteus mirabilis üzerine
antimikrobiyal etkileri araştırılmıştır.
Adaçayı, anason, kuşburnu, papatya gibi bitki çayları ve üzüm, portakal,
şeftali, nar gibi meyve suları günlük diyetlerden örnekler olarak seçilmiştir.
Seçilmiş olan, liyofilizasyonla elde edilmiş meyve suları ve sulu demlenmiş
çay özütleri bu çalışma boyunca kullanılmıştır. Özütlerin antioksidan
kapasiteleri 2,2’-azinobis-(3-etilbenzotiyazolin-6-sülfonik asit) radikali

vii
yakalama (ABTS) ve 2,2-difenil-1-pikrilhidrazil radikali yakalama (DPPH)
metodları ile toplam fenolik madde tayini ile çalışılmıştır. Özütlerin
antimikrobiyal aktiviteleri disk difüzyon testi, minimum inhibe edici
konsantrasyon (MİK) ve minimum bakterisidal konsantrasyon (MBK)
metodları kullanılarak incelenmiştir.
Bitki çaylarından, 0.411 mg/mg lık gallik asit eşleniğiyle yüksek fenolik madde
miktarına sahip olan, demlenmiş adaçayı özütü 5.152 mg/mL lik ABTS EC50
değeri ve 0.072 mg/mL lik DPPH EC50 değeri ile en yüksek radikal yakalama
kapasitesi göstermiştir. Meyve sularından nar suyu sırasıyla 0.924 mg/mL ve
0.552 mmol/g lık DPPH EC50 ve TEAC değerleriyle dikkate alınır bir aktivite
göstermiştir. �eftali suyunun 0.067 mg/mg lık gallik asite eş değer yüksek
toplam fenolik içeriğine sahip olduğu bulunmuştur.
Adaçayı demleme özütü, göstermiş olduğu 3 mg/mL lik minimum inhibe edici
konsantrasyonu ve 6 mg/mL lik minimum bakteri öldürücü konsantrasyonu
ile bitki çaylarının antimikrobiyal aktivitelerinin antioksidan kapasiteleriyle
uyumlu olduğunu sonucunu vermiştir. Kuşburnu demleme çay özütü de 3
mg/mL lik minimum inhibe edici konsantrasyonu ile etkili bir antimikrobiyal
olarak belirlenmiştir. Aynı zamanda, bitki çayı demleme özütlerinin inhibe
ettikleri alanlar arasında dikkate değer bir farklılık gözlenmemiştir. Meyve
sularından üzüm ve nar sularının 0.75 mg/mL MİK ve 6 mg/mL MBC
değerleri ve meyve suları içinde en yüksek oldugu belirlenen 11 mm lik inhibe
ettikleri alanlarla P. mirabilis enfeksiyonlarında etkili olabilecekleri
belirlenmiştir.
Anahtar Kelimeler: Proteus mirabilis, idrar yolu enfeksiyonu, özütleme,
antioksidan, antimikrobiyal aktivite

viii
To my family
ix
ACKNOWLEDGEMENTS
I would like to express my deepest gratitude to my supervisor Assoc. Prof. Dr.
Nursen Çoruh for her guidance, encouragement, advice, constructive criticism, and
her incredible patience throughout this study.
I would like to also thank to my co-supervisor Assist. Prof. Dr. Gülçin Sağdıçoğlu
Celep for her guidance and valuable advice.
I appreciate for the patience, criticism and advice of my thesis examining committee
members; Prof. Dr. Mesude İşcan, Prof. Dr. Musa Doğan, Prof. Dr. Alev Bayındırlı
and Assist. Prof. Dr. Gülçin Sağdıçoğlu Celep, while reading and commenting on my
thesis study.
I wish to express my special thanks to my lab-mates Can Nebigil, Nizamettin
Özdoğan and Burak Barut for their support and asistance in the laboratory when I
need.
My dear friends and lab-mates; Elif Aşık, Aslıgül Aksoy, Özge Kaya, �ule �ahin,
Emrah Sağır and Ayten Eroğlu are gratefully acknowledged.
I would like to send my ultimate appreciation to Meltem Yılmaz and Doğukan Doğan
for their asistance; and to Derya Çelik, Alp Aykut Kibar, Emre Taşkıran and Aytaç
�engül for their friendship and encouragement.
I am thankful to the Graduate School of Natural and Applied Sciences of Middle
East Technical University for supporting this study with grants for graduate students
(BAP).
Last but not least, I am very grateful to my family; İbrahim Kümbet, Kerime Kümbet
and Elif Kümbet for their eternal love, encouragement, support and trust.
x
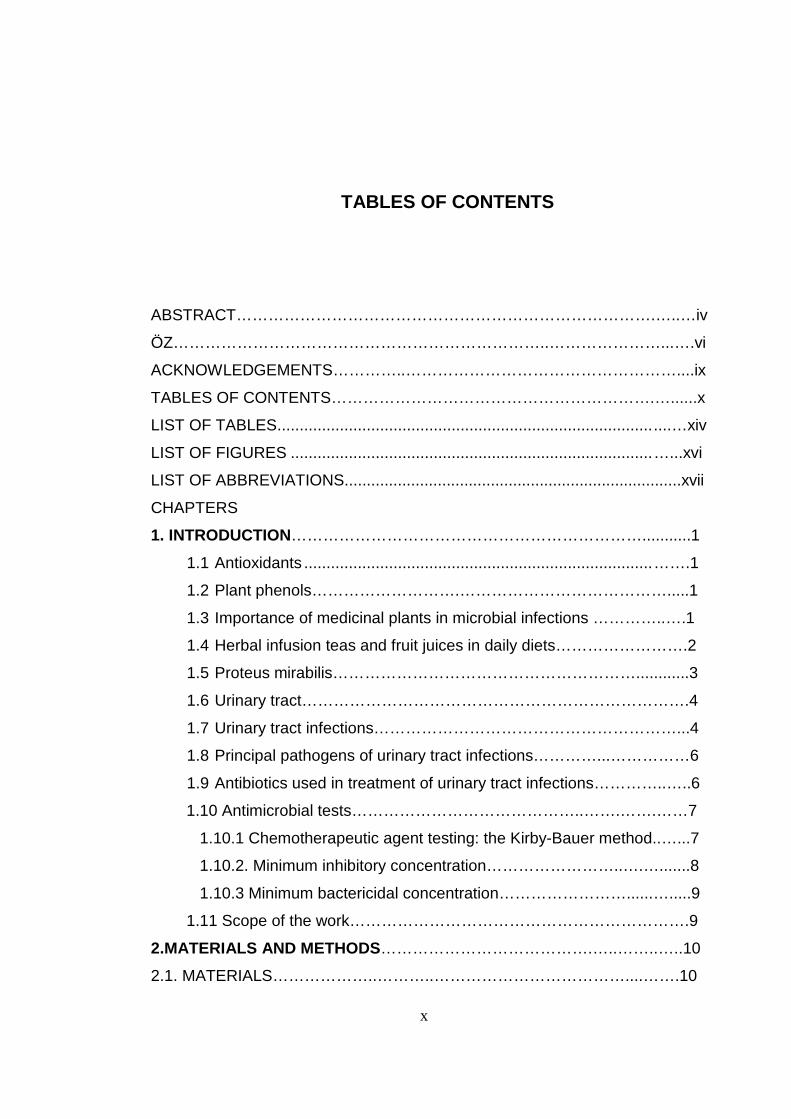
TABLES OF CONTENTS
ABSTRACT…………………………………………………………………….…..…iv
ÖZ……………………………………………………………..…………………...….vi
ACKNOWLEDGEMENTS…………..……………………………………………....ix
TABLES OF CONTENTS…………………………………………………….…......x
LIST OF TABLES .................................................................................... ....…xiv
LIST OF FIGURES ................................................................................. …...xvi
LIST OF ABBREVIATIONS............................................................................xvii
CHAPTERS
1. INTRODUCTION…………………………………………………………...........1
1.1 Antioxidants .............................................................................. …….1
1.2 Plant phenols……………………….………………………………….....1
1.3 Importance of medicinal plants in microbial infections …………..….1
1.4 Herbal infusion teas and fruit juices in daily diets…………………….2
1.5 Proteus mirabilis…………………………………………………............3
1.6 Urinary tract……………………………………………………………….4
1.7 Urinary tract infections…………………………………………………...4
1.8 Principal pathogens of urinary tract infections…………...……………6
1.9 Antibiotics used in treatment of urinary tract infections…………..…..6
1.10 Antimicrobial tests……………………………………..…….…….……7
1.10.1 Chemotherapeutic agent testing: the Kirby-Bauer method..…...7
1.10.2. Minimum inhibitory concentration……………………..….….......8
1.10.3 Minimum bactericidal concentration……………………......….....9
1.11 Scope of the work……………………………………………………….9
2.MATERIALS AND METHODS ………………………………….…..……..…..10
2.1. MATERIALS………………..………..………………………………....…….10

xi
2.1.1 Chemicals……………………………….…………………………….10
2.2.2 Apparatus…………………….………………………………….…....12
2.2 METHODS………………………………………………………………...…..13
2.2.1 Preparation of the plant extracts………………………………...…..13
2.2.2 Preparation of the microbial strains and stocks…………………....14
2.2.3 Bacterial growth curve……..…………………………………………15
2.2.3.1 Determination of OD570 values versus growth time…..…..15
2.2.3.2 Estimation of colony numbers of bacteria versus growth
time………………………….………………………………………………..........15
2.2.3.3 Estimation of colony forming unit……………………….......16
2.2.4 Antibacterial activity tests…………………...…………………...……17
2.2.4.1 Kirby-Bauer disc diffusion method……………………...……17
2.2.4.2 Minimum inhibitory concentrations…………….…..………...18
2.2.4.2.1 Solvent Effects………………………………………18
2.2.4.2.2 Stock solutions of plant extracts……………....…..20
2.2.4.2.3 Minimum inhibitory concentration determination by
micro broth dilution method……………………………………………………..21
2.2.4.2.4 Minimum bactericidal concentration determination
by micro agar dilution method………………………………………………...…23
2.2.5 Antioxidant activity tests…………………………….………….…….24
2.2.5.1 ABTS method………………………………….………...…..24
2.2.5.2 DPPH method…………………………….……….…………26
2.2.5.3 Total phenolic content……………………………..………..27
2.2.6 Statistical analysis…………………………………………………….28
3. RESULTS AND DISCUSSION……………………………………….………29
3.1 Antimicrobial activity of extracts on Proteus mirabilis……………........29
3.1.1 Bacterial growth curve…………………….…….………..….…….29
3.1.2 Preparation of extract concentrations…………….……..….……32
3.1.3 Minimum inhibitory concentration………………….….….………33
3.1.3.1 Solvent effects…………………..…..………….….………33
3.1.3.2 Minimum inhibitory concentration of extracts………......35

xii
3.1.3.2.1 Minimum inhibitory concentration of tea
infusions………………………………..……………………………….….….…..35
3.1.3.2.2 Minimum inhibitory concentration of fruit
juices……………………………………………………………………..…...……37
3.1.4 Minimum bactericidal concentration of extracts…………...…....40
3.1.4.1 Minimum bactericidal concentration of tea infusion
extracts…………………………………………...……………………………..…40
3.1.4.2 Minimum bactericidal concentration of fruit
juices………………………………………………….………………..…………..41
3.1.5 Antimicrobial activity of extracts by disk diffusion test………....43
3.1.5.1 Antimicrobial activity of tea infusions by disc diffusion
test………………………………..…………………………………………..….…43
3.1.5.2 Antimicrobial activity of fruit juices by disc
diffusion test……………………………………………………………….………44
3.2 Determination of antioxidant activities……………………………..…..…46
3.2.1 ABTS method…………………………………………………….…..46
3.2.1.1 Determination of free radical scavenging capacities of
tea infusion extracts by ABTS method………………………..………..…....…47
3.2.1.2 Determination of antioxidant capacities of fruit juice
extracts by ABTS method……………………………………………….…....….48
3.2.2 Determination of antioxidant capacities of extracts
by DPPH method……………………………………….……………….…..…....49
3.2.2.1 Determination of radical scavenging activities of
tea infusion extracts by DPPH method……………………………….….……..49
3.2.2.2 Determination of radical scavenging activities of fruit juices
by DPPH method…………………..…..………………………………………….51
3.2.3 Determination of total phenolic content of extracts………....……53
3.2.3.1 Determination of total phenolic content of tea infusion
extracts…………………………………………………………..…………...……54
3.2.3.2 Determination of total phenolic content of fruit juices…..55
4. CONCLUSION………………..………………………………………………..58
REFERENCES…………………………………………...……………………….60
xiii
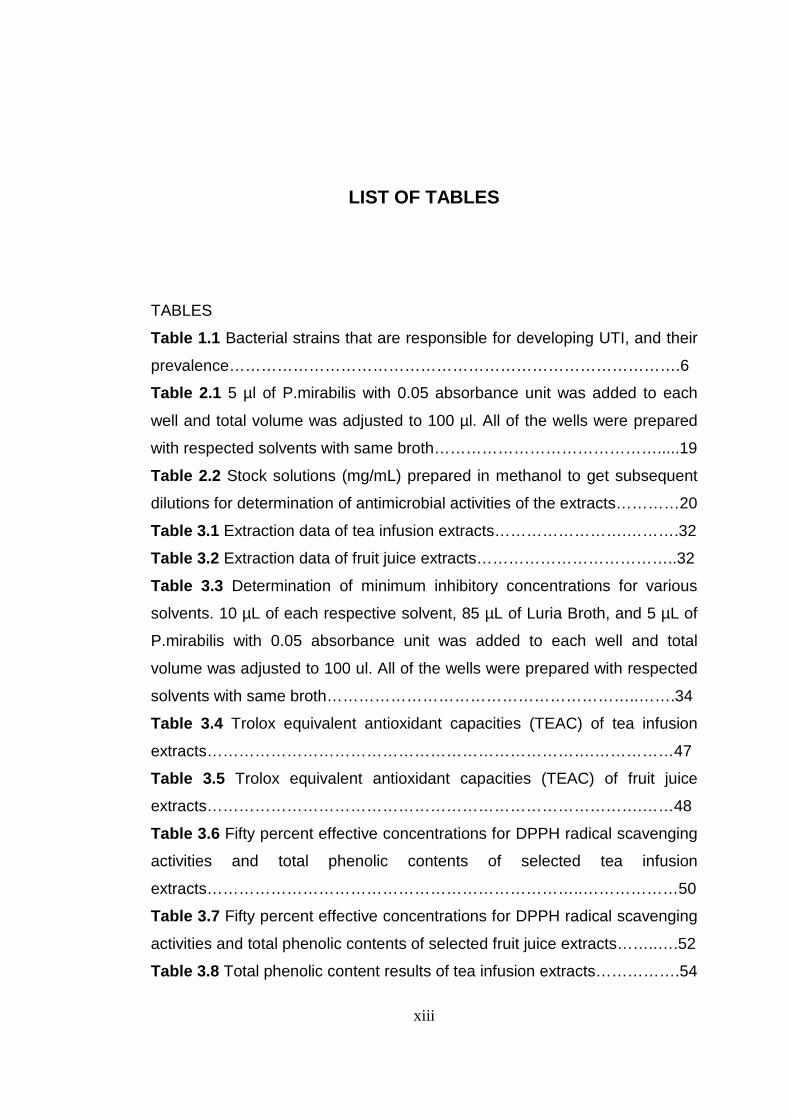
LIST OF TABLES
TABLES
Table 1.1 Bacterial strains that are responsible for developing UTI, and their
prevalence………………………………………………………………………….6
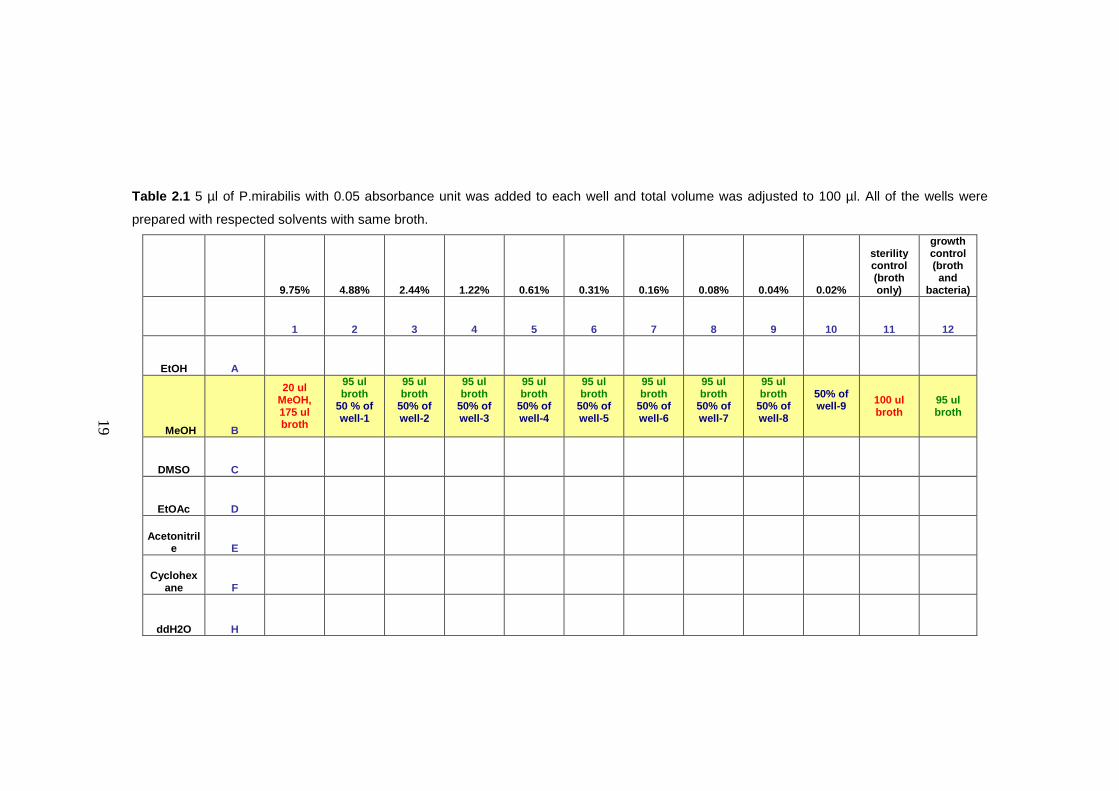
Table 2.1 5 µl of P.mirabilis with 0.05 absorbance unit was added to each
well and total volume was adjusted to 100 µl. All of the wells were prepared
with respected solvents with same broth…………………………………….....19
Table 2.2 Stock solutions (mg/mL) prepared in methanol to get subsequent
dilutions for determination of antimicrobial activities of the extracts…………20
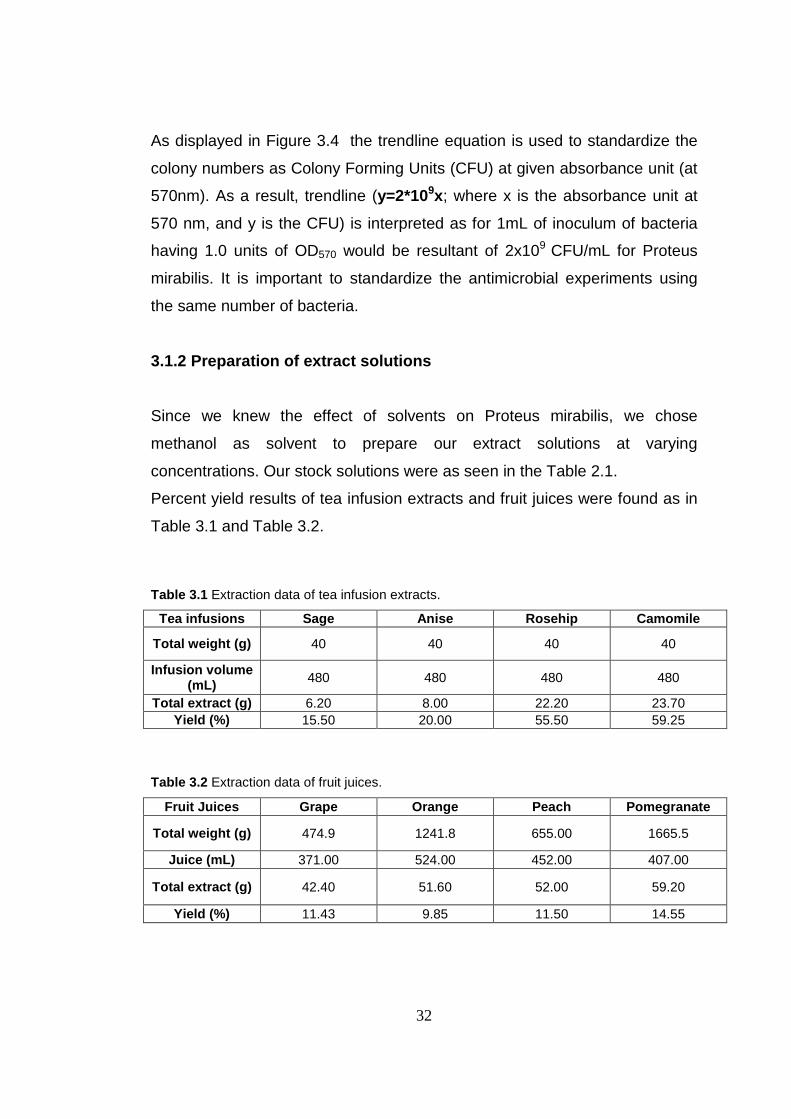
Table 3.1 Extraction data of tea infusion extracts…………………….……….32
Table 3.2 Extraction data of fruit juice extracts………………………………..32
Table 3.3 Determination of minimum inhibitory concentrations for various
solvents. 10 µL of each respective solvent, 85 µL of Luria Broth, and 5 µL of
P.mirabilis with 0.05 absorbance unit was added to each well and total
volume was adjusted to 100 ul. All of the wells were prepared with respected
solvents with same broth…………………………………………………..…….34
Table 3.4 Trolox equivalent antioxidant capacities (TEAC) of tea infusion
extracts……………………………………………………………….……………47
Table 3.5 Trolox equivalent antioxidant capacities (TEAC) of fruit juice
extracts……………………………………………………………………….……48
Table 3.6 Fifty percent effective concentrations for DPPH radical scavenging
activities and total phenolic contents of selected tea infusion
extracts……………………………………………………………..………………50
Table 3.7 Fifty percent effective concentrations for DPPH radical scavenging
activities and total phenolic contents of selected fruit juice extracts……..….52
Table 3.8 Total phenolic content results of tea infusion extracts…………….54

xiv
Table 3.9 Total phenolic content results of fruit juice extracts…...…………..55
Table 3.10 Comparison of DPPH EC50 (mg/mL), TP GAE (mg/mg), MIC
(mg/mL), MBC (mg/mL) and Disk diffusion test (mm) results for all tested
herbal tea infusion and fruit juice dried extracts..………………………….….57
xv
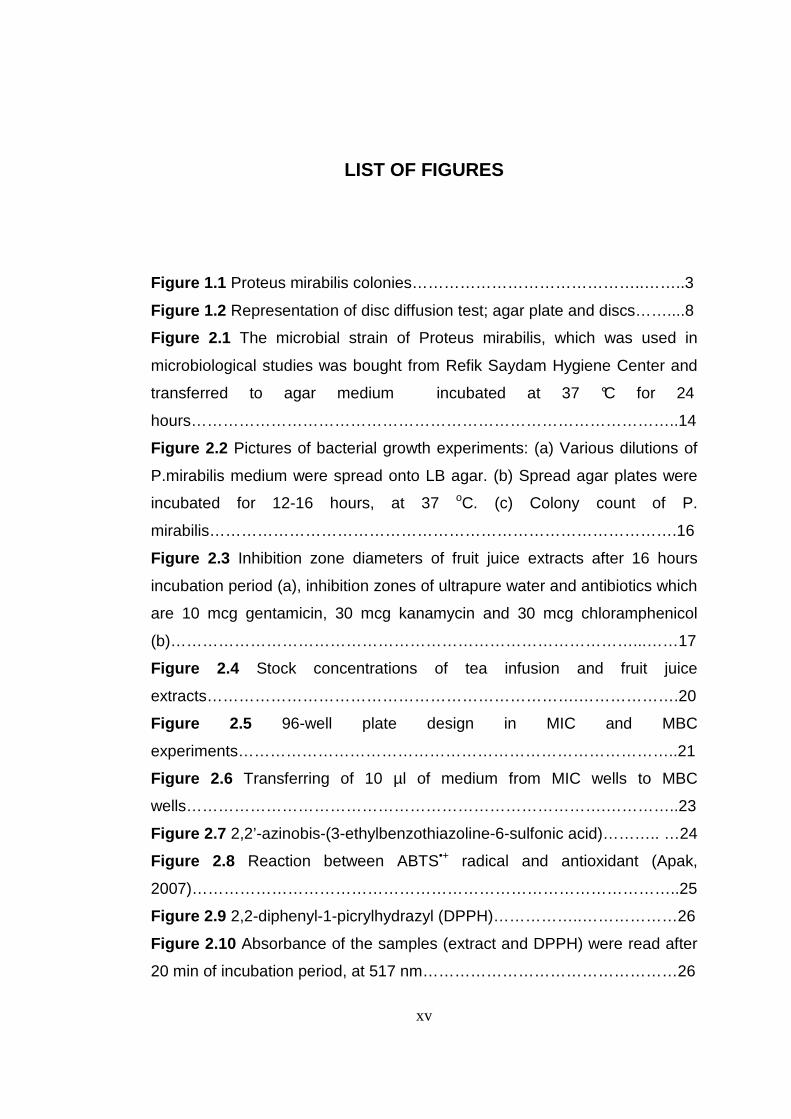
LIST OF FIGURES
Figure 1.1 Proteus mirabilis colonies……………………………………..……..3
Figure 1.2 Representation of disc diffusion test; agar plate and discs……....8
Figure 2.1 The microbial strain of Proteus mirabilis, which was used in
microbiological studies was bought from Refik Saydam Hygiene Center and
transferred to agar medium incubated at 37 °C for 24
hours………………………………………………………………………………..14
Figure 2.2 Pictures of bacterial growth experiments: (a) Various dilutions of
P.mirabilis medium were spread onto LB agar. (b) Spread agar plates were
incubated for 12-16 hours, at 37 oC. (c) Colony count of P.
mirabilis…………………………………………………………………………….16
Figure 2.3 Inhibition zone diameters of fruit juice extracts after 16 hours
incubation period (a), inhibition zones of ultrapure water and antibiotics which
are 10 mcg gentamicin, 30 mcg kanamycin and 30 mcg chloramphenicol
(b)……………………………………………………………………………...……17
Figure 2.4 Stock concentrations of tea infusion and fruit juice
extracts…………………………………………………………….……………….20
Figure 2.5 96-well plate design in MIC and MBC
experiments………………………………………………………………………..21
Figure 2.6 Transferring of 10 µl of medium from MIC wells to MBC
wells…………………………………………………………………….…………..23
Figure 2.7 2,2’-azinobis-(3-ethylbenzothiazoline-6-sulfonic acid)……….. …24
Figure 2.8 Reaction between ABTS•+ radical and antioxidant (Apak,
2007)………………………………………………………………………………..25
Figure 2.9 2,2-diphenyl-1-picrylhydrazyl (DPPH)……………..………………26
Figure 2.10 Absorbance of the samples (extract and DPPH) were read after
20 min of incubation period, at 517 nm…………………………………………26
xvi
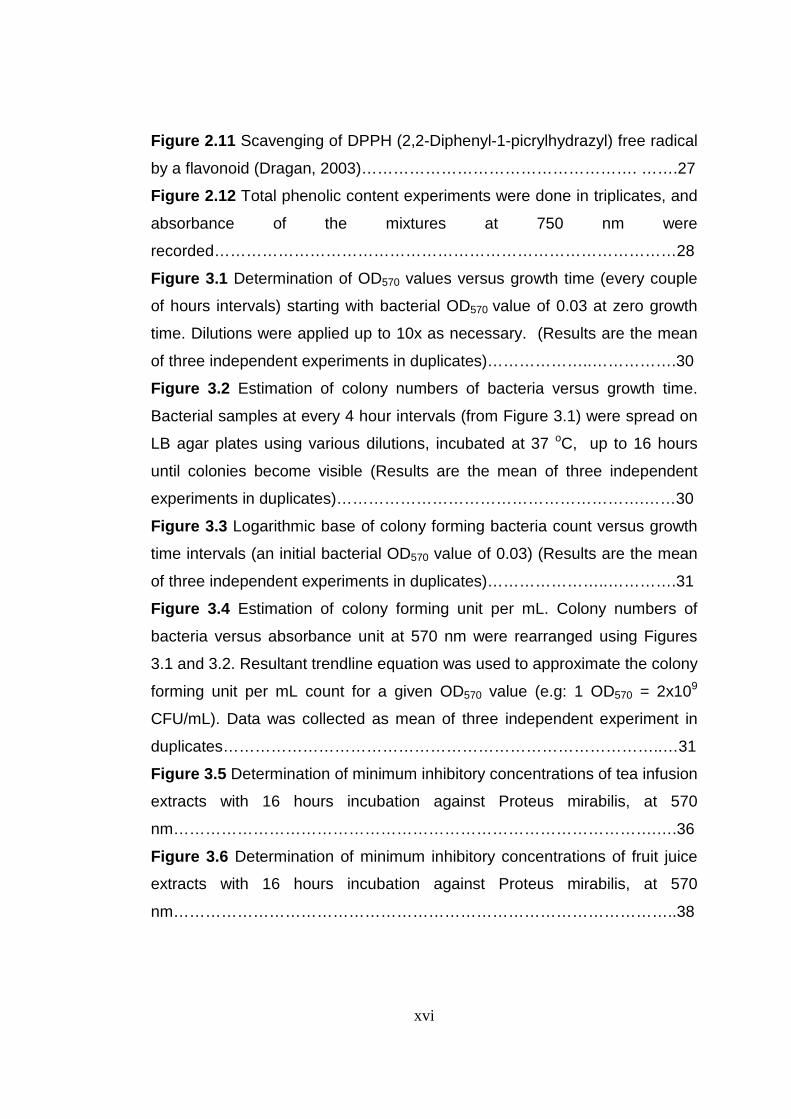
Figure 2.11 Scavenging of DPPH (2,2-Diphenyl-1-picrylhydrazyl) free radical
by a flavonoid (Dragan, 2003)……………………………………………. …….27
Figure 2.12 Total phenolic content experiments were done in triplicates, and
absorbance of the mixtures at 750 nm were
recorded……………………………………………………………………………28
Figure 3.1 Determination of OD570 values versus growth time (every couple
of hours intervals) starting with bacterial OD570 value of 0.03 at zero growth
time. Dilutions were applied up to 10x as necessary. (Results are the mean
of three independent experiments in duplicates)………………..…………….30
Figure 3.2 Estimation of colony numbers of bacteria versus growth time.
Bacterial samples at every 4 hour intervals (from Figure 3.1) were spread on
LB agar plates using various dilutions, incubated at 37 oC, up to 16 hours
until colonies become visible (Results are the mean of three independent
experiments in duplicates)………………………………………………….……30
Figure 3.3 Logarithmic base of colony forming bacteria count versus growth
time intervals (an initial bacterial OD570 value of 0.03) (Results are the mean
of three independent experiments in duplicates)…………………..………….31
Figure 3.4 Estimation of colony forming unit per mL. Colony numbers of
bacteria versus absorbance unit at 570 nm were rearranged using Figures
3.1 and 3.2. Resultant trendline equation was used to approximate the colony
forming unit per mL count for a given OD570 value (e.g: 1 OD570 = 2x10⁹
CFU/mL). Data was collected as mean of three independent experiment in
duplicates………………………………………………………………………..…31
Figure 3.5 Determination of minimum inhibitory concentrations of tea infusion
extracts with 16 hours incubation against Proteus mirabilis, at 570
nm……………………………………………………………………………….….36
Figure 3.6 Determination of minimum inhibitory concentrations of fruit juice
extracts with 16 hours incubation against Proteus mirabilis, at 570
nm…………………………………………………………………………………..38

xvii
Figure 3.7 Minimum bactericidal concentrations (mg/mL) for tea infusion
extracts against Proteus mirabilis at 570 nm. Each data was obtained by
taken the mean of three independent experiments in
triplicates……………………………………………………………….…………..41
Figure 3.8 Minimum bactericidal concentrations (mg/mL) for fruit juice
extracts against Proteus mirabilis at 570 nm. Each data was obtained by
taken the mean of three independent experiments in
triplicates…………………………………………………………...………………42
Figure 3.9 Antimicrobial activities of tea infusion extracts by disk diffusion
method. Diameter of inhibition zone (mm) includes disc diameter of 6 mm.
Each data was collected by means of three indepent experiments in
duplicates…………………………………………………………………………..44
Figure 3.10 Antimicrobial activities of fruit juice extracts by disk diffusion
method. Diameter of inhibition zone (mm) includes disc diameter of 6 mm.
Each data was collected by means of three indepent experiments in
duplicates……………………………………………………………………….….45
Figure 3.11 Trolox standard curve to calculate trolox equivalent antioxidant
capacities of the extracts (at 734 nm).
Each data were calculated by means of three independent experiments in
duplicates (n=6)…………………………………………………………………...46
Figure 3.12 DPPH radical scavenging activity in percent versus extract
concentrations (mg/mL) of tea infusion extracts. DPPH radical scavenging
activities were measured at 20th minute of incubation period, at 517
nm………………………………………………………………………………..…50
Figure 3.13 DPPH radical scavenging activity in percent versus extract
concentrations (mg/mL) of fruit juice extracts. DPPH radical scavenging
activities were measured at 20th minute of incubation period, at 517
nm……………………………………………………………………………….….52
Figure 3.14 Gallic acid standard curve to calculate total phenolic content of
extracts in terms of gallic acid equivalence.
Each data was collected by means of two indepent experiments in
triplicates…………………………………………………………………..……….54

xviii
LIST OF ABBREVIATIONS
mg Milligram
mL Milliliter
µL Microliter
mm Millimeter
nm Nanometer
HPLC High pressure liquid chromatography
UTI Urinary tract infections
ABTS 2,2’-azinobis-(3-ethylbenzothiazoline-6-sulfonic acid)
DPPH 2,2-diphenyl-1-picrylhydrazyl
TP Total Phenolics
TEAC Trolox equivalent antioxidant capacity
GAE Gallic acid equivalent
CFU Colony forming unit
MIC Minimum inhibitory concentration
MBC Minimum bactericidal concentration
a.u. Absorbance unit
DW Dry weight
1
CHAPTER 1
INTRODUCTION
1.1. Antioxidants
Antioxidants are molecules capable of inhibiting the oxidation of other
molecules. Antioxidants has a big role in the maintenance of human health
and prevention and treatment of diseases (Niki, 2010).
1.2 Plant phenols
A phenol is a compound that contains -OH group attached to a benzene ring.
Plants are source of polyphenols that exhibit a wide range of biological
effects as a consequence of their antioxidant properties. Flavonoids are
important phenol groups and most attention has been given to this group.
Fruits, vegetables and herbs contain many compounds with antioxidant
activity. Several plants have been studied as sources of good natural
antioxidants. (Hagerman, 1998).
1.3 Importance of medicinal plants in microbial inf ections
Plants, which contain natural chemicals and have healing characteristics, are
gifts to people by nature; and throughout history, they were used as medical
means by almost every society. Apart from medical effects of plants, they
also can be used as models for research areas in which new antibacterial
drugs can be developed.
2
Reports of World Health Organization (WHO) show that 3.3 billion people in
under-developed and developing countries are benefiting from medicinal
plants as treatment tools. In the recent years medicinal plants, assuming with
minimal side effects, are being investigated regarding their microbiological
and pharmacological properties.
Plants included in our daily diet can also be thought as functional foods. In
this study, therefore fruit juices and herbal teas that are commonly used in
Turkish diet will be investigated for their antimicrobial effects against P.
mirabilis besides their antioxidant properties.
1.4 Herbal infusion teas and fruit juices in daily diets
Fruits and herbs are important sources of chemicals such as ascorbic acid
(orange, rosehip,…), resveratrol (grape), steroid estrogen and pectin
(pomegranate). In this study daily consumed fruit juices and herbal teas were
chosen as samples because of their nutritional values and valuable
chemicals.
Sage: Salvia fruticosa Mill
Anise: Pimpinella anisum L.
Rosehip: Rosa canina L.
Camomile: Anthemis arvensis L.
Grape: Vitis vinifera L.
Orange: Citrus sinensis L.
Peach: Prunus persica L.
Pomegranate: Punica granatum L.
3
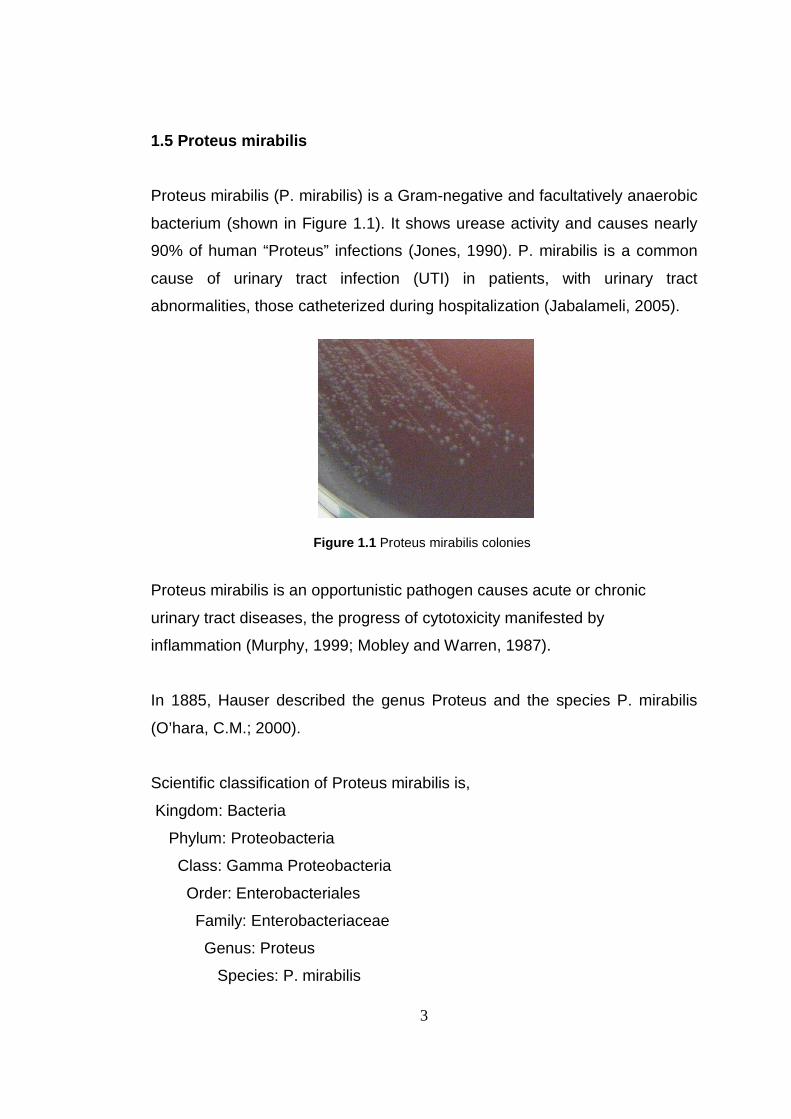
1.5 Proteus mirabilis
Proteus mirabilis (P. mirabilis) is a Gram-negative and facultatively anaerobic
bacterium (shown in Figure 1.1). It shows urease activity and causes nearly
90% of human “Proteus” infections (Jones, 1990). P. mirabilis is a common
cause of urinary tract infection (UTI) in patients, with urinary tract
abnormalities, those catheterized during hospitalization (Jabalameli, 2005).
Figure 1.1 Proteus mirabilis colonies
Proteus mirabilis is an opportunistic pathogen causes acute or chronic
urinary tract diseases, the progress of cytotoxicity manifested by
inflammation (Murphy, 1999; Mobley and Warren, 1987).
In 1885, Hauser described the genus Proteus and the species P. mirabilis
(O’hara, C.M.; 2000).
Scientific classification of Proteus mirabilis is,
Kingdom: Bacteria
Phylum: Proteobacteria
Class: Gamma Proteobacteria
Order: Enterobacteriales
Family: Enterobacteriaceae
Genus: Proteus
Species: P. mirabilis

4
1.6 Urinary Tract
The urinary tract consists of the organs kidneys, ureters, bladder, and urethra
that produce, store, and get rid of urine.
1.7 Urinary tract infections:
Urinary tract infections (UTI) is defined as the presence of bacteria in urine
with symptoms of infection. It was reported that nearly half of all adult women
suffer from UTI at least once in their lifetime. Chronic infections in the upper
urinary tract is a major cause of renal disease (Bergsten, 2005; Wael, 2008).
Symptoms of UTI are:
• pain or burning during urination
• need to urinate too often, even right after the bladder is emptied
• blood in the urine
• cloudy urine
• a foul odor to the urine
• urinary incontinence
• fever and chills
• nausea and vomiting
• pain, cramps or heaviness in the lower abdomen, pelvic area, or in the
back below the ribs
Urinary tract infections may also fail the symptoms. This condition, that is
“asymptomatic bacteriuria”, is known to heal without a treatment. It is
especially, common in pregnant women manifesting itself in pre-term labor if
not treated. In children, it appears with high fever without other symptoms
(UCLA Health System).
5
The incidence of urinary tract infections is much higher in adult women due to
anatomical and physiological reasons . However due to the urinary tract
lesion formation in males and children, it is more dangerous and must be
treated immediately to suppress the infection and prevent spreading. The
patient’s background also helps to categorize UTIs according to age, type of
urinary tract lesion(s), and patients with suppressed immune system,
especially in diabetes and pregnancy. A wide spectrum of treatment can be
ranging from a single-dose antibiotic treatment of simple cystitis in young
females, to rescue nephrectomy for pyonephrosis in diabetic patients with
septic shock (Meyrier, 2003).
The following also increase the chance of developing UTI:
• Diabetes
• Advanced age (especially people in nursing homes)
• Problems emptying the bladder (urinary retention) because of brain or
nerve disorders
• A tube called a urinary catheter inserted into urinary tract
• Bowel incontinence
• Enlarged prostate, narrowed urethra, or anything that blocks the flow
of urine
• Kidney stones
• Staying still (immobile) for a long period of time (for example, while
recovering from a hip fracture)
• Pregnancy
Urinary tract infection is the most common cause of sepsis in elderly people.
Patients diagnosed with urosepsis should be treated with a suitable antibiotic,
prefarably with a broad-spectrum antibiotic immediately. Unfortunately,
misuse of broad-spectrum antibiotics can cause an increasing resistance to
antibiotics as a big problem in the antibiotic treatment (Tal, 2005).

6
1.8 Principal pathogens of urinary tract infections
The most common causes of UTI are E. coli, Proteus mirabilis, Klebsiella
pneumoniae, Enterococcus sp., Pseudomonas aeruginosa. In rare cases
Candida albicans can cause UTI such as in diabetic patients. Frequency of
incidence in urinary tract infections caused by bacterial strains is given in
Table 1.1.
Table 1.1 Bacterial strains that are responsible for developing UTI, and their prevalence (Vosti, 2007).
Bacterial Strain Prevalence %
Escherichia coli 71%-79%
Proteus mirabilis 1.1%-9.7 %
Klebsiella -
Enterobacter 1.0%-9.2%
Enterococcus 1.0%-3.2%
Staphylococcus saprophyticus 3%-7%
Other species 2%-6%
1.9 Antibiotics used in treatment of urinary tract infections
A suitable antibiotic for UTI must have bactericidal characteristics with
following pharmacological specifications:
1) rapid absorption and fast peaking in serum concentration
2) with high concentrations in the renal or prostate tissue and renal
excretion
3) broad bacterial spectrum to increase the chance of effectiveness.
Antibiotic should also be easily accessible, low cost, tolerability by most of
the patients (Meyrier, 2003).
7
It is reported that Proteus mirabilis is resistant to tetracycline and
nitrofurantoin and susceptible to ampicillin, amoxicillin, piperacillin, cefazolin,
cephoxitin, cefuroxime, cephotaxim, cephtazidim, cephtriaxon, ceftizoxim,
cephepim, amikacin, gentamicin, tobramycin, imipenem, ciprofloxacin, and
co-trimoxazole (Kurtoglu, 2008).
1.10 Antimicrobial tests
1.10.1 Disc diffusion test: the Kirby-Bauer method
Disc diffusion test, is one of the most common methods, used to determine
bacterial sensitivity and resistance to antimicrobial agents, based on
measurement of growth inhibition zones of antimicrobial agents adding on
empty filter discs as indicated in Figure 1.4. Bacteria are standardized
monitoring optical densities, by spreading them on the agar in their early
stages of growth. This method provides equal susceptibility of all cells to
antimicrobial agent. Antimicrobial discs should also be standardized. The
amount of antimicrobial agent on each disc should be the same (Pollack,
2005).
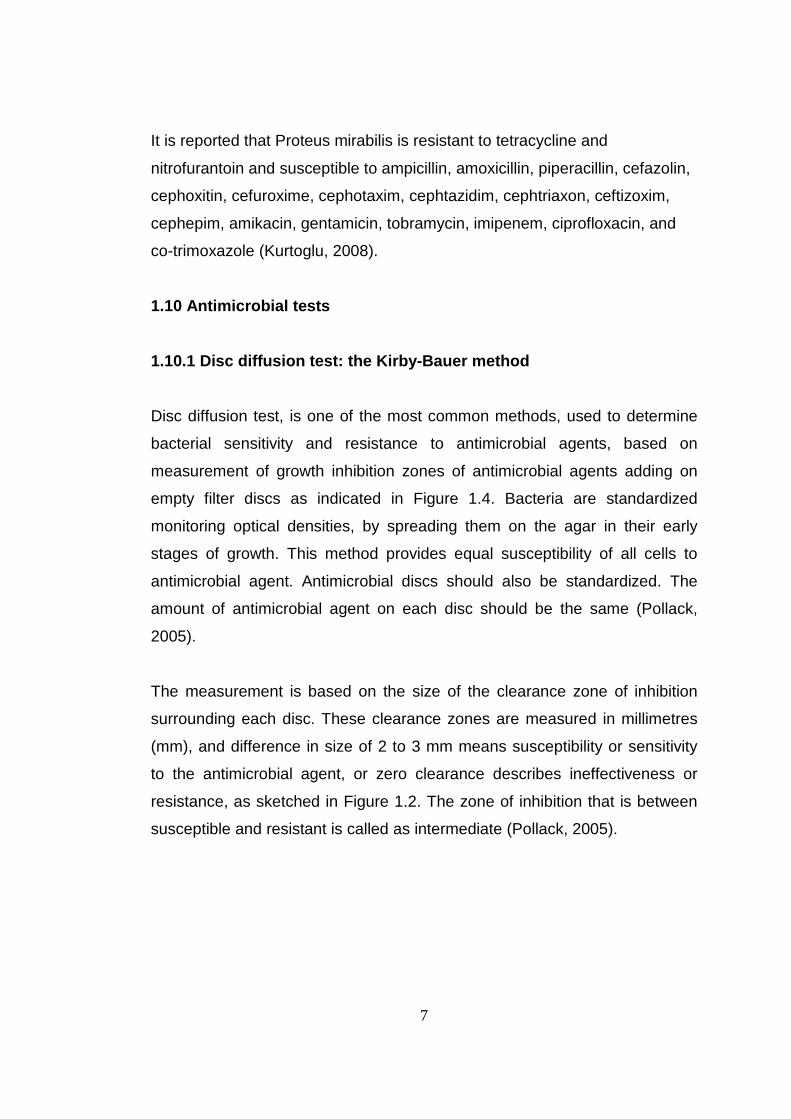
The measurement is based on the size of the clearance zone of inhibition
surrounding each disc. These clearance zones are measured in millimetres
(mm), and difference in size of 2 to 3 mm means susceptibility or sensitivity
to the antimicrobial agent, or zero clearance describes ineffectiveness or
resistance, as sketched in Figure 1.2. The zone of inhibition that is between
susceptible and resistant is called as intermediate (Pollack, 2005).
8
Figure 1.2 Representation of disc diffusion test; agar plate and discs
1.10.2 Minimum inhibitory concentration
The effectiveness of an antimicrobial agent is described in terms of its
minimum inhibitory concentration (MIC), the lowest concentration of the
compound capable of inhibiting the growth of the bacteria of interest (Mann,
1997).
The most commonly used techniques are agar dilution and broth dilution
methods to determine the minimum inhibitory concentration (MIC) of
antimicrobial agents that inhibit the growth (bacteriostatic activity) of bacteria
(Wiegand, 2008).
sensitive
intermediate
resistant
9
1.10.3 Minimum bactericidal concentration
Minimum bactericidal concentration (MBC) is defined as the lowest
concentration of an antimicrobial that kills the bacteria (Andrews, 2001). The
minimum bactericidal concentration of an antimicrobial agent to kill the
bacteria is more important rather than inhibition of the growth. As an
adaptation of the agar dilution method, micro agar dilution method is used to
determine MBC in 96 micro-well plates (Schwalbe, 2007).
1.11 Scope of the work: Plants included in our daily diet can be consumed for protection from lots of
diseases. In this study, fruit juices and herbal teas that are commonly used in
Turkish diet will be investigated for their antioxidant properties and their
antimicrobial effects against P. mirabilis as a new alternative to antibiotics,
which gained resistance throuhgout the years, used in urinary tract infections.

10
CHAPTER 2
MATERIALS AND METHODS
2.1 MATERIALS
2.1.1 Chemicals
Proteus mirabilis used for antimicrobial assays was obtained from Refik
Saydam Hygiene Center (code: RSKK 737).
Luria Bertani agar and Luria Bertani broth were purchased from Merck
(Darmstadt, Germany).
Ready to use agar plates, which contain sheep blood medium, for stock
cultures of Proteus mirabilis, were purchased from OR-BAK (Istanbul,
Turkey).
6 mm diameter antimicrobial susceptibility test discs being used in disc
diffusion tests were purchased from Oxoid (Hants, UK). Standard
antimicrobial discs Gentamycin (10 mcg) and Kanamycin (30 mcg) were
bought from Bioanalyse (50 susceptibility discs for in vitro diagnostic use).
Powder cell culture tested grade of Gentamicin was purchased from Sigma-
Aldrich (Germany).

11
Thermo Scientific Finnpipettes (12 multichannel 5-50 µL, 12 multichannel
100-300 µL, and 8 multichannel 5-50 µL) were used during the experimental
research.
HPLC grade ethanol, methanol, ethyl acetate, acetonitrile, acetone and
hexane were purchased from Merck (Darmstadt, Germany). Cell culture
grade of dimethylsulfoxide was purchased from AppliChem.
Milli-Q system (Milli-pore, Bedford, MA, USA) was used to get ultrapure water
(18.2 M ohm.cm)
Distilled water was obtained from Milli-pore system (>1 M ohm.cm)
Milli-pore sterility filters, 0.4 µm, were used for sterilization of solutions.
2,2'-azino-bis (3-ethylbenzthiazoline-6-sulphonic acid) (ABTS), 6-hydroxy-
2,5,7,8-tetramethylchroman-2-carboxylic acid (trolox), 2,2-diphenyl-1-
picrylhydrazyl (DPPH), sodium carbonate (Na2CO3), were purchased from
Sigma Chemical Company (St.Louis, MO, USA). Folin Ciocalteu’s phenol
reagent was purchased from Merck (Darmstadt, Germany).
Tea bags and fruits which had been bought from local markets. Fresh
rosehips from Rosa canina fruits (from ) had been dried and ground to
prepare rosehip infusion tea. Lipton (Unilever Ltd., Istanbul, Turkey) sage
(Salvia fruticosa) herbal tea, Arifoglu brand (Istanbul, Turkey) anise
(Pimpinella anisum) herbal tea, Dogadan brand (Ankara, Turkey) camomile
(Anthemis arvensis) herbal tea in the form of 20 packages of tea bags had
been bought from local markets in Ankara, Turkey. Grape (Vitis vinifera),
orange (Citrus sinensis), peach (Prunus persica), and pomegranate (Punica
granatum) had been bought freshly from local markets. Herbal tea species
were identified in Biology Department of METU.

12
2.1.2 Apparatus
For antimicrobial assays Class II Safety Cabinet (ESCO, Thailand) was used.
Cary 50 Bio UV-VIS spectrophotometer (Varian, USA) was used for
spectrophometric analyses.
Bio-tek ELISA reader (Elx808-Bio-tek, Germany) (METU, Biology
Department, Prof. Dr. Mesude İşcan Lab.) was used in minimum inhibitory
and bactericidal concentration experiments for 96-well plates.
Nuve EN-500 incubator
Optic Ivymen System (incubator and shaker)
Bandelin Sonorex (ultrasonic bath)
Rotary evaporator (Heidolph Laborota 4000)
Lyophilizator (Heto-Holten Model Maxi-Dry Lyo) in the Central Lab of
Biological Sciences Department , METU.

13
2.2 METHODS
2.2.1 Preparation of the plant extracts
Fruit juice and herbal tea extracts were prepared and kept at 4 °C in the dark,
in our laboratory. Juices of pomegranate, peach, orange and grapes were
grouped as the fruit juices and tea extracts including sage, anise, rosehip,
and camomile were grouped as herbal teas.
Commercial tea-bags of sage, anise and camomile were opened and
weighed a number of them gathered for 40 g of each. Fresh rosehip fruits
were washed and dried at room temperature. Infusion was performed at two
steps. 40 grams of each tea sample was let to infuse in 480 mL boiled
distilled water for about one hour standing at constant room temperature
(25 C̊). Then, infused tea solution were incubated at 37 °C for 24 hours,
using rocking-incubator at 180 rpm, in order to increase the yield. After
incubation, the tea infusion solutions were filtered through filter paper and
filtrates were lyophilized to dryness. The lyophilized aqueous tea extracts
were kept at 4 °C in the dark until they were used.
Individually, 474.9 g of grapes, 1241.8 g of orange, 655 g of peach and
1665.5 g of pomegranate arils were blended using a commercial food
processor to seperate juice from the pulp. Then, juices were filtered through
filter paper and filtrates were lyophilized to dryness and refrigerated (4 °C)
until they were used.

14
2.2.2 Preparation of the microbial strains and stoc ks
Proteus mirabilis (737 RSKK code, from Pasteur Institute) strain was bought
from Refik Saydam Hygiene Center in Ankara. The pellet of Proteus mirabilis
was suspended in 1.0 mL of Luria Broth (LB) and streaked onto ready to use
agar plate containing sheep blood medium, then incubated for 24 hours at 37 oC for short term bacterial stocks, as photographed in Figure 2.1. Then stock
plates were stored at 4 oC room and stocks were renewed each week to
maintain the freshness.
Figure 2.1 The microbial strain of Proteus mirabilis, which was used in microbiological studies was bought from Refik Saydam Hygiene Center and transferred to agar medium incubated at 37 °C for 24 hours.
For long term storage 3 to 5 of the isolated colonies with similar spherical
shapes, from previously described agar stocks were transferred and
suspended a 1.0 mL solution of LB. 100 µL of that suspension then was
inoculated into 100 mL of a new solution of LB medium incubated at 37 oC, at
180 rpm, for 24 hours. At the end of 24 hours, absorbance was monitored at
570 nm and carefully diluted with LB broth to decrease its absorbance to a
0.6 absorbance unit (a.u.). Finally, a 100 µL of the bacterial suspension (with
0.6 a.u.) was mixed with a sterilized pre-chilled 20% (v/v) of 2 mL of glycerol
and 8 mL of distilled water. Glycerol-bacterial solution was seperated into
eppendorphs as 1 mL of aliquots for long term storage at -80 oC freezer.
15
2.2.3 Bacterial growth curve
2.2.3.1 Determination of OD 570 values versus growth time
Proteus mirabilis from the previously described short term stocks were
inoculated to 100 mL of Luria Broth (LB) medium, then incubated at 37 ̊C at
180 rpm for 24 hours. After monitoring absorbance of the bacteria at 570 nm,
bacterial broth solution was diluted with LB broth to reduce the final
absorbance to a 0.03 a.u. Then this bacterial solution was let to grow at 37 ̊̊̊̊C
in the shaker and at every couple of hours absorbance was monitored at
Cary Bio spectrophotometer, by taking samples, and sampling continued up
to 24 hours. Dilutions were applied up to 10x as necessary with LB broth.
Observations were plotted for the OD570 versus time (hr). 1.5 mL of LB broth
was used as blank at spectrophotometric measurements.
2.2.3.2 Estimation of colony numbers of bacteria ve rsus growth time
LB agar plates were prepared by pouring sterilized LB agar as a 3 mm thick
layer into 9 mm petri plates and they were cooled. Bacteria growing at 37 ̊C
sampled at every 4 hour intervals were spread on LB agar plates using
dilutions of 10-5, 10-6, 10-7, 10-8 (Figure 2.2.a) and incubated at 37 oC (Figure
2.2.b), approximately 12-16 hours until colonies became visible for colony
count (Figure 2.2.c). Colony numbers of bacteria on LB agar plates were
estimated by counting the visible bacterial colonies and colony numbers were
plotted against time.
16
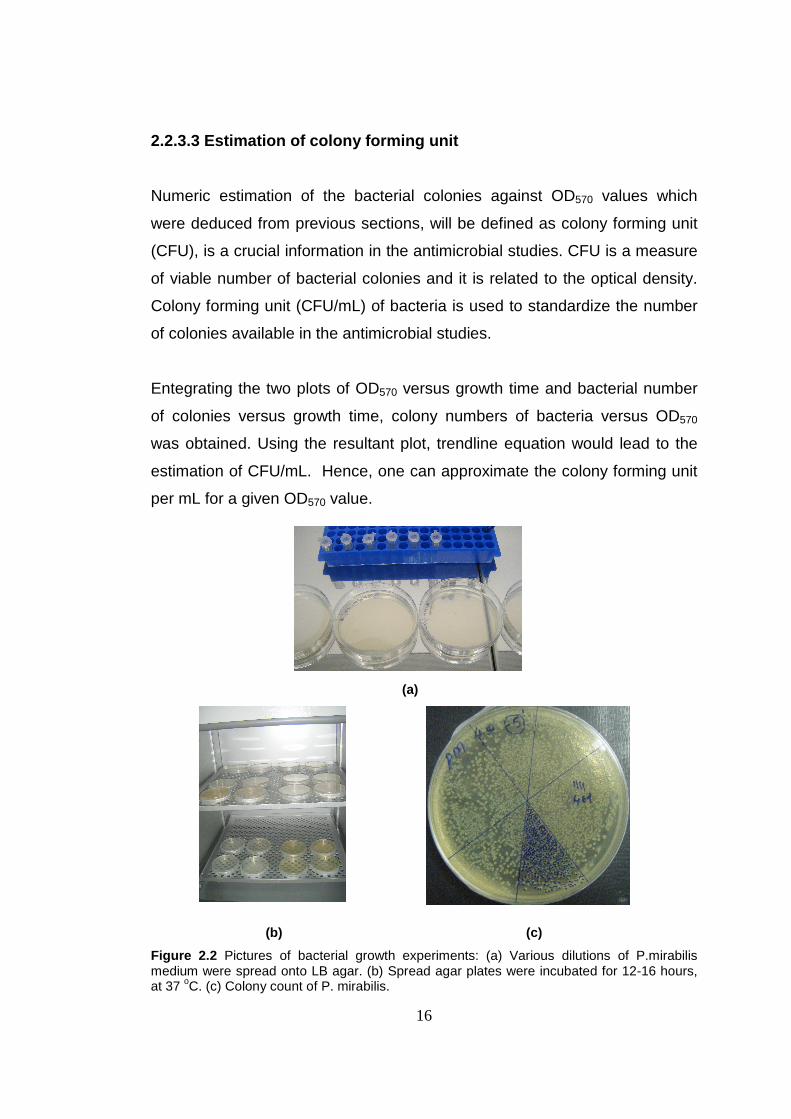
2.2.3.3 Estimation of colony forming unit
Numeric estimation of the bacterial colonies against OD570 values which
were deduced from previous sections, will be defined as colony forming unit
(CFU), is a crucial information in the antimicrobial studies. CFU is a measure
of viable number of bacterial colonies and it is related to the optical density.
Colony forming unit (CFU/mL) of bacteria is used to standardize the number
of colonies available in the antimicrobial studies.
Entegrating the two plots of OD570 versus growth time and bacterial number
of colonies versus growth time, colony numbers of bacteria versus OD570
was obtained. Using the resultant plot, trendline equation would lead to the
estimation of CFU/mL. Hence, one can approximate the colony forming unit
per mL for a given OD570 value.
(a)
(b) (c)
Figure 2.2 Pictures of bacterial growth experiments: (a) Various dilutions of P.mirabilis medium were spread onto LB agar. (b) Spread agar plates were incubated for 12-16 hours, at 37 oC. (c) Colony count of P. mirabilis.
17
2.2.4 Antibacterial activity tests
All of the antimicrobial activity studies were carried out at aseptique
conditions in order to prevent the risk of contamination along with protection
of our own health.
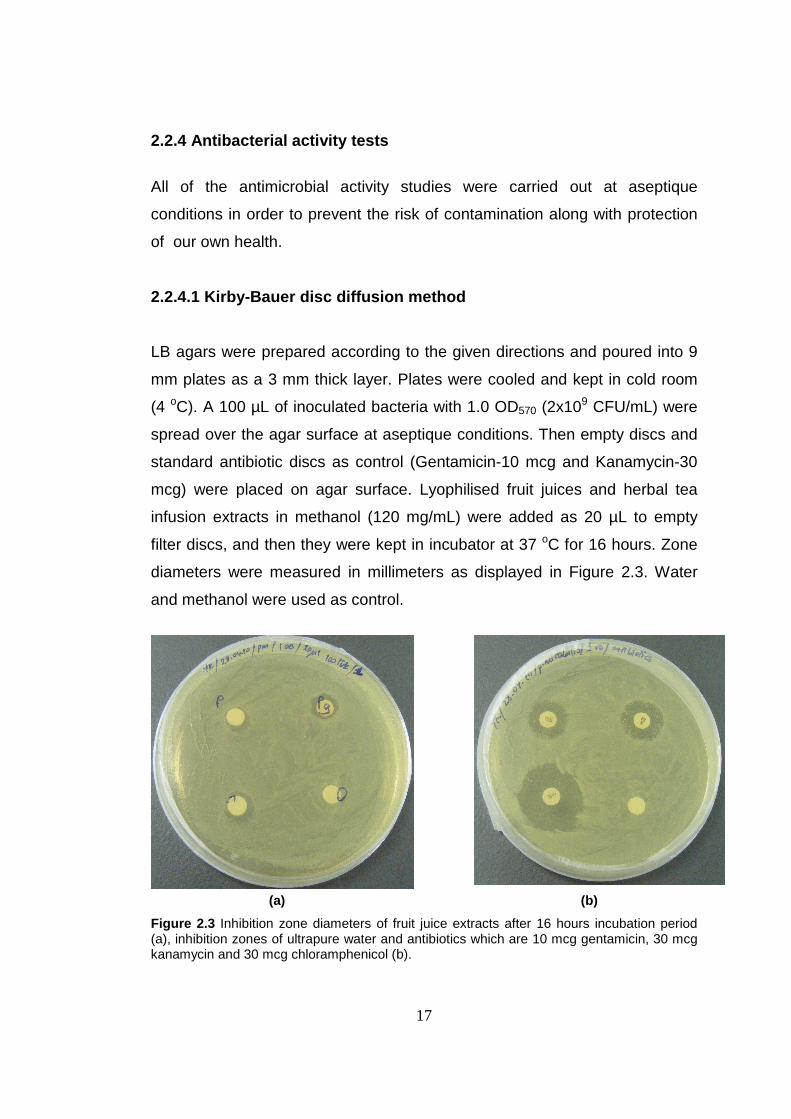
2.2.4.1 Kirby-Bauer disc diffusion method
LB agars were prepared according to the given directions and poured into 9
mm plates as a 3 mm thick layer. Plates were cooled and kept in cold room
(4 oC). A 100 µL of inoculated bacteria with 1.0 OD570 (2x10⁹ CFU/mL) were
spread over the agar surface at aseptique conditions. Then empty discs and
standard antibiotic discs as control (Gentamicin-10 mcg and Kanamycin-30
mcg) were placed on agar surface. Lyophilised fruit juices and herbal tea
infusion extracts in methanol (120 mg/mL) were added as 20 µL to empty
filter discs, and then they were kept in incubator at 37 oC for 16 hours. Zone
diameters were measured in millimeters as displayed in Figure 2.3. Water
and methanol were used as control.
(a) (b)
Figure 2.3 Inhibition zone diameters of fruit juice extracts after 16 hours incubation period (a), inhibition zones of ultrapure water and antibiotics which are 10 mcg gentamicin, 30 mcg kanamycin and 30 mcg chloramphenicol (b).
18
2.2.4.2 Minimum inhibitory concentrations
2.2.4.2.1 Solvent Effects
In the determination of minimum inhibitory concentration (MIC) of solvents
96-well plates were used. The first well of each row contained 20 µL of the
solvent added into 175 mL of LB broth (10% solvent in LB broth). Then, the
solution in the first well was used to prepare ½ serial dilutions of solvent (well
2 to 10) by transferring half of the solution to the next well. Column 11 and 12
were used for sterility control (100 µL of LB only) and growth control (95 mL
of LB medium and bacteria), respectively.
Ethanol (EtOH), methanol (MeOH), dimethylsulfoxide (DMSO), ethyl acetate
(EtOAc), acetonitrile, cyclohexane, acetone, and double distilled water
(ddH2O) were examined as the choice of solvents in respective orders as
displayed in Table 2.1. A 5 µL of the inoculated bacterial suspension at 0.05
OD570 (107 CFU/mL) was added to each well except the column for sterility
control. In sterility control column of wells there was only a 100 µl of broth, in
growth control column of wells there was 95 µL of broth and 5 µL of
inoculated bacteria. After 24 hours incubation at 37 oC, bacterial growth was
observed as if there was bacterial growth or not and minimum inhibitory
concentrations of the solvents were determined.
19
Table 2.1 5 µl of P.mirabilis with 0.05 absorbance unit was added to each well and total volume was adjusted to 100 µl. All of the wells were
prepared with respected solvents with same broth.
9.75% 4.88% 2.44% 1.22% 0.61% 0.31% 0.16% 0.08% 0.04% 0.02%
sterility control (broth only)
growth control (broth and
bacteria)
1 2 3 4 5 6 7 8 9 10 11 12
EtOH A MeOH B
20 ul MeOH, 175 ul broth
95 ul broth
50 % of well-1
95 ul broth
50% of well-2
95 ul broth
50% of well-3
95 ul broth
50% of well-4
95 ul broth
50% of well-5
95 ul broth
50% of well-6
95 ul broth
50% of well-7
95 ul broth
50% of well-8
50% of well-9
100 ul broth
95 ul broth
DMSO C
EtOAc D
Acetonitrile E
Cyclohexane F
ddH2O H
19

20
2.2.4.2.2 Stock solutions of plant extracts
Figure 2.4 Stock concentrations of tea infusion and fruit juice extracts.
All the stock solutions of tea infusion and fruit juice extracts (Figure 2.4) were
prepared in methanol in concentrations as given in the Table 2.2.
Table 2.2 Stock solutions (mg/mL) prepared in methanol to get subsequent dilutions for determination of antimicrobial activities of the extracts.
Name of the extract Stock conc entration (mg/mL)
Sage 120
Anise 240
Rosehip 240
Camomile 120
Grape 240
Orange 240
Peach 240
Pomegranate 240
21
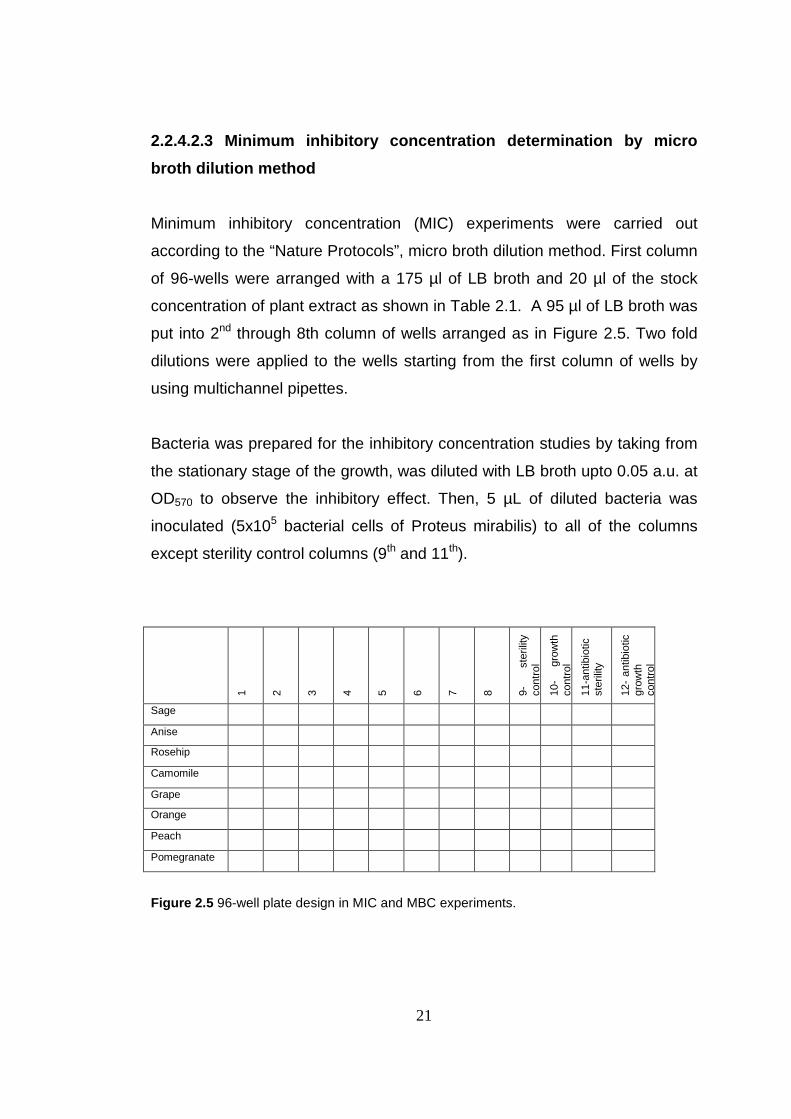
2.2.4.2.3 Minimum inhibitory concentration determin ation by micro
broth dilution method
Minimum inhibitory concentration (MIC) experiments were carried out
according to the “Nature Protocols”, micro broth dilution method. First column
of 96-wells were arranged with a 175 µl of LB broth and 20 µl of the stock
concentration of plant extract as shown in Table 2.1. A 95 µl of LB broth was
put into 2nd through 8th column of wells arranged as in Figure 2.5. Two fold
dilutions were applied to the wells starting from the first column of wells by
using multichannel pipettes.
Bacteria was prepared for the inhibitory concentration studies by taking from
the stationary stage of the growth, was diluted with LB broth upto 0.05 a.u. at
OD570 to observe the inhibitory effect. Then, 5 µL of diluted bacteria was
inoculated (5x10⁵ bacterial cells of Proteus mirabilis) to all of the columns
except sterility control columns (9th and 11th).
1 2 3 4 5 6 7 8 9-
ster
ility
cont
rol
10-
grow
th
cont
rol
11-a
ntib
iotic
st
erili
ty
12-
antib
iotic
gr
owth
co
ntro
l
Sage
Anise
Rosehip
Camomile
Grape
Orange
Peach
Pomegranate
Figure 2.5 96-well plate design in MIC and MBC experiments.
22
Sterility control including only 100 µL of LB broth was placed in 9th well of 96-
well plate to control the sterility of broth medium. In order to control the
bacterial growth, 10th well was labeled as growth control, included 95 µL of
LB broth and 5 µL of bacterial inoculation. Antibiotic sterility control contained
5 µL of antibiotic solution (gentamicin) and 95 µL of broth in the 11th well, in
order to observe if there is a bacterial contamination from environmental
effects . The last one was antibiotic growth control and 90 µL of of LB broth,
5 µL of gentamicin antibiotic and 5 µL of bacterial inoculum were added, in
order to check the sensitivity of the bacteria to the selected antibiotic.
Gentamicin was the choice of antibiotic which has been widely used in
urinary tract infections. A 10 mg/mL stock solution of antibiotic was prepared
with ultra pure, sterilized water.
After completion of the MIC set 96-well plates were incubated at 37 C̊ for 16
hours and absorbancewas monitored at ELISA plate reader at 570 nm.
23
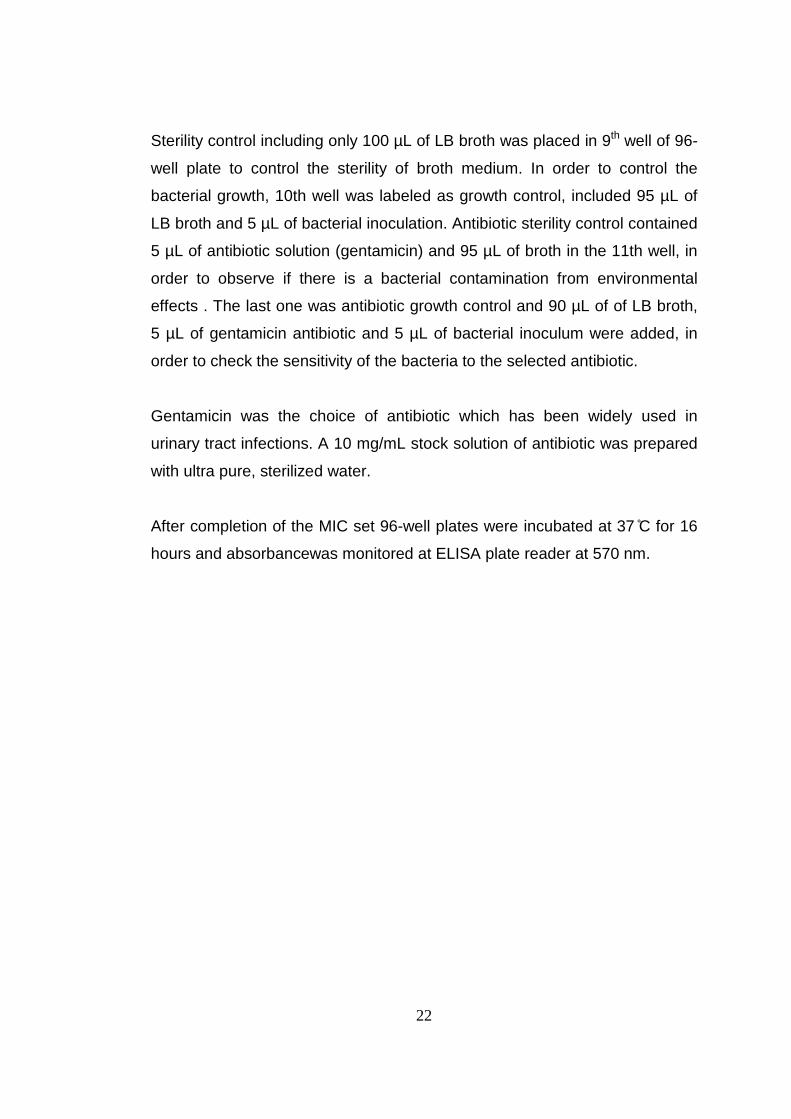
2.2.4.2.4 Minimum bactericidal concentration determination by micro
agar dilution method
Micro agar dilution method was applied to determine minimum bactericidal
concentration (MBC). After conducting micro broth dilution (MIC) experiments
in a 96-well plate as described in the section 2.2.5.2.2; a 10 µL of solution,
from the previous MIC 96-well plate, was transferred by using a 12 multi-
channel pippette (5-50 µL) to a new 96-well plate containing 100 µL of LB
agar as displayed in Figure 2.6. Minimum bactericidal concentration was
determined as the lowest concentration of extract where no visible bacteria
was observed on the agar surface. ELISA plate reader was used to obtain
the exact absorbance in each set of micro broth dilution wells where there is
no visible bacteria. All experiments were performed in triplicates.
Figure 2.6 Transferring of 10 µl of medium from MIC wells to MBC wells.

24
2.2.5 Antioxidant activity tests
2.2.5.1 ABTS method
2,2’-azinobis-(3-ethylbenzothiazoline-6-sulfonic acid) (ABTS) method was
performed according to Re et. al (1999).
ABTS (displayed in Figure 2.7) was dissolved in ethanol to prepare a 20 mL
stock solution of 7 mM. ABTS radical cation (ABTS•+) was produced by
reacting ABTS solution with potassium persulfate at 2.45 mM final
concentration in the stock solution. The mixture then allowed to stand in the
dark at room temperature for 12–16 h before using.
Figure 2.7 2,2’-azinobis-(3-ethylbenzothiazoline-6-sulfonic acid)
A working solution of ABTS•+ was prepared by diluting stock solution with 120
mL of methanol to an approximate absorbance unit of 0.70 (±0.02) at 734
nm. Different calculated volumes of 1.0 mg/mL tea infusion and fruit juice
extract solutions were added to 2 mL of ABTS solution and mixed (Final
concentrations were calculated). Absorbance was monitored at Cary Bio
single beam spectrophotometer at 734 nm, after the initial mixing time
recorded in every minute from 1st to 6th. In ABTS method 6th minute results
were required since the reaction was stabilized at 6th minute and there was
no change in the percent inhibition after 6th minute.
NN
S
N
SO
O OH
S
N
SO
O
HO

25
Figure 2.8 Reaction between ABTS•+ radical and antioxidant (Apak, 2007).
Trolox was used as a standard in 5, 10, 15, 20 µM concentrations to
calculate the trolox equivalent antioxidant capacity (TEAC) values. TEAC
values were calculated by dividing the slope of extract concentration vs
percent inhibition graph to that of trolox standard curve. The results were
divided by dilution factor (120) due to the dilution of stock solution. Trolox
standard curve was plotted to use it as reference.
All determinations were carried out three times, and in duplicate. The percent
inhibition was calculated at 734 nm absorbance and plotted as a function of
the concentration of extracts. Percent inhibition was calculated as;
Inhibition % = [(A0-A1)/A0] x 100
where A0 is the absorbance of the ABTS solution and methanol, A1 is the
absorbance of the ABTS in the presence of extracts at various
concentrations.
26
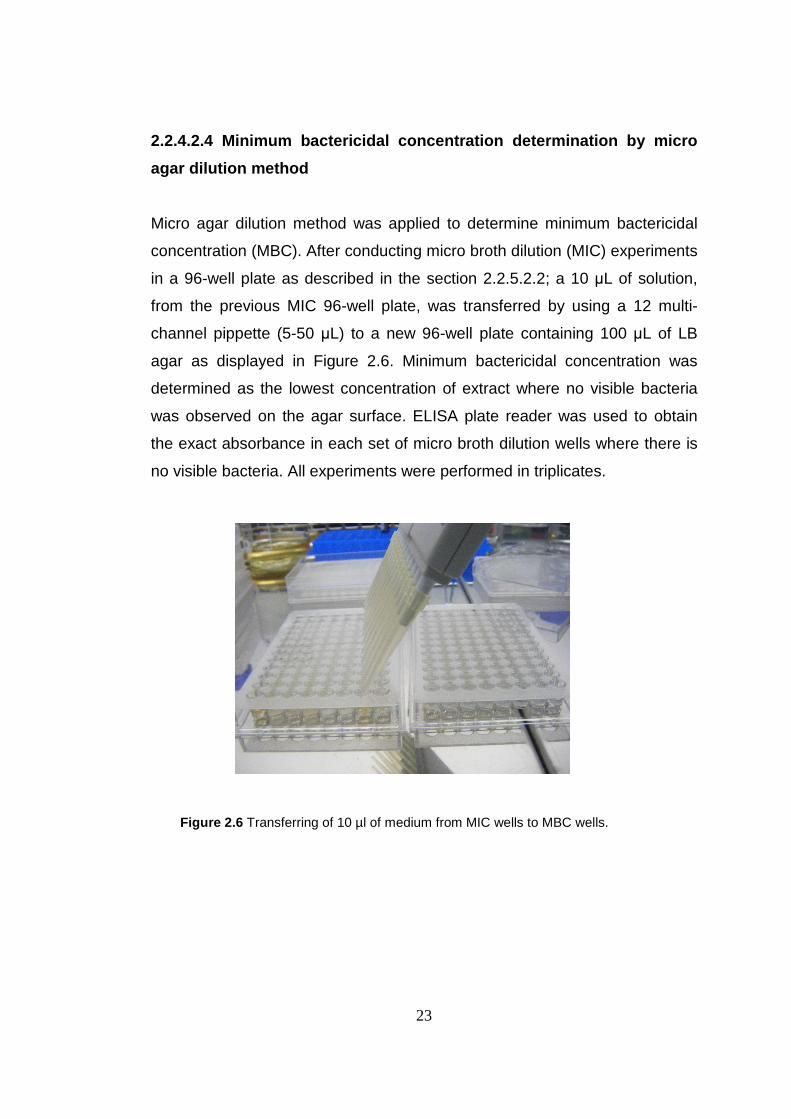
2.2.5.2 DPPH method
2,2-diphenyl-1-picrylhydrazyl (DPPH, Figure 2.9) and ethanol solution was
prepared in the concentration of 0.05 mg/mL. It gives nearly 1.4 unit of
absorbance at 517 nm. Various concentrations of the extracts were prepared
with methanol, and 100 µL of the extract concentrations were added to 1.4
mL of DPPH solution. Then the absorbance was recorded at 517 nm after 20
minute of incubation, as displayed in Figure 2.10.
Figure 2.9 2,2-diphenyl-1-picrylhydrazyl (DPPH)
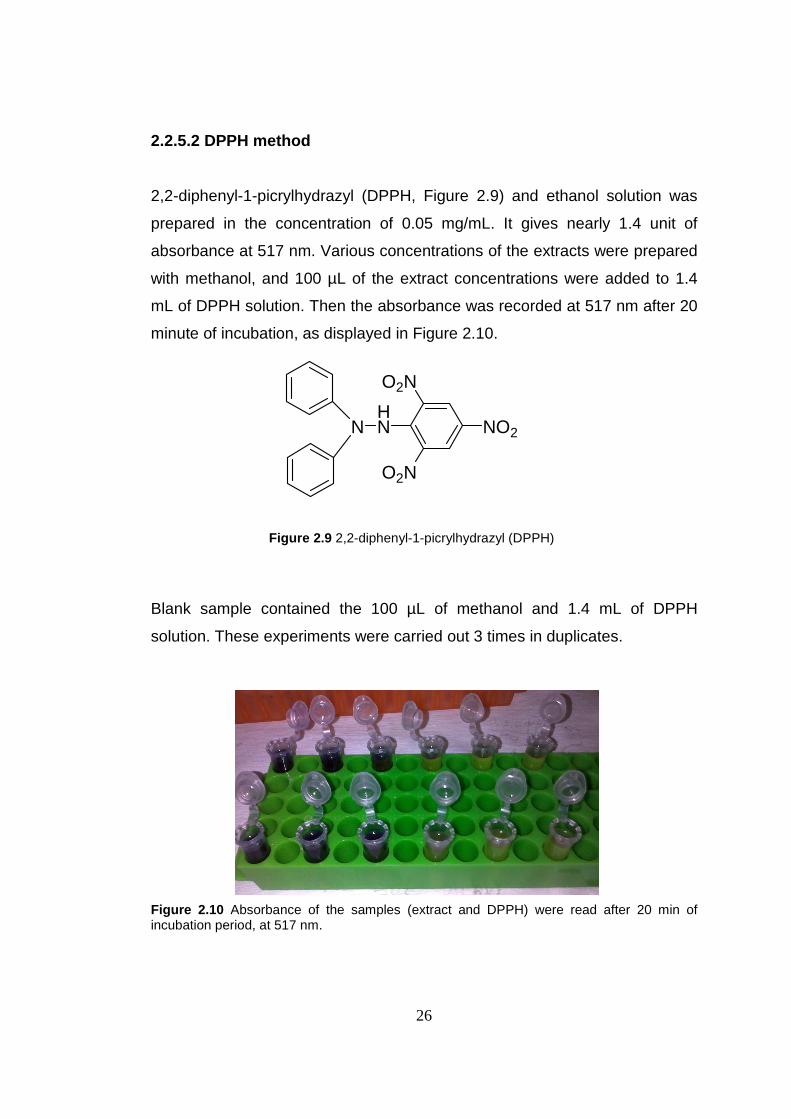
Blank sample contained the 100 µL of methanol and 1.4 mL of DPPH
solution. These experiments were carried out 3 times in duplicates.
Figure 2.10 Absorbance of the samples (extract and DPPH) were read after 20 min of incubation period, at 517 nm.
NHN
O2N
O2N
NO2

27
Radical scavenging activities of the extracts were calculated according to the
formula,
RSA (Radical Scavenging Activity) % = [(A0-A1)/A0]*100%
where A0 is the absorbance of the blank sample (DPPH solution with 100 µL
of methanol) and A1 is the absorbance of the DPPH solution with the extract
concentrations that are dissolved in methanol.
Figure 2.11 Scavenging of DPPH (2,2-Diphenyl-1-picrylhydrazyl) free radical by a flavonoid (Dragan, 2003).
According to the results, RSA% vs final concentrations of the extracts
(mg/ml) was plotted and EC50 (50 % effective concentration) values were
calculated. Statistical analysis were done according to Minitab Release 14
software.
2.2.5.3 Total phenolic content
Total phenolic content determination was done according to the Singleton
and Rossi (1963). 100 µl of each extract solution prepared in methanol at
various concentrations were mixed with 100 µl of 50 % Folin–Ciocalteu’s
phenol reagent and they were vortexed vigorously. Then, 2 mL of aqueous
solution of 2 % Na2CO3 was added into the test tubes in equal time intervals
to stop the reaction and vortexed again.
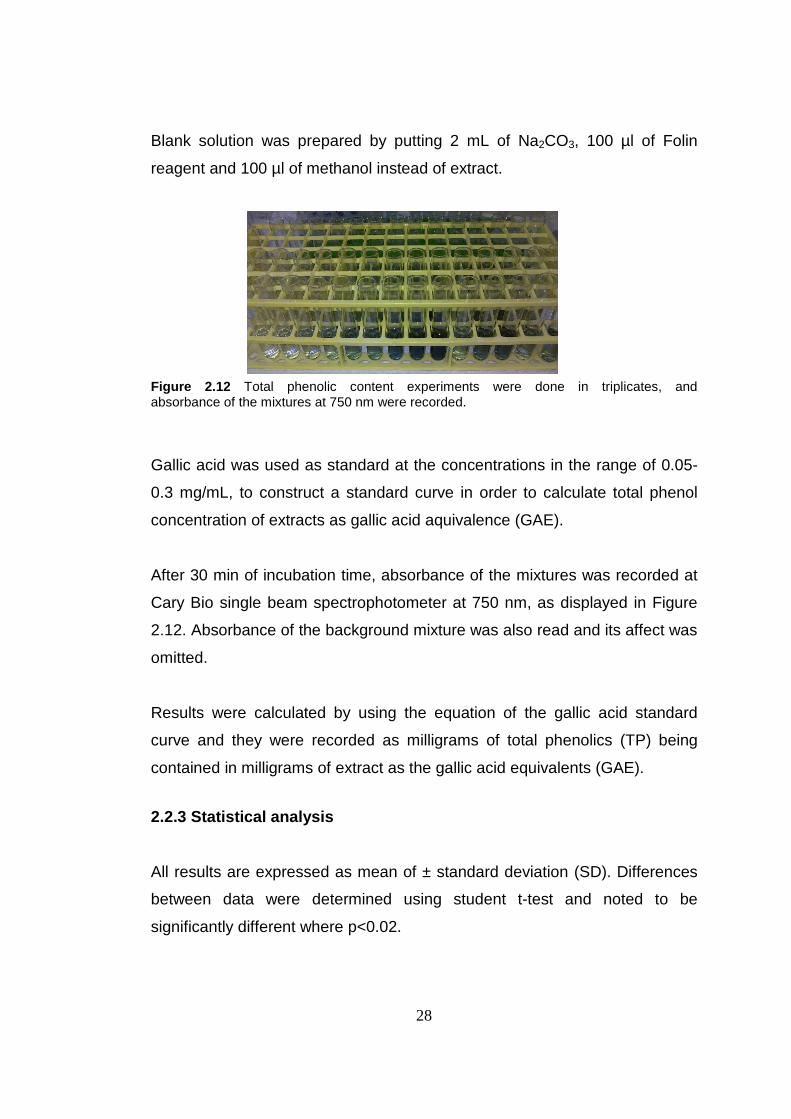
28
Blank solution was prepared by putting 2 mL of Na2CO3, 100 µl of Folin
reagent and 100 µl of methanol instead of extract.
Figure 2.12 Total phenolic content experiments were done in triplicates, and absorbance of the mixtures at 750 nm were recorded.
Gallic acid was used as standard at the concentrations in the range of 0.05-
0.3 mg/mL, to construct a standard curve in order to calculate total phenol
concentration of extracts as gallic acid aquivalence (GAE).
After 30 min of incubation time, absorbance of the mixtures was recorded at
Cary Bio single beam spectrophotometer at 750 nm, as displayed in Figure
2.12. Absorbance of the background mixture was also read and its affect was
omitted.
Results were calculated by using the equation of the gallic acid standard
curve and they were recorded as milligrams of total phenolics (TP) being
contained in milligrams of extract as the gallic acid equivalents (GAE).
2.2.3 Statistical analysis
All results are expressed as mean of ± standard deviation (SD). Differences
between data were determined using student t-test and noted to be
significantly different where p<0.02.
29
CHAPTER 3
RESULTS AND DISCUSSION
3.1 Antimicrobial activity of extracts on Proteus mirabilis Antimicrobial activity of the daily consumed teas and fruit juices are
investigated against Proteus mirabilis which was not reported before.
Optimizations were designed as determination of growth curve of the bacteria
at 37 oC and the solvent effect on the growth.
3.1.1 Bacterial growth curve
The estimation of the number of colonies of bacteria is very important in the
antimicrobial studies. Colony forming unit (CFU/mL) of bacteria should be
known to standardize the number of colonies that are used in the
antimicrobial experiments. CFU is a measure of viable bacterial colony
numbers and it is related to the optical density of the bacteria.
30
0
1
2
3
4
5
6
7
0 5 10 15 20 25 30
time (hours)
OD
570
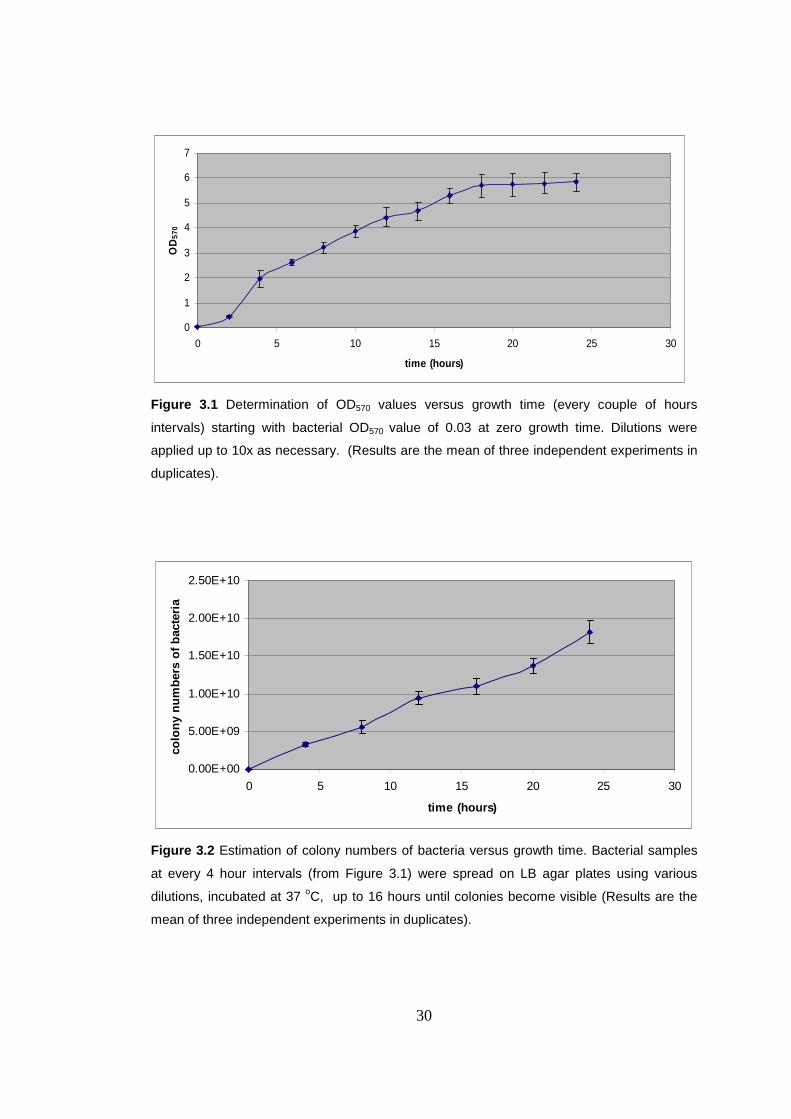
Figure 3.1 Determination of OD570 values versus growth time (every couple of hours
intervals) starting with bacterial OD570 value of 0.03 at zero growth time. Dilutions were
applied up to 10x as necessary. (Results are the mean of three independent experiments in
duplicates).
0.00E+00
5.00E+09
1.00E+10
1.50E+10
2.00E+10
2.50E+10
0 5 10 15 20 25 30
time (hours)
colo
ny n
umbe
rs o
f bac
teria
Figure 3.2 Estimation of colony numbers of bacteria versus growth time. Bacterial samples
at every 4 hour intervals (from Figure 3.1) were spread on LB agar plates using various
dilutions, incubated at 37 oC, up to 16 hours until colonies become visible (Results are the
mean of three independent experiments in duplicates).

31
0
2
4
6
8
10
12
0 5 10 15 20 25 30
time (hours)
LOG
of n
umbe
rs o
f bac
teria
Figure 3.3 Logarithmic base of colony forming bacteria count versus growth time intervals
(an initial bacterial OD570 value of 0.03) (Results are the mean of three independent
experiments in duplicates).
y = 2E+09x
R2 = 0,9956
0.0E+00
2.0E+09
4.0E+09
6.0E+09
8.0E+09
1.0E+10
1.2E+10
1.4E+10
1.6E+10
1.8E+10
0 1 2 3 4 5 6 7
OD570
Col
ony
num
bers
of b
acte
ria
Figure 3.4 Estimation of colony forming unit per mL. Colony numbers of bacteria versus
absorbance unit at 570 nm were rearranged using Figures 3.1 and 3.2. Resultant trendline
equation was used to approximate the colony forming unit per mL count for a given OD570
value (e.g: 1 OD570 = 2x10⁹ CFU/mL). Data was collected as mean of three independent
experiment in duplicates.
32
As displayed in Figure 3.4 the trendline equation is used to standardize the
colony numbers as Colony Forming Units (CFU) at given absorbance unit (at
570nm). As a result, trendline (y=2*109x; where x is the absorbance unit at
570 nm, and y is the CFU) is interpreted as for 1mL of inoculum of bacteria
having 1.0 units of OD570 would be resultant of 2x10⁹ CFU/mL for Proteus
mirabilis. It is important to standardize the antimicrobial experiments using
the same number of bacteria.
3.1.2 Preparation of extract solutions
Since we knew the effect of solvents on Proteus mirabilis, we chose
methanol as solvent to prepare our extract solutions at varying
concentrations. Our stock solutions were as seen in the Table 2.1.
Percent yield results of tea infusion extracts and fruit juices were found as in
Table 3.1 and Table 3.2.
Table 3.1 Extraction data of tea infusion extracts.
Tea infusions Sage Anise Rosehip Camomile
Total weight (g) 40 40 40 40
Infusion volume (mL) 480 480 480 480
Total extract (g) 6.20 8.00 22.20 23.70 Yield (%) 15.50 20.00 55.50 59.25
Table 3.2 Extraction data of fruit juices.
Fruit Juices Grape Orange Peach Pomegranate
Total weight (g) 474.9 1241.8 655.00 1665.5
Juice (mL) 371.00 524.00 452.00 407.00
Total extract (g) 42.40 51.60 52.00 59.20
Yield (%) 11.43 9.85 11.50 14.55
33
3.1.3 Minimum inhibitory concentration
Minimum inhibitory concentrations were determined by using 96-well plates,
as described in the methods part 2.3.2. All of the experiments were done in
triplicates. Concentration of Proteus mirabilis was 0.05 OD570 (approximately
5*105 bacteria) added in 5 µL to each 96-wells throughout these experiments.
3.1.3.1 Solvent effects
Inhibitory effects of various solvents must be determined to find the most
suitable solvent with minimum inhibition. Ethanol, methanol, dimethyl
sulfoxide, ethyl acetate, acetonitrile, cyclohexane, acetone and ultra pure
water were tested. Solvent concentrations were defined as solvent volume
per total volume of medium solutions (Luria broth) in 96-wells. Solvent effect
studies were prepared in the concentration range of 0.02-10 %.
In order to find out the solvent with minimum inhibitory effect against Proteus
mirabilis, 20 µL of each respective solvent, 175 µL of Luria Broth, and 5 µL of
bacteria with 0.05 OD570 were added to the wells, as shown in Table 2.2.
The results of solvent effect experiment was given in Table 3.3. It was found
that ethanol, methanol, dimethylsulfoxide and acetonitrile have only displayed
the growth inhibitory effect (MIC) for concentrations of 10 % against Proteus
mirabilis. All other solvents have displayed no growth inhibitory effect when
used up to 10 %. Methanol was the best solvent choice, with minimum
inhibitory effect and for the extract dissolution purposes in order to prepare
as high extract concentrations as possible. Throughout the experiments
methanol was used as a solvent in 5 % concentrations in the wells.

34
Table 3.3 Determination of minimum inhibitory concentrations for various solvents. 10 µL of each respective solvent, 85 µL of Luria Broth, and 5 µL of P.mirabilis with 0.05 absorbance unit was added to each well and total volume was adjusted to 100 ul. All of the wells were prepared with respected solvents with same broth.
9.75% 4.88% 2.44% 1.22% 0.61% 0.31% 0.16% 0.08% 0.04% 0.02%
sterility control
(broth only)
growth control
(broth and bacteria)
1 2 3 4 5 6 7 8 9 10 11 12
EtOH A x √ √ √ √ √ √ √ √ √ x √
MeOH B x √ √ √ √ √ √ √ √ √ x √ DMSO
C x √ √ √ √ √ √ √ √ √ x √
EtOAc D √ √ √ √ √ √ √ √ √ √ x √
Acetonitrile E x √ √ √ √ √ √ √ √ √ x √
Cyclohexane F √ √ √ √ √ √ √ √ √ √ x √
Acetone G √ √ √ √ √ √ √ √ √ √ x √
ddH2O H √ √ √ √ √ √ √ √ √ √ x √
34
35
3.1.3.2 Minimum inhibitory concentration of extract s
Herbal teas and fruit juices often consumed in our daily diet were
investigated for their growth inhibitory effect against Proteus mirabilis which
is a dangerous pathogen for urinary tract infections.
3.1.3.2.1 Minimum inhibitory concentration of tea i nfusions
Antimicrobial activities of tea infusions (sage, anise, rosehip and camomile)
were studied against Proteus mirabilis. Micro broth dilution method was used
as described in section 2.3.4 to determine minimum inhibitory concentrations.
Final extract concentrations in the wells were in the range of 0.047-12.0
mg/mL. According to the growth curve of Proteus mirabilis in Figure 3.4, we
added bacterial inoculation with 0.05 OD570 which means there were 5x10⁵
bacterial cells in each well.

36
0.000
0.200
0.400
0.600
0.800
1.000
Sterility
contr
ol
Growth
contro
l
Antibiot
ic ste
rility
contro
l
Antib iotic
contro
l0.047
0.09375
0.188
0.3750.75
01.5
003.000
6.000
12.000
Extract concentration (mg/mL)
OD
(57
0 nm
)Sage
Anise
Rosehip
Camomile
Growth control
Figure 3.5 Determination of minimum inhibitory concentrations of tea infusion extracts with 16 hours incubation against Proteus mirabilis, at 570 nm.
Sterility control: Test the experiments if they were performed in aseptique conditions in the presence of broth only. Growth control: Test of bacterial growth in the presence of only broth and bacteria. Antibiotic sterility control: Sterility of the Gentamicin in the absence of bacteria. Antibiotic control: 5 µL of Gentamicin was used as antibiotic in the concentration of 10 mg/mL in the presence of P. mirabilis of 109 CFU/mL. Each data was obtained by taken the mean of three independent experiments in triplicates.
After 16 hours incubation, OD values of the wells were monitored at 570 nm.
Minimum inhibitory concentration ideally must be obtained with zero
absorbance as a result of no bacterial growth.
Tea infusion extract of sage displayed some bacterial growth for the extract
concentrations from 0.047 to 1.5 mg/mL, however at and above 3.0 mg/mL
concentration, inhibition against bacterial growth was observed where optical
density was read as zero absorbance unit at 570 nm. So, 3.0 mg/mL of tea
infusion extract of sage is considered as the minimum inhibitory
concentration against Proteus mirabilis. Tea infusion extract of rosehip also
presented its growth inhibitory effect at the same concentration with tea
infusion extract of sage.
37
MIC values for the infusion extracts of anise and camomile were observed as
6 mg/mL which are less effective than the extracts of sage and rosehip.
Hammer et al. studied antimicrobial activities of 52 plant oils and extracts
against Acinetobacter baumanii, Aeromonas veronii biogroup sobria,
Candida albicans, Enterococcus faecalis, Escherichia coli, Klebsiella
pneumoniae, Pseudomonas aeruginosa, Salmonella enterica subsp. enterica
serotype typhimurium, Serratia marcescens and Staphylococcus aureus,
using an agar dilution method. They have reported that rosewood, coriander,
palmarosa, tea tree, niaouli, peppermint, spearmint, sage and marjoram
inhibited all organisms except Ps. aeruginosa at ≤2·0% (v/v) (Hammer,
1999).
Tepe et al. reported the antimicrobial capacities of the essential oils from P.
Anisetum against Streptococcus pneumoniae by microbroth dilution method.
They have given the MIC result of P. Anisetum as 18 mg/mL (Tepe, 2006).
3.1.3.2.2 Minimum inhibitory concentration of fruit juices
Antimicrobial activities of highly consumed selection of fruit juice extracts
(grape, orange, peach, pomegranate) were studied against Proteus mirabilis.
Micro broth dilution method was used as described in section 2.3.4 to
determine minimum inhibitory concentrations. Final extract concentrations
used in the 96-well preparations were in the range of 0.094 to 12.0 mg/mL. In
each well Proteus mirabilis was added as 5 µL with 0.05 OD570 (5x10⁵
CFU/mL).
38
0.000
0.200
0.400
0.600
0.800
1.000
Sterilit
y con
trol
Growth
contro
l
Antibio
tic st
erilit
y con
trol
Antibio
tic co
ntrol
0.094
0.187
50.3
750.7
501.500
3.000
6.000
12.00
0
Extract concentration (mg/mL)
OD
(570
nm
) Grape
Orange
Peach
Pomegranate
Growth control
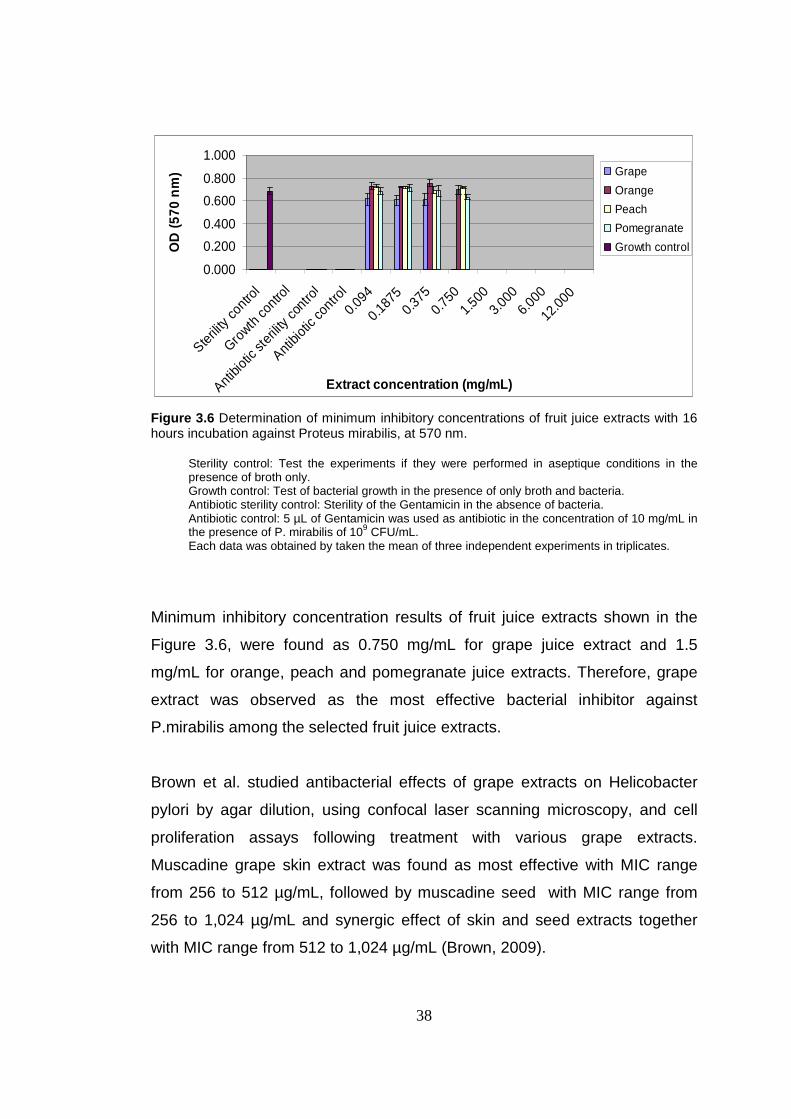
Figure 3.6 Determination of minimum inhibitory concentrations of fruit juice extracts with 16 hours incubation against Proteus mirabilis, at 570 nm.
Sterility control: Test the experiments if they were performed in aseptique conditions in the presence of broth only. Growth control: Test of bacterial growth in the presence of only broth and bacteria. Antibiotic sterility control: Sterility of the Gentamicin in the absence of bacteria. Antibiotic control: 5 µL of Gentamicin was used as antibiotic in the concentration of 10 mg/mL in the presence of P. mirabilis of 109 CFU/mL. Each data was obtained by taken the mean of three independent experiments in triplicates.
Minimum inhibitory concentration results of fruit juice extracts shown in the
Figure 3.6, were found as 0.750 mg/mL for grape juice extract and 1.5
mg/mL for orange, peach and pomegranate juice extracts. Therefore, grape
extract was observed as the most effective bacterial inhibitor against
P.mirabilis among the selected fruit juice extracts.
Brown et al. studied antibacterial effects of grape extracts on Helicobacter
pylori by agar dilution, using confocal laser scanning microscopy, and cell
proliferation assays following treatment with various grape extracts.
Muscadine grape skin extract was found as most effective with MIC range
from 256 to 512 µg/mL, followed by muscadine seed with MIC range from
256 to 1,024 µg/mL and synergic effect of skin and seed extracts together
with MIC range from 512 to 1,024 µg/mL (Brown, 2009).
39
Gould et al. reported that pomegranate rind extracts had MIC between 25.0–
12.5 mg/mL against clinical isolates of S. aureus, MRSA and PVL positive
CA-MSSA (Gould, 2009).
Another group from Turkey studied antimicrobial activity of six pomegranate
(Punica granatum L.) varieties in comparison to phytonutrition values. MIC
and agar diffusion methods weer applied against Bacillus megaterium DSM
32, Pseudomonas aeruginosa, Staphylococcus aureus, Corynebacterium
xerosis, Escherichia coli, Enterococcus faecalis, Micrococcus luteus, and
three fungi Kluvyeromyces marxianus, Rhodotorula rubra, Candida albicans.
They have found the pomegranate aril extracts had antimicrobial effect on all
microorganisms, giving inhibition zones ranging in size from 13 to 26 mm.
The MIC values for pomegranate extracts were found between 30 and >90
µg/mL (Duman, 2009). Results by Duman et al. have revealed an effective
antimicrobial potential for Punica granatum varieties.
Another pomegranate study was done by Panichayupakaranant et al. on
antibacterial, anti-inflammatory and anti-allergic activities of rind extract.
Bacteriostatic effect against Propionibacterium acnes was found with a MIC
of 15.6 µg/mL, and against Staphylococcus aureus and Staphylococcus
epidermidis, with MICs of 7.8–15.6 µg/mL (Panichayupakaranant, 2010).
40
3.1.4 Minimum bactericidal concentration of extract s
Bactericidal effect is always more important than the growth inhibition once
the bacterial infection has started. Therefore, bactericidal effects of daily
consumed herbal teas and fruit juices were important to examine against
Proteus mirabilis. Bactericidal dosage of the extracts were determined from
their minimum inhibitory concentration experiments. In the assay medium,
absence of visible bacterial growth shows the minimum inhibitory
concentration has been reached however it does not mean all the bacteria
has been killed. It may be due to the bacteriostatic effect of the antimicrobial
agent or due to the reduction of growth rate of the bacteria. Nevertheless,
MBC test is crucial, to make sure all the bacteria has been killed for the sake
of treatment.
3.1.4.1 Minimum bactericidal concentration of tea i nfusion extracts
Micro agar dilution method applied to the assay medium of MIC test by
transferring medium from MIC to MBC wells as described in section 2.3.5.
Sage, anise, rosehip and camomile were selected as herbal tea infusion
extractions.
To determine the minimum bactericidal concentration of the tea infusion
extracts, 10 µL of MIC medium was transferred to a new MBC 96-well plate
with a 100 µL of LB agar in each well were incubated together for 16 hours.
At the end of the 16 hours incubation 96-well plates were tested for their
absorption at 570 nm using ELISA plate reader.
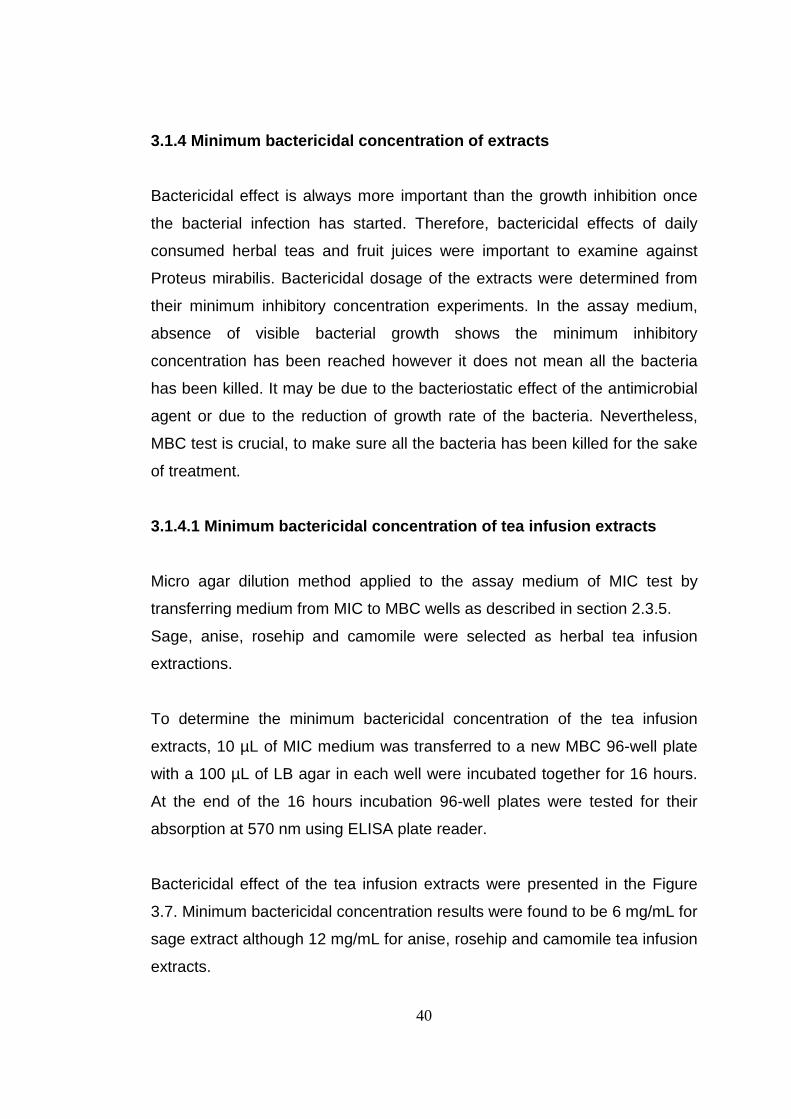
Bactericidal effect of the tea infusion extracts were presented in the Figure
3.7. Minimum bactericidal concentration results were found to be 6 mg/mL for
sage extract although 12 mg/mL for anise, rosehip and camomile tea infusion
extracts.
41
Figure 3.7 Minimum bactericidal concentrations (mg/mL) for tea infusion extracts against Proteus mirabilis at 570 nm. Each data was obtained by taken the mean of three independent experiments in triplicates. Antimicrobial effects of essential oils were reported on pathogens that
contaminate raw vegetables in organic Swiss chards. Highest antimicrobial
activities were obtained for the essential oils of Eucalyptus globules,
Melaleuca alternifolia, Pimpinella anisum and Syzygium aromaticum with
MBC values in the range of 0.093–1.5 mL/100 mL (Ponce, 2003).
Aqueous extracts of Cocos nucifera (husk fiber), Ziziphus joazeiro (inner
bark), Caesalpinia pyramidalis (leaves), and alcoholic extract of Aristolochia
cymbifera (rhizomes) were examined against oral bacteria Prevotella
intermedia, Porphyromonas gingivalis, Fusobacterium nucleatum,
Streptococcus mutans and Lactobacillus casei by Alviano et al. Highest
bactericidal effect was reported for A. cymbifera extract against all the
bacteria tested. C. nucifera, Z. joazeiro and C. pyramidalis extracts were also
found to be effective bactericidals (Alviano, 2008).
MBC (mg/mL)
Sage
Anise
Rosehip
Camomile
0
2
4
6
8
10
12
Sage
Anise
Rosehip
Camomile

42
3.1.4.2 Minimum bactericidal concentration of fruit juices
Fruit juices of grape, orange, peach and pomegranate were chosen for the
minimum bactericidal effects on Proteus mirabilis. Micro agar dilution method
was used as described in section 2.3.5. to determine minimum bactericidal
concentrations (MBC) of fruit juice extracts.
MBC results of selected fruit juice extracts as shown in the Figure 3.8, were
found to be 6 mg/mL for pomegranate and 12 mg/mL for grape, orange and
peach extracts.
Figure 3.8 Minimum bactericidal concentrations (mg/mL) for fruit juice extracts against Proteus mirabilis at 570 nm. Each data was obtained by taken the mean of three independent experiments in triplicates.
Antimicrobial effects of the grape seed extracts (GSE) were throughly studied
by Furiga et al. Besides antimicrobial, antioxidant activities were also studied
for the grape seeds having rich polyphenolic compounds. Two oral
anaerobes associated with periodontal diseases, P. gingivalis and F.
Nucleatum, were studied against by grape seed extracts. As a result,
minimum bactericidal concentrations of GSE against the two bacteria were
the same, with a value of 8000 µg/mL suggesting GSE may be used in oral
hygiene to prevent periodontitis (Furiga, 2009).
MBC (mg/mL)
Grape
Orange
Peach
Pomegranate
0
2
4
6
8
10
12
Grape
Orange
Peach
Pomegranate

43
The antioxidant and antimicrobial activities of some grape cultivars, such as
Colorino, Sangiovese and Cabernet Sauvignon, against H.pylori clinical
isolates were studied by Santucci et al. As a result of this research, Colorino
extract was found as the most powerful antibacterial with its 1.35 mg/mL
minimum bactericidal concentration (Santucci, 2009).
Panichayupakaranant et al. have also reported for pomegranate rind extract
were effective bactericidals against Propionibacterium acnes with a MBC of
>1000 µg/mL, Staphylococcus aureus with MBCs of 500-1000 µg/mL and
Staphylococcus epidermidis with MBC of 250 µg/mL (Panichayupakaranant,
2010).
3.1.5 Antimicrobial activity of extracts by disc di ffusion test
Kirby-Bauer method was used as described in the section 2.2.4.1 to
determine antimicrobial activity of the extracts.
3.1.5.1 Antimicrobial activity of tea infusions by disc diffusion test
100 µL of bacteria grown upto 1.0 absorbance unit (approximately 2x10⁸
bacteria) at 570 nm, were spread onto LB agar plates with placement of
empty fitler discs. Then 20 µL of 120 mg/mL concentrations of the tea
infusion extracts were applied on empty filter discs. Plates then were
incubated at 37 oC for 16 hours. After the incubation period, inhibition
diameter zones were measured in millimeters.
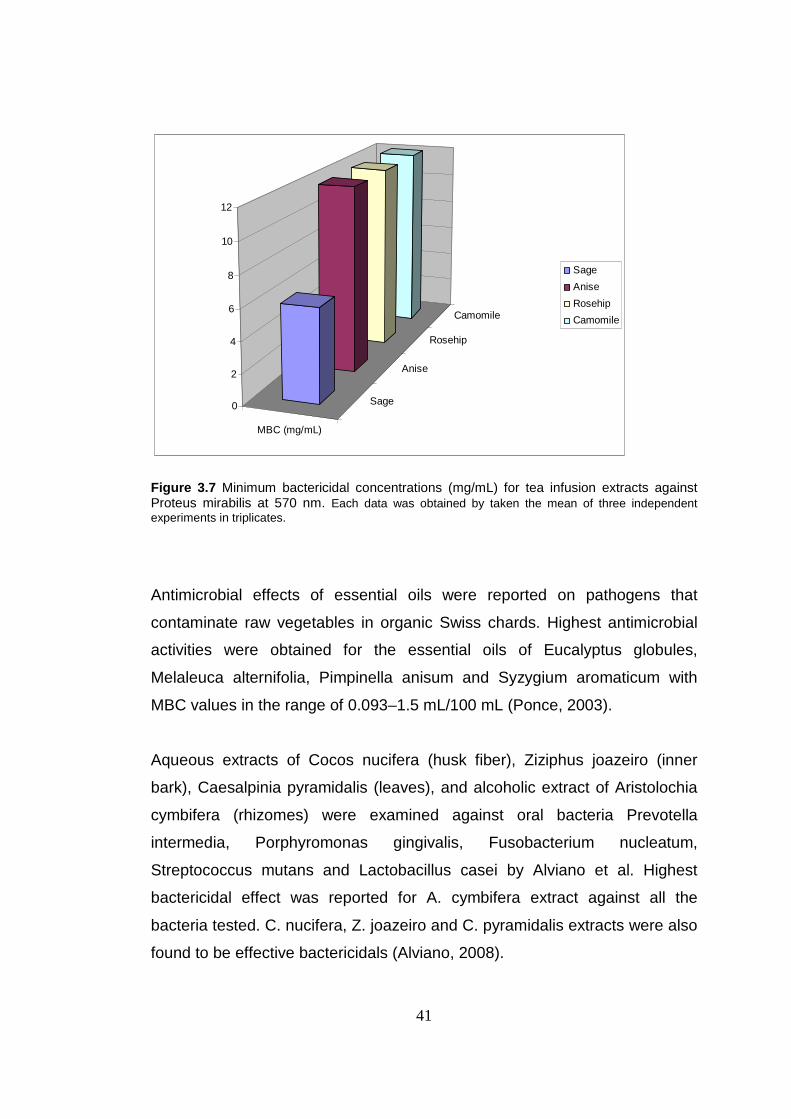
Inhibition zones for sage, anise, rosehip, and camomile extracts were 7 mm,
7 mm, 8 mm and 8 mm, respectively as displayed in Figure 3.9.
Highest antimicrobial activity was observed with the rosehip and camomile
tea infusion extracts with 8 mm inhibition zones.
44
Standard antibiotic discs of Gentamicin and Kanamycin had inhibition zone
diameters of 16 mm and 17 mm, respectively.
02468
101214161820
Sage
Anise
Roseh
ip
Camom
ile
Kanam
ycin
Gen
tam
icin
ddH2O
Tea infusion extracts
Zon
e di
amet
er in
mm
Figure 3.9 Antimicrobial activities of tea infusion extracts by disk diffusion method. Diameter of inhibition zone (mm) includes disc diameter of 6 mm. Each data was collected by means of three indepent experiments in duplicates.
3.1.5.2 Antimicrobial activity of fruit juices by d isc diffusion test
Antimicrobial activity by disc diffusion test were determined by pouring at
least 3 mm thickness of LB agar on 9 mm petri plates and placing enough
number of empty filter discs according to Kirby-Bauer method as described in
the section 2.3.3. Disc diffusion test was determined by the application of the
fruit juice extracts using 20 µL of 120 mg/mL concentrations on empty filter
discs. Prepared petri plates with discs were incubated at 37 oC for 16 hours.
After incubation period, inhibition diameter zones were measured in
millimeters.
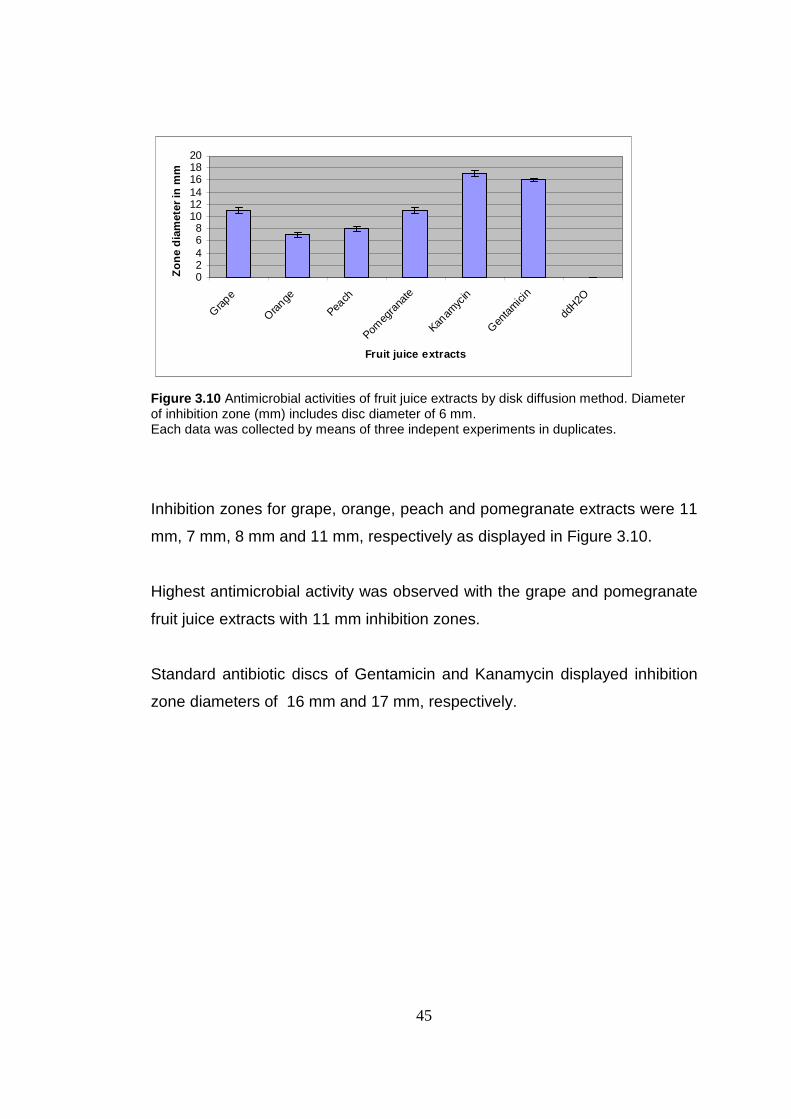
45
02468
101214161820
Grap
e
Oran
ge
Peach
Pomeg
rana
te
Kanam
ycin
Gen
tamici
n
ddH2O
Fruit juice extracts
Zon
e di
amet
er in
mm
Figure 3.10 Antimicrobial activities of fruit juice extracts by disk diffusion method. Diameter of inhibition zone (mm) includes disc diameter of 6 mm. Each data was collected by means of three indepent experiments in duplicates.
Inhibition zones for grape, orange, peach and pomegranate extracts were 11
mm, 7 mm, 8 mm and 11 mm, respectively as displayed in Figure 3.10.
Highest antimicrobial activity was observed with the grape and pomegranate
fruit juice extracts with 11 mm inhibition zones.
Standard antibiotic discs of Gentamicin and Kanamycin displayed inhibition
zone diameters of 16 mm and 17 mm, respectively.

46
3.2 Determination of antioxidant activities
3.2.1 ABTS method
Radical scavenging activities of the extracts were studied by using 2,2’-
azinobis-(3-ethylbenzothiazoline-6-sulfonic acid) (ABTS) method which was
done according to Re et al., as described in section 2.4.1. Results were
calculated according to the trolox equivalence antioxidant capacity (TEAC), a
known antioxidant standard trolox standard curve was plotted as shown in
Figure 3.11.
y = 4.9609x + 2.0893
R2 = 0.9971
0
20
40
60
80
100
120
0 5 10 15 20 25
Trolox concentration (uM)
Inhi
bitio
n %
Figure 3.11 Trolox standard curve to calculate trolox equivalent antioxidant capacities of the extracts (at 734 nm). Each data were calculated by means of three independent experiments in duplicates (n=6).
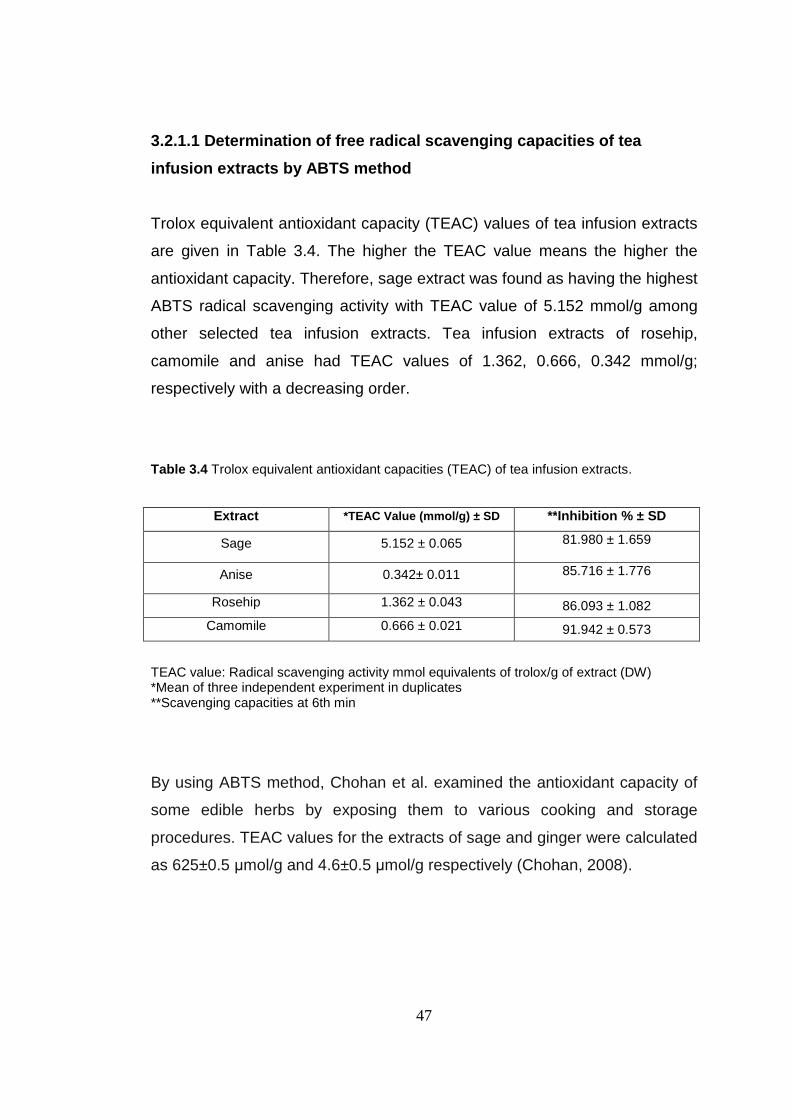
47
3.2.1.1 Determination of free radical scavenging ca pacities of tea
infusion extracts by ABTS method
Trolox equivalent antioxidant capacity (TEAC) values of tea infusion extracts
are given in Table 3.4. The higher the TEAC value means the higher the
antioxidant capacity. Therefore, sage extract was found as having the highest
ABTS radical scavenging activity with TEAC value of 5.152 mmol/g among
other selected tea infusion extracts. Tea infusion extracts of rosehip,
camomile and anise had TEAC values of 1.362, 0.666, 0.342 mmol/g;
respectively with a decreasing order.
Table 3.4 Trolox equivalent antioxidant capacities (TEAC) of tea infusion extracts.
Extract *TEAC Value (mmol/g) ± SD **Inhibition % ± SD
Sage 5.152 ± 0.065 81.980 ± 1.659
Anise 0.342± 0.011 85.716 ± 1.776
Rosehip 1.362 ± 0.043 86.093 ± 1.082
Camomile 0.666 ± 0.021 91.942 ± 0.573
TEAC value: Radical scavenging activity mmol equivalents of trolox/g of extract (DW) *Mean of three independent experiment in duplicates **Scavenging capacities at 6th min
By using ABTS method, Chohan et al. examined the antioxidant capacity of
some edible herbs by exposing them to various cooking and storage
procedures. TEAC values for the extracts of sage and ginger were calculated
as 625±0.5 µmol/g and 4.6±0.5 µmol/g respectively (Chohan, 2008).
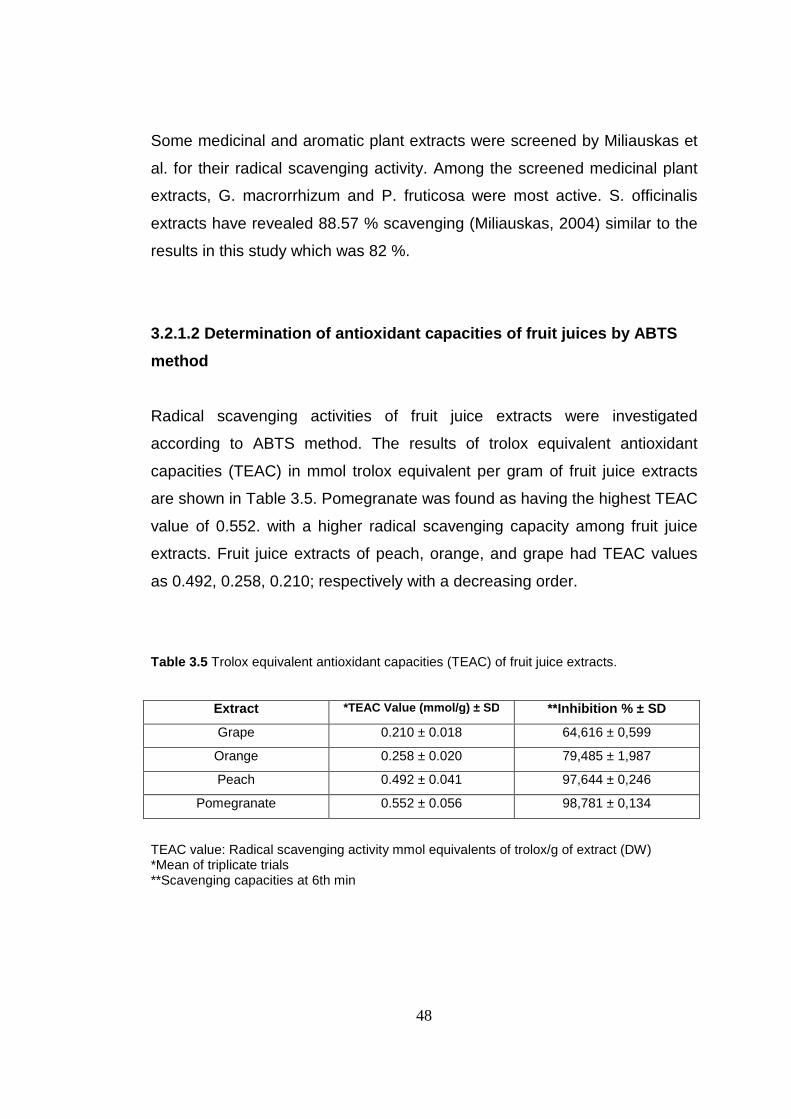
48
Some medicinal and aromatic plant extracts were screened by Miliauskas et
al. for their radical scavenging activity. Among the screened medicinal plant
extracts, G. macrorrhizum and P. fruticosa were most active. S. officinalis
extracts have revealed 88.57 % scavenging (Miliauskas, 2004) similar to the
results in this study which was 82 %.
3.2.1.2 Determination of antioxidant capacities of fruit juices by ABTS
method
Radical scavenging activities of fruit juice extracts were investigated
according to ABTS method. The results of trolox equivalent antioxidant
capacities (TEAC) in mmol trolox equivalent per gram of fruit juice extracts
are shown in Table 3.5. Pomegranate was found as having the highest TEAC
value of 0.552. with a higher radical scavenging capacity among fruit juice
extracts. Fruit juice extracts of peach, orange, and grape had TEAC values
as 0.492, 0.258, 0.210; respectively with a decreasing order.
Table 3.5 Trolox equivalent antioxidant capacities (TEAC) of fruit juice extracts.
Extract *TEAC Value (mmol/g ) ± SD **Inhibition % ± SD
Grape 0.210 ± 0.018 64,616 ± 0,599
Orange 0.258 ± 0.020 79,485 ± 1,987
Peach 0.492 ± 0.041 97,644 ± 0,246
Pomegranate 0.552 ± 0.056 98,781 ± 0,134
TEAC value: Radical scavenging activity mmol equivalents of trolox/g of extract (DW) *Mean of triplicate trials **Scavenging capacities at 6th min

49
Depending on the ABTS method, in 2009, Furiga et al. asserted that the
extracts of grape seeds in regard to their antioxidant characteristics were
more valuable than vitamin C and E comparison to Trolox, which was
commonly used as an antioxidant. This research indicated that TEAC value
of grape seeds extracts was 7.01 micromolar per microgram (Furiga, 2009).
According to a recent study through ABTS method, Breksa et al. ascertain
that 16 kinds of grapes have showed antioxidant activity from 7.7 to 60.9
µmol conjugated to Trolox (Breksa, 2010).
3.2.2 Determination of antioxidant capacities of ex tracts by DPPH
method
Antioxidant capacities of the tea infusion and fruit juice extracts were studied
by using DPPH radical scavenging method.
3.2.2.1 Determination of radical scavenging activit ies of tea infusion
extracts by DPPH method
2,2-diphenyl-1-picrylhydrazyl (DPPH) radical scavenging activities of tea
infusion extracts were investigated as described in section 2.4.2. Results are
given in Figure 3.12 and Table 3.6.
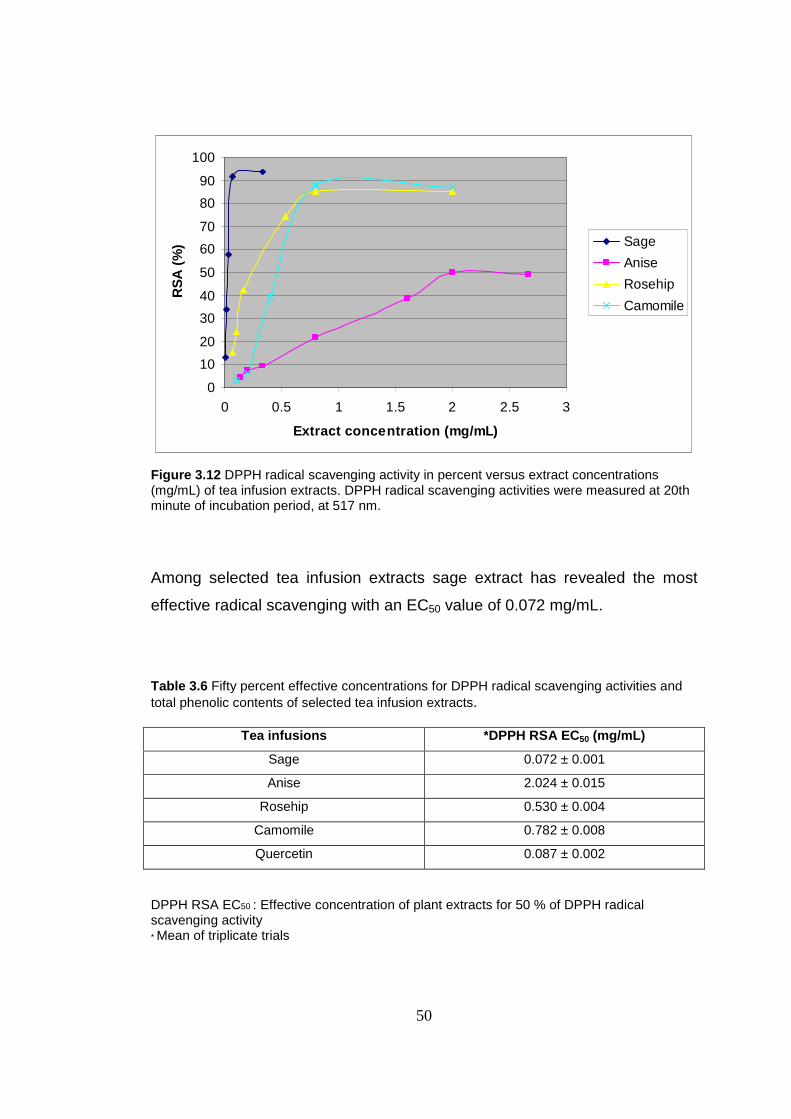
50
0
10
20
30
40
50
60
70
80
90
100
0 0.5 1 1.5 2 2.5 3
Extract concentration (mg/mL)
RS
A (
%) Sage
Anise
Rosehip
Camomile
Figure 3.12 DPPH radical scavenging activity in percent versus extract concentrations (mg/mL) of tea infusion extracts. DPPH radical scavenging activities were measured at 20th minute of incubation period, at 517 nm.
Among selected tea infusion extracts sage extract has revealed the most
effective radical scavenging with an EC50 value of 0.072 mg/mL.
Table 3.6 Fifty percent effective concentrations for DPPH radical scavenging activities and total phenolic contents of selected tea infusion extracts.
Tea infusions *DPPH RSA EC50 (mg/mL)
Sage 0.072 ± 0.001
Anise 2.024 ± 0.015
Rosehip 0.530 ± 0.004
Camomile 0.782 ± 0.008
Quercetin 0.087 ± 0.002
DPPH RSA EC50 : Effective concentration of plant extracts for 50 % of DPPH radical scavenging activity * Mean of triplicate trials

51
Using “total polyphenol and flavonoid contents, DPPH radical scavenging,
hydroxyl radical scavenging, nitrite scavenging activity and antimicrobial
activity”, Chung evaluated that off four various solvents, methanol star anise
extract has the highest radical scavenging activity with the rate as 89.02%
(Chung, 2009).
Taking rosa mosqueta roseship seeds as a sample, in 2006 Franco et al.
made a research upon the antioxidant activities of herbal oils and fusible
compounds exposed from the mentioned plant. Resulted from this study it is
claimed that approximately 80% of ethanol, 52.2% of methanol, and 41% of
water extracts revealed DPPH inhibition (Franco, 2006).
Free radical scavenging activities and protective effects on oxidative cardiac
cell injury of Salvia brachyantha have been studied by Esmaeili et al. and
DPPH (IC50) value of the extract was given as 46.72 ± 2.14 (µg/mL)
(Esmaeili, 2010).
3.2.2.2 Determination of radical scavenging activit ies of fruit juice
extracts by DPPH method
DPPH radical scavenging activities of fruit juice extracts were tested as
described in section 2.4.2. Results were given in Figure 3.13 and Table 3.7.

52
0
10
20
30
40
50
60
70
80
90
100
0 0.5 1 1.5 2 2.5 3
Extract concentration (mg/mL)
RS
A (
%) Grape
Orange
Peach
Pomegranate
Figure 3.13 DPPH radical scavenging activity in percent versus extract concentrations (mg/mL) of fruit juice extracts. DPPH radical scavenging activities were measured at 20th minute of incubation period, at 517 nm. Pomegranate and peach were found as most effective in radical scavenging
with EC50 values of 0,924 and 1.148 mg/mL, respectively. Pomegranate fruit
juice extract was much more effective in radical scavenging than peach.
Table 3.7 Fifty percent effective concentrations for DPPH radical scavenging activities and total phenolic contents of selected fruit juice extracts.
Fruit Juices *DPPH RSA EC 50 (mg/mL)
Grape NA
Orange NA
Peach 1.148 ± 0.034
Pomegranate 0.924 ± 0.014
Quercetin 0.087± 0.002
DPPH RSA EC50 : Effective concentration of plant extracts for 50 % of DPPH radical scavenging activity NA: not applicable Mean of triplicate trials

53
Phenolic compositions and antioxidant capacities of orange juice and orange
wine from Kozan, Turkey, studied by Kelebek et al. Orange juice has
revealed as higher radical scavenger than orange wine with EC50 values of
0.31 mg/mL and 0.46 mg/mL, respectively (Kelebek, 2009).
In a recent study, Lee et al. compared chemical compositions and radical
scavenging activities of peach extracts from six different cultivation areas. It
was concluded that DPPH (1,1-diphenyl-2-picrylhydrazyl) radical scavenging
activities of the peach extracts were as in order of Turkey > Uzbekistan> >
Spain > Iran >Taiwan (Lee, 2009).
Antioxidant capacities of pomegranate juices from eight cultivars were
examined with four methods by Çam et al. DPPH, ABTS, and b-carotene-
linoleate methods were applied to the extracts and efficient concentration
(EC50) of cultivar 8 Izmir was 29.8 ± 2.9 ml of pomegranate juice/g of DPPH
(Çam, 2009).
3.2.3 Determination of total phenolic content of ex tracts
Determination of total phenolic content was done as described in section
2.4.3. Gallic Acid (GA) standard curve was plotted as in the Figure 3.14.
Since the most problematic interference in total phenolic content procedure
may be sugar and can be found at very high levels in fruits, the interference
of sugar may be corrected by conducting the analysis of the standards with
the same level of sugar as the sample, but this is a complex issue because
different sugars yield different intereferences. In this study, the results of total
phenolic content of fruit juices were apparent phenol content with invert sugar
content.
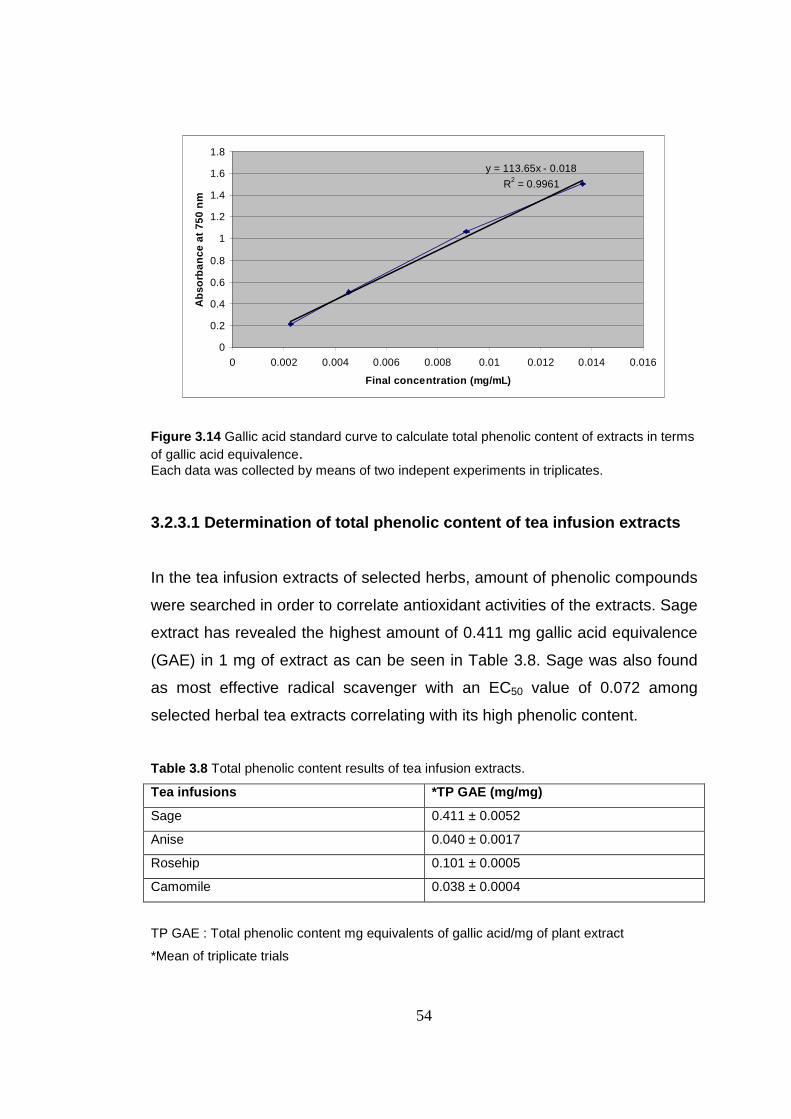
54
Figure 3.14 Gallic acid standard curve to calculate total phenolic content of extracts in terms of gallic acid equivalence. Each data was collected by means of two indepent experiments in triplicates.
3.2.3.1 Determination of total phenolic content of tea infusion extracts
In the tea infusion extracts of selected herbs, amount of phenolic compounds
were searched in order to correlate antioxidant activities of the extracts. Sage
extract has revealed the highest amount of 0.411 mg gallic acid equivalence
(GAE) in 1 mg of extract as can be seen in Table 3.8. Sage was also found
as most effective radical scavenger with an EC50 value of 0.072 among
selected herbal tea extracts correlating with its high phenolic content.
Table 3.8 Total phenolic content results of tea infusion extracts.
Tea infusions *TP GAE (mg/mg)
Sage 0.411 ± 0.0052
Anise 0.040 ± 0.0017
Rosehip 0.101 ± 0.0005
Camomile 0.038 ± 0.0004
TP GAE : Total phenolic content mg equivalents of gallic acid/mg of plant extract
*Mean of triplicate trials
y = 113.65x - 0.018
R2 = 0.9961
0
0.2
0.4
0.6
0.8
1
1.2
1.4
1.6
1.8
0 0.002 0.004 0.006 0.008 0.01 0.012 0.014 0.016
Final concentration (mg/mL)
Abs
orba
nce
at 7
50 n
m

55
In 2004, Miliauskasa et al. studied total phenolic compounds in sage (S.
officinalis) and total phenolic content of sage was found as 22.6 mg of GAE
per g of plant extract (Miliauskasa, 2004).
Yoo et al. reported total phenolic content of Rosa rubiginosa as 818.5 mg
GAE per 100 g of extract and total flavonoid content as 400.5 mg catechin
equivalents per 100 g (Yoo, 2008).
3.2.3.2 Determination of total phenolic content of fruit juices
Total phenolic contents of fruit juice extracts were investigated and peach
extract has displayed the highest phenolic content with a TP GAE value of
0.067 as gallic acid equivalent in mg per mg of extract as can be seen in
Table 3.9. Total phenolic content of grape, orange and pomegranate extracts
were 0.006, 0.024, and 0.033 as mg of gallic acid equivalence in mg of
extract, respectively.
Table 3.9 Total phenolic content results of fruit juice extracts.
Fruit Juices TP GAE (mg/mg)
Grape 0.006 ± 0.0005
Orange 0.024 ± 0.0011
Peach 0.067 ± 0.0003
Pomegranate 0.033 ± 0.0009
TP GAE : Total phenolic contents mg equivalents of gallic acid/mg of plant extract
*Mean of triplicate trials

56
Total phenolic content (TPC) of pomegranate was studied by Çam et al. and
it was found between the range of 208.3–343.6 mg catechin equivalents
(Çam, 2009).
ABTS, DPPH, TP, MIC, MBC and disk diffusion test and their results for all
selected fruit juice and tea infusion extracts are shown in Table 3.10 for
comparison.

57
Table 3.10 Comparison of DPPH EC50 (mg/mL), TP GAE (mg/mg), MIC (mg/mL), MBC (mg/mL) and Disk diffusion test (mm) results for all tested
herbal tea infusion and fruit juice dried extracts.
TEAC Value*
(mmol/g)
DPPH EC50*
(mg/mL)
TP GAE**
(mg/mg) MIC** (mg/mL) MBC** (mg/mL)
Disc diffusion*
(mm)
Sage 5.152 ± 0.065 0.072 ± 0.001 0.411 ± 0.0052 3 6 7 ± 0.00
Anise 0.342± 0.011 2.024 ± 0.015 0.040 ± 0.0017 6 12 7 ± 0.63
Rosehip 1.362 ± 0.043 0.530 ± 0.004 0.101 ± 0.0005 3 12 8 ± 0.52
Camomile 0.666 ± 0.021 0.782 ± 0.008 0.038 ± 0.0004 6 12 8 ± 0.49
Grape 0.210 ± 0.018 NA 0.006 ± 0.0005 0.75 12 11 ± 0.52
Orange 0.258 ± 0.020 NA 0.024 ± 0.0011 1.5 12 7 ± 0.41
Peach 0.492 ± 0.041 1.148 ± 0.034 0.067 ± 0.0003 1.5 12 8 ± 0.41
Pomegranate 0.552 ± 0.056 0.924 ± 0.014 0.033 ± 0.0009 1.5 6 11 ± 0.52
Quercetin ND 0.087± 0.002 ND ND ND ND
Gentamicin ND ND ND ND ND 16 ± 0.00
TEAC value: Radical scavenging activity mmol equivalents of trolox/g of extract (DW) DPPH RSA EC50 : Effective concentration of plant extracts for 50 % of DPPH radical scavenging activity TP GAE : Total phenolic contents mg equivalents of gallic acid/mg of plant extract Diameter of inhibition zone (mm) including disk diameter of 6 mm. NA: not applicable, ND: not determined, * Mean of triple trials in duplicates, **Mean of triple trials in triplicates
57
58
CHAPTER 4
CONCLUSION
All of the antioxidant and antimicrobial methods that were used in this study
were summarised in Table 3.8. As a conclusion, sage extract was found with
the highest ABTS radical scavenging activity and phenolic content as well as
with the highest DPPH radical scavenging capacity, among tea infusion
extracts. Rosehip also showed second high antioxidant capacity with its high
phenolic content.
Pomegranate has been found as most effective in ABTS radical scavenging
with its high TEAC value among fruit juice extracts. Peach showed second
high ABTS radical scavenging such as in DPPH. Total phenolic content of
these two fruit juice extracts were not correlated with their antioxidant
capacities.
Most effective inhibition with minimum inhibitory concentration method was
observed by sage and rosehip extracts in the same amount. However
bactericidal concentration of sage was much more effective than anise. Sage
extract was much more effective against Proteus mirabilis as observed from
MBC values of the extracts, since it is more important killing of bacteria than
inhibition.

59
Grape extract has been observed having the most effective inhibition with its
low MIC concentration correlating with its high inhibiton zone diameter
against Proteus mirabilis. Minimum bactericidal concentration of
pomegranate extract was the second best among fruit juice extracts and it
also showed high inhibition zone diameter in disc diffusion test against
Proteus mirabilis.
In disc diffusion test study, 10 µg of gentamicin disc, a commonly used
antibiotic in urinary tract infections has shown a 16 mm of zone clearance on
the inhibition of Proteus mirabilis, when 2.4 miligrams of grape extract was
loaded it has revealed a 11 mm of zone clearance. Meanwhile, 39.10 mg of
grape juice is expected to inhibit the 16 mm of bacterial zone as gentamicin,
besides without resistance. Similarly, 95.08 mg of pomegranate juice may
inhibit the same zone as gentamicin. So, in conclusion these fruit juices
would be anew alternative to urinary tract infections instead of antibiotics.
At the beginning stage of urinary tract infections one could prevent the
progress of Proteus mirabilis infection by consuming daily infusion teas sage,
anise, rosehip and camomile in 35.40, 27.45, 8.60 and 8.10 miligrams of
respective tea bags. Similarly, the consumption of 39.10 mg of grape juice,
160.80 mg of orange juice, 60.50 mg of peach juice and 85.08 mg of
pomegranate juice would be effective at the beginning of the infection.
The antimicrobial effects of active chemicals obtained by chemical methods
might be important for producing new antibiotics in the future. The
contribution of naturally gained antibiotics to medical industry of our country
and other countries of the world is very important. Getting under control of
bacterial infections before its progress, by consuming fruit juices and herbal
teas daily, is also important not only for protecting human health but also for
national economy. Therefore, daily consumed fruit juices and herbal teas
which were studied in this study may be used for urinary tract infections that
P. mirabilis causes.

60
REFERENCES
Alviano W. S., Alviano D. S., Diniz C. G., Antoniol li A. R., Alviano C. S.,
Farias L. M., Carvalho M. A. R., Souza M. M.G., Bol ognese A. M. (2008).
In vitro antioxidant potential of medicinal plant extracts and their activities
against oral bacteria based on Brazilian folk medicine; Archives of Oral
Biology, 53: 545 – 552.
Apak R., Güçlü K., Demirata B., Özyürek M., Çelik S .E., Bektasoglu B.,
Berker K.I. and Özyurt D. (2007). Comparative evaluation of various total
antioxidant capacity assays applied to phenolic compounds with the
CUPRAC assay; Molecules, 12, 1496-1547.
Bergsten G., Wullt B., Svanborg C. , (2005). Escherichia coli, fimbriae,
bacterial persistence and host response induction in the human urinary tract;
International Journal of Medical Microbiology, 295; 487–502.
Breksa A. P., Takeoka G. R., Hidalgo M. B., Vilches A., Vasse J.,
Ramming D. W. (2010). Antioxidant activity and phenolic content of 16 raisin
grape (Vitis vinifera L.) cultivars and selections; Food Chemistry 121: 740–
745.
Brown J. C., Huang G., Haley-Zitlin V., Jiang X. (2009). Antibacterial
Effects of Grape Extracts on Helicobacter pylori; Applied and Environmental
Microbiology, p. 848–852 Vol. 75.
Chohan M., Forster-Wilkins G., Opara E. I. (2008). Determination of the
Antioxidant Capacity of Culinary Herbs Subjected to Various Cooking and
Storage Processes
Using the ABTS*+ Radical Cation Assay; Plant Foods Hum Nutr; 63:47–52.
61
Chung H-J. (2009). Evaluation of the Biological Activity of Extracts from Star-
Anise (Illicium verum); J Food Sci Nutr Vol 14, p 195~200.
Çama M., Hısıl Y., Durmaz G. (2009). Classification of eight pomegranate
juices based on antioxidant capacity measured by four methods; Food
Chemistry 112: 721–726.
Duman A. D., Ozgen M., Dayisoylu K. S., Erbil N., Durgac C. (2009).
Antimicrobial Activity of Six Pomegranate (Punica granatum L.) Varieties and
Their Relation to Some of Their Pomological and Phytonutrient
Characteristics, Molecules 2009, 14, 1808-1817.
Dragan A., Dusanka D.A., Drago B., Nenad T. (2003). Structure radical
scavenging activity relationships of flavonoids. Croatica Chemica Acta 76,
(1), 55-61.
Esmaeili M. A., Sonboli A. (2010). Antioxidant, free radical scavenging
activities of Salvia brachyantha and its protective effect against oxidative
cardiac cell injury; Food and Chemical Toxicology 48: 846–853.
Franco D., Pinelo M., Sineiro J., Nu´n˜ez M. J. (2007). Processing of Rosa
rubiginosa: Extraction of oil and antioxidant substances; Bioresource
Technology 98:3506–3512.
Furiga A., Lonvaud-Funel A., Badet C. (2009). In vitro study of antioxidant
capacity and antibacterial activity on oral anaerobes of a grape seed extract;
Food Chemistry 113: 1037–1040.
Gould S. WJ, Fielder M. D., Kelly A. F., Naughton D . P. (2009). Anti-
microbial activities of pomegranate rind extracts: enhancement by cupric

62
sulphate against clinical isolates of S. aureus, MRSA and PVL positive CA-
MSSA; BMC Complementary and Alternative Medicine 2009, 9:23,
doi:10.1186/1472-6882-9-23.
Hagerman, A. E., Riedl, K. M., Jones, G. A., Sovik, K. N., Ritchard, N. T.,
Hartzfeld, P. W., & Riechel, T. L. (1998). High molecular weight plant
polyphenolics (tannins) as biological antioxidants. Journal of Agricultural and
Food Chemistry, 46, 1887±1892.
Hammer K.A., Carson C.F., Riley T.V. (1999). Antimicrobial activity of
essential oils and other plant extracts; Journal of Applied Microbiology 1999,
86, 985–990
Jabalameli F., Malekzadeh F., Mirsalehian A. (2005). Effects of antibiotics
on adhesion and invasion of Proteus mirabilis; Acta Medica Iranica, 43(1):
55-59.
Jones D. B., Lockatell C. V., Johnson D. E., Warren J. W., Mobley H. L.T.
(1990). Construction of a Urease-Negative Mutant of Proteus mirabilis:
Analysis of Virulence in a Mouse Model of Ascending Urinary Tract Infection;
Infection and Immunity, Apr. 1990, p. 1120-1123
Kelebek H., Selli S., Canbas A., Cabaroglu T. (2009). HPLC determination
of organic acids, sugars, phenolic compositions and antioxidant capacity of
orange juice and orange wine made from a Turkish cv. Kozan; Microchemical
Journal 91: 187–192.
Kurto ğlu M.G., Bozkurt H., Güdücüo ğlu H., Bayram Y., Berkta ş M..
(2008). Klinik örneklerden izole edilen Proteus mirabilis suşlarının
antimikrobial ajanlara duyarlılıkları; Genel Tıp Dergisi, 18(1):23-26.
63
Lee H. J., Cho H. J., Lee H., Kwon K. H., Hong Y. H ., Kim S., Suh H. J.
(2009). Comparison of Chemical Composition and Radical Scavenging
Activity of Pomegranate Extracts from Different Growing Areas; Journal of
Food Sci Nutr., Vol 14, p 214~219.
Mann C. M., Markham C.L. (1997). A new method for determining the
minimum inhibitory concentration of essential oils; Journal of Applied
Microbiology 1998, 84, 538–544
Meyrier A ., (2003). Urinary Tract Infections, Chapter-7 [online],
www.kidneyatlas.org/book2/adk2_07.pdf [searching date: 15.06.2010]
Miliauskasa G., Venskutonis P. R., van Beek T. A. (2004). Screening of
radical scavenging activity of some medicinal and aromatic plant extracts;
Food Chemistry, 85: 231–237.
Murphy, C. A. ; Belas, R. (1999). Genomic rearrangements in the flagellin
genes of Proteus mirabilis; Molecular Microbiology 31(2), 679–690.
Mobley H. L. T.; Warren J. W. , 1996, Urinary Tract Infections: Molecular
Pathogenesis and Clinical Management; American Society for Microbiology
Press, USA, 1-55581-093-4.
Niki E. (2010). Assessment of antioxidant capacity in vitro and in vivo; Free
Radical Biology & Medicine 49 (2010) 503–515.
O’hara, C.M.; Brenner, F.; Miller, J.M. (2000). Classification, Identification,
and Clinical Significance of Proteus, Providencia, and Morganella; Clinical
Microbiology Reviews, 0893-8512/00/04.0010 Oct. 2000, p. 534–546.
64
Panichayupakaranant P. , Tewtrakul S., Yuenyongsawa d S. (2010).
Antibacterial, anti-inflammatory and anti-allergic activities of standardised
pomegranate rind extract; Food Chemistry 123: 400–403.
Pollack, R.A.; Findlay, L.; Mondschein,W.; Modesto, R.R. (2005).
“Microbial Sensitivity Testing”, Laboratory Exercises in Microbiology, 2nd
Edition.; J.Wiley and Sons, Inc., USA, 93-105.
Poncea A.G., Fritzb R., Valleb C., Rourac S.I. (2003). Antimicrobial activity
of essential oils on the native microflora of organic Swiss chard; Lebensm.-
Wiss. u.-Technol., 36: 679–684.
Santucci A., Bonechi C., D'Addario C., Rossi C., Br aconi D., Bernardini
G., Salvini L., Figura N., Martini S. (2009).Grape and wine extracts have
antibacterial activity against Helicobacter pylori clinical isolates; J Chemother;
21(5):507-13.
Singleton V. L., Rossi J. A. (1965). Colorimetry of total phenolics with
phosphomolybdic phosphotungstic acid reagents; American Journal of
Enology and Viticulture, 16: 144-158.
Tal S., Guller V., Levi S., Bardenstein R., Berger D., Gurevich I.,
Gurevich A. , (2005). Profile and prognosis of febrile elderly patients with
bacteremic urinary tract infection; Journal of Infection, 50, 296–305.
Tepe B., Akpulat H. A., Sokmen M., Daferera D., Yum rutas O., Aydin E.,
Polissiou M., Sokmen A. (2006). Screening of the antioxidative and
antimicrobial properties of the essential oils of Pimpinella anisetum and
Pimpinella flabellifolia from Turkey; Food Chemistry, 97: 719–724.
65
Vosti L. K. (2007). A prospective, longitudinal study of the behavior of
serologically classified isolates of Escherichia coli in women with recurrent
urinary tract infections, Journal of Infection 55, 8-18.
Vrcˇek I. V., Bojic M., Zˇuntar I., Mendaš G., Medi c´-Šaric´ M. (2011).
Phenol content, antioxidant activity and metal composition of Croatian wines
deriving from organically and conventionally grown grapes, Food Chemistry
124: 354–361.
Wael M, Ghoush A., (2008). Screening Test for Detection of Urinary Tract
Infections: Evaluation of the Urinary Leukocyte Esterase Dipstick Test; TAF
Preventive Medicine Bulletin, 7(3).
Yoo K. M., Lee C. H., Lee H., Moon B., Lee C. Y. (2008). Relative
antioxidant and cytoprotective activities of common herbs. Food Chemistry,
106: 929–936.
(n.d.). Retrieved 26/07/ 2010, from UCLA Health System:
http://www.uclahealth.org/homepage_site.cfm?id=11


![AVOCADO TOAST 9 morning - toutsuitehtx.com · aÇai / pitaya bowl* 9 [v] antioxidant-loaded super fruit blended aÇai or pitaya, house-made granola, fruit mix-ins .50 toppings .50](https://img.pdfslide.us/doc/110x75/5c5cb51609d3f245488bc382/avocado-toast-9-morning-acai-pitaya-bowl-9-v-antioxidant-loaded-super.jpg)