Embed Size (px)
Citation preview
Slide 1
Investigation of Airfoil Aero Acoustics due to Different Stall Mechanism
using Large Eddy Simulation (LES)
Voo Keng Soon Vince Lim Nee Sheng Winson
Tan Chun Hern DSO National Laboratories
05 Nov 2012
Slide 2
Brief Review of Available Experimental Data
Slide 3
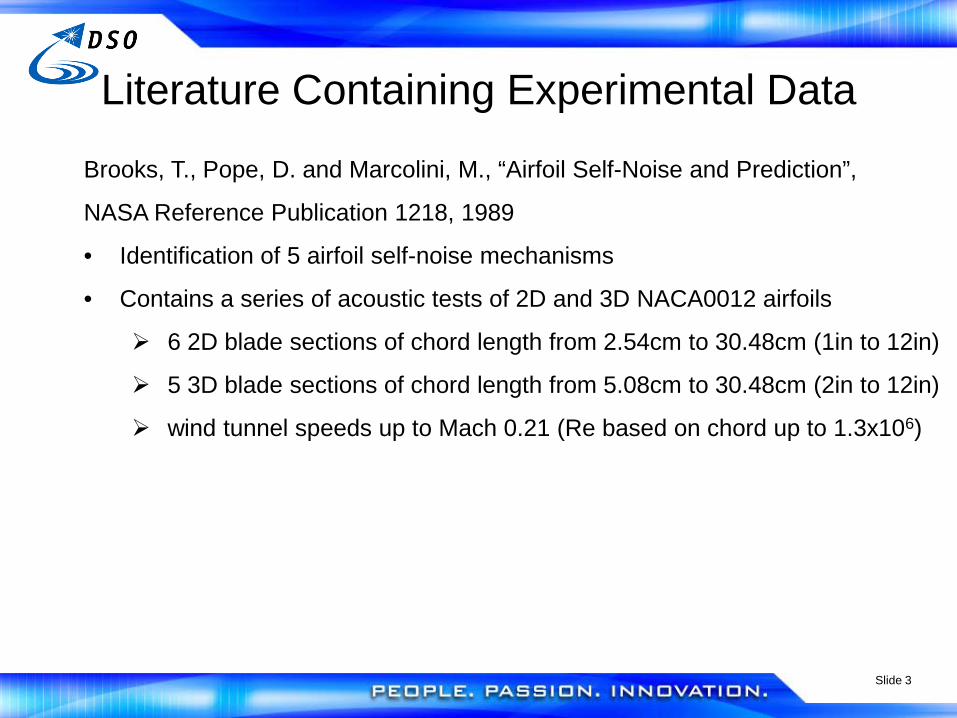
Literature Containing Experimental Data
Brooks, T., Pope, D. and Marcolini, M., “Airfoil Self-Noise and Prediction”,
NASA Reference Publication 1218, 1989
• Identification of 5 airfoil self-noise mechanisms
• Contains a series of acoustic tests of 2D and 3D NACA0012 airfoils
6 2D blade sections of chord length from 2.54cm to 30.48cm (1in to 12in)
5 3D blade sections of chord length from 5.08cm to 30.48cm (2in to 12in)
wind tunnel speeds up to Mach 0.21 (Re based on chord up to 1.3x10⁶)
Slide 4
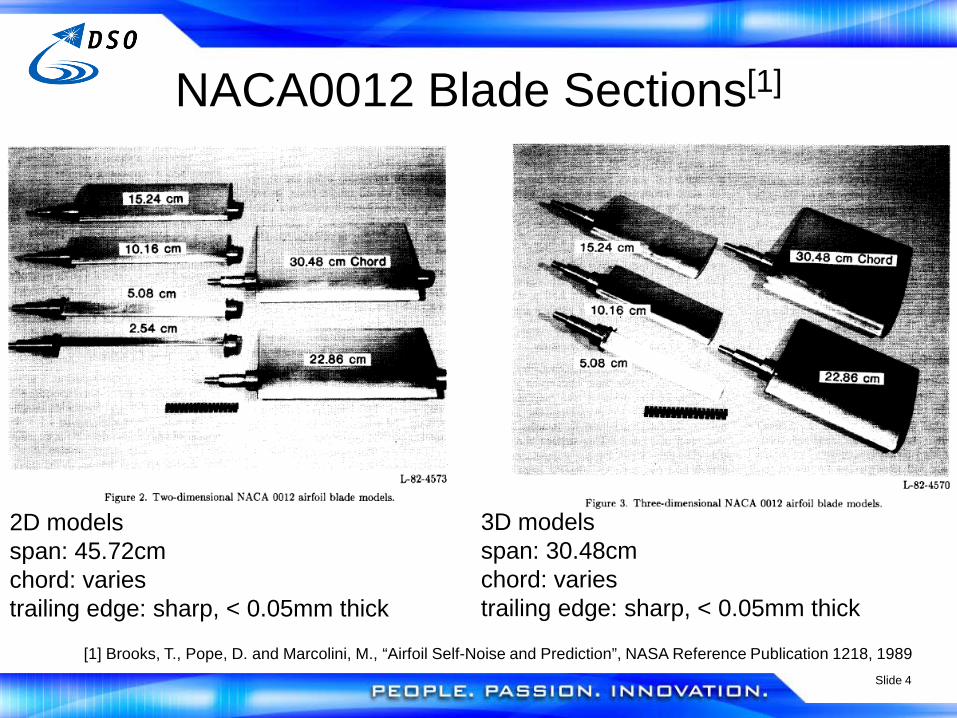
NACA0012 Blade Sections[1]
2D models span: 45.72cm chord: varies trailing edge: sharp, < 0.05mm thick
3D models span: 30.48cm chord: varies trailing edge: sharp, < 0.05mm thick
[1] Brooks, T., Pope, D. and Marcolini, M., “Airfoil Self-Noise and Prediction”, NASA Reference Publication 1218, 1989
Slide 5
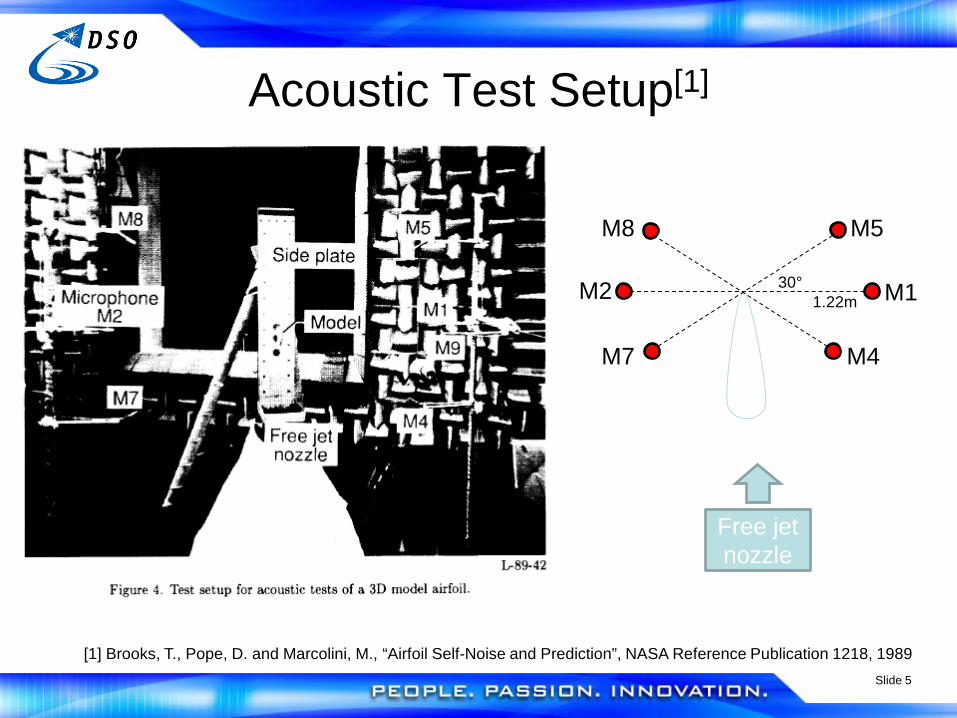
Acoustic Test Setup[1]
Free jet nozzle
M1 M2
M5
M4
M8
M7
1.22m 30°
[1] Brooks, T., Pope, D. and Marcolini, M., “Airfoil Self-Noise and Prediction”, NASA Reference Publication 1218, 1989
Slide 6
Brief Review of Different Airfoil Self-Noise Mechanisms
Slide 7
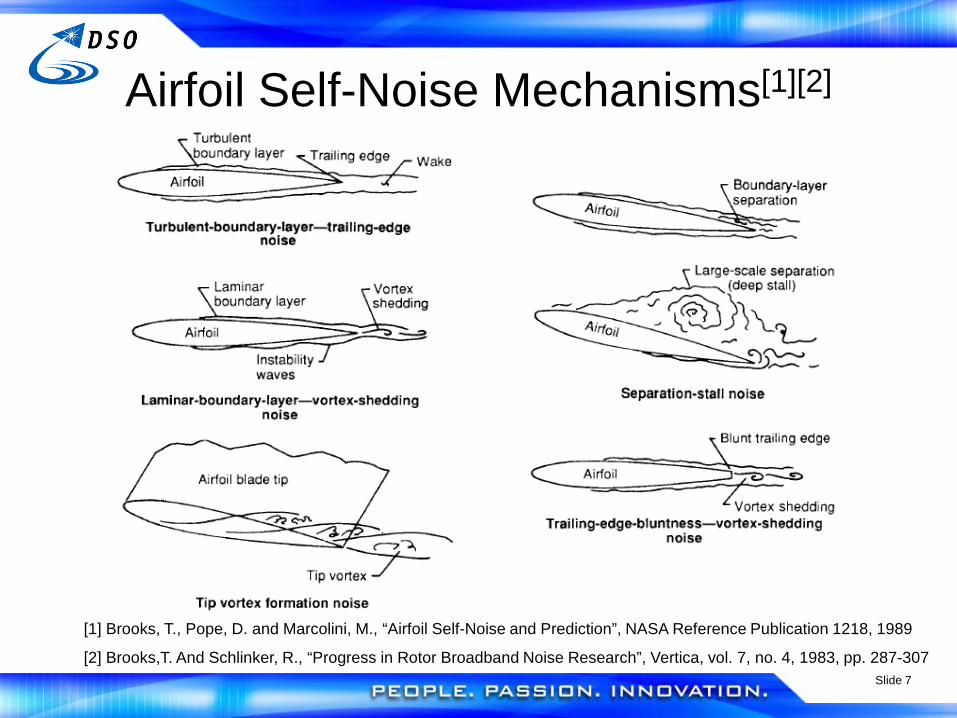
Airfoil Self-Noise Mechanisms[1][2]
[1] Brooks, T., Pope, D. and Marcolini, M., “Airfoil Self-Noise and Prediction”, NASA Reference Publication 1218, 1989
[2] Brooks,T. And Schlinker, R., “Progress in Rotor Broadband Noise Research”, Vertica, vol. 7, no. 4, 1983, pp. 287-307
Slide 8
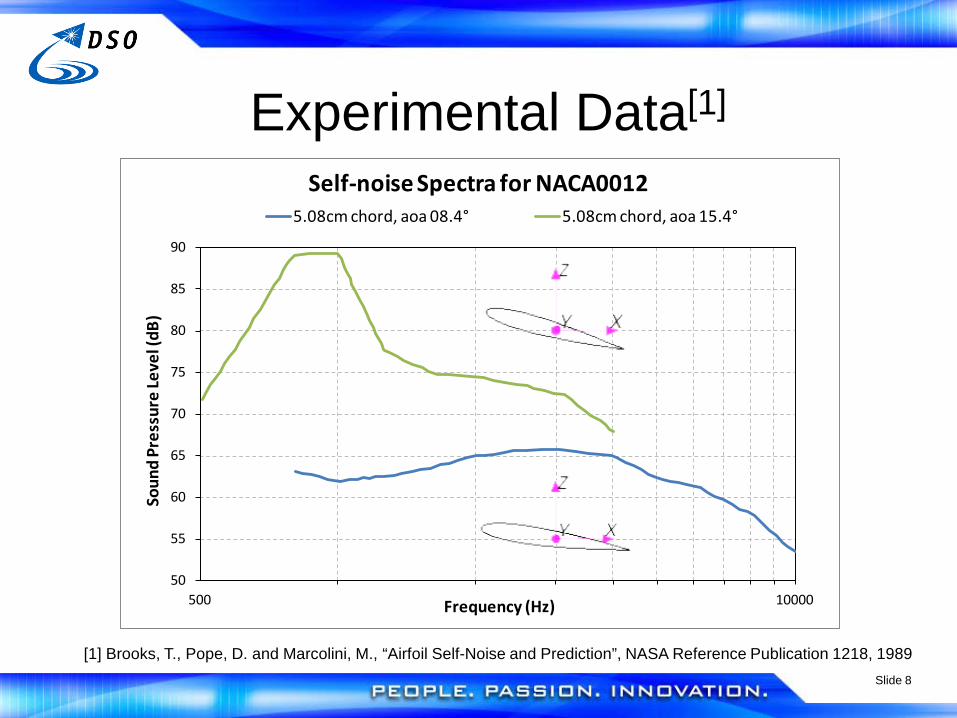
Experimental Data[1]
[1] Brooks, T., Pope, D. and Marcolini, M., “Airfoil Self-Noise and Prediction”, NASA Reference Publication 1218, 1989
50
55
60
65
70
75
80
85
90
500 10000
Soun
d Pr
essu
re Le
vel (
dB)
Frequency (Hz)
Self-noise Spectra for NACA00125.08cm chord, aoa 08.4° 5.08cm chord, aoa 15.4°
Slide 9
CFD Simulation of NACA0012 at AOA of 8.4° to show
Turbulent Boundary Layer Trailing Edge Noise and Boundary Layer Separation Noise
Slide 10
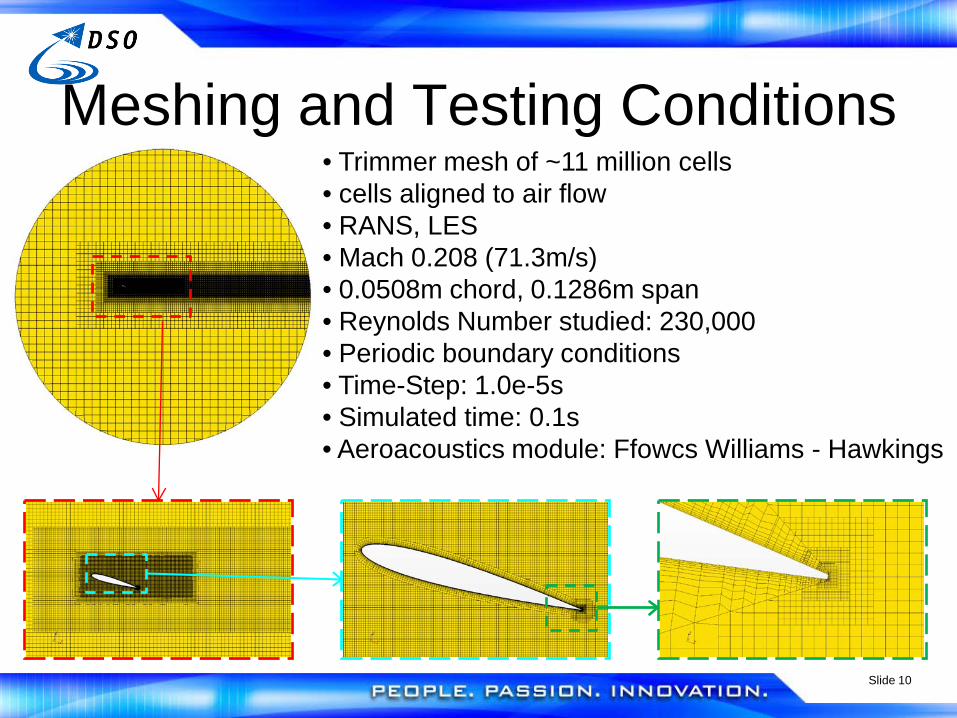
Meshing and Testing Conditions • Trimmer mesh of ~11 million cells • cells aligned to air flow • RANS, LES • Mach 0.208 (71.3m/s) • 0.0508m chord, 0.1286m span • Reynolds Number studied: 230,000 • Periodic boundary conditions • Time-Step: 1.0e-5s • Simulated time: 0.1s • Aeroacoustics module: Ffowcs Williams - Hawkings
Slide 11
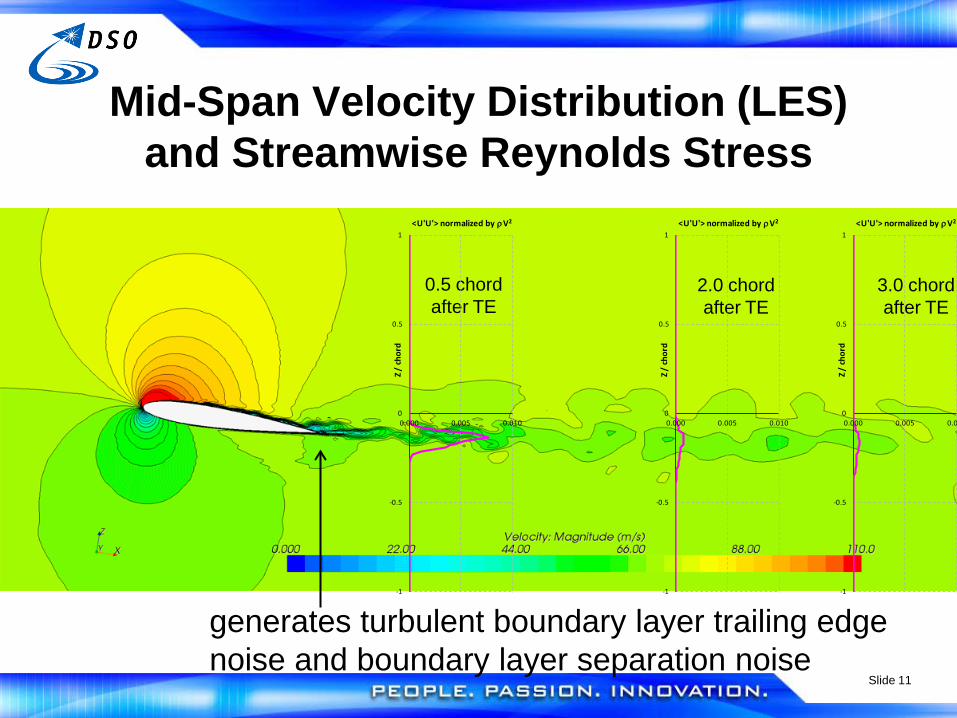
Mid-Span Velocity Distribution (LES) and Streamwise Reynolds Stress
0.5 chord after TE
2.0 chord after TE
3.0 chord after TE
-1
-0.5
0
0.5
1
0.000 0.005 0.010
Z / ch
ord
<U'U'> normalized by ρV2
-1
-0.5
0
0.5
1
0.000 0.005 0.010
Z / ch
ord
<U'U'> normalized by ρV2
-1
-0.5
0
0.5
1
0.000 0.005 0.0
Z / ch
ord
<U'U'> normalized by ρV2
generates turbulent boundary layer trailing edge noise and boundary layer separation noise
Slide 12
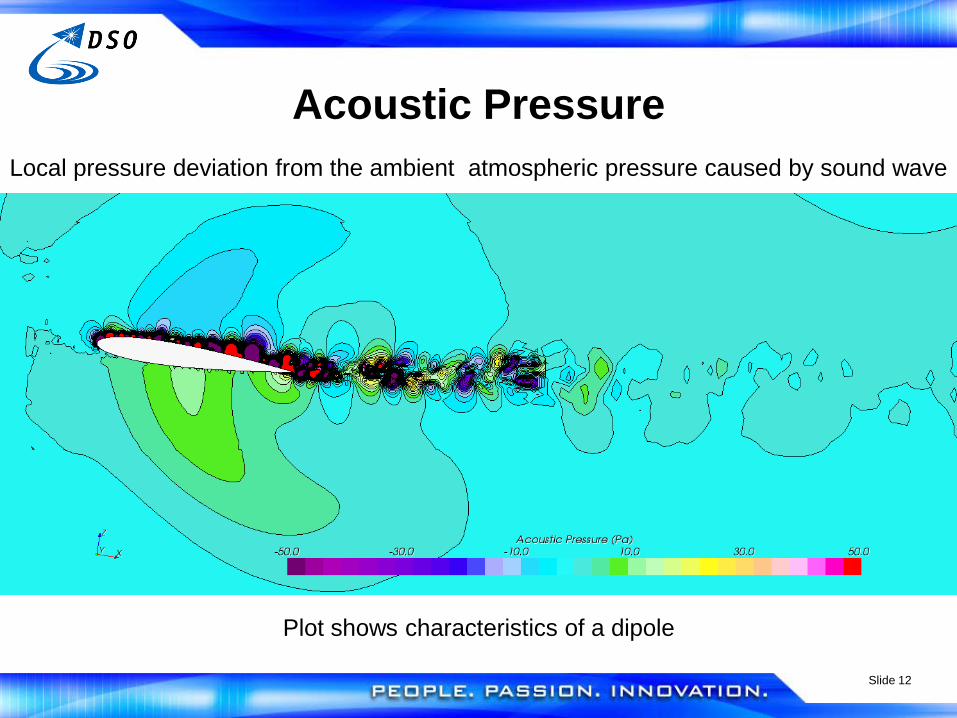
Acoustic Pressure Local pressure deviation from the ambient atmospheric pressure caused by sound wave
Plot shows characteristics of a dipole
Slide 13
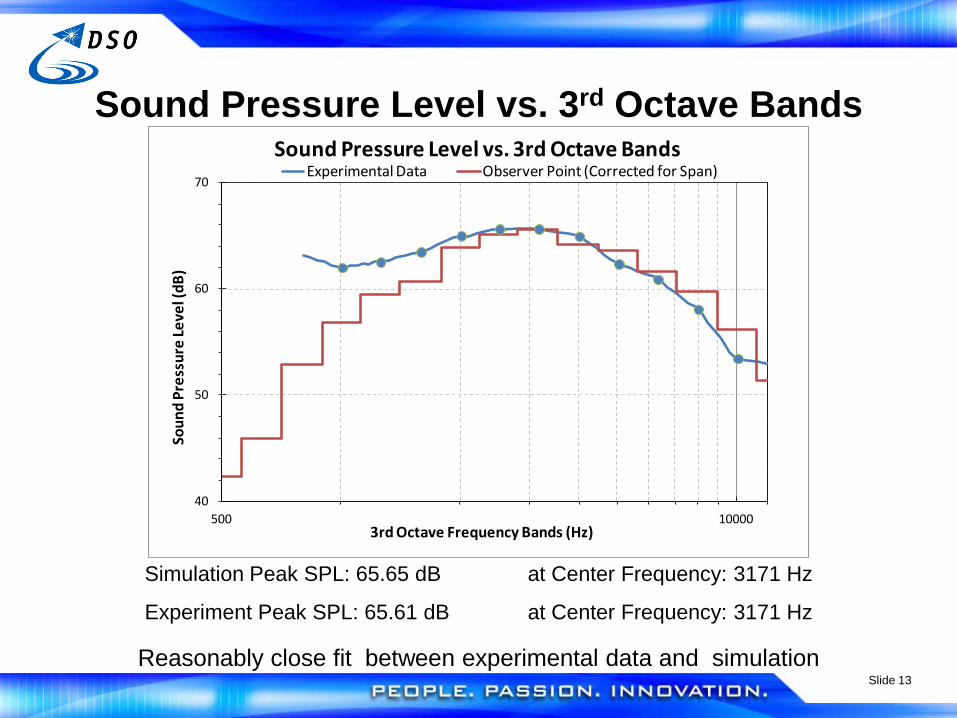
Sound Pressure Level vs. 3rd Octave Bands
Simulation Peak SPL: 65.65 dB at Center Frequency: 3171 Hz
Experiment Peak SPL: 65.61 dB at Center Frequency: 3171 Hz
40
50
60
70
500 10000
Soun
d Pr
essu
re Le
vel (
dB)
3rd Octave Frequency Bands (Hz)
Sound Pressure Level vs. 3rd Octave BandsExperimental Data Observer Point (Corrected for Span)
Reasonably close fit between experimental data and simulation
Slide 14
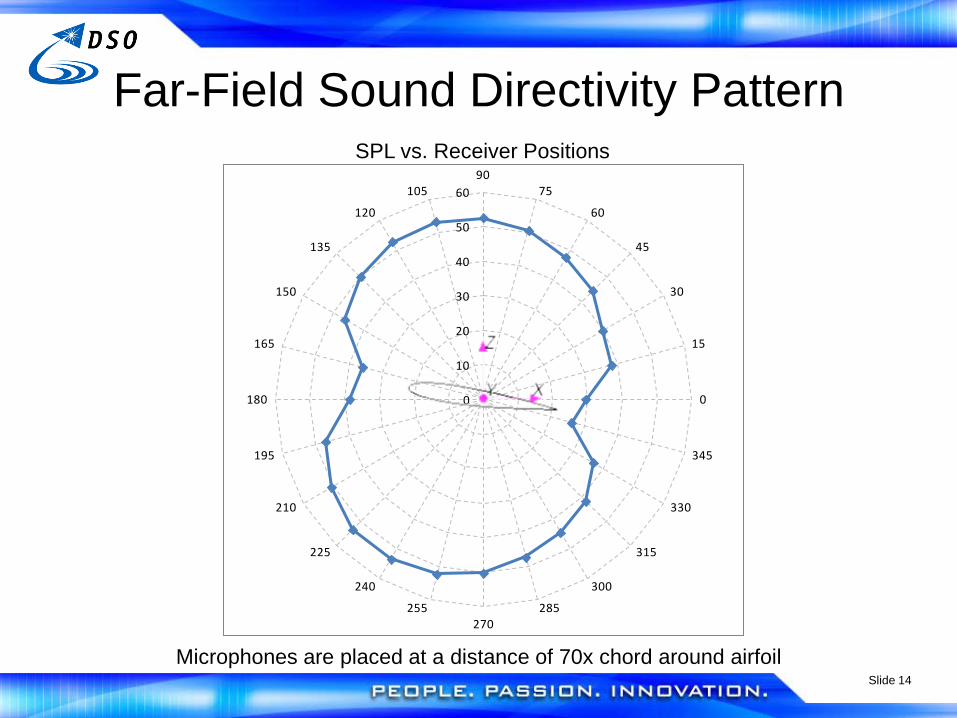
Far-Field Sound Directivity Pattern
0
10
20
30
40
50
6090
75
60
45
30
15
0
345
330
315
300
285270
255
240
225
210
195
180
165
150
135
120
105
Microphones are placed at a distance of 70x chord around airfoil
SPL vs. Receiver Positions
Slide 15
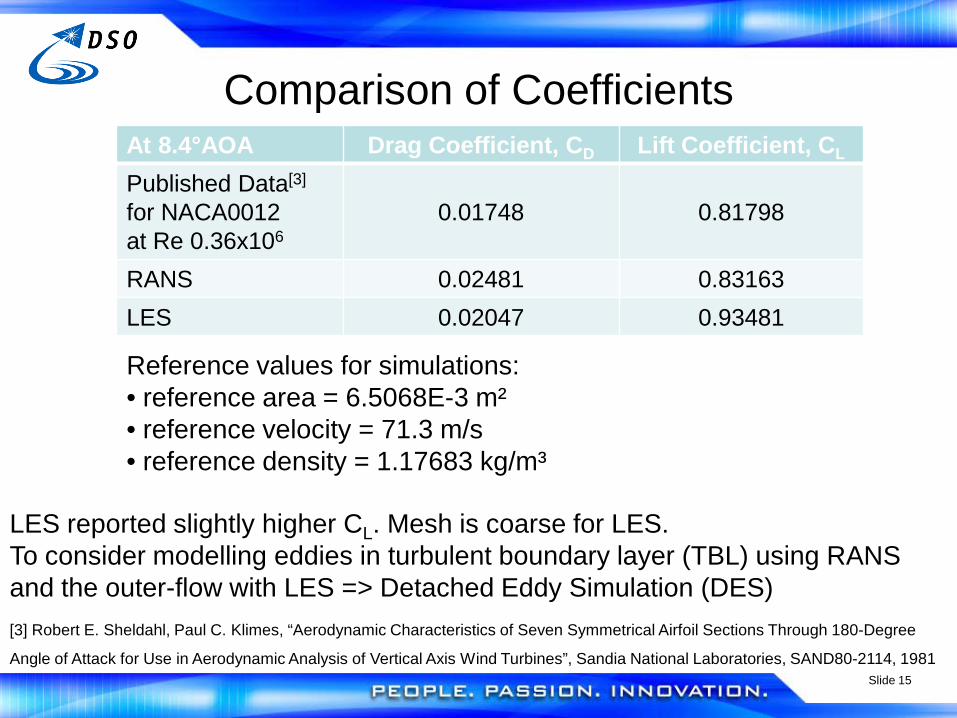
Comparison of Coefficients At 8.4°AOA Drag Coefficient, CD Lift Coefficient, CL
Published Data[3] for NACA0012 at Re 0.36x10⁶
0.01748
0.81798
RANS 0.02481 0.83163 LES 0.02047 0.93481
Reference values for simulations: • reference area = 6.5068E-3 m² • reference velocity = 71.3 m/s • reference density = 1.17683 kg/m³
[3] Robert E. Sheldahl, Paul C. Klimes, “Aerodynamic Characteristics of Seven Symmetrical Airfoil Sections Through 180-Degree
Angle of Attack for Use in Aerodynamic Analysis of Vertical Axis Wind Turbines”, Sandia National Laboratories, SAND80-2114, 1981
LES reported slightly higher CL. Mesh is coarse for LES. To consider modelling eddies in turbulent boundary layer (TBL) using RANS and the outer-flow with LES => Detached Eddy Simulation (DES)
Slide 16
CFD Simulation of NACA0012 at AOA of 15.4° to show
Large Scale Separation (Deep Stall) Noise

Slide 17
Meshing and Testing Conditions • Trimmer mesh of ~11 million cells • cells aligned to air flow • URANS, LES • Mach 0.208 (71.3m/s) • 0.0508m chord, 0.1286m span • Reynolds Number studied: 230,000 • Periodic boundary conditions • Time-Step: 2.0e-5s • Simulated time: 0.2s • Aeroacoustics module: Ffowcs Williams - Hawkings
Slide 18
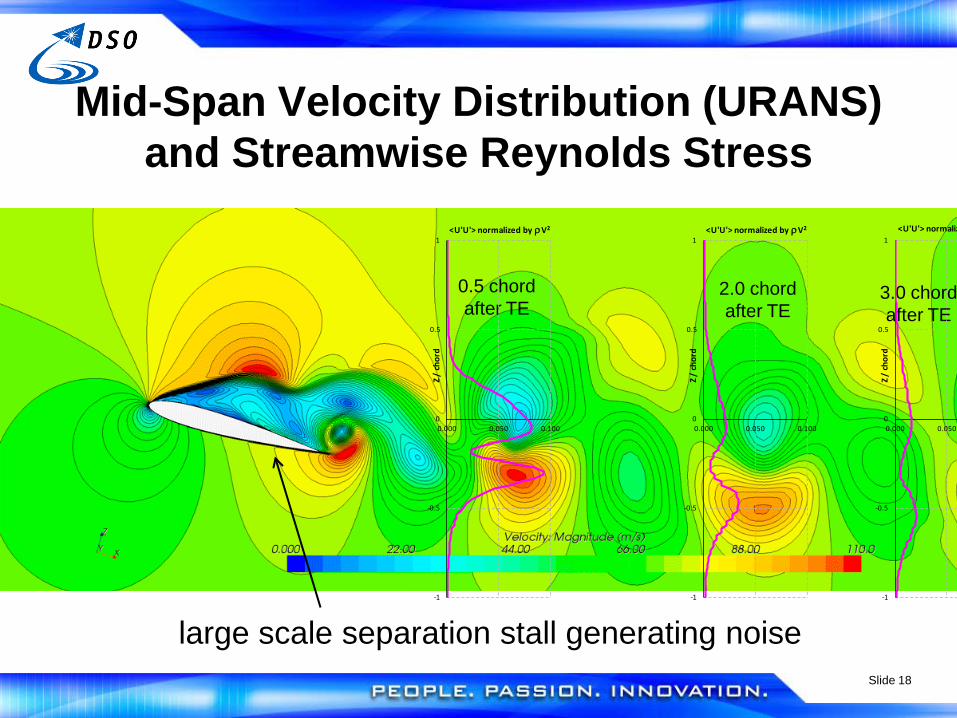
Mid-Span Velocity Distribution (URANS) and Streamwise Reynolds Stress
0.5 chord after TE
2.0 chord after TE
3.0 chord after TE
-1
-0.5
0
0.5
1
0.000 0.050 0.100Z /
chor
d
<U'U'> normalized by ρV2
-1
-0.5
0
0.5
1
0.000 0.050 0.100
Z / ch
ord
<U'U'> normalized by ρV2
-1
-0.5
0
0.5
1
0.000 0.050
Z / ch
ord
<U'U'> normaliz
large scale separation stall generating noise
Slide 19
0.000 0.050
-1
-0.5
0
0.5
1<U'U'> normaliz
Z / ch
ord
0.000 0.050 0.100
-1
-0.5
0
0.5
1<U'U'> normalized by ρV2
Z / ch
ord
0.000 0.050 0.100
-1
-0.5
0
0.5
1<U'U'> normalized by ρV2
Z / ch
ord
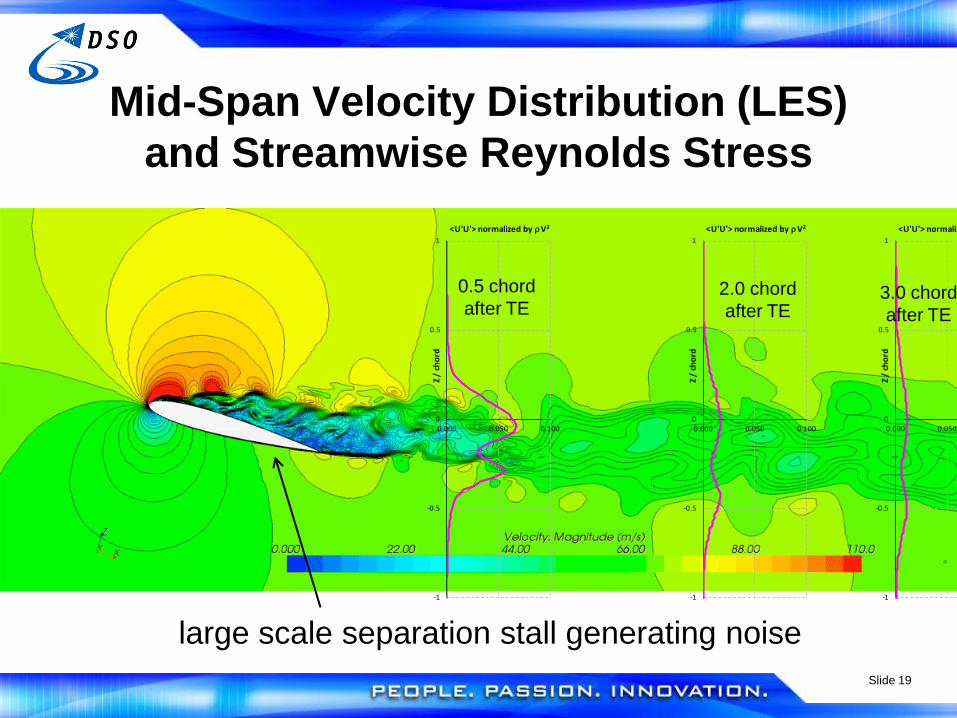
Mid-Span Velocity Distribution (LES) and Streamwise Reynolds Stress
0.5 chord after TE
2.0 chord after TE
3.0 chord after TE
large scale separation stall generating noise
Slide 20
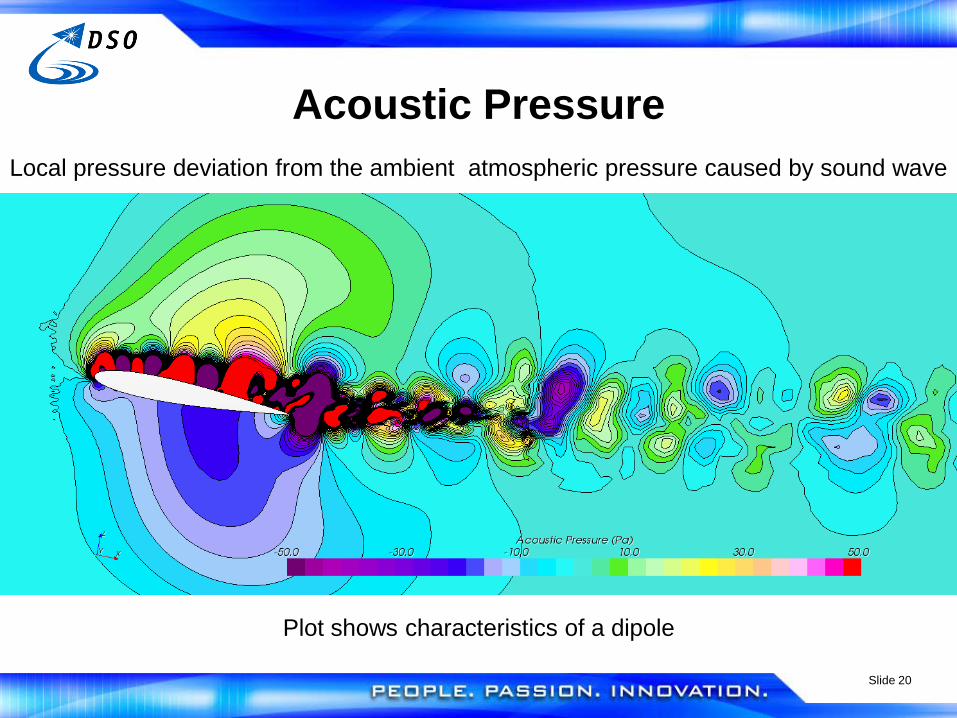
Acoustic Pressure Local pressure deviation from the ambient atmospheric pressure caused by sound wave
Plot shows characteristics of a dipole
Slide 21
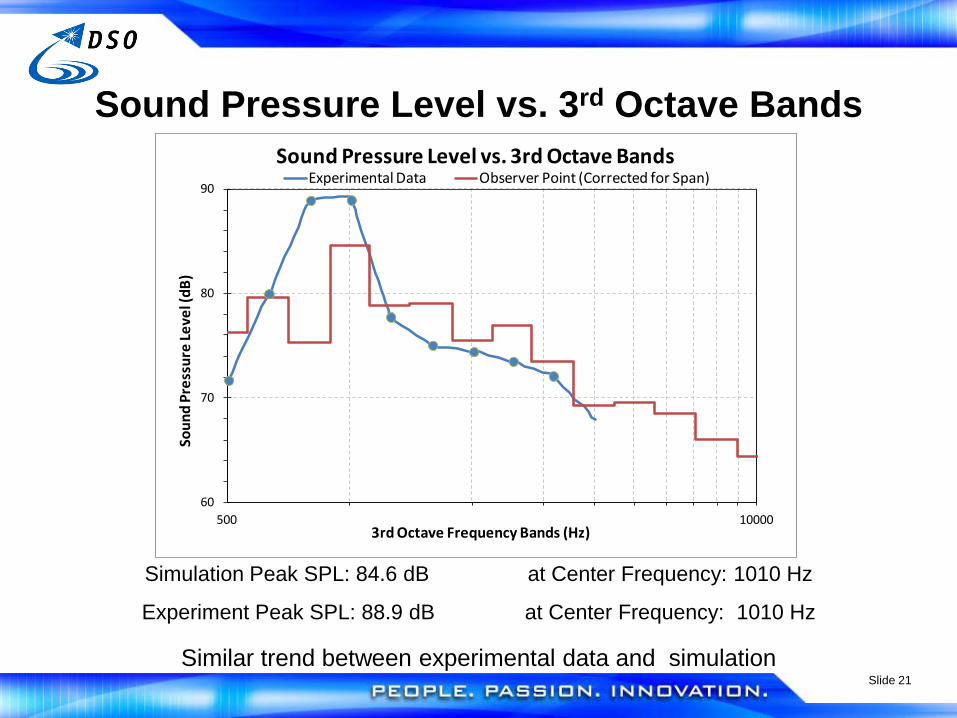
Sound Pressure Level vs. 3rd Octave Bands
Simulation Peak SPL: 84.6 dB at Center Frequency: 1010 Hz
Experiment Peak SPL: 88.9 dB at Center Frequency: 1010 Hz
60
70
80
90
500 10000
Soun
d Pr
essu
re Le
vel (
dB)
3rd Octave Frequency Bands (Hz)
Sound Pressure Level vs. 3rd Octave BandsExperimental Data Observer Point (Corrected for Span)
Similar trend between experimental data and simulation
Slide 22
0
10
20
30
40
50
60
7090
75
60
45
30
15
0
345
330
315
300
285270
255
240
225
210
195
180
165
150
135
120
105
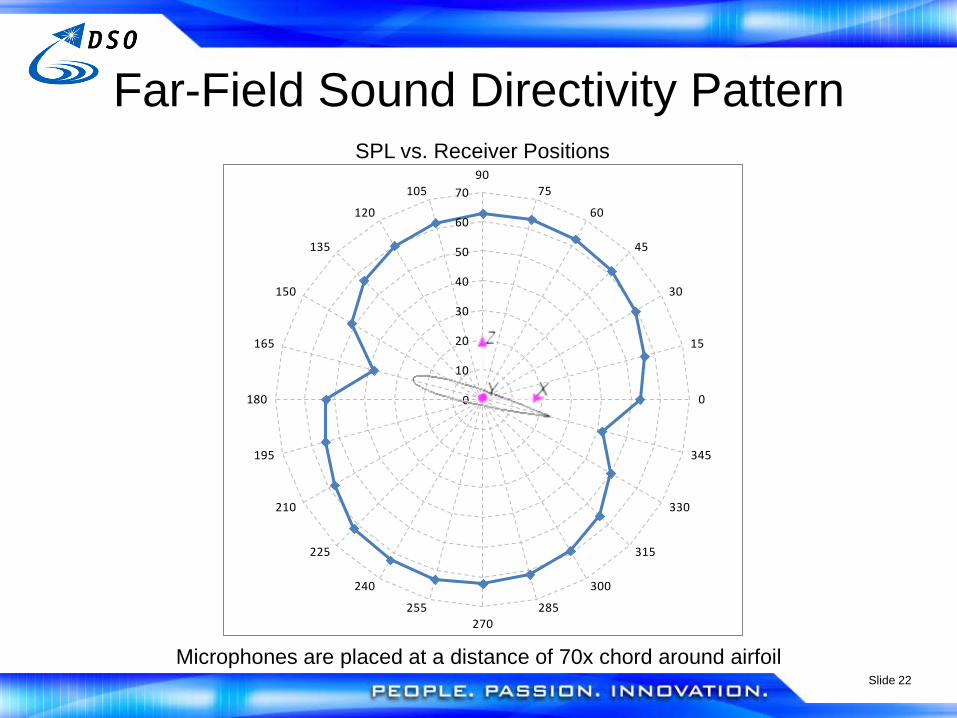
Far-Field Sound Directivity Pattern
Microphones are placed at a distance of 70x chord around airfoil
SPL vs. Receiver Positions
Slide 23
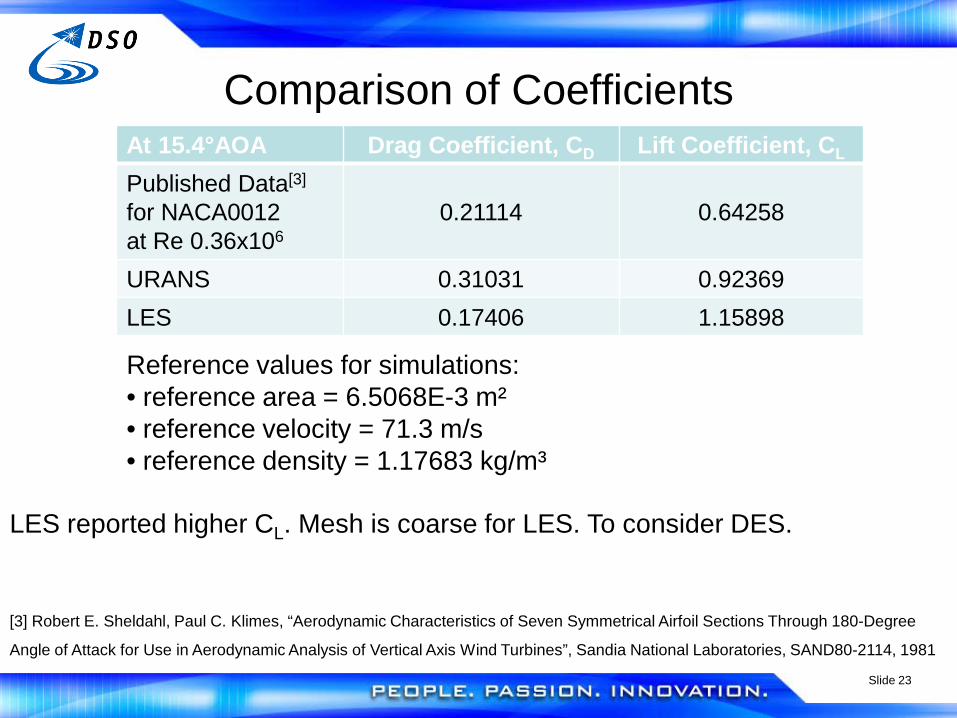
Comparison of Coefficients At 15.4°AOA Drag Coefficient, CD Lift Coefficient, CL
Published Data[3]
for NACA0012 at Re 0.36x10⁶
0.21114
0.64258
URANS 0.31031 0.92369 LES 0.17406 1.15898
Reference values for simulations: • reference area = 6.5068E-3 m² • reference velocity = 71.3 m/s • reference density = 1.17683 kg/m³
[3] Robert E. Sheldahl, Paul C. Klimes, “Aerodynamic Characteristics of Seven Symmetrical Airfoil Sections Through 180-Degree
Angle of Attack for Use in Aerodynamic Analysis of Vertical Axis Wind Turbines”, Sandia National Laboratories, SAND80-2114, 1981
LES reported higher CL. Mesh is coarse for LES. To consider DES.
Slide 24
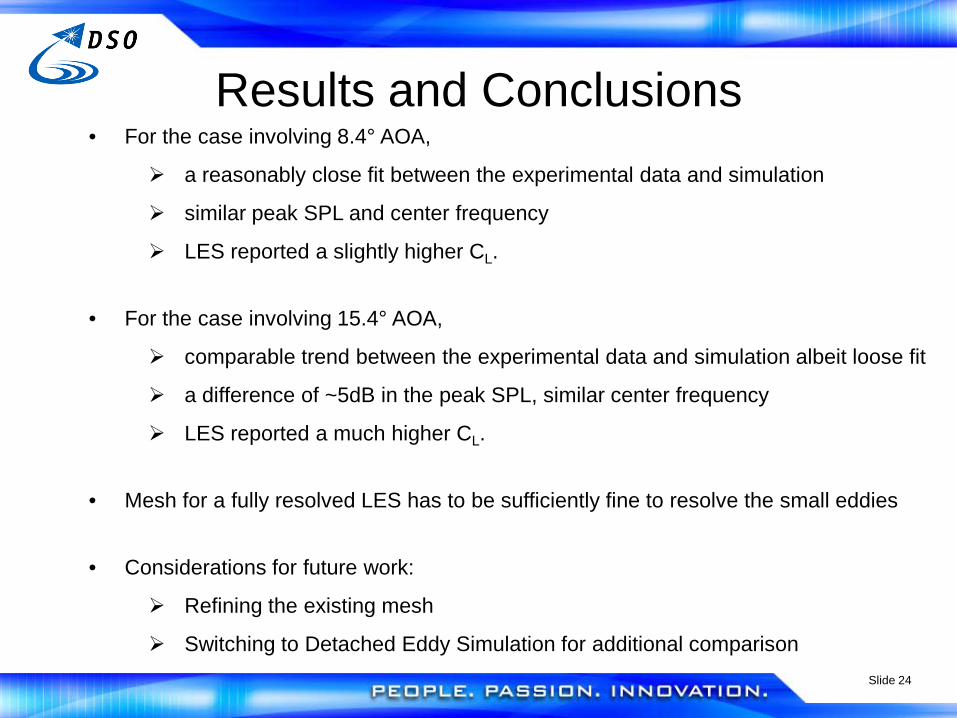
Results and Conclusions • For the case involving 8.4° AOA,
a reasonably close fit between the experimental data and simulation
similar peak SPL and center frequency
LES reported a slightly higher CL.
• For the case involving 15.4° AOA,
comparable trend between the experimental data and simulation albeit loose fit
a difference of ~5dB in the peak SPL, similar center frequency
LES reported a much higher CL.
• Mesh for a fully resolved LES has to be sufficiently fine to resolve the small eddies
• Considerations for future work:
Refining the existing mesh
Switching to Detached Eddy Simulation for additional comparison