Embed Size (px)
Citation preview
Queensland University of Technology Science & Engineering Faculty
2 George Street Brisbane QLD 4001
Australia
Investigation of Air Quality at Lithgow Correctional Centre
Report for
Corrective Services New South Wales
Professor Lidia Morawska, PhD Dr Congrong He
2
This project was conducted by investigators from the International Laboratory for Air Quality and Health
Queensland University of Technology
Professor Lidia Morawska
Dr. Congrong He
Mr. Quang Tran
Dr. Hao Wang
Dr. Luke Knibbs
© QUT, February 2013 No part of this report may be quoted out of context or used in a manner which may not be consistent with the report's overall results. The name or logo of the Queensland University of Technology may not be used in any form on publicity material that may be generated as a result of this report.
3
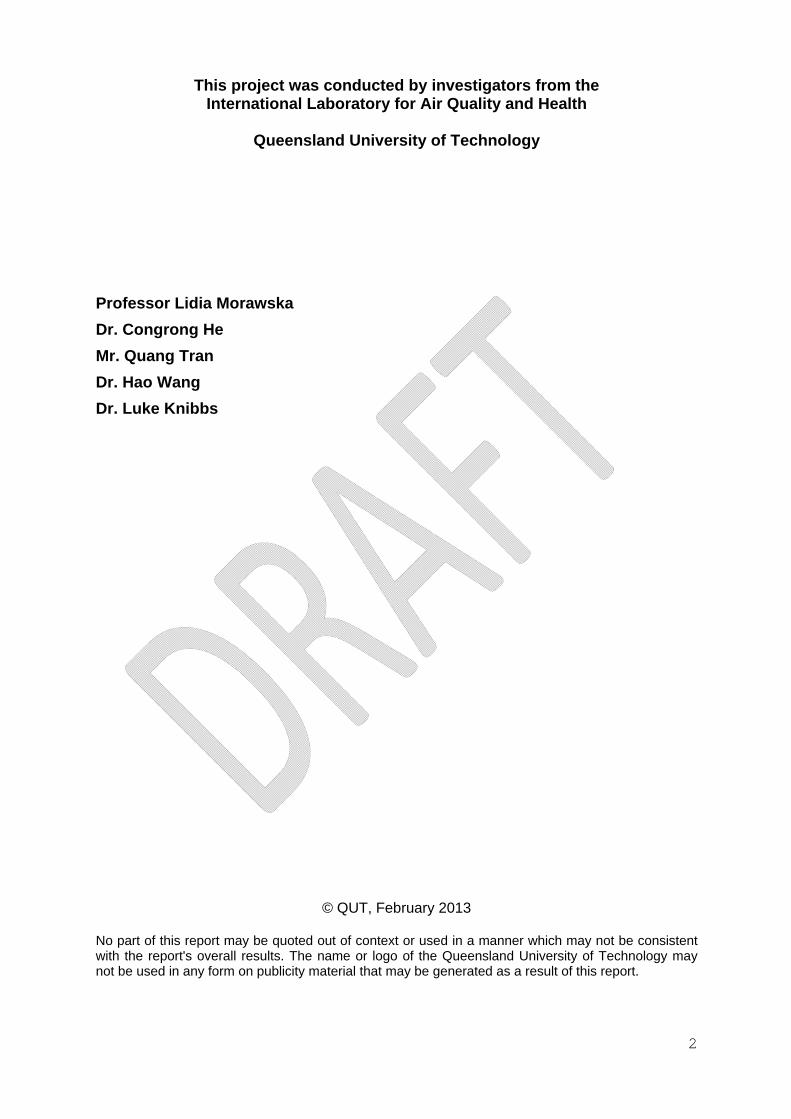
TABLE OF CONTENTS
Abbreviations ………………………………………………………………………... 5
1. EXECUTIVE SUMMARY…………………………………………………….......... 6
2. PROJECT BACKGROUND AND AIM……………………………………........… 9
3. OBJECTIVES OF THE PROJECT ……………………………………...........…… 10
4. EXPERIMENTAL PROCEDURES………………………………………........….. 11
4.1. Building location …………………………………………………….…….. 11
4.2. Instrumentation and parameters measured………………………………… 11
4.3. Sampling locations and sampled air ……………………………………… 12
4.4. Time of the measurements ………………………………………………… 13
4.5. Methodology for investigation of indoor particle sources ….…………… 13
4.6. Data processing and analysis ……………………………………………… 14
5. RESULTS AND DISCUSSION……………………………………………….......... 15
5.1. Meteorological Conditions…………………………………………………..... 15
5.2. Outdoor Air…………………………………………………………………...... 15 5.2.1. Average outdoor particle concentration …………………………. 15 5.2.2. Diurnal variation of outdoor particle number and PM2.5 concentration
………………………............................... 18
5.3. Indoor Air ……………………….……………………………………...…… 21 5.3.1. Average indoor PM2.5 concentration …………………………... 21 5.3.2. Average indoor PN concentration ………………...…………... 21 5.3.3. Diurnal variation of indoor PN number and PM2.5 concentration
.…………………………….…………………………………….… 22
5.4. Indoor and Outdoor Comparison …………………………………….…… 23
5.5. Personal exposure concentration levels …………………………………….. 25
5.6. Possible indoor particle sources..........…………………………………...... 27
5.7. Indoor and Outdoor VOC, CO and CO2 concentration levels.................. 29 5.7.1. Average VOC concentration levels …………............................. 29 5.7.2. Average CO and CO2 concentration levels …………................. 32
5.8. Spatial Variation of Particle Number Concentration in the Industries…... 33
5.9. Difference in Ventilation between the First and Second Round................ 34
5.10. Discussions .............................................................................................. 34
6. OVERALL CONCLUSION ……………………………………………................... 35
Acknowledgments………………………………………………………………………. 36
References………………………………………………………………………………… 36
Appendix A: Instrument Settings with photos…………….……………...…….…. 37
Appendix B: Meteorology data during the measurement at LCC .………………. 39

4
Appendix C: Summary of the overall average indoor and outdoor TVOC, Benzene, Toluene and Xylene concentrations during the first and second round. .……… 40
5
ABBREVIATIONS
C Concentration CO Carbon monoxide CO2 Carbon dioxide CPC Condensation Particle Counter DustTrak Model 8520, 8530, 8534 DustTrak Aerosol Monitor I/O Indoor to Outdoor ratio of concentration (particle number or mass) IA Indoor Air IAQ Indoor Air Quality ILAQH International Laboratory for Air Quality and Health LCC Lithgow Correctional Centre Max Maximum Min Minimum NT Philips Aerasense NanoTracer (NTs) NEPM National Environment Protection Council PN Particle number concentration OA Outdoor Air PM Particulate Matter PM2.5 Mass concentration of particles with an aerodynamic diameter smaller than
2.5 µm QUT Queensland University of Technology RH Relative Humidity [%] SA Supply Air SMPS Scanning Mobility Particle Sizer SD Standard Deviation T Temperature [ºC] TVOC Total Volatile Organic Compounds VOC Volatile organic compounds

6
1. EXECUTIVE SUMMARY
This project was conducted at Lithgow Correctional Centre (LCC), NSW, Australia. Air quality field measurements were conducted on two occasions (23-27 May 2012, and 3-8 December 2012), just before and six months after the introduction of smoke free buildings policies (28 May 2012) at the LCC, respectively. The main aims of this project were to: (1) investigate the indoor air quality; (2) quantify the level of exposure to environmental tobacco smoke (ETS); (3) identify the main indoor particle sources; (4) distinguish between PM2.5 / particle number from ETS, as opposed to other sources; and (5) provide recommendations for improving indoor air quality and/or minimising exposure at the LCC.
The measurements were conducted in Unit 5.2A, Unit 5.2B, Unit 1.1 and Unit 3.1, together with personal exposure measurements, based on the following parameters:
1. Indoor and outdoor particle number (PN) concentration in the size range 0.005-3 µm 2. Indoor and outdoor PM2.5 particle mass concentration 3. Indoor and outdoor VOC concentrations 4. Personal particle number exposure levels (in the size range 0.01-0.3 µm) 5. Indoor and outdoor CO and CO2 concentrations, temperature and relative humidity
In order to enhance the outcomes of this project, the indoor and outdoor particle number (PN) concentrations were measured by two additional instruments (CPC 3787) which were not listed in the original proposal. Summary of the Main Findings and Conclusions from the Study The following average PM2.5 and PN concentration levels covered all particle sources. 1. Outdoor particle concentration
Outdoor overall 24 hr average PM2.5 concentration: o was lower (about 30%) during the first round than the second round; o was lower than the advisory NEPM ambient air quality 24 hr standard (25 µg
m-3) for both rounds; o however, it can potentially exceed the advisory NEPM ambient air quality
annual standard (8 µg m-3).
Outdoor overall 24 hour average PN concentration: o was lower (about 30%) during the first round than the second round; and o was lower than the average worldwide urban ambient air concentration, as
reported in the literature (7.3 ×10³ particle cm-3) and was comparable with rural ambient air concentrations (4.8 ×10³ particle cm-3 ) (Morawska et al., 2008) for both rounds.
2. Indoor particle concentration
Indoor overall 24 hour average PM2.5 concentration: o for Unit1.1, the first round was higher (more than 100%) than the second
round; o for Unit 5.2A, the first round were lower (about 50%: 30% due to outdoor, 20%
due to indoor) than the second round; o for Unit 5.2B, the first round were lower (about 10 times) than the second
round; o indoor 71 µg m-3 in Unit 5.2B exceeded the advisory NEPM ambient air quality
24 hr standards (25 µg m-3) in the second round; and o for Unit 3.1, the indoor annual average PM2.5 concentrations can potentially
exceed the advisory NEPM ambient air quality annual standards (8 µg m-3). Indoor overall 24 hour average PN concentration:
o for both Unit 5.2A and Unit 5.2B was lower (about 3 times and 5 times) during the first round than the second round, respectively;

7
o was comparable with the overall average 24 hour concentration levels (3.7 ~ 4.8 ×10⁻³ p cm-3) in a mechanically ventilated building (He et al., 2011) during the first round (4.9 ~ 5.1 × 10⁻³ p cm-3); and
o was significantly higher than the concentration levels in a mechanically ventilated building during the second round (18.2 ~ 24.0 × 10⁻³ p cm-3).
4. Personal exposure levels
The average personal exposure concentration level: was significantly lower during the second round than the first round for rovers; for officers in Unit 5.2, was significantly higher during the second round than the first
round; and was slightly higher in Health centre during the second round than the first round,
which could be partially due to differences in the outdoor particle concentration levels between the two rounds.
5. Possible indoor particle sources
Smoking (during the first round), cooking, washing and cleaning activities. There were strong indoor particle sources in Unit 5.2B, in terms of both particle
number and particle mass, during the second round. 6. Indoor and Outdoor VOC concentration levels
The VOC measurement results showed that both indoor and outdoor nicotine concentration levels were below the detection limit (0.92µg m-3) of the methods used in this project. 7. General Conclusions
Outdoor average PM2.5 and PN concentrations during the first round were lower than those measured during the second round. Outdoor average PM2.5 was lower than the advisory NEPM ambient air quality 24 hr standard (25 µg m-3) for both rounds, however it can potentially exceed the advisory NEPM ambient air quality annual standard (8 µg m-3). Outdoor average PN concentrations were lower than the average urban ambient air concentration and comparable with rural ambient air concentrations.
Air exchange rates in each Unit were different between the two rounds, due to the different seasons. For example, in the summer, the ventilation systems were turned off.
After taking into consideration increased outdoor concentrations, the indoor concentrations in Unit 1.1 were still lower than outdoor levels during the second round. This implies that, in terms of PM2.5, the air quality in Unit 1.1 might have improved after the introduction of the smoke free buildings policies and the rovers' particle number exposure levels were also reduced.
There were strong indoor particle sources in Unit 5.2B during the second round. However, the absence of other visible or identifiable sources indicates that the particles originated from the activities of the Unit 5.2B inmates – most likely smoking. This indicates the need for more work to be done to ensure enforcement of the smoke free buildings policies.
8. Recommendations:
When the ventilation system is turned off in Unit 5.2, open the side door whenever possible during working hours.
Turn on the ceiling fan when staff feel that indoor concentrations are high or there is a distinct smell.
In the Unit offices, turn on the air conditioning when officers have concerns about indoor air quality.
The current smoking area outside the 'Industries Textiles' building is too close to the building itself and it would be better to relocate it further away from the building.

8
It would be better if vacuum cleaning activities in the 'Industries Textiles' building could be conducted after the inmates’ had finished their work.
Air exchange rate in the 'Officers’ Station, Industries ' needs to increase by turning on the air conditioning more regularly or increasing supply air.
In general, when NEPM ambient air quality standards are exceeded, for outdoors, this is outside the control of the LCC. However, for indoors, when it comes from indoor sources, increase the air exchange rate by turning on the ventilation system and ceiling fans or opening the side doors, when possible (such as in Unit 5.2). For other units, keep the windows in the kitchen rooms open.

9
2. PROJECT BACKGROUND AND AIM 1. Background Cigarette smoking is permitted for inmates in correctional centres because an inmate's cell is considered their home (rather than a public place), and it is also viewed as a passive management strategy. However, this practice is in conflict with providing a safe working environment for correctional centre staff, from air quality point view. Therefore, Corrective Services NSW (CSNSW) has requested an investigation into indoor air quality at the Lithgow Correctional Centre (LCC), for the purposes of conducting a human health risk assessment. In order to gain an understanding of existing indoor air quality in the facility, and to assess the exposure of correctional centre staff to environmental tobacco smoke (ETS), measurements of indoor air quality, including particulate matter, at the LCC were required. The results of this investigation are expected to be used by the LCC for air quality control and management. The main aims of the research project were to: (1) investigate the indoor air quality; (2) quantify the level of exposure to environmental tobacco smoke (ETS); (3) identify the main indoor particle sources; (4) distinguish between PM2.5 and particle number from ETS, as opposed to other sources; and (5) provide recommendations for improving indoor air quality and/or minimising particle exposure at the LCC.
10
3. OBJECTIVES OF THE PROJECT In order to monitor and quantify pollution levels, the specific objectives of the project were as follows: 1) Measure particulate pollutants and VOCs in Outdoor Air (OA) at the Unit 5.2 yard 2) Measure particulate pollutants and VOCs in Indoor Air (IA) in Unit 5.2, and Unit 1.1 and
Unit 3.1 (during the second round only) 3) Measure personal particle exposure levels for some staff 4) Compare the results with AQ guidelines, as well as other OA concentrations measured
around the world 5) Report the outcomes to the Corrective Services New South Wales These objectives are not identical to those outlined in the original proposal, due to the different circumstances that were encountered in the field. For example, following low participation rates by staff during the first round, Ms Ashleigh Cussen made a great effort to encourage staff to take part the personal particle exposure measurements during the second round. Therefore, the number of participants was significantly higher during the second round. APPROACH 1. About one week of air quality field measurements were conducted on two occasions (23-
27 May 2012, 3-8 December 2012), just before and six months after the introduction of smoke free buildings policies (28 May 2012) at the LCC, respectively.
2. The data were comprehensively analysed using statistical methods and conclusions were drawn in relation to the effect of the smoke free buildings policies on indoor air quality at the LCC.
STEPS TAKEN 1. Site visit to conduct a preliminary assessment of the LCC buildings and finalise the design
of the experimental part of the project.
2. Measurement of outdoor and indoor concentration levels of:
Particle number (< 3 µm);
PM2.5 (mass concentration of particles with an aerodynamic diameter < 2.5 µm); CO and CO2; and VOCs (including nicotine).
3. Measurement of personal particle number exposure levels.
4. Measurement of ventilation rate.
4. Data analysis and interpretation.
5. Preparation of a report detailing the findings, recommendations and conclusions.
11
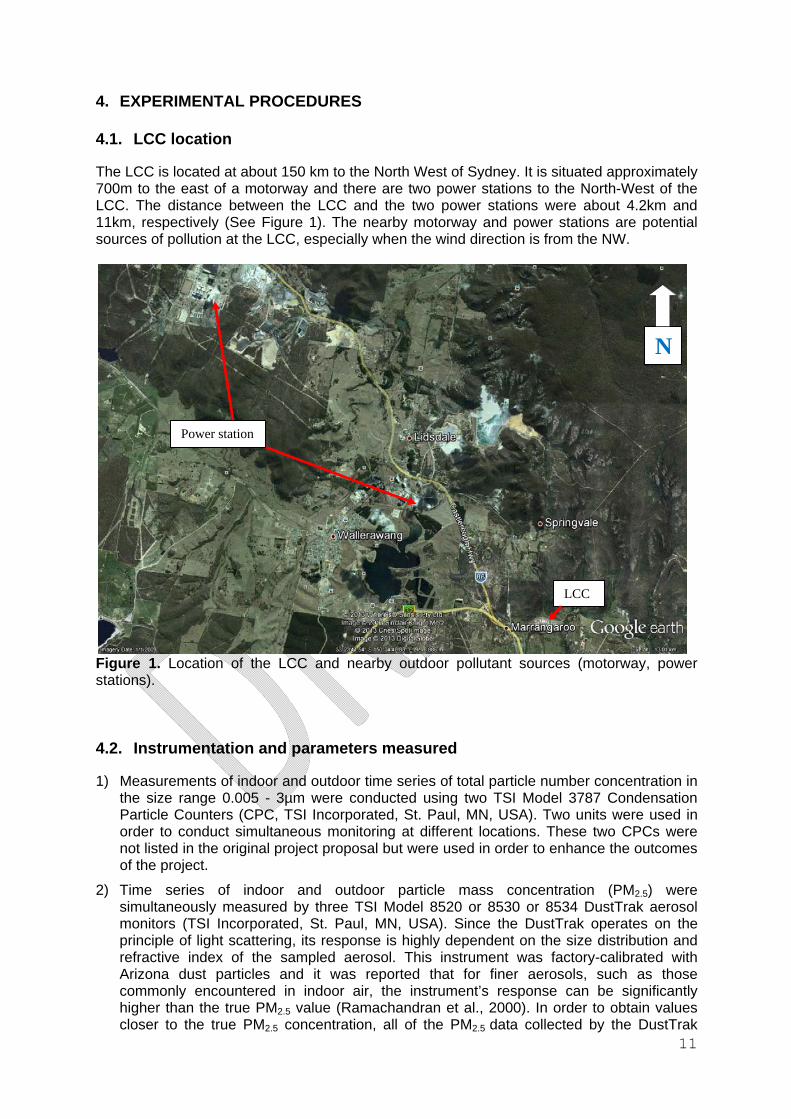
4. EXPERIMENTAL PROCEDURES 4.1. LCC location The LCC is located at about 150 km to the North West of Sydney. It is situated approximately 700m to the east of a motorway and there are two power stations to the North-West of the LCC. The distance between the LCC and the two power stations were about 4.2km and 11km, respectively (See Figure 1). The nearby motorway and power stations are potential sources of pollution at the LCC, especially when the wind direction is from the NW.
Figure 1. Location of the LCC and nearby outdoor pollutant sources (motorway, power stations).
4.2. Instrumentation and parameters measured 1) Measurements of indoor and outdoor time series of total particle number concentration in
the size range 0.005 - 3µm were conducted using two TSI Model 3787 Condensation Particle Counters (CPC, TSI Incorporated, St. Paul, MN, USA). Two units were used in order to conduct simultaneous monitoring at different locations. These two CPCs were not listed in the original project proposal but were used in order to enhance the outcomes of the project.
2) Time series of indoor and outdoor particle mass concentration (PM2.5) were simultaneously measured by three TSI Model 8520 or 8530 or 8534 DustTrak aerosol monitors (TSI Incorporated, St. Paul, MN, USA). Since the DustTrak operates on the principle of light scattering, its response is highly dependent on the size distribution and refractive index of the sampled aerosol. This instrument was factory-calibrated with Arizona dust particles and it was reported that for finer aerosols, such as those commonly encountered in indoor air, the instrument’s response can be significantly higher than the true PM2.5 value (Ramachandran et al., 2000). In order to obtain values closer to the true PM2.5 concentration, all of the PM2.5 data collected by the DustTrak
LCC
Power station
N

12
during this project were corrected by using the following equation, which has been previously reported in the literature by Morawska et al. (2003):
PM2.5 = 0.394 PM2.5(DustTrak) + 4.450 (1)
(with R2 = 0.83)
3) Four Philips Aerasense Nanotracers (NTs) measured the time series of total particle number concentrations in the size range 0.01 – 0.3 µm for different staff (personal particle exposure level measurements) or locations (indoor particle concentration levels).
4) Time series of indoor and outdoor CO, CO2, temperature and relative humidity were measured by three TSI Q-Traks (TSI 8554).
5) In order to determine air exchange rates, the velocity of supply air inside the rooms, as well as air at the ventilation system intakes, were measured by an Anemometer (TSI 9545), when possible.
6) Indoor and outdoor VOC samples were collected for the qualitative analysis of Volatile and Semivolatile Organic Compounds (VOC and SVOC), as well as nicotine. Active sampling was conducted on stainless steel desorption tubes that were filled with Tenax TA (Chrompack), using a Chematec FLEC pump which operated at 150 ml min-1, for 60 min. The tubes were cleaned by purging them with helium at 300°C for 1 h. The samples were subsequently analysed in the laboratory by a process which includes tube thermal desorption (300°C, 10 min; Perkin Elmer ATD 400) into a GC/MS system (Shimadzu QP2010). The compounds were separated on a HP-5 MS column (60 m x 0.25 mm, 0.25 µm). Initial qualitative analyses were based on a PBM library search, with mass spectra and retention data obtained from authentic compounds used to confirm the results. The detection limit of this method for nicotine was 0.92µg m-3.
All instruments were tested and calibrated in the laboratory before the field measurements were conducted, and comparative tests for all particle measurement instruments were conducted simultaneously during the last day of field measurements, as well as in laboratory. If the raw data needed to be corrected, the correction calculations were conducted before the data were included in the database. In this report, the results are presented based on the corrected NT, DustTrak and Q-Trak data. Details of the settings for each instrument are given in Appendix A. 4.3. Sampling locations and sampled air Particle characteristics of indoor and outdoor air were measured at various locations (see Figure 2), including:
(i) outdoors - Unit 5.2 yard; (ii) indoors - Unit 5.2A and Unit 5.2B; Unit 1.1 and Unit 3.1 (during the second round
only)
During the first round, the outdoor sampled air was delivered to the instruments via a 1 m long piece of conductive tubing, with an inner diameter of 6 mm. During the second round, the outdoor sampled air was delivered directly to the instruments.

13
Figure 2. Location of the sampling sites. NTs were used for three types of measurements:
(i) Personal particle exposure level, which was conducted for some staff members (prison officer, nurse) who each wore the NT for about 7 ~ 8 hours during their working hours;
(ii) Monitoring the particle concentration levels in the Health centre, L block and Unit 5.2 officers’ station for more than 24 hours; and
(iii) Investigations of short term particle concentration levels in the Industries. 4.4. Time of the measurements The field measurements were conducted on two occasions, from 23 May to 27 May 2012 and from 3 December to 8 December 2012, which were just before and six months after the introduction of smoke free buildings policies (28 May 2012) at the LCC, respectively. 4.5. Methodology for investigation of indoor particle sources Four methods were employed for the investigation of indoor particle source, including:
4. Analysis of long term (hours) average I/O ratios. If average indoor concentration levels were higher than outdoor levels, it meant that there were indoor sources. 5. Comparison of indoor and outdoor particle concentration time series data. If indoor concentration peaks occurred during a time period where there were no outdoor concentration peaks, it implied that there were indoor particle sources during that time period. 6. Combining indoor activities records with indoor and outdoor particle concentration time series data, so that indoor particle sources could be identified. 7. Field observations and testing.
Unit 5.2A
Unit 1.1
L Block
Health Centre
Unit 3.1
Industries
Unit 5.2B
14
4.6. Data processing and analysis The results from the particle measurements were grouped according to their outdoor and indoor location, along with the time period of the measurements, and the average concentrations were calculated as follows: 8. Based on real-time CPC, DustTrak and Q-Trak concentration data, total 24h average indoor and outdoor concentrations were calculated for each indoor location. 9. Based on real-time NT concentration data, average personal exposure levels were calculated for each staff member who wore the NT, as well as the total 24h average indoor concentrations, if the NT was located indoor for 24 hours. All statistical analyses (correlation, regression, t-test and One-Way ANOVA) were conducted using Excel or a statistical analysis software package – SPSS for Windows version 10 (SPSS Inc.). A level of significance of p = 0.05 was used for all statistical procedures. In addition, since there are currently no IAQ standards for particulate pollution levels in Australia, the ‘reference’ levels for IAQ were be based on:
(i) a comparison of the measured data with the results of other indoor and outdoor air quality assessments based on data presented in the literature;
(ii) the ambient air quality standards (NEPM Advisory Standards); and (iii) the WHO air quality guidelines for Europe (second edition, 2000).

15
5. RESULTS AND DISCUSSION 5.1. Meteorological Conditions The average and range of temperature and relative humidity for both measurement rounds are given in Table 1. All relevant information about the meteorological parameters is presented in Appendix B, from which it can be seen that the dominant wind direction for both rounds was NW, which was from the direction of the motorway and power stations. Meteorological conditions remained fairly constant throughout the two measurement periods, with the exception of rain on 25 May 2012.
Table 1. The average and range of temperature and relative humidity parameters in the first round and second round, based on Bureau of Meteorology data.
Temp. (ºC) Average Range
RH(%) Average Range
23-27/05/2012 8.3 6.3 - 12.1 66 45 - 8303-08/12/2012 17.7 12.6 - 24.3 44 34 - 63
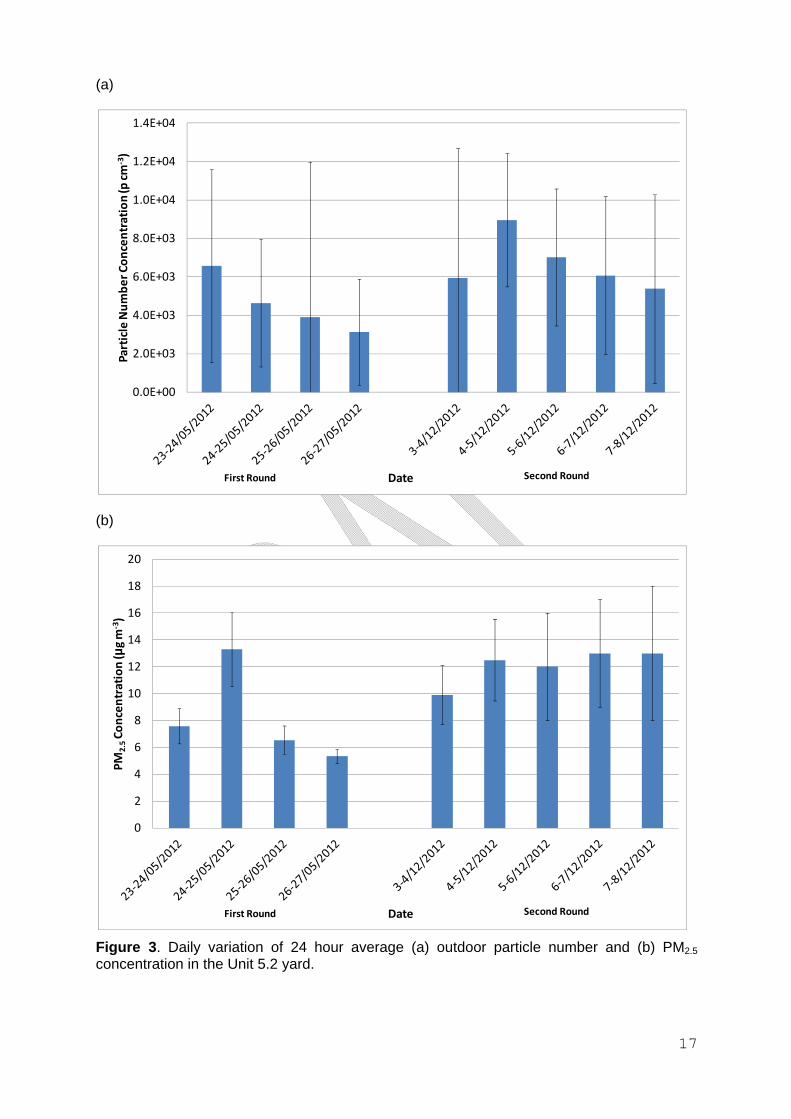
5.2. Outdoor Air 5.2.1. Average outdoor particle concentration The daily variation of 24 hour average outdoor particle number (PN) and PM2.5 concentrations for Unit 5.2 yard are presented in Figure 3. Comparison of overall 24 hour average outdoor particle number (PN) and PM2.5 concentrations are presented in Table 3. From Figure 3 and Table 2, it can be seen that daily 24 hr average PN concentrations varied between the days for both rounds, with an overall 24 hour average of (4.55 ± 1.47) × 10-3 and (6.67 ± 1.4) × 10-3 particles cm-3 for the first round and the second round, respectively. It can be seen from Table 2 that the daily 24 hr average PM2.5 concentrations also varied between the days for both rounds, with an overall 24 hour average of 8 ± 4 µg m-3 and 12 ± 1 µg m-3 for the first round and the second round, respectively. However, the daily 24 hour average PM2.5 concentrations showed less variation during the second round. In addition to our measurements, average 24 hour concentration data for PM2.5 were collected by the NSW EPA station at Richmond for both rounds, with a ratio of about 0.69 between the two rounds. This was very close to the ratio that was calculated based on the project results (0.68, see Table 2), which shows that, in general, average outdoor particle concentration levels in the first round were lower than those measured during the second round. Table 2. Comparison of overall 24 hour average outdoor particle concentrations (PM2.5 and particle number) in the first and second round, as well as ratios between the first and second round.
PM2.5 (µg m-3) First Second
F/S Ratio
PN (× 103 p cm-3) First Second
F/S Ratio
Average 8 12 0.68 4.55 6.67 0.68 S.D 4 1 1.47 1.40 Min 5 10 3.12 5.38 Max 13 13 6.56 8.95
Median 8 12 0.57 4.27 6.08 0.70 F/S: First round / Second round

16
Based on these data, the following can be concluded:
Outdoor overall 24 hr average PM2.5 concentration: o was lower (about 30%) during the first round than the second round; o was lower than the advisory NEPM ambient air quality 24 hr standard (25 µg m-3)
for both rounds; and o however, it can potentially exceed the advisory NEPM ambient air quality annual
standard (8 µg m-3).
Outdoor overall 24 hour average PN concentration: - was lower (about 30%) during first round than the second round; - was lower than the average worldwide urban ambient air concentration, as
reported in the literature (7.3 ×10³ particle cm-3) for both rounds and was comparable with rural ambient air concentrations (4.8 ×10³ particle cm-3) (Morawska et al., 2008).
These average PM2.5 and PN concentration levels covered all particle sources.
17
(a)
(b)
Figure 3. Daily variation of 24 hour average (a) outdoor particle number and (b) PM2.5 concentration in the Unit 5.2 yard.
0.0E+00
2.0E+03
4.0E+03
6.0E+03
8.0E+03
1.0E+04
1.2E+04
1.4E+04Particle Number Concentration (p
cm
‐3)
DateFirst Round Second Round
0
2
4
6
8
10
12
14
16
18
20
PM
2.5Concentration (µ
g m
‐3)
DateFirst Round Second Round

18
5.2.2. Diurnal variation of outdoor particle number and PM2.5 concentration Overall average diurnal variation of outdoor particle number and PM2.5 concentration in the first round and second round are shown in Figure 4 and 5, respectively. From Figure 4 and 5, it can be seen that:
The time series of outdoor particle number concentration showed different diurnal variation patterns between the two rounds. The two peaks (7:00-8:00 and 18:00-19:00) observed during the first round disappeared during the second round, which implies that there were different outdoor particle number sources between the two rounds.
Time series of outdoor PM2.5 concentration also showed different diurnal variation patterns between the two rounds. The two peaks (at about 6:00 and 17:00) in the second round were not observed during the first round and there were irregular diurnal variation patterns during both rounds. It supports the hypothesis that there were different outdoor particle mass sources between the two rounds.

19
Figure 4. Average diurnal variation of outdoor particle number concentration during the first (top) and second (bottom) round. Figure 5. Average diurnal variation of outdoor PM2.5 concentration during the first (top) and second (bottom) round. 5.3. Indoor Air 5.3.1. Average indoor PM2.5 concentration
Indoor PM2.5 concentrations were measured for more than 24 hours in four locations. A summary of overall average 24 hour indoor PM2.5 concentrations measured during the first and second round are given in Table 3.
Table 3. A summary of overall average 24 hour indoor PM2.5 concentrations (µg m-3) during the first and second round at four locations.
Unit 1.1 First Second
Unit 5.2A First Second
Unit 5.2B First Second
Unit 3.1 First Second
Average 17 7 8 13 6 71 N/A 22
S.D 3 2 0 1 1 43 N/A 14
Min 8 5 8 12 5 40 N/A 13
Max 34 8 8 14 66 101 N/A 38
Median 16 7 8 13 6 71 N/A 14
N/A: no data available
From Table 3 it can be seen that indoor overall 24 hour average PM2.5 concentration:
for Unit1.1, was higher (more than 100%) during the first round than the second round;
for Unit 5.2A and Unit 5.2B, was lower (about 50% and about 10 times) during the first round than the second round, respectively;
for Unit 5.2B, exceeded the advisory NEPM ambient air quality 24 hr standards (25 µg m-3) during the second round (71 µg m-3); and
for Unit 3.1, indoor annual average PM2.5 concentrations could potentially exceed the advisory NEPM ambient air quality annual standard (8 µg m-3).
The quality of the air we breathe affects our health. High concentrations of the major air pollutants are associated with respiratory problems such as coughs, bronchitis, asthma and, in severe cases, developmental problems in children, and even death. The economic

20
benefits from reducing air pollution include savings in health expenditure and fewer sick days by employees. Even small improvements in air quality can achieve benefits for human health and wellbeing (NEPM). Therefore, Therefore actions to reduce indoor sources are needed.
5.3.2. Average indoor PN concentration
Indoor particle number concentrations were measured for more than 48 hours in two locations. A summary of the overall average 24 hour indoor PN concentrations measured during the first and second round are given in Table 4.
Table 4. A summary of overall average 24 hour indoor PN concentrations (× 103 p cm-3) measured during the first and second round.
Unit 5.2A First Second
Unit 5.2B First Second
Average 5.13 18.2 4.88 24.0
S.D 0.66 3.34 1.56 2.13
Min 4.42 15.9 2.12 22.5
Max 5.72 20.6 13.5 25.5
Median 5.24 18.2 4.62 24.0
From Table 4 it can be seen that indoor overall 24 hour average PN concentration:
for both Unit 5.2A and Unit 5.2B, were lower (about 3 times and 5 times) during the first round than the second round, respectively;
were comparable with the overall average 24 hour concentration levels (3.7 ~ 4.8 ×10⁻³ p cm-3) in a typical mechanically ventilated building (He et al., 2011) during the first round (4.9 ~ 5.1 × 10⁻³ p cm-3); and
were significantly higher than the concentration levels in a typical mechanically ventilated building during the second round (18.2 ~ 24.0 × 10⁻³ p cm-3).
5.3.3. Diurnal variation of indoor PN and PM2.5 concentration For indoor PN diurnal variation:
in general, more regular variation patterns were observed in Unit 5.2A than in Unit 5.2B for both rounds;
in Unit 5.2A, similar variation patterns were observed for both rounds, with high concentration levels around noon (12:00); and
in Unit 5.2B, different variation patterns were observed during each round. For example, in addition to the noon peak, a second concentration peak was observed in the evening during the second round.
For indoor PM2.5 diurnal variation:
in general, there was no clear or regular variation pattern for both rounds and both indoor locations; and
in Unit 5.2B, there was a large concentration peak in evening during the second round (which was also the case for PN).
An example of diurnal variation in indoor particle number and PM2.5 concentrations is shown in Figure 6. Figure 6. Time series of indoor particle number and PM2.5 concentrations in Unit 5.2B on 7 and 8 December 2012.

21
5.4. Indoor and Outdoor Comparison
A summary of overall average 24 hour indoor and outdoor ratios of PM2.5 and PN concentrations during the first and second round at four locations is presented in Table 5.
Table 5. Summary of the overall average 24 hour indoor and outdoor ratios of PM2.5 and PN concentrations during the first and second round at four locations.
Unit 1.1 First Second
Unit 5.2A First Second
Unit 5.2B First Second
Unit 3.1 First Second
PM2.5 1.24 0.61 1.11 1.12 1.06 5.46 N/A 1.72
PN N/A N/A 1.02 2.45 1.57 4.18 N/A N/A
N/A: no data available
Indoor levels were higher than outdoor levels for both particle number and particle mass concentrations at the four locations, both before and after the introduction of the smoke free buildings policies, except for Unit 1.1 during the second round. Based on these ratios, it can be seen that indoor air quality:
1. in Unit 1.1 improved, from a particle mass point view, with a reduction in the impact of indoor generated particles;
2. in Unit 5.2A was unchanged, from a particle mass point view, but it decreased from particle number point of view;
3. in Unit 5.2B deteriorated and was clearly impacted by indoor generated particles, from both a particle mass and particle number point view; and
4. there were indoor particle sources in Unit 5.2A, Unit 5.2B and Unit 3.1, respectively.
An example of the comparison of indoor and outdoor particle number and PM2.5 concentrations in Unit 5.2B from 6-7 December 2012 is presented in Figure 7 and Figure 8, respectively.
Figure 7. Comparison of indoor and outdoor particle number concentrations in Unit 5.2 from 6-7 December 2012.
Figure 8. Comparison of indoor and outdoor PM2.5 concentrations in Unit 5.2 from 6-7 December 2012.

22
5.5. Personal exposure levels (particle number)
In total, there were 3 and 9 rovers (officer who took part in the personal exposure measurements) during the first and second round, respectively. A summary of average personal exposure levels (× 103 p cm-3) during the first and second round, for three types of staff members, is given in Table 6. With information relating to the Health Centre, this included the NTs worn by nurses out of the Health Centre during medication rounds of the accommodation units.
Table 6. Summary of average personal exposure levels (× 103 p cm-3) during the first and second round, for three types of staff members.
Rovers First Second
Officer in Unit 5.2 First Second
Health Centre First Second
Average 11.6 7.35 3.12 11.46 2.31 3.80 S.D 4.77 5.05 2.35 5.61 2.01 0.90 Min 8.10 1.37 0.41 7.49 0.18 3.17 Max 17.1 15.43 22.3 15.4 16.9 4.83 Median 9.72 4.66 2.33 11.5 1.74 3.40
Table 6 shows that average personal exposure level:
for rovers, was significantly lower during the second round than the first round; for officers in Unit 5.2 offices station, was significantly higher during the second
round than the first round; and in the Health centre, was higher during the second round than the first round, which
could be due to increases in the outdoor particle concentration level during the second round.
A summary of average rovers’ personal exposure levels (× 103 p cm-3) during the day (7am – 15:00pm) versus overnight (15:00pm – 7:00am) in the first and second round is given in Table 7.
Table 7. Summary of average rovers’ personal exposure levels (× 103 p cm-3) during the first and second round.
First Day Overnight
Second Day Overnight
Average 13.4 8.10* 10.6 4.16 S.D 5.18 9.10 3.14 Min 9.72 3.78 1.37 Max 17.1 27.9 9.22 Median 13.4 5.56 4.17
* There is only one average overnight data.
Based on the Table 7 results, there was a difference in exposure during the day versus overnight. In general, exposure during the day was higher than overnight. However, it should be noted that there was a big variation in exposure levels during both the daytime and overnight. The time series data of NT indicated that the average exposure level during the medication rounds was higher (more than two times) than in Health centre. An example of the difference between the particle exposure levels is given in the Figure 9.

23
Figure 9 Time series of PN concentrations measured by a NT. From the Figure 9, it can be seen that exposure levels during the medication round were significantly higher than those during other periods in the Health centre. The peaks during 10.00 -11.00am and 12:30pm - 13:00pm are likely to be due to cleaning activities and cooking activities, respectively. The time series data of NT also showed that the average exposure level during the smoking was significantly higher than background level. An example of the effect of smoking on the particle exposure levels is given in the Figure 10.
0.0E+0
5.0E+3
1.0E+4
1.5E+4
2.0E+4
2.5E+4
3.0E+4
5/12/ 7:12
5/12/ 7:48
5/12/ 8:24
5/12/ 9:00
5/12/ 9:36
5/12/ 10:12
5/12/ 10:48
5/12/ 11:24
5/12/ 12:00
5/12/ 12:36
5/12/ 13:12
5/12/ 13:48
5/12/ 14:24
5/12/ 15:00
5/12/ 15:36
5/12/ 16:12
5/12/ 16:48
5/12/ 17:24
5/12/ 18:00
5/12/ 18:36
5/12/ 19:12
5/12/ 19:48
5/12/ 20:24
5/12/ 21:00
5/12/ 21:36
5/12/ 22:12
5/12/ 22:48
5/12/ 23:24
6/12/ 0:00
6/12/ 0:36
6/12/ 1:12
6/12/ 1:48
6/12/ 2:24
6/12/ 3:00
6/12/ 3:36
6/12/ 4:12
PN concentration (p
cm
‐3)
Date & Time
Medication round for all Units
0.0E+0
5.0E+4
1.0E+5
1.5E+5
2.0E+5
2.5E+5
3.0E+5
3.5E+5
4.0E+5
6/12/ 7:26
6/12/ 7:40
6/12/ 7:55
6/12/ 8:09
6/12/ 8:24
6/12/ 8:38
6/12/ 8:52
6/12/ 9:07
6/12/ 9:21
6/12/ 9:36
6/12/ 9:50
6/12/ 10:04
6/12/ 10:19
6/12/ 10:33
6/12/ 10:48
6/12/ 11:02
6/12/ 11:16
6/12/ 11:31
6/12/ 11:45
6/12/ 12:00
6/12/ 12:14
6/12/ 12:28
6/12/ 12:43
PN concentration (p cm
‐3)
Date & Time
Smoking in Smoking area
Officers' Station, Lunch
Industries Reconditioners
Industries Reconditionersand smoking area
PSBU Bumpers' office
24
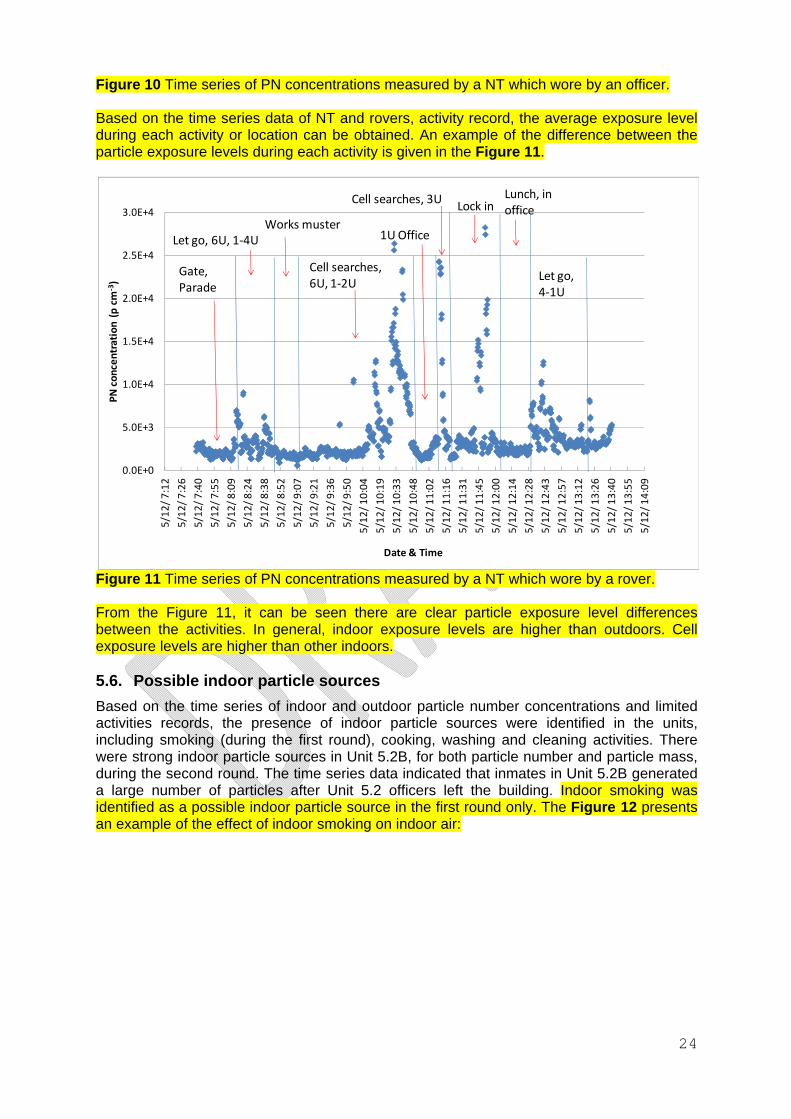
Figure 10 Time series of PN concentrations measured by a NT which wore by an officer. Based on the time series data of NT and rovers, activity record, the average exposure level during each activity or location can be obtained. An example of the difference between the particle exposure levels during each activity is given in the Figure 11.
Figure 11 Time series of PN concentrations measured by a NT which wore by a rover. From the Figure 11, it can be seen there are clear particle exposure level differences between the activities. In general, indoor exposure levels are higher than outdoors. Cell exposure levels are higher than other indoors. 5.6. Possible indoor particle sources
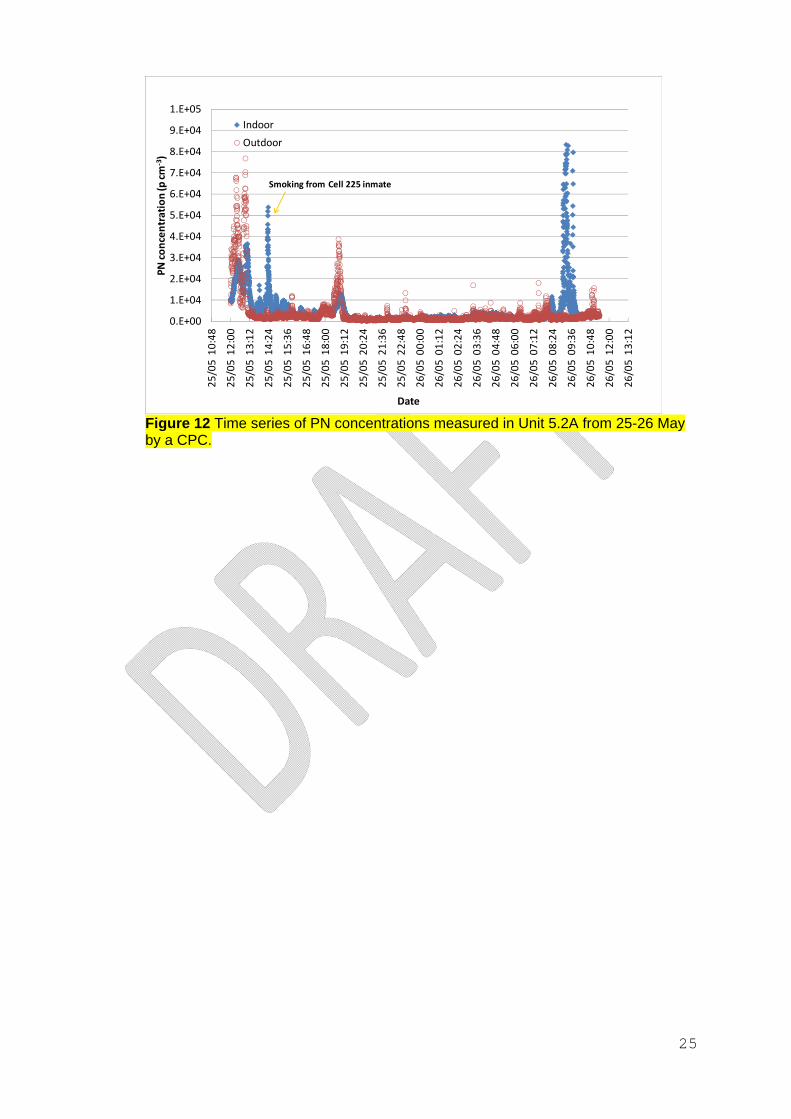
Based on the time series of indoor and outdoor particle number concentrations and limited activities records, the presence of indoor particle sources were identified in the units, including smoking (during the first round), cooking, washing and cleaning activities. There were strong indoor particle sources in Unit 5.2B, for both particle number and particle mass, during the second round. The time series data indicated that inmates in Unit 5.2B generated a large number of particles after Unit 5.2 officers left the building. Indoor smoking was identified as a possible indoor particle source in the first round only. The Figure 12 presents an example of the effect of indoor smoking on indoor air:
0.0E+0
5.0E+3
1.0E+4
1.5E+4
2.0E+4
2.5E+4
3.0E+4
5/12/ 7:12
5/12/ 7:26
5/12/ 7:40
5/12/ 7:55
5/12/ 8:09
5/12/ 8:24
5/12/ 8:38
5/12/ 8:52
5/12/ 9:07
5/12/ 9:21
5/12/ 9:36
5/12/ 9:50
5/12/ 10:04
5/12/ 10:19
5/12/ 10:33
5/12/ 10:48
5/12/ 11:02
5/12/ 11:16
5/12/ 11:31
5/12/ 11:45
5/12/ 12:00
5/12/ 12:14
5/12/ 12:28
5/12/ 12:43
5/12/ 12:57
5/12/ 13:12
5/12/ 13:26
5/12/ 13:40
5/12/ 13:55
5/12/ 14:09
PN concentration (p cm
‐3)
Date & Time
Gate,Parade
Let go, 6U, 1‐4UWorks muster
Cell searches, 3ULock in
Lunch, in office
Let go, 4‐1U
Cell searches,6U, 1‐2U
1U Office
25
Figure 12 Time series of PN concentrations measured in Unit 5.2A from 25-26 May by a CPC.
0.E+00
1.E+04
2.E+04
3.E+04
4.E+04
5.E+04
6.E+04
7.E+04
8.E+04
9.E+04
1.E+05
25/05 10:48
25/05 12:00
25/05 13:12
25/05 14:24
25/05 15:36
25/05 16:48
25/05 18:00
25/05 19:12
25/05 20:24
25/05 21:36
25/05 22:48
26/05 00:00
26/05 01:12
26/05 02:24
26/05 03:36
26/05 04:48
26/05 06:00
26/05 07:12
26/05 08:24
26/05 09:36
26/05 10:48
26/05 12:00
26/05 13:12
PN concentration (p
cm
‐3)
Date
Indoor
Outdoor
Smoking from Cell 225 inmate

26
5.7. Indoor and Outdoor VOC, CO and CO2 concentration levels 5.7.1. Average VOC concentration levels
In total, 12 (9 indoor and 3 outdoor) and 25 (19 indoor and 6 outdoor) VOC samples were collected during the first and second rounds, respectively. The outdoor sampling location was the Unit 5.2 yard and there were seven indoor locations, namely Unit 5.2A, Unit 5.2B, Unit 3.1 (second round only), Unit 1.1, Health Centre (second round only), Industries Textiles area (second round only) and Unit 5.2 officers’ station (first round only). About 50 VOC compounds were identified during the measurements and three of the four BTEX were identified and quantified. BTEX refers to the chemicals Benzene, Toluene, Ethylbenzene and Xylene. The primary man-made sources of BTEX compounds are from motor vehicle and aircraft emissions, and cigarette smoke. BTEX compounds are also created and used during the processing of petroleum products and during the production of consumer goods such as paints and lacquers, thinners, rubber products, adhesives, inks, cosmetics and pharmaceutical products. Average TVOC, Benzene, Toluene and Xylene concentrations measured during the first and second round are given in Figures 13 -16, respectively. More detail of this comparison is given in Appendix C. The VOC measurement results showed that:
for both indoor and outdoor TVOC, Toluene and Xylene concentration levels in the second round were higher than those in the first round;
in general, outdoor VOC concentration levels were higher than indoor levels, except for Xylene during the first round (the ratios for which are given in Table 8); and
both indoor and outdoor nicotine concentration levels were below the detection limit (0.92µg m-3) of the methods used in this project.
Table 8. Summary of indoor and outdoor ratios of TVOC, Toluene and Xylene concentration.
TVOC (µg m-3)
Benzene (ppb)
Toluene (ppb)
Xylene (ppb)
First round 0.86 0.85 0.74 1.36 Second round 0.84 0.75 0.88 0.57

27
Figure 13. Average TVOC concentrations during the first and second round at different locations.
Figure 14. Average Benzene concentrations during the first and second round at different locations.
0
50
100
150
200
250
300
Outdoor
Unit 5.2A
Unit 5.2B
Unit 1.1
Unit 3.1
Clinic centre
Workshop
Unit 5.2 Office
TVOC concentration (
µg
m-3
)
Sampling Location
First round
Second Round
0.00
0.50
1.00
1.50
2.00
2.50
3.00
3.50
4.00
4.50
5.00
Outdoor
Unit 5.2A
Unit 5.2B
Unit 1.1
Unit 3.1
Clinic centre
Workshop
Unit 5.2 Office
Benzene concentration (ppb)
Sampling Location
First round
Second Round

28
Figure 15. Average Toluene concentrations during the first and second round at different locations.
Figure 16. Average Xylene concentrations during the first and second round at different locations. Apart from BTEX chemicals, there are other chemicals also related to EST, however they can also be generated by other sources. Therefore, they can not be used to identify ETS. In addition, these 50 VOC compounds are not the only chemicals related to EST. Actually, EST
0.00
5.00
10.00
15.00
20.00
25.00
Outdoor
Unit 5.2A
Unit 5.2B
Unit 1.1
Unit 3.1
Clinic centre
Workshop
Unit 5.2 Office
Toluene concentration (ppb)
Sampling Location
First round
Second Round
0.00
0.05
0.10
0.15
0.20
0.25
0.30
0.35
Outdoor
Unit 5.2A
Unit 5.2B
Unit 1.1
Unit 3.1
Clinic centre
Workshop
Unit 5.2 Office
Xylene concentration (ppb)
Sampling Location
First round
Second Round
29
contains hundreds of VOCs and most of them have various sources in the ambient atmosphere. However, BTEX were the only VOCs detected in the samples and are listed as 'Air Toxics' by the National Environment Protection Council (known as the ‘Air Toxics NEPM’). BTEX is an important indication of air quality in regard to VOC, but it is not an exclusive indication of ETS, since it may also come from other sources, such as engine emissions and solvent use. Also, different sources may exist for individual BTEX chemicals and therefore, it is not unusual to observe inconsistent trends for individual BTEX chemicals. Although it is clear that the TVOC and BTEX chemicals are toxic and have adverse health effects on exposed people, unfortunately there are no standards that quantify safe levels of exposure to these chemicals in Australia. The “Air Toxics NEPM” uses the term “monitoring investigation levels”, which means that if these levels are exceeded, then further investigation may be appropriate, but exceedance does not indicate that adverse health effects will occur. 5.7.2. Average CO and CO2 concentration levels Both overall 8hr indoor and outdoor CO concentration levels were lower than 1 ppm and significantly lower than the advisory NEPM ambient air quality 8 hr standard (9 ppm) for both rounds. Indoor overall CO2 concentration level was higher than outdoor level and less than 400ppm.
30
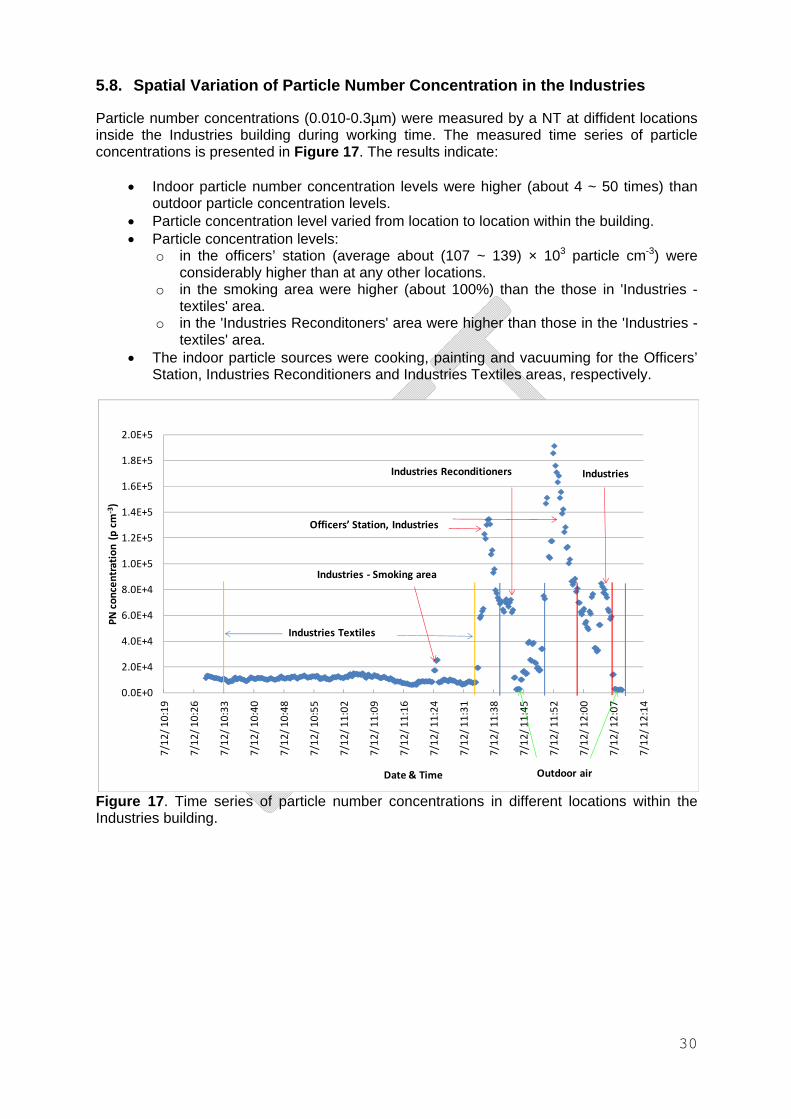
5.8. Spatial Variation of Particle Number Concentration in the Industries Particle number concentrations (0.010-0.3µm) were measured by a NT at diffident locations inside the Industries building during working time. The measured time series of particle concentrations is presented in Figure 17. The results indicate:
Indoor particle number concentration levels were higher (about 4 ~ 50 times) than outdoor particle concentration levels.
Particle concentration level varied from location to location within the building. Particle concentration levels:
o in the officers’ station (average about (107 ~ 139) × 103 particle cm-3) were considerably higher than at any other locations.
o in the smoking area were higher (about 100%) than the those in 'Industries -textiles' area.
o in the 'Industries Reconditoners' area were higher than those in the 'Industries -textiles' area.
The indoor particle sources were cooking, painting and vacuuming for the Officers’ Station, Industries Reconditioners and Industries Textiles areas, respectively.
Figure 17. Time series of particle number concentrations in different locations within the Industries building.
0.0E+0
2.0E+4
4.0E+4
6.0E+4
8.0E+4
1.0E+5
1.2E+5
1.4E+5
1.6E+5
1.8E+5
2.0E+5
7/12/ 10:19
7/12/ 10:26
7/12/ 10:33
7/12/ 10:40
7/12/ 10:48
7/12/ 10:55
7/12/ 11:02
7/12/ 11:09
7/12/ 11:16
7/12/ 11:24
7/12/ 11:31
7/12/ 11:38
7/12/ 11:45
7/12/ 11:52
7/12/ 12:00
7/12/ 12:07
7/12/ 12:14
PN concentration (p cm
‐3)
Date & Time
Industries Textiles
Industries ‐ Smoking area
Officers’ Station, Industries
Industries Reconditioners
Outdoor air
Industries

31
5.9. Difference in Ventilation between the First and Second Round The first and second rounds were conducted during the winter and summer, respectively. During winter, the mechanical ventilation systems were turned on in all of the Units, however they were turned off during the summer. Therefore, the air exchange rates in these units was expected to be different between the two rounds. 5.10. Discussions
From an air quality measurement point view, Unit 5.2 may not have been the best location for the main indoor measurements, since the number of inmates was relatively low (about 5 - 6 in Unit 5.2A and 3 - 4 in Unit 5.2B) during the first round and therefore, the Unit 5.2 inmates generated much lower particle levels than inmates in the other Units. This can be seen from Table 3 for PM2.5 concentration levels and Table 5 for I/O ratios. However, the number of inmates in Unit 5.2 during the second round (about 8 - 10 in Unit 5.2A and 10 - 12 in Unit 5.2B) were significantly higher than those during the first round. This significant difference in inmate numbers between the two rounds made the comparison of concentration levels between the two rounds more complex. In hindsight, Unit 2.2 and Unit 3.1 may have been better locations for the main indoor measurements, if inmate numbers were relatively stable between the two rounds.
It would have been better if the two rounds were conducted during the same season, be it winter or summer, since ventilation systems at the LCC operated in a completely different during the summer and winter months.
Fisher and Matthews conducted an investigation into ETS at the LCC from 23-24 September 2009 using a TSI DustTrak 8520 to measure indoor PM2.5 concentrations in Unit 1. Based on a comparison of the time series of indoor PM2.5 concentrations reported in Figure 6 (for Unit 5.2B during the second round) with the figure reported by Fisher and Matthews (for Unit 1), it can be seen that there was good agreement between the two diurnal variation patterns. This implies that the inmates’ indoor particle generation activity patterns in the two Units were very similar for the two measurement periods and therefore, it is likely that the inmates in Unit 5.2B were smoking during the second round measurements conducted for this project, which was after the introduction of smoke free buildings policies.
Chapter 8 (Indoor Air Pollutants) of the WHO Air Quality Guidelines for Europe (second edition, 2000) includes the following paragraph on environmental tobacco smoke (ETS):
32
"Populations at special risk for the adverse health effects of ETS are young children and infants, asthmatics, and adults with other risk factors for cardiovascular disease. Levels of exposure where these effects have been observed are indicated by nicotine levels of 1–10 μg/m3 (nicotine has been demonstrated to be a reliable marker of ETS levels)." Mr Gary Rhyder conducted another ETS investigation at the LCC in 2009 by taking two air samples (of 318 and 303 minutes duration, respectively) and analysing the average nicotine concentration levels. He reported that average nicotine concentration levels were <0.06 µg m-3 and 1.7 µg m-3, respectively. In fact, the second value of 1.7 µg m-3 should be 0.17 µg m-3 based on the reported raw data (0.05/(303×0.99)×1000=0.17 µg m-3). In the current project, both indoor and outdoor nicotine concentration levels were below the detected limit (0.92 µg m-3) of the methods used, however these results are comparable with the previous values and they confirm that the average nicotine concentration levels at the LCC were below 1 µg m-3.
6. OVERALL CONCLUSION Average outdoor particle concentration levels were found to be in general typical for the environment investigated. However, average indoor particle concentration levels in some locations were higher than typical or exceed the NEPM standard. Nicotine concentration levels were below 0.92 µg m-3 (the detection limit of the methods). The nature of the project was more complex than other indoor air quality studies since it was conducted in a very specific environment. Due to these complexities, the measurements were not always conducted according to ideal designs. Despite of this, the data showed some clear trends and possible reduction of particle concentrations in some units after the introducing smoke free buildings policies, however, there was a strong deterioration in other units, which may point out to the need for a better enforcement of the smoke free buildings policies.

33
Acknowledgments
We would like to thank Ms Ashleigh Cussen for her great help during the field measurements, especially in finding and co-ordinating volunteers for the personal exposure measurements. The assistance of officers from the LCC, especially those that participated in personal exposure measurements, is gratefully acknowledged. Members from ILAQH, in particular Chantal Labbe and Rachael Appleby, are thanked for their assistance with this project. We would also like to thank Prof Boguang Wang from the Department of Environmental Engineering at Jinan University, P.R China, for his assistance in relation to the VOC analysis aspects of the project.
References
Morawska, L ; Ristovski, Z; Jayaratne, ER; Keogh, DU; Ling, X (2008) Ambient nano and ultrafine particles from motor vehicle emissions: Characteristics, ambient processing and implications on human exposure. Atmospheric Environment, 42: 35, 8113-8138.
He, C; Morawska, L; Tran Q; McGarry, P. (2011) The Effect of indoor and outdoor particle sources on indoor air quality of a new multilevel office building in the vicinity of a busway. Proceeding of the12th International Conference on Indoor Air Quality and Climate, Austin, USA.
Rhyder Gary (2009) Cigarette smoke exposure Lighgow Correctional Centre
Fisher, G and Matthews, W (2009) Report on environmental tobacco smoke investigation for Lighgow Correctional Centre.

34
Appendix A: Instrument Settings with photos WCPC 3787 flow 0.6 L/min sample time: 20s in the first round and 10s in the second round for outdoor air; 10s for indoor air DustTrak inlet nozzle PM2.5 logging interval 30 s for outdoor air logging interval 10s for indoor air time constant 1s Q-Trak logging interval 30 s for both indoor and outdoor NanoTraser advanced model: sample time -16s
CPC 3787
DustTrak
Q-Trak

35
NanoTraser
VOC sampling

36
Appendix B: Lithgow meteorology data during the measurement at LCC
Date
Day
Temps Rain Evap Sun
Max wind gust
9 am 3 pm
Min Max Dir Spd Time Temp RH Cld Dir Spd MSLP Temp RH Cld Dir Spd MSLP
°C °C mm mm hours km/h local °C % 8th km/h hPa °C % 8th km/h hPa
May 23 We 2.8 15.7 0 9.2 54 0 NW 17 14.9 36 0 NW 11
24 Th -0.2 12.5 0 6.2 76 6 NW 4 10.9 90 8 N 13
25 Fr 6.4 10.1 27.6 7.0 61 7 NW 26 7.7 54 7 NW 37
26 Sa 4.0 9.0 0.4 4.8 68 8 W 28 7.5 75 8 W 15
27 Su 0.8 11.9 0 6.0 80 4 Calm 9.0 66 7 SW 11
December
3 Mo 14.0 27.6 1.0 14.6 94 8 Calm 25.9 34 5 W 37 3
4 Tu 11.7 20.8 0 13.4 60 0 WNW 46 19.9 20 1 WNW 41
5 We 6.4 17.7 0 10.2 44 1 W 52 14.9 37 3 W 37
6 Th 2.4 23.3 0 11.4 49 1 Calm 22.2 18 1 SW 7
7 Fr 8.8 20.8 0 12.4 76 8 NNW 9 18.9 49 8 N 9
8 Sa 7.4 27.9 0 16.9 72 1 Calm 27.3 23 6 WNW 15
37
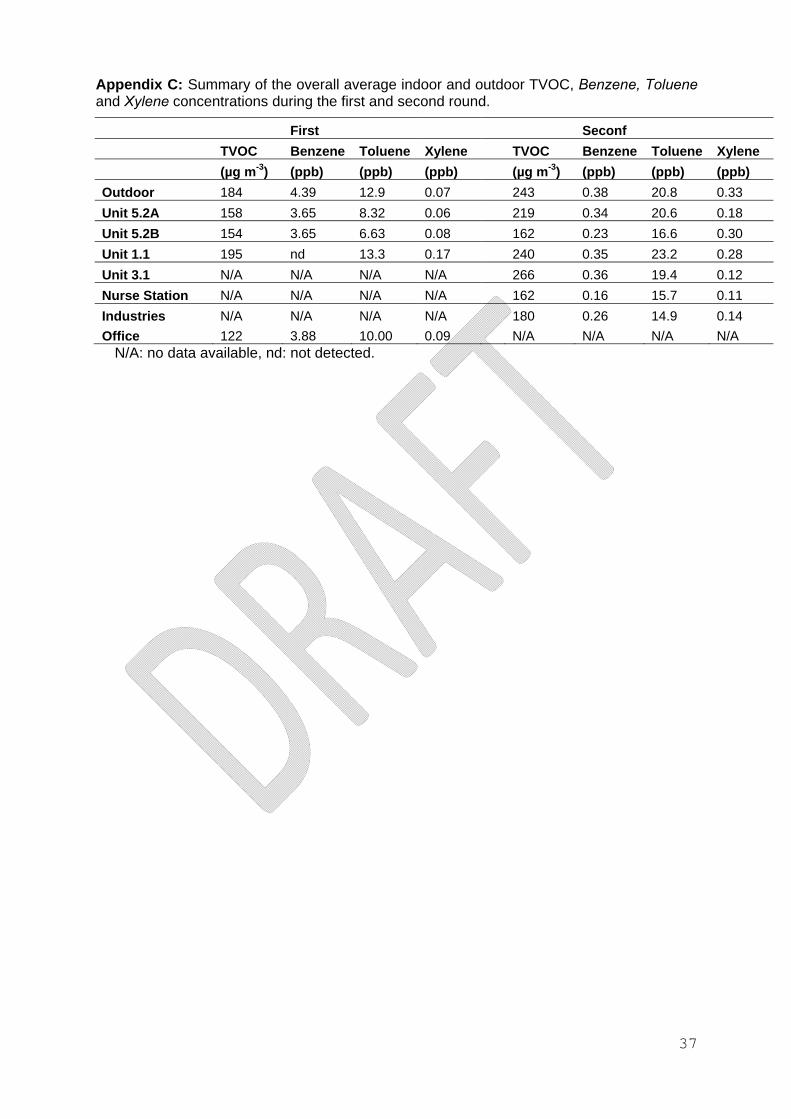
Appendix C: Summary of the overall average indoor and outdoor TVOC, Benzene, Toluene and Xylene concentrations during the first and second round.
First Seconf
TVOC Benzene Toluene Xylene TVOC Benzene Toluene Xylene
(µg m-3) (ppb) (ppb) (ppb) (µg m-3) (ppb) (ppb) (ppb)
Outdoor 184 4.39 12.9 0.07 243 0.38 20.8 0.33
Unit 5.2A 158 3.65 8.32 0.06 219 0.34 20.6 0.18
Unit 5.2B 154 3.65 6.63 0.08 162 0.23 16.6 0.30
Unit 1.1 195 nd 13.3 0.17 240 0.35 23.2 0.28
Unit 3.1 N/A N/A N/A N/A 266 0.36 19.4 0.12
Nurse Station N/A N/A N/A N/A 162 0.16 15.7 0.11
Industries N/A N/A N/A N/A 180 0.26 14.9 0.14
Office 122 3.88 10.00 0.09 N/A N/A N/A N/A N/A: no data available, nd: not detected.