Embed Size (px)
Citation preview

PNNL-15141
Investigation of Accelerated Casing Corrosion in Two Wells at Waste Management Area A-AX C. F. Brown M. J. Lindberg R. J. Serne K. N. Geiszler H. T. Schaef S. R. Baum B. A. Williams I. V. Kutnyakov M. M. Valenta T. S. Vickerman V. L. LeGore R. E. Clayton August 2005 Prepared for CH2M HILL Hanford Group, Inc. and the U.S. Department of Energy under Contract DE-AC05-76RL01830

DISCLAIMER This report was prepared as an account of work sponsored by an agency of the United States Government. Neither the United States Government nor any agency thereof, nor Battelle Memorial Institute, nor any of their employees, makes any warranty, express or implied, or assumes any legal liability or responsibility for the accuracy, completeness, or usefulness of any information, apparatus, product, or process disclosed, or represents that its use would not infringe privately owned rights. Reference herein to any specific commercial product, process, or service by trade name, trademark, manufacturer, or otherwise does not necessarily constitute or imply its endorsement, recommendation, or favoring by the United States Government or any agency thereof, or Battelle Memorial Institute. The views and opinions of authors expressed herein do not necessarily state or reflect those of the United States Government or any agency thereof.
PACIFIC NORTHWEST NATIONAL LABORATORY operated by BATTELLE
for the UNITED STATES DEPARTMENT OF ENERGY
under Contract DE-AC05-76RL01830
Printed in the United States of America
Available to DOE and DOE contractors from the Office of Scientific and Technical Information,
P.O. Box 62, Oak Ridge, TN 37831-0062; ph: (865) 576-8401 fax: (865) 576-5728
email: [email protected]
Available to the public from the National Technical Information Service, U.S. Department of Commerce, 5285 Port Royal Rd., Springfield, VA 22161
ph: (800) 553-6847 fax: (703) 605-6900
email: [email protected] online ordering: http://www.ntis.gov/ordering.htm
This document was printed on recycled paper. (09/04)

PNNL-15141
Investigation of Accelerated Casing Corrosion in Two Wells at Waste Management Area A-AX C. F. Brown M. J. Lindberg R. J. Serne K. N. Geiszler H. T. Schaef S. R. Baum B. A. Williams I. V. Kutnyakov M. M. Valenta T. S. Vickerman V. L. LeGore R. E. Clayton August 2005 Prepared for CH2M HILL Hanford Group, Inc. and the U.S. Department of Energy under Contract DE-AC05-76RL01830 Pacific Northwest National Laboratory Richland, Washington 99352

iii
Executive Summary
An overall goal of the Groundwater Performance Assessment Project, led by Pacific Northwest National Laboratory (PNNL) and per guidance in DOE Order 5400.1, includes characterizing and defining trends in the physical, chemical, and biological condition of the environment. To meet these goals, numerous Resource Conservation and Recovery Act (RCRA) monitoring wells have been installed throughout the Hanford Site. In 2003, it was determined that two RCRA monitoring wells (299-E24-19 and 299-E25-46) in Waste Management Area (WMA) A-AX failed due to rapid corrosion of the stainless steel casing over a significant length of the wells. Complete casing corrosion occurred between 276.6 and 277.7 feet below ground surface (bgs) in well 299-E24-19 and from 274.4 to 278.6 feet bgs in well 299-E25-46. CH2M HILL Hanford Group, Inc., asked scientists from PNNL to perform detailed analyses of vadose zone sediment samples collected in the vicinity of the WMA A-AX from depths comparable to those where the rapid corrosion occurred in hopes of ascertaining the cause of the rapid corrosion.
This report contains the geochemical and selected physical characterization data collected on (1) archived vadose zone sediment recovered during the early 1990s installation of four RCRA monitoring wells 299-E24-19, 299-E24-20, 299-E24-22, and 299-E25-46; (2) a sample of bentonite material; (3) sidewall core samples collected during the decommissioning (in 2004) of wells 299-E24-19 and 299-E25-46; (4) splitspoon core samples collected during the installation (in 2004) of two RCRA monitoring wells 299-E24-33 and 299-E25-95; and (5) a perched water sample collected during the installation of well 299-E24-33. Laboratory tests were conducted to characterize the sediment and to identify water-leachable constituents. The laboratory tests provided the following conclusions regarding the cause of rapid corrosion:
1. Archived Samples – Because of sample preservation problems, the moisture content of samples was artificially low and resulted in an exaggeration of the true chloride concentration. Therefore, it is unlikely that any of the archived sediment samples tested could generate porewaters with a sufficient chloride content to initiate corrosion of the well casing.
2. Bentonite Material – The bentonite sample had considerably high water-extractable concentrations of sodium, chloride, fluoride, sulfate, and alkalinity (measured as calcium carbonate). Interpretation of the laboratory data indicated that the Wyoming bentonite test sample was capable of generating localized vadose zone porewater with chloride concentrations in excess of 700 mg/L. However, the vadose zone at the Hanford Site is primarily composed of coarse-grained sands with an in situ moisture content ranging from 5 to 12%. Therefore, it is doubtful enough moisture will be available throughout the majority of the vadose zone to sufficiently “wet” the bentonite and leach chloride from the material. Consequently, Wyoming bentonite material should be suitable as an annulus filling agent in all low-moisture zones and those regions that lack the potential to accumulate perched water.
3. Sidewall Core Samples – Findings from analysis of these samples demonstrate that the vadose zone chemistry in the vicinity of the two failed wells has been affected or compromised by a Hanford Site waste stream. Clearly, the sidewall core samples tested were capable of generating porewaters with sufficient chloride concentrations to cause corrosion of the stainless steel well casing. Furthermore, analysis of the sidewall core samples yielded a clear

iv
relationship between chloride concentration and well casing corrosion. It is likely that chloride leached from the bentonite material and/or chloride carried as a constituent of the liquid waste stream caused the advanced well casing corrosion found at wells 299-E24-19 and 299-E25-46 via crevice corrosion and stress corrosion cracking.
4. Splitspoon Core Samples – Samples were collected during the recent installation of two RCRA monitoring wells and were characterized to assess the current vadose zone geochemical conditions in WMA A-AX. Analysis of these samples showed that common Hanford sediment constituents were present at concentrations typically observed in uncontaminated vadose zone sediments. The dissolved chloride concentrations in the samples makes it doubtful that they could lead to the advanced corrosion found in wells 299-E24-19 and 299-E25-46.
5. Perched Water Sample – The results support the assessment that the archived sediment samples were compromised via moisture loss during storage and, therefore, are not suitable for estimating the true porewater concentration of chemical constituents.
Based on the findings of this study, we recommend using Portland cement as an annulus sealing agent in groundwater monitoring wells in zones with high moisture contents or that have the potential to accumulate perched water.
v
Acknowledgments
This work was made possible through funding from CH2M HILL Hanford Group, Inc. The authors would like to specifically acknowledge David A. Myers from CH2M HILL Hanford Group, Inc. for flagging this issue, providing the funding, and for the foresight and determination to understand the chemistry associated with the well casing failure in Waste Management Area A-AX. The authors would also like to thank Russ Jones from Pacific Northwest National Laboratory and Mo Anantatmula from CH2M HILL Hanford Group, Inc. for their expertise and guidance to literature on the corrosion of stainless steel.

vii
Acronyms and Abbreviations
ASA American Society of Agronomy ASTM American Society for Testing and Materials bgs below ground surface DOE U.S. Department of Energy EC electrical conductivity EPA U.S. Environmental Protection Agency ICDD International Center for Diffraction Data (ICDD) ICP-OES inductively coupled plasma-optical emission spectrometer JCPDS Joint Committee on Powder Diffraction Standards PDF powder diffraction files PNNL Pacific Northwest National Laboratory RCRA Resource Conservation and Recovery Act USGS U.S. Geological Survey WMA Waste Management Area XRD x-ray diffraction

ix
Contents
Executive Summary ........................................................................................................................... iii
Acknowledgments.............................................................................................................................. v
Abbreviations and Acronyms ............................................................................................................ vii
1.0 Introduction ............................................................................................................................... 1.1 1.1 Well Construction ............................................................................................................. 1.1 1.2 Type 304L Stainless Steel Specifications ......................................................................... 1.3 1.3 The Effect of Chloride on Corrosion................................................................................. 1.3 1.4 Scope ................................................................................................................................. 1.3
2.0 Geochemical Methods and Materials ........................................................................................ 2.1 2.1 Sample Inventory .............................................................................................................. 2.1
2.1.1 Archived Sediment Samples .................................................................................. 2.1 2.1.2 Bentonite Material.................................................................................................. 2.1 2.1.3 Sidewall Core Samples........................................................................................... 2.4 2.1.4 Splitspoon Core Samples ....................................................................................... 2.4 2.1.5 Perched Water Sample ........................................................................................... 2.4
2.2 Approach ........................................................................................................................... 2.4 2.3 Materials and Methods ...................................................................................................... 2.8
2.3.1 Moisture Content.................................................................................................... 2.8 2.3.2 X-ray Diffraction.................................................................................................... 2.8 2.3.3 1:1 Sediment:Water Extracts.................................................................................. 2.8 2.3.4 pH and Conductivity .............................................................................................. 2.9 2.3.5 Anions .................................................................................................................... 2.9 2.3.6 Cations and Technetium-99 ................................................................................... 2.9 2.3.7 Alkalinity................................................................................................................ 2.9 2.3.8 Carbon Content ...................................................................................................... 2.9 2.3.9 8 M Nitric Acid Extract.......................................................................................... 2.10
3.0 Results and Discussion .............................................................................................................. 3.1 3.1 Moisture Content............................................................................................................... 3.1 3.2 Mineralogy ........................................................................................................................ 3.3 3.3 Sediment:Water Extracts................................................................................................... 3.7
3.3.1 pH and Electrical Conductivity .............................................................................. 3.7 3.3.2 Water Extract Composition of the Sediment:Water Extracts................................. 3.10 3.3.3 Derivation of Vadose Zone Porewater Chloride Concentration............................. 3.15
3.4 Carbon Analysis ................................................................................................................ 3.18 3.5 8 M Nitric Acid-Extractable Amounts of Selected Elements in Archived Vadose
Zone and Sidewall Core Sediments .................................................................................. 3.18 3.6 Technetium-99 Analysis of Sidewall Core Samples ......................................................... 3.20

x
4.0 Summary and Conclusions ........................................................................................................ 4.1 4.1 Archived Sediment Samples ............................................................................................. 4.1 4.2 Bentonite Material............................................................................................................. 4.1 4.3 Sidewall Core Samples...................................................................................................... 4.1 4.4 Splitspoon Core Samples .................................................................................................. 4.2 4.5 Perched Water Sample ...................................................................................................... 4.2
5.0 Recommendations ..................................................................................................................... 5.1
6.0 References ................................................................................................................................. 6.1

xi
Figures
1.1 Well Location at Waste Management Area A-AX.................................................................... 1.2 2.1 Archived Sediment Samples from Well 299-E24-19 ................................................................ 2.2 2.2 Archived Sediment Samples from Well 299-E24-20 ................................................................ 2.2 2.3 Archived Sediment Samples from Well 299-E24-22 ................................................................ 2.3 2.4 Archived Sediment Samples from Well 299-E25-46 ................................................................ 2.3 2.5 Sidewall Core Samples from Well 299-E24-19 ........................................................................ 2.5 2.6 Sidewall Core Samples from Well 299-E25-46 ........................................................................ 2.5 2.7 Select Core Samples: 299-E24-33-255.5, 299-E24-33-256.5, and 299-E24-33-257.5 ............ 2.6 2.8 Select Core Samples: 299-E25-94-270, 299-E25-94-271, and 299-E25-94-273.5 .................. 2.7 3.1 XRD Patterns for Sediment Samples Collected during Installation of RCRA
Well 299-E25-46 with Matching PDF Files .............................................................................. 3.4 3.2 XRD Patterns for Sidewall Core Samples Collected during Decommissioning of
RCRA Well 299-E25-46 with Matching PDF Files .................................................................. 3.5 3.3 Low Angle 2θ XRD Patterns Showing the Difference Between Native Sediment and
Sidewall Core Samples Collected during Installation and Decommissioning of RCRA Well 299-E25-46 ........................................................................................................... 3.6
3.4 XRD Patterns for Sediment Samples Collected during Installation of RCRA Well 299-E24-19 ....................................................................................................................... 3.6
3.5 Low Angle 2θ XRD Patterns for Sidewall Core Samples Collected during Decommissioning of RCRA Well 299-E24-19 ....................................................................................................... 3.7

xii
Tables
3.1 Gravimetric Moisture Content of Archived Sediment Samples ............................................... 3.2 3.2 Gravimetric Moisture Content of the Sidewall Core Sediment Samples.................................. 3.2 3.3 Gravimetric Moisture Content of the Replacement Well Core Sediment Samples .................. 3.3 3.4 pH and EC Values for 1:1 Sediment:Water Extracts of Archived Sediment Samples ............. 3.8 3.5 pH and EC Values for 1:1 Sediment:Water Extracts of Side-wall Sediment Samples............. 3.9 3.6 Water-Extractable Anions in the Archived Samples ................................................................ 3.11 3.7 Water-Extractable Anions in the Sidewall Core Samples ........................................................ 3.12 3.8 Water-Extractable Cations in the Archived Samples................................................................ 3.13 3.9 Water-Extractable Cations in the Sidewall Core Samples........................................................ 3.14 3.10 Calculated Porewater Anion Concentrations in Archived Samples.......................................... 3.16 3.11 Calculated Porewater Anion Concentrations in Sidewall Core Samples.................................. 3.18 3.12 Carbon Content of the Archived and Sidewall Core Sediment Samples .................................. 3.19 3.13 Acid-Extractable Cations in Archived Vadose Zone Sediments .............................................. 3.19 3.14 Acid-Extractable Cations in Sidewall Core Sediment Samples................................................ 3.20 3.15 Technetium-99 Activity in the Sidewall Core Samples............................................................ 3.21 5.1 Chloride Content of Sealing Agents ......................................................................................... 5.1
1.1
1.0 Introduction
The overall goals of the Groundwater Performance Assessment Project, led by Pacific Northwest National Laboratory (PNNL), are based on DOE Order 5400.1 and include: (1) verifying compliance with applicable environmental laws and regulations; (2) verifying compliance with environmental commitments made in environmental impact statements, environmental assessments, safety analysis reports, or other official U.S. Department of Energy (DOE) documents; (3) characterizing and defining trends in the physical, chemical, and biological condition of the environment; (4) establishing baselines of environmental quality; (5) providing a continuing assessment of pollution abatement programs; and (6) identifying and quantifying new or existing environmental quality problems. For a more complete discussion of the goals of the Groundwater Performance Assessment Project, see the overall work plan, Hanford Site Groundwater Monitoring for Fiscal Year 2003 (Hartman et al. 2004).
To meet these goals, numerous Resource Conservation and Recovery Act (RCRA) monitoring wells have been installed throughout the Hanford Site. In 2003, it was determined that two RCRA monitoring wells (299-E24-19 and 299-E25-46) in Waste Management Area (WMA) A-AX failed due to rapid corrosion of the stainless steel casing over a significant length of the well (Figure 1.1, location map). Complete casing corrosion occurred between 276.6 and 277.7 feet below ground surface (bgs) in well 299-E24-19 and from 274.4 to 278.6 feet bgs in well 299-E25-46. CH2M HILL Hanford Group, Inc., asked scientists from PNNL to perform detailed analyses of vadose zone sediment samples collected in the vicinity of WMA A-AX from depths comparable to those where the rapid corrosion occurred.
1.1 Well Construction
Wells 299-E24-19 and 299-E24-46 were both installed using a cable tool drill rig. Well 299-E24-19 was drilled in 1989 to a total depth of 303.19 feet bgs. Well 299-E25-46 was drilled in 1992 to a total depth of 310.31 feet bgs. Both wells were constructed in the same manner, which consisted of a 4-inch diameter stainless steel casing (type 304L) inside a temporary 8-inch carbon steel drive casing. The annulus between the two casings was filled primarily with Wyoming bentonite crumbles (8 to 20 mesh), but other materials used included bentonite pellets (0.25-inch), cement grout, and sand. Once the annulus was filled, the drive casing was pulled and the well was placed into service.
Wyoming bentonite is a sodium-type, montmorillonite clay material that is capable of absorbing seven to ten times its weight in water. The formation of Wyoming bentonite beds began in the Late Cretaceous period, when volcanic activity in present day Wyoming and Idaho deposited ash into a large inland sea that covered most of the central United States. The ash deposits were eventually covered with sediment from eroded land forms. After millions of years of in situ alteration, the ash deposits were transformed into the bentonite deposits being mined today. Wyoming bentonite has had many uses over the years, but its primary application continues to be as a binding/sealing agent.

1.2
Figure 1.1. Well Location at Waste Management Area A-AX

1.3
1.2 Type 304L Stainless Steel Specifications
Although stainless steels represent less than 2% of the total steel produced in the United States, stainless steels are used for applications where resistance to corrosion is necessary (Sedriks 1996). Type 304L is an 18-8 stainless steel, which indicates that is it composed of 18% chromium and 8% nickel. Other typical components of type 304L stainless steel include iron (greater than 50%), manganese (2%), silicon (0.75%), nitrogen (0.1%), phosphorus (0.045%), sulfur (0.03%), and carbon (0.03%). However, it is the chromium content of stainless steels, such as 304L, which prevents the formation of rust in unpolluted environments. Corrosion resistance is achieved by the formation of a thin surface film (1 to 10 nm thick), known as a “passive film,” which acts as a protective barrier by providing electrochemical impedance at the air/solution:metal interface. For stainless steels, the passive film is composed primarily of bound water, oxygen, and hydroxide ions, and typically chromium ions bonded to oxygen to form an “oxide” (Lancombe et al. 1993). Ultimately, the degree of corrosion protection is based on the efficacy of the passive film to regulate the ion exchange of matter between the metal and the solution.
1.3 The Effect of Chloride on Corrosion
Dissolved chloride is a critical solution parameter with respect to stainless steels. Previous research has shown that the presence of chloride ions can lead to breakdown of the passive film, thereby eliminating the protective surface barrier (Lancombe et al. 1993). It has been shown that a linear relationship exists between pitting potential and chloride concentration, in which the pitting potential (Ep) is proportional to the log of the chloride solution concentration [Cl-] (Sedriks 1996). Additionally, chloride attack of stainless steel is very sensitive to the pH of fluids in contact with the steel. In acidic to neutral pH environments, 100 mg/L chloride is the critical threshold concentration beyond which stainless steel experiences pitting (Sedriks 1996). However, chloride corrosion resistance can be increased by raising the pH of solutions in contact with the stainless steel. In fact, the chloride corrosion resistance of type 304L stainless steel at the high pH conditions generated by fresh Portland cement (pH= ~12.5) could be in excess of 10,000 mg/L chloride (Sedriks 1996).
Two primary mechanisms that lead to stainless steel corrosion/failure in chloride containing environments are (1) crevice corrosion and (2) stress corrosion cracking (Sedriks 1996). Crevice corrosion creates an acidic environment within the crevice. This occurs as a result of dissolution of metal from within the crevice followed by hydrolysis of the dissolved metal ions (Sedriks 1996). The end result of this process is a microclimate of pH < 2 within the crevice with ambient (near neutral) solution outside the crevice. Stress corrosion cracking is characterized by the failure of stressed alloys in corrosive environments. This phenomenon requires static mechanical loading (caused by forming or welding of the material or perhaps stresses caused by pounding the casing into the sediment formation) in conjunction with an aggressive environment (Lancombe et al. 1993).
1.4 Scope
This report contains all the geochemical and selected physical characterization data collected on the following samples:
• Archived vadose zone sediment recovered during the late 1980s to early 1990s installation of four RCRA monitoring wells: 299-E24-19, 299-E24-20, 299-E24-22, and 299-E25-46

1.4
• Sample of bentonite material
• Sidewall core samples collected during the 2004 decommissioning of wells 299-E24-19 and 299-E25-46
• Splitspoon core samples collected during the 2004 installation of two new RCRA monitoring wells: 299-E24-33 and 299-E25-95
• Perched water sample collected during the installation of well 299-E24-33
Laboratory tests were conducted to characterize the sediment and to identify water-leachable constituents. Testing consisted primarily of 1:1 sediment:water extractions, which were used to calculate the elemental concentrations of water soluble constituents in the solid and to estimate in-situ porewater chemistry conditions. Additionally, 8M nitric acid extractions and X-ray diffraction analysis of the solids were used to provide a measure of the total leachable sediment content of constituents and to search for the formation of new crystalline phases that may have formed during the corrosion process, respectively.
The laboratory results were used to investigate the cause of accelerated corrosion of the stainless steel casing in the two wells from WMA A-AX. Interpretations of the results of this work were used to provide recommendations (Section 5.0) of materials to be used during the construction of future wells. Additionally, guidance is provided on what types of subsurface conditions warrant considering modifications to current installation procedures and methods.

2.1
2.0 Geochemical Methods and Materials
This section provides a description of the samples tested and discusses the methods used to characterize the samples and parameters that were measured in the laboratory. It also contains a description of the materials and methods used to conduct analyses of the geochemical properties of the sediment samples.
2.1 Sample Inventory
This work involved the characterization and examination of samples from five different sources: (1) archived core sediment samples collected during the installation of RCRA monitoring wells, (2) a sample of the bentonite material that is currently being used to backfill/seal newly installed groundwater monitoring wells, (3) sidewall core samples collected during the decommissioning of the two failed RCRA monitoring wells, (4) splitspoon core samples collected during the installation of two new RCRA wells, and (5) a perched water sample collected during the installation of a new RCRA monitoring well in the vicinity of WMA A-AX.
2.1.1 Archived Sediment Samples
Archived sediment samples collected during the installation of four RCRA monitoring wells in the vicinity of WMA A-AX were chosen for this study including 299-E24-19, 299-E24-20, 299-E24-22, and 299-E25-46. Samples from wells 299-E24-20 and 299-E24-22 (Figures 2.1 and 2.2) were chosen as comparative samples for the two failed wells (299-E24-19 and 299-E25-46 [Figures 2.3 and 2.4]). Samples were identified using the well number, followed by the specific depth below ground surface from which the sample was collected. Conversion of sample depth to mean sea level elevation can be performed by subtracting the sample depth from the elevation of the well; in this case, 697.21 feet at well 299-E24-19, 692.76 feet at well 299-W24-20, 689.90 feet at well 299-E24-22, and 698.14 feet at well 299-E25-46. Archived sediment samples characterized during this effort were selected based upon two factors: 1) a depth range that included the zone over which corrosion of the casing was observed in the two failed wells, and 2) the inclusion of fine-grained material (silt lens) present in WMA A-AX near the depth corresponding to the zone of corrosion in the two failed wells.
2.1.2 Bentonite Material
A sample of Enviroplug® #8 high swelling Wyoming bentonite from Wyo-Ben1, that is used to seal the void space around the annulus of casing during the completion of RCRA wells, was obtained for testing. However, it should be noted that the bentonite sample was an aliquot of material commercially available at the time of this study and does not necessarily represent the bentonite material used approximately a decade ago when the wells in question were installed.
1 Wyo-Ben, P.O. Box 1979, Billings, MT 59103, www.wyoben.com

2.2
Figure 2.1. Archived Sediment Samples from Well 299-E24-19: 275 feet, 280 feet, and 285 feet bgs (from left)
Figure 2.2. Archived Sediment Samples from Well 299-E24-20: 270 feet, 275 feet, and 280 feet bgs (from left)

2.3
Figure 2.3. Archived Sediment Samples from Well 299-E24-22: 265 feet and 270 feet (from left)
Figure 2.4. Archived Sediment Samples from Well 299-E25-46: 270 feet and 275 feet (from left)

2.4
2.1.3 Sidewall Core Samples
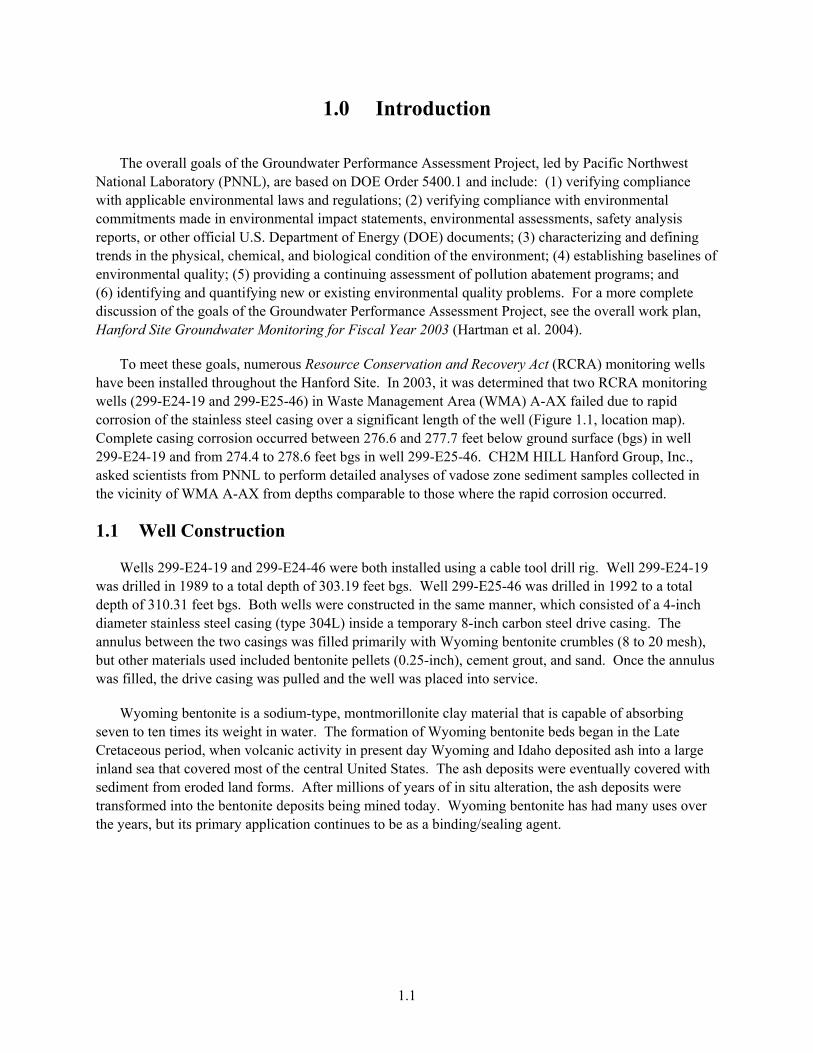
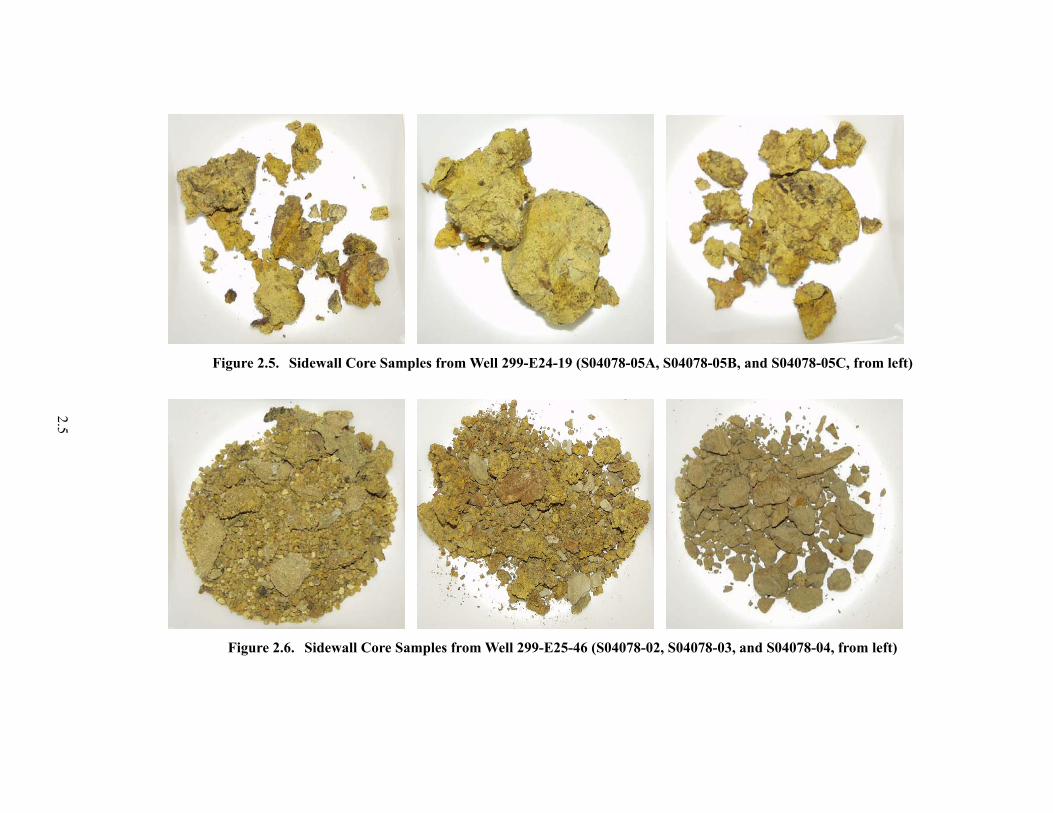
Sidewall core samples were retrieved within the zone of interest from both of the corroded wells. Specifically, one sample was collected from well 299-E24-19 (split into three aliquots [Figure 2.5]) at a depth of 277 feet bgs, and one sample (split into three aliquots) was collected from well 299-E25-46 (Figure 2.6) at a depth of 275.7 feet bgs. The samples collected from well 299-E24-19 were identified using S04078-05, followed by a letter designation (A, B, or C) and consisted of a viscous mixture of bentonite backfill and silty sediment. The samples collected from well 299-E25-46 were identified using S04078, followed by a number designation for each sample (02 through 04). Samples S04078-02 and S04078-03 contained bentonite crumbles intermixed with material from the silt lens. Sample S04078-04 primarily comprised silt lens material, with lesser amounts of bentonite visible (Figure 2.6). An equipment blank (quartz sand) was prepared in the field and is identified as S04078-01.
2.1.4 Splitspoon Core Samples
Splitspoon core samples collected during the installation of two new RCRA monitoring wells (299-E24-33 and 299-E25-94), in the vicinity of WMA A-AX, were analyzed as part of this study. Well 299-E24-33 is located up gradient of the corroded wells while well 299-E25-94 is located slightly north and to the east of the corroded well. Samples were identified using the well number, followed by the specific depth below ground surface from which the sample was collected (Figures 2.7 and 2.8). Conversion of sample depth to mean sea level elevation can be performed by subtracting the sample depth from the elevation of the well; in this case, 675.96 feet at well 299-E24-33 and 693.27 feet at well 299-W25-94. Sediment core samples characterized during this effort were selected based upon two factors (1) a depth range that included the zone over which corrosion of the casing was observed in the two failed wells, and/or (2) the inclusion of fine-grained material (silt lens) present in WMA A-AX near the depth corresponding to the zone of corrosion in the two failed wells.
2.1.5 Perched Water Sample
A perched water sample was collected during the installation of RCRA monitoring well 299-E24-33. The sample was retrieved from an area representative of a fine-grained lens at 258 feet bgs.
2.2 Approach
The archived sediment samples, splitspoon core samples, as well as the sidewall core samples collected from the zone of corrosion were analyzed for their geochemical properties. The objective of the laboratory characterization was to determine if the sediment, or a contaminant contained therein, could have caused premature failure of the well casing. The Wyoming bentonite was similarly characterized to see if it might be the cause of the rapid corrosion. The perched water sample was characterized and used as a baseline for comparison to theoretical porewater calculations generated based on laboratory data.
2.5
Figure 2.5. Sidewall Core Samples from Well 299-E24-19 (S04078-05A, S04078-05B, and S04078-05C, from left)
Figure 2.6. Sidewall Core Samples from Well 299-E25-46 (S04078-02, S04078-03, and S04078-04, from left)

2.6
Figure 2.7. Select Core Samples: 299-E24-33-255.5, 299-E24-33-256.5, and 299-E24-33-257.5
(from top)

2.7
Figure 2.8. Select Core Samples: 299-E25-94-270, 299-E25-94-271, and 299-E25-94-273.5
(from top)

2.8
During the laboratory studies, the sediment and bentonite samples were sub-sampled to determine moisture content and to perform 1:1 water extracts, which provided sediment pH, electrical conductivity (EC), alkalinity, cation, and anion data, and 8M nitric acid extracts, which provided a measure of the total leachable sediment content of various species.
2.3 Materials and Methods
During sub-sampling of the sediment, every effort was made to minimize moisture loss and prevent cross contamination between samples.
2.3.1 Moisture Content
The gravimetric water content of the sediment samples was determined using accepted PNNL procedures, which are based on the American Society for Testing and Materials procedure Test Method for Laboratory Determination of Water (Moisture) Content of Soil and Rock by Mass, ASTM D2216-98 (ASTM 1998). One representative sub-sample of at least 15 grams was taken from each container. Sediment samples were placed in tared containers, weighed, and dried in an oven at 105°C (221°F) until constant weight was achieved, which took at least 24 hours. The containers were then removed from the oven, sealed, cooled, and weighed. At least two weighings, each after a 24-hour heating, were performed to ensure that all moisture was removed. All weighings were performed using a calibrated balance. The gravimetric water content was computed as the percentage change in soil weight before and after oven drying.
2.3.2 X-ray Diffraction
X-ray diffraction (XRD) analysis was performed on bulk powder samples from the sidewall cores and archived sediments. Approximately 1 gram of oven-dried sediment was crushed to a fine powder using an 8000M Spex Certa Prep Mixer/Mill. The powders were hand packed into the XRD holder and smoothed with a glass slide. Each sample was scanned from 2 to 65° 2θ with a 0.04 step size and a 40-second dwell time. The scans were processed and the crystalline phases identified using JADE2 XRD computer software.
2.3.3 1:1 Sediment:Water Extracts
The water-soluble inorganic constituents were determined using a 1:1 sediment:deionized-water extract method. This method was chosen because the sediment was too dry to easily extract vadose zone porewater. The extracts were prepared by adding an exact weight of deionized water to approximately 60 to 80 gram aliquots of each sample. The weight of deionized water needed was calculated based on the weight of the samples and their previously determined moisture content. The sum of the existing moisture (porewater) and the deionized water was fixed at the mass of the dry sediment. The bentonite material required a lower solid to solution ratio (1:3.6) in order to create enough extractable water for the subsequent analyses. The appropriate amount of deionized water was added to screw cap jars containing the solid samples. The jars were sealed and briefly shaken by hand, then placed on a mechanical orbital shaker for 1 hour. The samples were allowed to settle until the supernatant liquid was fairly clear. The supernate was carefully decanted and separated into unfiltered aliquots for conductivity and pH 2 JADE XRD computer software, Materials Data Inc., Livermore, California.

2.9
determinations, and filtered aliquots (passed through 0.45 µm membranes) for anion and cation analyses. More details can be found in Rhoades (1996) and within Methods of Soils Analysis - Part 3 (ASA 1996).
2.3.4 pH and Conductivity
Aliquots (approximately 3 mL) of the unfiltered 1:1 sediment:water extract and 1:3.6 bentonite:water extract supernates and the perched water sample were used for pH and conductivity measurements. The pHs for the samples were measured with a solid-state pH electrode and a pH meter calibrated with buffers 4, 7, and 10. Electrical conductivity was measured and compared to potassium chloride standards with a range of 0.001 M to 1.0 M.
2.3.5 Anions
The 1:1 sediment:water and 1:3.6 bentonite:water extracts and perched water sample were analyzed for anions using an ion chromatograph. Fluoride, chloride, nitrite, bromide, nitrate, carbonate, phosphate, and sulfate were separated on a Dionex AS17 column with a gradient elution of 1 mM to 35 mM sodium hydroxide and measured using a conductivity detector. This methodology is based on U.S. Environ-mental Protection Agency (EPA) Method 300.0A (EPA 1984) with the exception of using the gradient elution of sodium hydroxide. Water extract chromatograms were visually scanned to assure the analytical results were not biased by unidentified peaks caused by other constituents.
2.3.6 Cations and Technetium-99
Major cation analysis was performed on the various extracts and perched water sample using an inductively coupled plasma-optical emission spectrometer (ICP-OES) unit. High-purity calibration standards were used to generate calibration curves and verify continuing calibration during the analytical run. Dilutions of 50x, 10x, 5x, and 3x were made of each of the solid:water extracts to investigate and correct for matrix interferences. Details of this method are found in EPA Method 6010B (EPA 2000b). The second instrument, used to analyze technetium-99, was an inductively coupled plasma-mass spectrometer (ICP-MS) using PNNL-AGG-415 method (PNNL 1998), which is quite similar to EPA Method 6020 (EPA 2000c).
2.3.7 Alkalinity
The alkalinity of all of the solids:water extracts, as well as the perched water sample, were measured using standard titration with acid. The alkalinity procedure is equivalent to the U.S. Geological Survey (USGS) National Field Manual (USGS 2001) method.
2.3.8 Carbon Content
Carbon content of the samples was determined using ASTM Method D4129-88, Standard Methods for Total and Organic Carbon in Water by High Temperature Oxidation and by Coulometric Detection (ASTM 1988). Total carbon in all samples was determined using a Shimadzu TOC-V Total Organic Carbon analyzer with combustion at approximately 980°C (1796°F). Ultra pure oxygen was used to sweep the combustion products through a barium chromate catalyst tube for conversion to carbon dioxide. Evolved carbon dioxide was quantified through coulometric titration following absorption in a solution containing ethanolamine. Sediment samples for determining total carbon content were placed into

2.10
pre-combusted, tared platinum combustion boats and weighed on a four-place analytical balance. After the combustion boats were placed into the furnace introduction tube, a one-minute waiting period was allowed so that the ultra pure oxygen carrier gas could remove (i.e., sparge) any carbon dioxide introduced to the coulometric system from the atmosphere during sample placement. After this system sparge, the sample was moved into the combustion furnace and the titration was begun. Sample titration readings were performed at 3 minutes after combustion began and again once stability was reached, usually within the next 2 minutes. The system background was determined by performing the entire process using an empty, pre-combusted platinum boat. Adequate system performance was confirmed by analyzing for known quantities of a calcium carbonate standard.
Organic carbon contents of the samples were determined using a Shimadzu TOC-V Total Organic Carbon Analyzer. Soil samples were weighed on a four-place analytical balance, then placed into acid-treated glass tubes. Following placement of sample tubes into the system, a one-minute waiting period allowed the ultra pure oxygen carrier gas to remove any carbon dioxide introduced to the system from the atmosphere. Organic carbon was released through acid-assisted evolution (50% hydrochloric acid) with heating to 200°C (392°F). Samples were completely covered by the acid to allow full reaction to occur. Ultra pure oxygen gas swept the resultant carbon dioxide through the equipment to determine inorganic carbon content by coulometric titration. Sample titration readings were performed 5 minutes following acid addition and again once stability was reached, usually within 10 minutes. Inorganic carbon was calculated as the difference between the measured total and organic carbon.
2.3.9 8 M Nitric Acid Extract
Approximately 20 g of oven-dried sediment was contacted with 8 M nitric acid at a ratio of roughly 5 parts acid to one part sediment. The slurries were heated to about 80°C (176°F) for several hours and then the fluid was separated by centrifugation and filtration through 0.2 µm membranes. The acid extracts were analyzed for major cations using ICP-OES. The acid digestion procedure is based on EPA SW-846 Method 3050B (EPA 2000a).

3.1
3.0 Results and Discussion
This section presents the geochemical characterization data collected on archived sediment from the installation of wells in the vicinity of WMA A-AX (299-E24-19, 299-E24-20, 299-E24-22, and 299-E25-46), splitspoon core samples collected during the installation of two new wells (299-E24-33 and 299-E25-94), sidewall core samples from the two decommissioned wells (299-E24-19 and 299-E25-46), the perched water sample collected during the installation of well 299-E24-33, and the Wyoming bentonite currently used at Hanford for well completion. Information presented in this section includes moisture content, carbon content, and mineralogy (via X-ray diffraction) of the solids; and pH, electrical conductivity, and measurements of major cations and anions in the solids:water extracts and perched water sample; and measurement of major cations in acid extracts of the sidewall cores, splitspoon cores, and archived sediment samples.
3.1 Moisture Content
The moisture content of the archived sediment samples from the four wells are listed in Table 3.1. The moisture content profile correlates with the lithology described in the well logs from the respective boreholes. The primary region of interest is the silt lens located between 270 and 280 feet bgs, which had an elevated moisture content ranging from 5.5 to 25.1%. The large degree of variability in the moisture content of the material collected from within the silt lens was a direct result of sample preservation. Unfortunately, several of the sample containers were not sealed tightly; therefore, evaporation occurred during the archived period, resulting in moisture content calculations that are not indicative of in-situ conditions. Sediment samples collected above and below the silt lens comprised primarily coarse-grained sand, with moisture contents ranging from 0.4 to 3.7%. Moisture contents below 2.5% for samples of this description suggest significant drying occurred during archiving based on measurements obtained on recent boreholes collected for the CH2M HILL Hanford Group Vadose Zone project (Lindenmeier et al. 2002; Serne et al. 2002; Serne et al. 2004a; and Serne et al. 2004b).
Table 3.2 contains the moisture content data from analysis of the sidewall core samples. The samples from both wells had elevated moisture contents ranging from 30.4 to over 50%. The elevated moisture content of these samples correlated well with the composition of the material collected, namely, varying percentages of bentonite and silt lens material. Reproducibility among the samples from well 299E-24-19 was excellent (S04078-05C DUP was run as a laboratory duplicate for sample S04078-05C). This demonstrates that the entire sample was homogenous with respect to moisture content and likely indicates that the three aliquots should be treated as replicates of the same sample rather than discrete samples. Comparatively, the reproducibility among the three aliquots from the well 299-E25-46 sample was not as strong. Moisture contents of the samples varied by as much as 41%; therefore, the heterogeneity of these samples, both visually and based on moisture content, may allow for the treatment of them as discrete samples. Under the discrete sample scenario, the three samples from well 299-E25-46 could be used to investigate a lateral sediment-chemistry profile in the zone of corrosion.
Table 3.3 contains the moisture content data from analysis of the replacement well core samples. The moisture content profile correlates well with the lithology described in the well logs from the respective boreholes. The primary regions of interest were (1) the silt lens located intermittently between 255.5 and 259.5 feet bgs in cores from well 299-E24-33 that had a moisture content of approximately 25%

3.2
Table 3.1. Gravimetric Moisture Content of Archived Sediment Samples
Depth (feet bgs)
Moisture Content (% Weight)
299-E24-19 270 3.16 275 3.73 280 17.13 285 0.58
299-E24-20 270 0.42 275 14.60 280 0.89
299-E24-22 265 0.92 270 25.12
299-E25-46 270 0.40 275 5.49
Wyoming Bentonite NA 9.57 NA = not applicable
Table 3.2. Gravimetric Moisture Content of the Sidewall Core Sediment Samples
Sample Identification
Moisture Content (% Weight)
299-E24-19 S04078-5A 47.07 S04078-5B 49.48 S04078-5C 51.11 S04078-5C DUP 50.40
299-E25-46 S04078-02 31.54 S04078-03 46.17 S04078-04 30.40
Equipment Blank S04078-01 0.04 DUP = duplicate

3.3
Table 3.3. Gravimetric Moisture Content of the Replacement Well Core Sediment Samples
Sample Identification
Moisture Content (% Weight)
299-E24-33 255.5 24.85 256.5 27.90 257.5 27.80 258.5 25.02
299-E25-94 270 8.25 271 Sand 17.90 271 Silt 25.73 272.5 13.65 273.5 24.59 275 18.58 276 21.07 276 Duplicate 20.37 275.5 19.31 278.5 21.03
and (2) the silt lens located from 273.5 through 279.5 feet bgs in cores from well 299-E25-94 that had a moisture content ranging from 18.5 to 24.6%. Although there were several layers of coarser material intermixed among the silt fractions in cores from well 299-E24-33, this investigation focused primarily on the silt fractions. Therefore, a high degree of consistency existed among the moisture content data reported in Table 3.3 for well 299-E24-33 core samples. More variability was observed in the measured moisture content of samples from well 299-E25-94 for one reason: three samples analyzed as part of this study contained considerably more coarse-grained material than would be truly representative of the silt lens (see Table 3.3 samples 270, 271 Sand, and 272.5). Although material collected from within the silt lens was the primary focus of this investigation, coarser-grained material within core samples collected from well 299-E25-94 was not purposefully excluded. 3.2 Mineralogy
This section discusses the minerals identified in the XRD patterns for vadose zone samples collected from the installation and subsequent decommissioning of RCRA wells 299-E24-19 and 299-E25-46. Mineral identification was based on a comparison of the peak reflections and intensities observed in each pattern to the mineral powder diffraction files (PDF™) published by the Joint Committee on Powder Diffraction Standards (JCPDS) International Center for Diffraction Data (ICDD).
Each pattern is shown as a function of degrees 2θ based on CuKα radiation (λ=1.5406 Å). The vertical axis represents the relative intensity of the XRD peaks. The XRD patterns contain one or more schematic database (PDF) patterns considered for phase identification. The height of each line in the

3.4
schematic PDF pattern represents the relative intensity of an XRD peak (i.e., the most intense [the highest] peak has a relative intensity [I/Io] of 100%). Intensity for the primary quartz reflection (26.6 °2θ) on all samples was truncated to increase the pattern detail in the figures. A crystalline phase typically must be present at greater than 5 wt% of the total sample mass (greater than 1 wt% under optimum conditions) to be readily detected by XRD.
The background subtracted XRD patterns for samples collected at two depths (270 and 275 feet) during the installation of well 299-E25-46 are plotted with PDF patterns used for phase identification in Figure 3.1. The samples consisted of minerals typically found in Hanford formation sediment, quartz, feldspars, amphibole, and clays. Mica, smectite, and chlorite were the dominant clay minerals identified in these sediments.
°2θ
5 10 15 20 25 30 35 40 45 50 55 60 65
Rel
ativ
e In
tens
ity
Quartz
MicaMontmorillonite (Bentonite)
Albite
270'
275'
Well 299-E25-46(native)
Amphibole
Figure 3.1. XRD Patterns for Sediment Samples Collected during Installation of RCRA Well
299-E25-46 with Matching PDF Files
Sidewall core samples (275.7 feet bgs) collected during the decommissioning of RCRA well
299-E25-46 were examined by XRD, and the results are shown in Figure 3.2 with corresponding PDF patterns. Samples S04078-02 and S04078-03 were a mixture of bentonite and native Hanford formation sediments. The term “bentonite,” which is a material composed predominantly of smectite, is used here to make a distinction from smectite native to the Hanford formation. Sample S04078-04 is quartz sand with minor amounts of feldspar, mica, and chlorite. Neither bentonite nor smectite were detected in this sample.

3.5
°2θ
5 10 15 20 25 30 35 40 45 50 55 60 65
Rel
ativ
e In
tens
ityQuartz
MicaMontmorillonite (Bentonite)
Alibte
S04078-4
S04078-3
S04078-2
Well 299-E25-46Contamintated Samples
Figure 3.2. XRD Patterns for Sidewall Core Samples Collected during Decommissioning of RCRA
Well 299-E25-46 with Matching PDF Files
Reflections from the low angle portion of the XRD patterns (<12 °2θ) of each sample collected in
well 299-E25-46 are shown in Figure 3.3. The native samples (270 and 275 feet bags) produced a relatively small but sharp peak at 6.2 °2θ, indicating a mixture of chlorite and lesser amounts of native smectite. In contrast, the two sidewall core samples (S04078-02 and S04078-03) produced a reflection at 7.0 °2θ (Figure 3.3), similar to a sodium-saturated Wyoming bentonite. Additionally, the bi-model reflection evident in sample S04078-03 is a combination of three clays, chlorite and native smectite (6.2 °2θ), and bentonite (7.0 °2θ).
Observed peak intensities from the primary smectite (or bentonite) reflection indicate the two sidewall core samples (S04078-02 and S04078-03) were dominated by bentonite. Additionally, the XRD data confirms the location of the sidewall core sample S04078-02 being closest to the borehole and sample S04078-04 being furthest from the failed casing.
There were several unassigned reflections in the two sidewall core samples (S04078-02 and S04078-03), indicating the presence of one or more unidentified crystalline phases. These reflections (9.82, 28.6, and 28.9°2θ) were not observed in sample S07048-04 or the native samples. These XRD tracings were examined for expected corrosion products (ferric, chromium, and nickel oxides), but none were identified.

3.6
°2θ
2 3 4 5 6 7 8 9 10 11 12
Inte
nsity
Native 270 ft bgsNative 275 ft bgsS04078-2S04078-3S04078-4
Bentonite
Mica
AmphiboleMontmorillonite&
Chlorite
Figure 3.3. Low Angle 2θ XRD Patterns Showing the Difference Between Native Sediment and
Sidewall Core Samples Collected during Installation and Decommissioning of RCRA Well 299-E25-46
XRD analysis of samples collected during the installation and decommissioning of RCRA well
299-E24-19 are presented in Figures 3.4 and 3.5. The background subtracted XRD patterns of the native sediment from well 299-E24-19 are shown in Figure 3.4. The intensities of reflections produced from quartz and albite have been truncated in the graph to allow for more detailed viewing of the lower intensity reflections produced by the clay minerals. These native samples collected at 275 and 280 feet bgs were representative of Hanford formation sediment and contain the same suite of minerals described earlier for well 299-E25-46 (270 and 275 feet bags).
°2θ
5 10 15 20 25 30 35 40 45 50 55 60 65
Rel
ativ
e In
tens
ity
275'
280'
Well 299-E24-19(native)
Figure 3.4. XRD Patterns for Sediment Samples Collected during Installation of RCRA
Well 299-E24-19

3.7
°2θ
2 3 4 5 6 7 8 9 10 11 12
Inte
nsity
S04078-5AS04078-5BS04078-5C
Well 299-E24-19(sidewall cores)
Bentonite
Mica
Figure 3.5. Low Angle 2θ XRD Patterns for Sidewall Core Samples Collected during
Decommissioning of RCRA Well 299-E24-19
Three sidewall core samples collected from the decommissioning of well 299-E24-19 were examined
using XRD, and the results indicate a mixture of bentonite and native Hanford formation sediment. Bentonite, quartz, feldspar, and amphibole were dominate crystalline phases detected in these samples along with minor amounts of mica.
Unlike the sidewall core samples collected from well 299-E25-46 (Figure 3.2), these samples do not vary in bentonite concentration. Figure 3.5 shows that the primary bentonite reflection (7.0 °2θ) is similar in intensity and shape for all three samples; no native Hanford formation smectite or chlorite were detectable in these samples. Furthermore, the relative intensity of the mica reflection (8.9 °2θ) is significantly less than the bentonite reflection (7.0 °2θ) indicating decreased amounts of native Hanford formation sediment.
As with the sidewall cores from well 299-E25-46, other crystalline phases were observed in these three sidewall core samples. These reflections (9.82, 28.6, and 28.9°2θ) were not observed in samples S07048-04 or the native samples. These XRD tracings were examined for expected corrosion products (ferric, chromium, and nickel oxides), but none were identified.
3.3 Sediment:Water Extracts
The following sections discuss results of the analyses for the 1:1 sediment:water extracts of the soil samples and the 1:3.6 bentonite:water extracts. Where applicable, the geochemical data are reported both as an estimate of the chemical composition of the vadose zone porewater and on a per gram of dry soil basis.
3.3.1 pH and Electrical Conductivity
The pH and EC of the perched water sample and water extracts of the archived samples, splitspoon core samples, Wyoming bentonite, and sidewall core samples are shown in Tables 3.4 and 3.5. The pH is reported as measured in the 1:1 sediment:water extracts, but the EC is corrected for deionized water dilution and reported as if it was actual porewater. The pH profile of the archived sediment samples

3.8
Table 3.4. pH and EC Values for 1:1 Sediment:Water Extracts of Archived Sediment Samples
Depth (feet bgs) pH Conductivity
(mS/cm) 299-E24-19
270 7.91 6.10 275 7.77 4.22 280 7.53 4.06 285 7.71 59.0
299-E24-22 270 7.47 40.6 275 7.62 3.64 280 7.57 26.1
299-E24-20 265 7.37 24.5 270 7.49 4.77
299-E25-46 270 7.59 69.9 275 7.42 13.8
299-E24-33 255.5 7.11 3.43 256.5 7.40 2.54 257.5 7.69 2.47 258.5 7.78 1.68
299-E25-94 270 7.55 2.56 271 Sand 7.50 1.68 271 Silt 7.45 1.80 272.5 7.54 1.27 273.5 7.49 1.70 275 7.63 1.80 276 7.63 1.51 276 Duplicate 7.65 2.35 275.5 7.77 1.49 278.5 7.55 2.45
Perched Water Sample (B19200) 258 7.17 2.78
Wyoming Bentonite NA 7.93 130
Shaded cells indicate material collected from within the silt lens. NA = Not applicable.

3.9
Table 3.5. pH and EC Values for 1:1 Sediment:Water Extracts of Side-wall Sediment Samples
Sample Identification pH Conductivity
(mS/cm) 299-E24-19
S04078-05A 2.41 16.2 S04078-05B 2.26 22.8 S04078-05C 2.39 15.2 S04078-05C Duplicate 2.34 16.7
299-E25-46 S04078-02 1.88 93.5 S04078-03 1.86 65.7 S04078-04 2.4 27.2
Equipment Blank S04078-01 5.74 30.2
ranged from a low of 7.37 in well 299-E24-20 at 265 feet bgs to a high of 7.91 in well 299-E-24-19 at 270 feet bgs. Similarly, the water extract pH values of splitspoon core samples from wells 299-E24-33 and 299-E25-94 varied little. The pH profile of the splitspoon core samples from well 299-E24-33 ranged from a low of 7.11at 255.5 feet bgs to a high of 7.78 at 258.5 feet bgs. The pH profile of the splitspoon core samples from well 299-E25-94 was even more consistent, with a low of 7.45 at 271 feet bgs in the sand fraction to a high of 7.77 at 277.5 feet bgs.
The measured pH in extracts from the sidewall core samples was quite different, with an average solution pH for the seven samples of 2.2 (sample S07048-05C DUP was analyzed as a laboratory dupli-cate). An acidic pH in this environment indicates either the presence of acid as a subsurface contaminant, or more likely, is the result of the hydrolysis of metals during the breakdown/corrosion of the well casing. As seen in Table 3.5, the equipment blank water extract had a solution pH of 5.7, which is essentially the same value as the deionized water that was used as the contact solution in the water extract tests.
The porewater dilution-corrected conductivity data reported in Table 3.4 for the archived sediment samples show significantly elevated regions located either directly above and/or below the silt lens. The samples within the silt lens are identified by bold and italics in tables. The water extract EC values do not correlate well with the measured conductivity of the perched water sample (2.78 mS/cm) from the new borehole (299-E24-33). These data imply that the calculated porewater conductivity for the regions directly above and below the silt lens have been subject to loss of moisture via evaporation during storage, and therefore do not accurately represent the anticipated in situ vadose zone conditions. Conversely, the porewater calculated EC data for the splitspoon core samples reported in Table 3.4 correlate quite well with the measured conductivity of the perched water sample. Splitspoon samples from well 299-E24-33 had an average dilution corrected conductivity of 2.53 mS/cm, compared to an average value of 1.86 mS/cm for the samples from well 299-E25-94. These data imply that a porewater correction calculation performed on water extracts from the splitspoon core samples can be used to provide a qualitative assessment of the in-situ chemistry of contacting solutions.

3.10
Table 3.5 shows the porewater dilution-corrected conductivity data for the equipment blank and sidewall core samples. The equipment blank had a high dilution corrected conductivity (30.2 mS/cm), which was likely an artifact of trace amounts of contamination being corrected by the minimal moisture contained in the sample (0.04%). The corrected conductivity data for the sidewall core samples appear to correlate well with the composition of the sample; the samples containing a greater percentage of bentonite had higher dilution-corrected electrical conductivity values. The sidewall core samples from well 299-E24-19, S07048-5A through S07048-5C, had an average corrected EC value of 17.8 mS/cm. The sidewall core samples from well 299-E25-46, which contained varying percentages of bentonite, had a range of corrected EC values from 27.2 to 93.5 mS/cm. However, the dilution corrected porewater con-ductivity of the pure bentonite sample (Wyoming Bentonite in Table 3.4) was nearly a factor of two greater than any of the sediment samples tested. These data suggests that the bentonite material (backfill and seal) will act as a source of salinity for vadose zone porewater in the vicinity of the stainless steel casing. 3.3.2 Water Extract Composition of the Sediment:Water Extracts
The water extract values for the major cations and anions are discussed in this section. The anion data are tabulated in Tables 3.6 and 3.7 in units of mass per gram of dry sediment. The data for the water extracts of the archived sediment samples show a trend of elevated chloride, nitrate, and sulfate associated with the silt lens material. The silt lens chloride values were elevated by a factor of 5 to 12 when com-pared to the chloride values of the sediment directly overlying the lens. With the exception of samples from well 299-E24-20, the silt lens had nitrate levels that were elevated by a factor of 3 to more than 200 times the surrounding sediment. Similarly, sulfate levels in the silt lens were elevated by a factor of 4 to 15 when compared to the surrounding sediment. The splitspoon core samples, collected from the new wells (299-E24-33 and 299-E25-94) had anion concentrations consistent with the silt lens fractions of the archived sediment samples; reported concentrations of fluoride, chloride, nitrate, sulfate, and alkalinity were all within the range measured within the silt lens fractions from the four archived boreholes. However, the Wyoming bentonite material released significantly more fluoride, chloride, nitrate, sulfate, phosphate, and carbonate (alkalinity as CaCO3) than any of the archived sediment samples tested. Anion release ratios from the bentonite were elevated by as much as a factor of 45 for fluoride, 79 for chloride, 1451 for nitrate, 429 for sulfate, 6 for phosphate, and 12 for carbonate when compared to the archived sediment samples. Again, this clearly demonstrates the potential for the bentonite material to act as a source of salinity for vadose zone porewater.
Table 3.7 contains the water-extractable anion data for the sidewall core samples. The anion data for the samples from well 299-E24-19 reflect the fact that they are a mixture of bentonite and silt lens mate-rial. The three sidewall core samples contained on average 2.5 times less fluoride, 2.5 times less nitrate, 4.4 times less sulfate, and approximately 2.5 times as much chloride than the pristine Wyoming bentonite test sample. These data imply that the sidewall core samples from well 299-E24-19 contain a greater percentage of silt lens material than bentonite. The only anomaly to this scenario is the slightly higher chloride content of the samples. However, the water-extractable chloride values from the 299-E24-19 sidewall core samples presented in Table 3.7 represent only 0.02% of the total sample mass; therefore, chloride is present in this material as a trace constituent. The water-extractable anion data for the samples from well 299-E25-46 support the theory that the sample is representative of a lateral profile of the bentonite/sediment in the zone of corrosion. The samples collected closest to the casing (S04078-02 and S04078-03) are elevated by a factor of 9 in fluoride, chloride, and nitrate, and by a factor of 2 to 4.5 in sulfate when compared to the sample collected farthest from the corroded casing (S04078-04).

3.11
Table 3.6. Water-Extractable Anions in the Archived Samples(a)
Depth (feet bgs)
Fluoride (µg/g)
Chloride(µg/g)
Nitrate(µg/g)
Sulfate (µg/g)
Phosphate (µg/g)
Alkalinity CaCO3(µg/g)
299-E24-19 270 0.43 0.91 1.81 26.6 <0.51 63.3 275 0.46 1.12 2.00 19.0 <0.51 50.4 280 0.31 7.06 25.4 283 <0.51 43.0 285 0.53 3.41 0.60 80.7 <0.51 57.8
299-E24-20 270 0.52 0.91 <0.43 14.1 <0.51 51.0 275 0.40 4.15 229 56.7 <0.51 52.4 280 0.42 1.38 42.9 20.5 <0.51 39.3
299-E24-22 265 0.26 1.98 4.13 58.9 <0.51 32.7 270 0.21 15.2 3.88 618 <0.51 44.3
299-E25-46 270 0.28 1.86 3.45 70.8 <0.51 43.5 275 0.27 22.3 11.7 308 <0.51 37.8
299-E24-33 255.5 0.16 11.9 53.3 301 0.56 59.3 256.5 0.16 11.7 59.0 354 0.56 56.4 257.5 0.19 12.7 26.6 325 0.59 64.0 258.5 0.24 11.6 24.5 141 0.50 78.3
299-E25-94 270 0.25 6.56 6.31 51.2 <0.51 44.7 271 Sand 0.29 20.2 16.8 95.5 <0.51 55.6 271 Silt 0.32 25.5 21.6 146 <0.51 41.0 272.5 0.31 15.5 5.86 74.2 <0.51 41.0 273.5 0.30 15.2 12.7 103 <0.51 69.5 275 0.19 10.3 8.60 109 <0.51 63.0 276 0.15 13.3 16.2 123 <0.51 54.2 276 Duplicate 0.17 11.4 12.8 103 <0.51 52.0 275.5 0.22 12.5 1.51 122 <0.51 69.0 278.5 <0.12 14.1 21.7 197 <0.51 56.4
Wyoming Bentonite NA 9.4 71.9 624 6041 3.03 382
(a) Values reported in µg/g dry sediment. Shaded cells indicate material collected from within the silt lens. Less than symbols indicate the instrument returned a negative value. NA = Not applicable.

3.12
Table 3.7. Water-Extractable Anions in the Sidewall Core Samples(a)
Sample Identification
Fluoride (µg/g)
Chloride(µg/g)
Nitrate (µg/g)
Sulfate (µg/g)
Phosphate (µg/g)
299-E24-19 S04078-05A 3.66 174 233 949 <158 S04078-05B 3.53 201 290 1512 <152 S04078-05C 3.48 188 229 1580 <150 S04078-05C Duplicate 3.47 182 257 1483 <150
299-E25-46 S04078-02 43.6 3373 8480 3287 <188 S04078-03 36.7 3456 8212 8341 <158 S04078-04 4.46 367 918 1842 <192
Equipment Blank S04078-01 0.070 1.47 0.149 1.36 <0.497
(a) Values reported in µg/g dry sediment. Less than symbols indicate the instrument returned a negative value.
Water extracts from sample S04078-04 contained 2 times less fluoride, 3 times less sulfate, 1.5 times as much nitrate, and 5 times more chloride than the pure Wyoming bentonite material. The average water-extractable data in Table 3.7 for samples S04078-02 and S04078-03 were elevated when compared to the Wyoming bentonite sample by a factor of 4 for fluoride, a factor of 48 for chloride, a factor of 13 for nitrate, but contained similar amounts of water-extractable sulfate (3 to 8 mg/g). The higher concentrations of chloride and nitrate in the sidewall core samples are particularly unsettling. Although both elements are present as trace constituents, their presence at the reported concentrations greatly exceed those measured in the pristine Wyoming bentonite; however, is must be reemphasized that the bentonite material tested was that which was commercially available at the time of this study and therefore, does not necessarily represent the bentonite material used during the installation of these wells. Additionally, due to the acidic pH environment created as a result of corrosion of the stainless steel casing, the sidewall core samples retrieved from the two failed wells were subjected to an in-situ acid leaching process. Therefore, this information, when coupled with the decreasing concentration profile, implies that the chloride and nitrate in samples S04078-02 and S04078-03 could be present as contaminants originating in the vicinity of the well casing or as acid-leachable components of the bentonite sealing material.
The water-extractable major cations from the sediments (archived and splitspoon cores) and bentonite are tabulated in Table 3.8. The data for the water extracts of the archived sediment samples show a trend of elevated calcium, potassium, magnesium, sodium, and strontium associated with the silt lens material. Calcium values were elevated in the silt lens water extracts by a factor of 2.9 to 14.5 when compared to the calcium values of the sandy sediment directly overlying the lens. The silt lens water extracts have potassium levels that were elevated by a factor of 4 to more than 14 times the surrounding sediment. Similarly, magnesium levels in the silt lens water extracts were elevated by a factor of 3.1 to 18 when

3.13
Table 3.8. Water-Extractable Cations in the Archived Samples(a)
Depth (feet bgs)
Mg (µg/g)
Ca (µg/g)
Sr (µg/g)
Na (µg/g)
K (µg/g)
299-E24-19 270 0.70 3.10 0.02 29.0 26.6 275 1.00 3.90 0.02 23.0 19.0 280 18.0 57.0 0.32 49.5 283 285 4.60 24.0 0.15 29.0 80.7
299-E24-20 270 3.00 11.0 0.07 16.0 14.1 275 16.0 50.0 0.26 40.0 56.7 280 3.90 13.0 0.08 18.0 20.5
299-E24-22 265 4.60 16.0 0.11 12.0 58.9 270 36.0 140.0 0.84 70.0 618
299-E25-46 270 5.80 23.0 0.11 17.0 70.8 275 18.0 66.0 0.35 57.0 307
299-E24-33 255.5 25.5 82.6 0.50 46.4 6.04 256.5 29.4 94.6 0.57 50.5 7.48 257.5 25.9 86.8 0.50 48.9 6.29 258.5 13.4 43.1 0.26 37.7 5.88
299-E25-94 270 4.61 16.6 0.09 15.9 4.76 271 Sand 8.94 30.9 0.17 25.6 6.34 271 Silt 12.7 41.9 0.24 36.5 7.43 272.5 6.37 22.9 0.12 21.0 5.50 273.5 8.85 30.7 0.18 38.1 5.33 275 8.37 29.5 0.17 35.5 3.37 276 9.26 32.4 0.19 35.4 4.58 276 Dup 7.39 26.0 0.16 34.3 5.13 275.5 9.19 31.7 0.19 37.3 5.64 278.5 14.0 50.2 0.27 43.9 6.20
Wyoming Bentonite NA 13.0 28.0 1.00 2800 12.0
(a) Values reported in µg/g dry sediment. Shaded cells indicate material collected within the silt lens. NA = Not applicable.

3.14
compared to the surrounding sediment. Sodium values were the least variable between the sediment fractions, with the silt lens water extracts being elevated by a factor of 2.2 to 5.8. Finally, strontium was elevated by a factor of 3.2 to 16 in water extracts from the silt lens samples. With the exception of potassium, the splitspoon core samples had cation concentrations consistent with the silt lens fractions of the archived sediment samples; reported concentrations of magnesium, calcium, strontium, and sodium were all within the range measured within the silt lens fractions from the four archived boreholes. The difference observed in the potassium concentrations in the silt lens from the archived samples versus the silt fractions contained in the splitspoon cores could be indicative of varying types of feldspar minerals in the sediments from different locations.
The Wyoming bentonite material released significantly more sodium than any of the archived sediment samples tested. Sodium release ratios from the Wyoming bentonite were elevated by a factor of 233 when compared to the archived sediment samples. This clearly confirms the anion results from the 1:1 sediment:water extract tests and further demonstrates the potential for the bentonite material to act as a source of salinity for vadose zone porewater. The cation data for the bentonite:water extracts also signals that the Wyoming bentonite is predominately sodium based material, which is a key characteristic of the material mined in the Montana-Wyoming region of the United States. Table 3.9 contains the water-extractable cation data for the sidewall core samples. All of the sidewall cores samples contained elevated concentrations of water-extractable chromium (up to 4 mg/g of sediment), nickel (as much as 1.2 mg/g), and iron (up to 6.3 mg/g); which were clearly a result of corrosion of the stainless steel well casing. Unlike the archived and splitspoon core samples tested, neither set of the sidewall core samples contained quantifiable concentrations of calcium or potassium. Further, the sidewall core samples from well 299-E25-46 did not contain quantifiable concentrations of sodium. However, the inability to
Table 3.9. Water-Extractable Cations in the Sidewall Core Samples(a)
Sample Identification
Mg (µg/g)
K (µg/g)
Ca (µg/g)
Cr (µg/g)
Na (µg/g)
Ni (µg/g)
Fe (µg/g)
299-E24-19 S04078-05A 20.8 (1) (157) 1991 453 131 495 S04078-05B 48.6 ND (211) 4112 502 311 1357 S04078-05C 40.6 ND (159) 1629 414 198 490 S04078-05C DUP 37.1 ND (167) 2062 459 185 626
299-E25-46 S04078-02 63.4 (2) (187) 2525 (17) 975 4310 S04078-03 85.7 ND (262) 3423 (18) 1272 6343 S04078-04 53.1 ND (182) 165 (19) 197 316
Equipment Blank S04078-01 (0) (1) (23) ND (5) (0) (0)
(a) Values reported in µg/g dry sediment. Parenthesis signify values are below level of quantification. ND = Not detected.

3.15
quantify calcium, potassium, and sodium in these samples was likely an artifact of instrument detection limits at the time of analysis. Given this, all of the sidewall core samples appear to have elevated magnesium content (2-6 times) when compared to similar sediment material (silt fractions) from the archived and splitspoon core samples. Additionally, the sidewall core samples from well 299-E24-19 contained on average more than 10 times as much sodium as the silt fractions from the archived and splitspoon core samples. The high sodium content of these three samples was likely contributed by the sodium-based bentonite material contained in the samples. Unlike the anion data, the high concentrations of corrosion products present in the sidewall core samples combined with the high natural sodium content of the Wyoming bentonite test samples effectively mask any potential chemical contribution due to a liquid waste plume source. 3.3.3 Derivation of Vadose Zone Porewater Chloride Concentration
The 1:1 sediment:water extract data was recalculated to derive the porewater chloride concentration of the vadose zone sediments. From knowledge of the moisture content of the sediment samples taken from the archived material, splitspoon cores, and sidewall cores, the amount of deionized water that would be needed to make the water extract exactly one part water (total of native porewater and added deionized water) to one part by weight dry sediment was determined. For the sidewall cores and Wyoming bentonite sample, a water to solid ratio of 1:3.6 was used because of the large water retention (swelling) capabilities of the bentonite. The ratio of the total volume of water in the extract to the native mass of porewater is the dilution factor. This calculation is based on the assumption that the deionized water acts solely as a diluent of the existing porewater and that the deionized water does not dissolve any of the solids in the sediments. Thus by correcting for the dilution, the actual chemical composition of the native porewater in the partially saturated vadose zone sediments can be estimated. The assumption that none of the solid is dissolved during the water extraction process is simplistic; therefore, analytical results for actual porewater collected from approximately 258 feet bgs during the installation of well 299-E24-33 were used for comparison.
Table 3.10 shows the measured chloride concentration for the perched water sample, as well as the derived porewater chloride concentration for the archived sediment samples (shown as a function of depth). The perched water sample had a measured chloride concentration of 49.5 mg/L. In comparison, the archived sediment samples had calculated chloride porewater concentrations ranging from 28.8 mg/L to 589 mg/L. However, as mentioned in Section 3.1, the archived sediment samples were subject to moisture loss via evaporation during the archival period due to improper sealing of the sample containers. Therefore, the chloride porewater concentrations for the archived samples reported in Table 3.10 do not accurately represent in-situ conditions.
Perhaps the truest measure of the potential impact of the bentonite material on the solution chemistry of vadose zone porewaters is highlighted by the chloride data in Table 3.10. The Wyoming bentonite material had a calculated chloride porewater concentration of 751 mg/L, which was more an order of magnitude greater than the measured chloride concentration in the perched water sample. Furthermore, at 751 mg/L dissolved chloride, the bentonite porewater is likely to induce pitting and crevice corrosion of the stainless steel casing, which has a chloride solution concentration threshold of 100 mg/L.
Table 3.10 also contains the calculated porewater chloride concentration for the 12 splitspoon core samples collected during the installation of new wells 299-E24-33 and 299-E25-94. Since the cores were appropriately sealed in the field, the moisture content measurements are deemed reliable, enabling use of

3.16
Table 3.10. Calculated Porewater Anion Concentrations in Archived Samples
Depth (feet bgs)
Chloride (mg/L)
299-E24-19 270 28.8 275 30.1 280 41.1 285 589
299-E24-20 270 216 275 28.4 280 156
299-E24-22 265 215 270 60.3
299-E25-46 270 468 275 406
299-E24-33 255.5 47.9 256.5 42.0 257.5 45.5 258.5 46.5
299-E25-94 270 79.6 271 Sand 113 271 Silt 99.0 272.5 114 273.5 61.8 275 55.6 276 63.2 276 Duplicate 56.1 275.5 64.8 278.5 67.1
Perched Water Sample (B19200) 258 49.5
Wyoming Bentonite NA 751
Shaded cells indicate material collected within the silt lens. NA = Not applicable.

3.17
the data for direct correlation to in-situ conditions. The average calculated porewater chloride concentration for cores from well 299-E24-33 was 45.5 mg/L, while the measured concentration in the perched water sample collected from the same well was 49.5 mg/L. Although more variability was seen in the calculated chloride concentrations for samples from well 299-E25-94, with a range extending from 55.6 to 114 mg/L dissolved chloride, the reported data are well within the range commonly observed in Hanford Site sediments.
Table 3.11 contains the calculated porewater chloride concentration of the equipment blank. Surprisingly, the equipment blank had a porewater corrected chloride concentration of 1877 mg/L (Table 3.11), which was more than an order of magnitude greater than the calculated concentration for any of the splitspoon cores samples. This result highlights one of the shortcomings of calculating porewater components using water extract data versus directly measuring porewater “squeezed” from the sediment or present in perched water. For vadose sediments with very low moisture contents, such as the equipment blank (with a measured moisture content of 0.04%), trace amounts of contamination introduced during field sampling or laboratory handling and analysis can be blown out of proportion when dilution corrections are performed. In the case of the equipment blank, the 1.5 μg/g of chloride that was measured in the samples has been corrected (multiplied) by a dilution factor of 1257. The equipment blank was “collected” in order to assess the cleanliness of the sampling protocol, which has been demonstrated in Tables 3.7 and 3.9; however, due to the low sample moisture content and high probability to create “false positives”, the data should not be used to derive in-situ porewater concentrations of dissolved species.
Table 3.11 also contains the calculated porewater chloride concentrations of the sidewall core samples. Not surprisingly, the sidewall core samples from well 299-E24-19, which were a composite of bentonite and silt lens material, had an average calculated porewater chloride concentration of 376 mg/L. This value correlates quite well with the combined average porewater corrected chloride concentration of the archived silts lens sample from that well, 299-E24-19-280, and the Wyoming bentonite material, which was 396 mg/L. The calculated porewater chloride concentrations of the sidewall core samples from well 299-E25-46 do not correlate well with any of the samples analyzed as part of this scope of work. The 299-E25-46 sidewall core sample with the least amount of dissolved chloride was sample S04078-04, with 1221 mg/L. The calculated porewater chloride concentration increases substantially with closer proximity to the casing. The intermediate sample, S04078-03, had a dissolved chloride concentration of 7388 mg/L, while the sample collected closest to the degraded casing, S04078-02, had a dissolved chloride concentration in excess of 10,000 mg/L. These samples clearly exceed the 100 mg/L dissolved chloride threshold for corrosion of stainless steel. Furthermore, the higher dissolved chloride measured in sidewall core samples from well 299-E25-46 (compared to sidewall core samples from well 299-E24-19) correlates well with the length of degraded casing in the well (4.2 feet in well 299-E25-46 versus 1.1 feet in well 299-E24-19).

3.18
Table 3.11. Calculated Porewater Anion Concentrations in Sidewall Core Samples
Sample Identification
Chloride (mg/L)
299-E24-19 S04078-05A 372 S04078-05B 405 S04078-05C 370 S04078-05C Duplicate 357
299-E25-46 S04078-02 10500 S04078-03 7388 S04078-04 1221
Equipment Blank S04078-01 1877
3.4 Carbon Analysis
The total, inorganic, and organic carbon contents of the sidewall core samples and select archived sediment samples are reported in Table 3.12. None of the samples analyzed contained appreciable quantities of carbon. All of the samples tested contained trace amounts of organic carbon, with a maximum organic carbon content of 0.1% in sample S04078-03. It is interesting to note that all of the sidewall core samples were devoid of inorganic carbon; any carbonate initially present in these samples would have been destroyed by the acidic soil pH conditions. The total carbon data reported in Table 3.12 are typical values for Hanford formation sediments and do not indicate the presence of organic contamination at either well location (299-E24-19 or 299-E25-46).
3.5 8 M Nitric Acid-Extractable Amounts of Selected Elements in Archived Vadose Zone and Sidewall Core Sediments
A subset of the samples that were characterized for water-extractable constituents was also characterized to see how much of various constituents could be leached with hot 8 M nitric acid. The quantities of select constituents in the archived vadose zone sediments and sidewall core samples that were acid extractable are shown in Tables 3.13 and 3.14. Upon comparing the acid extract data for the sidewall core samples from corroded wells 299-E24-19 and 299-E25-46 with archived sediment samples collected during the installation of these wells, most of the variation in mass leached per gram of sediment was due to the presence of corrosion products in the sidewall core samples. The sidewall core samples contained lower concentrations of common Hanford cations (calcium and magnesium), but significantly higher concentrations of typical stainless steel metals (chromium, nickel, and iron). One interesting finding was that the sidewall core samples from both wells contained up to five times more sodium than the archived samples collected from approximately the same depths, which could be an artifact of the leaching of sodium from the bentonite material contained in the samples. Alternatively, this could be a

3.19
Table 3.12. Carbon Content of the Archived and Sidewall Core Sediment Samples
Sample Identification
Total Carbon(%)
Inorganic Carbon(%)
Inorganic Carbon as CaCO3
(%)
Organic Carbon(%)
299-E24-19 (Archived Samples) 299-E24-19-275 0.16 0.11 0.90 0.05 299-E24-19-280 0.25 0.18 1.54 0.06
299-E24-19 (Sidewall Core Samples) S04078-05A 0.09 0.00 0.00 0.09 S04078-05B 0.09 0.00 0.00 0.09 S04078-05C 0.09 0.00 0.00 0.09
299-E25-46 (Archived Samples) 299-E24-46-270 0.17 0.15 1.28 0.02 299-E24-46-275 0.16 0.10 0.87 0.06
299-E25-46 (Sidewall Core Samples) S04078-02 0.09 0.00 0.00 0.09 S04078-03 0.10 0.00 0.00 0.10 S04078-04 0.05 0.00 0.00 0.05
Equipment Blank S04078-01 0.02 0.00 0.00 0.02
Table 3.13. Acid-Extractable Cations in Archived Vadose Zone Sediments(a)
Sample Identification
Al (µg/g)
Ca (µg/g)
Cr (µg/g)
Fe (µg/g)
Mg (µg/g)
Ni (µg/g)
Na (µg/g)
299-E24-19 270 7288 6847 15 11554 5089 19 284 275 6502 6651 14 11748 5178 19 283 280 24090 11506 42 33542 12261 39 655 280 Duplicate 22284 11256 40 31851 11837 36 507 285 8135 7823 16 17841 5501 19 360
299-E25-46 270 6731 7324 14 12527 5,298 19 243 275 16934 9677 34 25233 10,278 32 553
(a) Values report in µg/g dry sediment. Shaded cells indicate material collected within the silts lens.

3.20
Table 3.14. Acid-Extractable Cations in Sidewall Core Sediment Samples (µg/g dry sediment)
Sample Identification
Al (µg/g)
Ca (µg/g)
Cr (µg/g)
Fe (µg/g)
Mg (µg/g)
Ni (µg/g)
Na (µg/g)
299-E24-19 S04078-05A 3080 642 4116 40095 1176 1,483 881 S04078-05B 2146 261 3967 29372 1132 2,042 1,045 S04078-05C 3096 439 3573 38213 8710 753 540 S04078-05C Duplicate 2802 487 4359 40401 650 906 3,097
299-E25-46 S04078-02 4426 458 6178 48142 378 795 1,817 S04078-03 2996 511 7308 50930 563 957 3,050 S04078-04 16383 2450 1790 40089 527 965 3,116
Equipment Blank S04078-01 42 72 (0) (266) (12) (0) 103
Parenthesis indicate reported value was below the limit of quantification for the analysis significant finding because Hanford waste streams are typically dominated by sodium and nitrate, both of which have been measured at higher concentrations in the sidewall core samples than any of the other samples/materials tested.
It is apparent from the data in Tables 3.13 and 3.14 that a combination of the sodium and common corrosion cations and acid solution conditions created an exchange/leaching front and removed/pushed the calcium and magnesium off the sediment. For example, sample S04078-04 (which was primarily composed of silt lens material) contained 25% of the acid extractable calcium and only 5% of the extractable magnesium present in the archived silt lens material from approximately the same depth in the well (299-E25-46-275). Acid-extractable concentrations of common corrosion cations were elevated in the sidewall core samples compared to the archived sediment samples by as much as a factor of 2 for iron, a factor of 100 for nickel, and nearly a factor of 200 for chromium. These results clearly indicate the sidewall core samples contain metals that were a byproduct of the breakdown of the stainless steel well casing. 3.6 Technetium-99 Analysis of Sidewall Core Samples
Due to the potential Hanford waste stream signature observed in the water extracts from the sidewall core samples (elevated sodium and nitrate), a decision was made to analyze all of the water extracts for technetium-99. Technetium-99 is a mobile constituent in Hanford waste streams, and its presence in extracts from any of the samples would be confirmation that the chemistry of the samples has been affected by Hanford liquid waste such as tank liquor. Analysis of water extracts from all of the archived and splitspoon core samples returned less than detectable concentrations of technetium-99. In this case, the method/instrument detection limit was <0.085 pCi technetium-99/g of soil. Additionally, technetium-99 was not detected in the perched water sample, which was from a well located up gradient of the two corroded wells. However, as seen in Table 3.15, the sidewall core samples contained technetium-99 in

3.21
Table 3.15. Technetium-99 Activity in the Sidewall Core Samples
Sample Identification
99Tc (pCi/g)
99Tc (pCi/L)
299-E24-19 S04078-05A 4.52 1444 S04078-05B 13.7 4547 S04078-05C 5.60 1885 S04078-05C Duplicate 5.83 1968
299-E25-46 S04078-02 17.9 4815 S04078-03 21.9 6988 S04078-04 (0.984) (259)
Equipment Blank S04078-01 <0.835 <848
Less than symbol indicates the instrument returned a negative value. Parenthesis indicate the reported value is below the limit of quantification.
concentrations ranging from 4.5 to more than 20 pCi technetium-99/g of soil. These technetium-99 concentrations are similar to those from borehole samples collected in the vicinity of waste tanks C-105 and BX-102, which were analyzed as part of the CH2M-Hill Hanford Group’s Vadose Zone Project and had peak technetium-99 concentrations of 5.84 and 15.2 pCi/g, respectively. For comparison, the highest technetium-99 sediment concentration measured to date has been in samples collected from the slant borehole beneath tank SX-108, which had a peak technetium-99 concentration of 10,300 pCi/g.
Recent groundwater samples collected from wells 299-E24-19 and 299-E25-46 contained measurable quantities of technetium-99. The sample collected from well 299-E24-19 contained 114 pCi/L technetium-99 while the sample from well 299-E25-46 contained 375 pCi/L technetium-99. While both of these concentrations are considerably lower than the current drinking water standard for technetium-99 (900 pCi/L), they indicate that a technetium-99 source is present in the area and has led the contamination of groundwater underlying WMA A-AX. Table 3.15 contains the calculated porewater technetium-99 concentration of the sidewall core samples. The calculated technetium-99 concentrations in the sidewall core samples (which were collected 12 feet [299-E25-46] and 20 feet [299-E24-19] above the water table) are 10 to 40 times higher than those measured in the groundwater. Although it is not possible to say to say the technetium-99 in the vadose zone at these two well sites is part of the same “plume” observed in the recent groundwater samples, activities do correlate in that the well with the most contaminated sidewall core vadose zone samples (299-E25-46) also had the highest groundwater activity.
Comparison of the technetium-99 to nitrate ratios in the sidewall cores samples indicates that the contamination is likely from multiple sources. The sidewall core samples from well 299-E24-19 had an average nitrate to technetium-99 ratio of 6.43E+05 (μg nitrate/μg technetium-99), while the sidewall core samples from well 299-E25-46 had an average nitrate to technetium-99 ratio of 1.01E+07 (μg nitrate/ μg technetium-99). For comparison, the average nitrate to technetium-99 ratio in contaminated cores and

3.22
grab samples from borehole C4297 (collected adjacent to tank C-105) was 2.17E+05 (μg nitrate/ μg technetium-99), while the average nitrate to technetium-99 ratio in contaminated cores and grab samples from C4191 (216-B-26 Trench) was 1.40E+06 (μg nitrate/μg technetium-99). As seen in Figure 1.1, well 299-E24-19 is located northwest from well 299-E25-46, and both wells are located to the south of the 241-A Tank Farm. The groundwater flow in WMA A-AX is east-southeast, which puts well 299-E24-19 directly up gradient of well 299-E25-46. However, based on the information reported in Wood et al. (2003), the silt lens, which was the point in the vadose zone where the casing corrosion occurred, is nearly horizontal in the region of interest. The total calculated elevation drop of the top of the silt lens between wells 299-E25-46 (420.2 feet above mean sea level) and 299-E24-19 (414.4 feet above mean sea level) is less than 6 feet over a distance of more than 225 feet. Based on this, it is difficult to identify the source of the vadose zone contamination. It is possible that the silt lens acted as a hydrologic boundary and facilitated the lateral migration of a liquid waste plume. Additionally, the disparity in the nitrate to technetium-99 ratios seen between the sidewall core samples from the two wells could possibly be explained by a leak/discharge of high nitrate containing waste from the 242-A Evaporator, which lies directly northeast of well 299-E25-46. Under this scenario, the two waste streams could have commingled to create the high nitrate to technetium-99 ratio measured in the sidewall core samples from well 299-E25-46. Either way, technetium-99 contamination is present in the vadose zone and groundwater beneath WMA A-AX and components of the waste plume could have adversely impacted the casing in wells 299-E19-24 and 299-E25-46.
4.1
4.0 Summary and Conclusions
In this section, we present summary information on our interpretation of the archived, sidewall, and splitspoon core sediment characterization data. Conclusions are included to aid in making decisions on what interim actions and practices are needed prior to installation of new groundwater monitoring wells.
4.1 Archived Sediment Samples
The archived sediment samples, collected during installation of the four RCRA monitoring wells (299-E24-19, 299-E24-20, 299-E24-22, and 299-E25-46) were examined to provide baseline characterization data for the study. Analysis of the samples did not result in the identification of any constituents at concentrations that greatly exceed those typically measured in uncontaminated Hanford sediments. Since the primary focus of this study was the investigation of well casing failure, special emphasis was placed on determining the chloride content of all sediment samples. The eleven archived samples from the RCRA monitoring wells had calculated porewater chloride concentrations ranging from 28 to almost 600 mg/L. However, due to sample preservation problems, the measured moisture content of the samples was artificially low and resulted in an exaggeration of the true porewater chloride concentration. Therefore, it is unlikely that any of the archived sediment samples tested could generate porewaters with a sufficient chloride content to initiate corrosion of the well casing, which under typical Hanford geochemical conditions occurs when dissolved chloride exceeds 100 mg/L.
4.2 Bentonite Material
A sample of Enviroplug® #8 high swelling Wyoming bentonite was characterized for its potential to generate porewaters of sufficient salinity to lead to accelerated corrosion of type 304L stainless steel. Overall, the bentonite sample had considerably higher water extractable concentrations of sodium, chloride, fluoride, sulfate, and alkalinity (measured as calcium carbonate). Interpretation of the laboratory data indicated that the Wyoming bentonite test sample was capable of generating localized vadose zone porewater with chloride concentrations in excess of 700 mg/L. However, the vadose zone at Hanford is primarily composed of coarse-grained sands with an in situ moisture content ranging from 5 to 12%. Therefore, it is doubtful enough moisture will be available throughout the majority of the vadose zone to sufficiently “wet” the bentonite and leach chloride from the material. Consequently, Wyoming bentonite material should be suitable as an annulus filling agent in all low-moisture zones and those regions that lack the potential to accumulate perched water.
4.3 Sidewall Core Samples
Two sampling efforts were conducted to collect material from the zone of corrosion in the two decommissioned wells. The sample collected from well 299-E24-19 was broken into three aliquots that represented replicates of the same sample. The material collected from well 299-E25-46 was split into three aliquots that represented a lateral profile of the vadose zone in the region of corrosion (extended from the degraded casing wall into the surrounding vadose zone sediment. Characterization and analysis of these samples resulted in several key findings that significantly affect the outcome of this study. All of the sidewall core samples generated water extract solutions with an acidic pH (1.8-2.5), which was likely a result of the hydrolysis of metals during the breakdown/corrosion of the well casing. Additionally, the sidewall core samples from well 299-E24-19 were elevated with respect to water extractable sodium,

4.2
while the sidewall core samples from well 299-E25-46 contained significantly elevated concentrations of water extractable nitrate. Since both sodium and nitrate are common components in Hanford waste streams, the water extract samples were further analyzed for technetium-99. Surprisingly, the sidewall core samples from both failed wells contained measurable quantities of technetium-99 (ranging from 0.984 to 21.9 pCi/g). These findings, when coupled with groundwater monitoring data, clearly demonstrate that the vadose zone/groundwater chemistry in the vicinity of the two failed wells has been affected/compromised by a Hanford waste stream.
The sidewall core samples from well 299-E24-19, which were comprised of a mixture of bentonite and silt lens material, had an average porewater chloride concentration of 376 mg/L. The sidewall core samples collected from well 299-E25-46 had calculated porewater chloride concentrations ranging from 1,200 to more than 10,000 mg/L. Clearly, the sidewall core samples tested were capable of generating porewaters with sufficient chloride concentrations to cause corrosion of the stainless steel well casing. Furthermore, analysis of the sidewall core samples yielded a clear relationship between chloride concentration and well casing corrosion. The sidewall core samples containing the greatest amount of chloride, 3000 μg/g of sediment, came from the well that experienced the longest length of casing failure (4.2 feet in well 299-E25-46). All of the sidewall core samples tested from both decommissioned wells contained more chloride than the Wyoming bentonite test material; however, as previously noted, the bentonite material tested was that which was commercially available at the time of this study and therefore, does not necessarily represent the bentonite material used during the installation of these wells. Since chloride was present as a trace constituent in all of the sidewall core samples (less than 0.4 weight percent), it is possible that it could have been introduced to the system as a “contaminant” contained in the bentonite backfill material. Therefore, it is likely that chloride leached from the bentonite material and/or chloride carried as a constituent of the liquid waste stream caused the advanced well casing corrosion found at wells 299-E24-19 and 299-E25-46 via crevice corrosion and stress corrosion cracking.
4.4 Splitspoon Core Samples
Twelve splitspoon core samples, collected during the installation of new RCRA monitoring wells (299-E24-33 and 299-E25-94) were characterized to further assess the current vadose zone geochemical conditions in WMA A-AX. Again, analysis of these samples yielded only “standard” Hanford sediment constituents at concentrations typically observed in uncontaminated vadose zone samples. Two of the cores from well 299-E25-94 that contained coarse-grained material (271-Sand and 272.5), had calculated porewater chloride concentrations of 113 and 114 mg/L, respectively. Although the dissolved chloride concentrations in both of these samples exceed the 100 mg/L threshold value for type 304L stainless steel, it is doubtful that concentrations at these levels could lead to the advanced corrosion found in wells 299-E24-19 and 299-E25-46.
4.5 Perched Water Sample
A perched water sample collected during the recent installation of a replacement RCRA groundwater monitoring well (299-E24-33) was used as a baseline measurement of the current vadose zone geochemical conditions in WMA A-AX. Detailed analysis of this sample indicated that it was composed of typical major Hanford groundwater constituents (calcium, magnesium, and sulfate), with a dissolved chloride concentration of 49.5 mg/L. These results further support the assessment that the archived sediment samples were compromised via moisture loss during storage and therefore are not suitable for estimating the true porewater concentration of chemical constituents.

5.1
5.0 Recommendations
Based on the findings of this study, we recommend that an alternate material be used to seal off the void space in the annulus around the steel casings of newly completed wells, particularly in regions of finer-grained materials, capable of acting as a perching zone, and in other areas with high moisture contents. We performed duplicate 1:1 water extracts on Portland cement (we tested both a cement slurry and a cured cement block) and analyzed the leachant for total chloride concentration. The data presented in Table 5.1 show the average amount (μg) of chloride extracted from the duplicate cement samples as a function of sample weight (g); the chloride water extract data for the Wyoming bentonite sample presented in Section 3.3.2 has been added for direct comparison. The two sets of cement samples (slurry and solid) contained 10 to 20 times less water-extractable chloride than the Wyoming bentonite test material. The data was converted to show a potential porewater chloride concentration for the three materials assuming a 25 percent saturation state. Total calculated porewater chloride solution concentrations ranged from a low of 12.2 mg/L for the cement slurry to a high of 296 mg/L for the Wyoming bentonite sample.
This result clearly illustrates the potential for the Wyoming bentonite material to generate solutions with sufficient chlorinity (greater than 100 mg/L) to initiate corrosion of stainless steel under ambient Hanford subsurface conditions (pH 7.5-8). Conversely, all of the cement samples tested generated porewater solutions containing dissolved chloride at concentrations well under the 100 mg/L corrosion threshold. Further, chloride attack of stainless steel is very sensitive to the pH of fluids in contact with stainless steel; in fact, the chloride corrosion resistance of type 304L stainless steel at the high pH conditions generated by fresh Portland cement (pH= ~12.5) could be in excess of 10,000 mg/L Cl (Sedriks 1996). Therefore, we recommend using Portland cement as an annulus sealing agent in groundwater monitoring wells in zones with high moisture contents or that have the potential to accumulate perched water.
Table 5.1. Chloride Content of Sealing Agents
Sealing Material
Porewater Chloride (mg/L)
Chloride Solid (µg/g)
Wyoming Bentonite 296 71.9 Cement Slurry 12.2 3.04 Cement Solid 29.4 7.36

6.1
6.0 References
American Society of Agronomy (ASA). 1996. Methods of Soil Analysis-Part 3, Chemical Methods, SSSA Book Series 5, ed. DL Sparks, Soil Science Society of America, Madison, Wisconsin.
American Society for Testing and Materials (ASTM) D4129-88. 1988. Standard Test Method for Total and Organic Carbon in Water by High Temperature Oxidation and by Coulometric Detection. American Society for Testing and Materials, West Conshohocken, Pennsylvania.
American Society for Testing and Materials (ASTM) D2216-98. 1998. Test Method for Laboratory Determination of Water (Moisture) Content of Soil and Rock by Mass. American Society for Testing and Materials, West Conshohocken, Pennsylvania.
DOE Order 5400.1, General Environmental Protection Program. EPA Method 300.0A. 1984. Test Method for the Determination of Inorganic Anions in Water by Ion Chromatography. EPA-600/4-84-017, U.S. Environmental Protection Agency, Washington, D.C.
EPA Method 3050B. 2000a. “Acid Digestion of Sediments, Sludges, and Soils.” Test Methods for Evaluating Solid Waste, Physical/Chemical Methods. EPA Publication SW-846, [Online manual]. Available URL: http://www.epa.gov/epaoswer/hazwaste/test/sw846.htm
EPA Method 6010B. 2000b. “Inductively Coupled Plasma-Atomic Emission Spectrometry.” Test Methods for Evaluating Solid Waste, Physical/Chemical Methods. EPA Publication SW-846, [Online manual]. Available URL: http://www.epa.gov/epaoswer/hazwaste/test/sw846.htm
EPA Method 6020. 2000c. “Inductively Coupled Plasma-Mass Spectrometry.” Test Methods for Evaluating Solid Waste, Physical/Chemical Methods. EPA Publication SW-846, [Online manual]. Available URL: http://www.epa.gov/epaoswer/hazwaste/test/sw846.htm
Hartman MJ, LF Morasch, and WD Webber (eds.). 2004. Hanford Site Groundwater Monitoring for Fiscal Year 2002. PNNL-14548, Pacific Northwest National Laboratory, Richland, Washington.
Lacombe P, B Baroux, G Beranger. 1993. Stainless Steels. Les Editions de Physique Les Ulis, Paris.
Lindenmeier CW, RJ Serne, BN Bjornstad, GW Gee, HT Schaef, DC Lanigan, MJ Lindberg, RE Clayton, VL LeGore, IV Kutnyakov, SR Baum, KN Geiszler, MM Valenta, and TS Vickerman. 2002. Characterization of Vadose Zone Sediment: RCRA Borehole 299-E33-338 Located Near the B-BX-BY Waste Management Area. PNNL-14121, Pacific Northwest National Laboratory, Richland, Washington.
RCRA – Resource Conservation and Recovery Act. 1976. Public Law 94-580, as amended, 90 Stat. 2795, 42 USC 6901 et seq.
Rhoades JD. 1996. “Salinity: Electrical Conductivity and Total Dissolved Solids.” In Methods of Soil Analysis Part 3, JM Bigham (ed.), pp. 417-435. American Society of Agronomy, Madison, Wisconsin.
Sedriks AJ. 1996. Corrosion of Stainless Steel. John Wiley & Sons, Inc., New York.

6.2
Serne RJ, HT Schaef, BN Bjornstad, BA Williams, DC Lanigan, DG Horton, RE Clayton, VL LeGore, MJ O'Hara, CF Brown, KE Parker, IV Kutnyakov, JN Serne, AV Mitroshkov, GV Last, SC Smith, CW Lindenmeier, JM Zachara, and DB Burke. 2002. Characterization of Uncontaminated Vadose Zone Sediment from the Hanford Reservation - RCRA Borehole Core Samples and Composite Samples. PNNL-13757-1, Pacific Northwest National Laboratory, Richland, Washington.
Serne RJ, BN Bjornstad, DG Horton, DC Lanigan, CW Lindenmeier, MJ Lindberg, RE Clayton, VL LeGore, RD Orr, IV Kutnyakov, SR Baum, KN Geiszler, MM Valenta, and TS Vickerman. 2004a. Characterization of Vadose Zone Sediments Below the TX Tank Farm: Boreholes C3830, C3831, C3832 and RCRA Borehole 299-W10-27. PNNL-14594, Pacific Northwest National Laboratory, Richland, Washington.
Serne RJ, BN Bjornstad, DG Horton, DC Lanigan, CW Lindenmeier, MJ Lindberg, RE Clayton, VL LeGore, RD Orr, IV Kutnyakov, SR Baum, KN Geiszler, MM Valenta, TS Vickerman and H. Schaef. 2004b. Characterization of Vadose Zone Sediments Below the T Tank Farm: Boreholes C4104, C4105, 299-W10-196 and RCRA Borehole 299-W11-39. PNNL-14849, Pacific Northwest National Laboratory, Richland, Washington.
USGS (U.S. Geological Survey). 2001. “Alkalinity and Acid Neutralizing Capacity.” National Field Manual for the Collection of Water-Quality Data, 2nd edition, SA Rounds and FD Wilde (eds.), Washington, D.C.
Wood MI, TE Jones, BN Bjornstad, DG Horton, SM Narbutovskih, and R Schalla. 2003. Subsurface Conditions Description of the C and A-AX Waste Management Area. RPP-14430, CH2M HILL Hanford Group, Inc., Richland, Washington.

PNNL-15141
Distr.1
Distribution No. of Copies OFFSITE Dr. Harry Babad 2540 Cordoba Court Richland, WA 99352-1609 Dirk A. Dunning Oregon Office of Energy 625 Marion Street NE Salem, OR 97301-3742 Dr. Daniel I. Kaplan Westinghouse Savannah River Company Building 774-43A, Room 215 Aiken, SC 29808 Phil Reed U.S. Nuclear Regulatory Commission Office of Nuclear Regulatory Research Division of Systems Analysis and Regulatory Effectiveness Radiation Protection, Environmental Risk, and Waste Management Branch Mail Stop: T9-F31 Washington, DC 20555-0001 Tom Stoops, LPG Oregon Office of Energy Nuclear Safety Division 625 Marion Street NE Salem, OR 97303 Mr. Ronald G. Wilhelm Office of Radiation and Indoor Air 401 M Street, S.W. Mail Code 6603J Washington, DC 20460
No. of Copies W. Alexander Williams U.S. Department of Energy Office of Environmental Restoration EM-33 19901 Germantown Road Germantown, MD 20874-1290 ONSITE 8 DOE Richland Operations Office B. L. Foley A6-38 J. P. Hanson A5-13 R. D. Hildebrand A6-38 K. A. Kapsi A5-13 J. G. Morse A6-38 K. M. Thompson A6-38 DOE Public Reading Room (2) H2-53 4 DOE Office of River Protection P. E. LaMont H6-60 R. W. Lober H6-60 S. A. Wiegman H6-60 R. B. Yasek H6-60 16 CH2M HILL Hanford Group, Inc. F. J. Anderson E6-35 R. Calmus H6-05 M. P. Connelly E6-35 T. E. Jones E6-35 A. J. Knepp H6-60 J. E. Laurenz H6-62 F. M. Mann (5) E6-35 W. J. McMahon E6-35 D. A. Myers (3) E6-35 G. Parsons H6-19 Fluor Federal Services R. Khaleel E6-17

Distr.2
No. of Copies 6 Fluor Hanford, Inc. M. W. Benecke E6-35 T. W. Fogwell E6-35 B. H. Ford E6-35 J. G. Hogan H1-11 V. G. Johnson E6-35 M. I. Wood H8-44 S.M. Stoller R. G. McCain B2-62 2 U.S. Environmental Protection Agency N. Ceto B5-01 D. A. Faulk B5-01 5 Washington State Department of Ecology S. Dahl-Crumpler H0-57 J. A. Caggiano H0-57 F. Hodges H0-57 B. Rochette H0-57 J. Yokel H0-57
No. of Copies 35 Pacific Northwest National Laboratory B. N. Bjornstad K6-81 T. M. Brouns K9-69 C. F. Brown (10) P7-22 K. J. Cantrell K6-81 W. J. Deutsch K6-81 P. E. Dresel K6-96 K. M. Geiszler P7-22 M. J. Fayer K9-33 M. D. Freshley K9-33 J. S. Fruchter K6-96 D. G. Horton K6-81 K. M. Krupka K6-81 G. V. Last K6-81 M. J. Lindberg P7-22 W. J. Martin K6-81 C. J. Murray K6-81 S. M. Narbutovskih K6-96 S. P. Reidel K6-81 R. J. Serne P7-22 H. T. Schaef K6-81 W. Um P7-22 B. A. Williams (3) K6-81 Hanford Technical Library (2) P8-55


![INDEX [] · Web viewAll wells must be cased according to current industry standards published by the API in "5CT Specification for Casing and Tubing" and the casing thread compound](https://img.pdfslide.us/doc/110x75/5afed4d87f8b9a944d8f8055/index-viewall-wells-must-be-cased-according-to-current-industry-standards-published.jpg)