Embed Size (px)
Citation preview
Investigation 13 S153
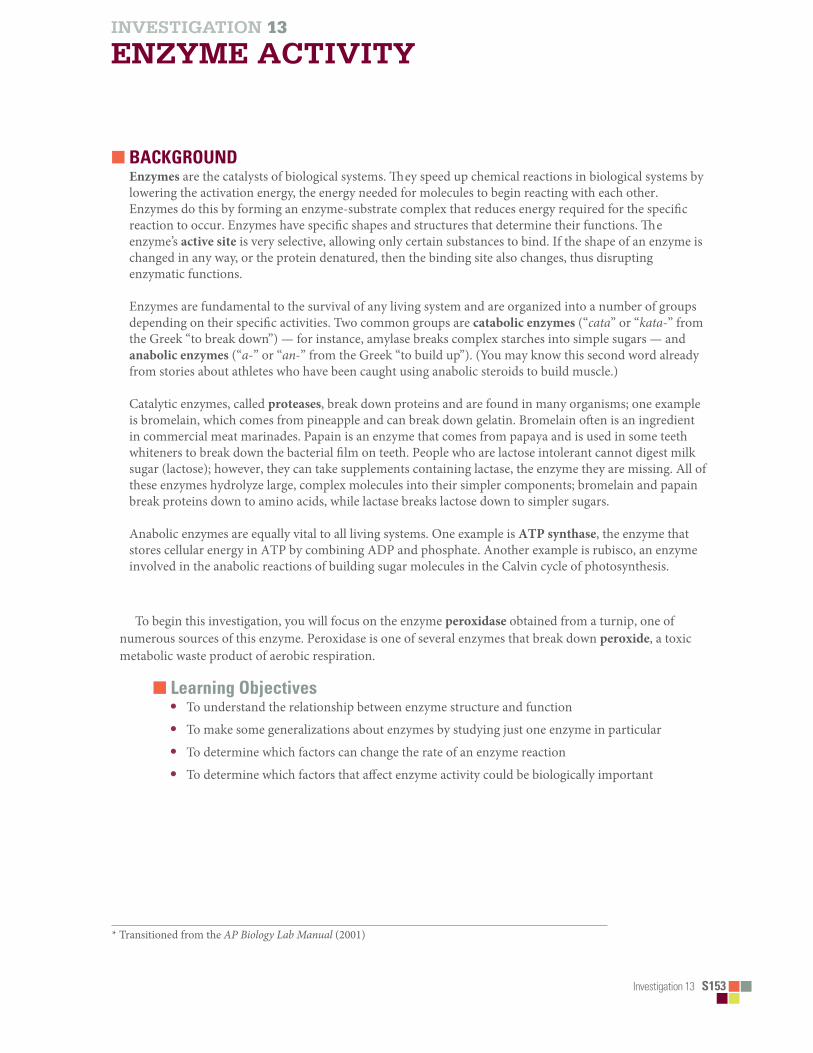
INVESTIGATION 13
ENZYME ACTIVITY
! BACKGROUNDEnzymes are the catalysts of biological systems. !ey speed up chemical reactions in biological systems bylowering the activation energy, the energy needed for molecules to begin reacting with each other.Enzymes do this by forming an enzyme-substrate complex that reduces energy required for the speci"creaction to occur. Enzymes have speci"c shapes and structures that determine their functions. !eenzyme’s active site is very selective, allowing only certain substances to bind. If the shape of an enzyme ischanged in any way, or the protein denatured, then the binding site also changes, thus disruptingenzymatic functions.
Enzymes are fundamental to the survival of any living system and are organized into a number of groupsdepending on their speci"c activities. Two common groups are catabolic enzymes (“cata” or “kata-” fromthe Greek “to break down”) — for instance, amylase breaks complex starches into simple sugars — andanabolic enzymes (“a-” or “an-” from the Greek “to build up”). (You may know this second word alreadyfrom stories about athletes who have been caught using anabolic steroids to build muscle.)
Catalytic enzymes, called proteases, break down proteins and are found in many organisms; one exampleis bromelain, which comes from pineapple and can break down gelatin. Bromelain o#en is an ingredientin commercial meat marinades. Papain is an enzyme that comes from papaya and is used in some teethwhiteners to break down the bacterial "lm on teeth. People who are lactose intolerant cannot digest milksugar (lactose); however, they can take supplements containing lactase, the enzyme they are missing. All ofthese enzymes hydrolyze large, complex molecules into their simpler components; bromelain and papainbreak proteins down to amino acids, while lactase breaks lactose down to simpler sugars.
Anabolic enzymes are equally vital to all living systems. One example is ATP synthase, the enzyme thatstores cellular energy in ATP by combining ADP and phosphate. Another example is rubisco, an enzymeinvolved in the anabolic reactions of building sugar molecules in the Calvin cycle of photosynthesis.
* Transitioned from the AP Biology Lab Manual (2001)
To begin this investigation, you will focus on the enzyme peroxidase obtained from a turnip, one of numerous sources of this enzyme. Peroxidase is one of several enzymes that break down peroxide, a toxic metabolic waste product of aerobic respiration.
! Learning Objectives• To understand the relationship between enzyme structure and function• To make some generalizations about enzymes by studying just one enzyme in particular• To determine which factors can change the rate of an enzyme reaction• To determine which factors that a%ect enzyme activity could be biologically important

Investigation 13 S155
! Key VocabularyBaseline is a universal term for most chemical reactions. In this investigation the term is used to establish a standard for a reaction. T h us, when manipulating components of a reaction (in this case, substrate or enzyme), you have a reference to help understand what occurred in the reaction. T h e baseline may vary with di%erent scenarios pertinent to the design of the experiment, such as altering the environment in which the reaction occurs. In this scenario, di%erent conditions can be compared, and the e%ects of changing an environmental variable (e.g., pH) can be determined.Rate can have more than one applicable de"nition because this lab has two major options of approach, i.e., using a color palette and/or a spectrophotometer to measure percent of light absorbance. When using a color palette to compare the change in a reaction, you can infer increase, decrease, or no change in the rate; this inference is usually called the relative rate of the reaction. When using a spectrophotometer (or other measuring devices) to measure the actual percent change in light absorbance, the rate is usually referred to as absolute rate of the reaction. In this case, a speci"c amount of time can be measured, such as 0.083 absorbance/minute.
! THE INVESTIGATIONS
! Getting Started
! Procedure 1: Developing a Method for Measuring Peroxidase in Plant Material and Determining a Baseline
Peroxide (such as hydrogen peroxide) is a toxic byproduct of aerobic metabolism. Peroxidase is an enzyme that breaks down these peroxides. It is produced by most cells in their peroxisomes.
T e general reaction can be depicted as follows: Enzyme + Substrate --> Enzyme-Substrate Complex --> Enzyme + Product(s) + &G
For this investigation the speci"c reaction is as follows:
Peroxidase + Hydrogen Peroxide --> Complex --> Peroxidase + Water + Oxygen
2H2O2 ' 2H2O + O2 (gas)
Notice that the peroxidase is present at the start and end of the reaction. Like all catalysts, enzymes are not consumed by the reactions. To determine the rate of an

S156 Investigation 13
3p4
enzymatic reaction, you must measure a change in the amount of at least one speci"c substrate or product over time. In a decomposition reaction of peroxide by peroxidase (as noted in the above formula), the easiest molecule to measure would probably be oxygen, a "nal product. !is could be done by measuring the actual volume of oxygen gas released or by using an indicator. In this experiment, an indicator for oxygen will be used. !e compound guaiacol has a high a(nity for oxygen, and in solution, it binds instantly with oxygen to form tetraguaiacol, which is brownish in color. !e greater the amount of oxygen gas produced, the darker brown the solution will become.
Qualifying color is a di(cult task, but a series of dilutions can be made and then combined on a palette, which can represent the relative changes occurring during the reaction. A color palette/chart ranging from 1 to 10 (Figure 1) is su(cient to compare relative amounts of oxygen produced. Alternatively, the color change can be recorded as a change in absorbency using a variety of available meters, such as a spectrophotometer or a probe system. (Information about the use of spectrophotometers and/or probe systems is found in the Additional Information section of this investigation.)
Figure 1. Turnip Peroxidase Color Chart

Investigation 13 S157
Materials• Timer• 1, 5, and 10 mL graduated pipettes,
pipette pumps, or syringes (1, 2, 5, and10 mL)
• Turnip peroxidase• 0.1% hydrogen peroxide• Guaiacol• Distilled (deionized) water• 2 test tubes (approximately 16 x 150
mm) and appropriate test tube rack
Step 1 Using two 16 x 150 mm test tubes, mark one “substrate” and the other tube “enzyme.” To the substrate tube, add 7 mL of distilled water, 0.3 mL of 0.1 percent hydrogen peroxide, and 0.2 mL guaiacol for a total volume of 7.5 mL. Cover the test tube with a piece of Parafilm® and gently mix.
Step 2 To the enzyme tube, add 6.0 mL of distilled water and 1.5 mL of peroxidase for a total volume of 7.5 mL. Cover the test tube with a piece of Para"lm and gently mix.
Step 3 READ STEP 4 BEFORE DOING THIS STEP!!! Combine the contents of the two tubes (subtrate and enzyme) in another 16 x 150 ml test tube, cover the tube with Parafilm, invert twice to mix, and place the tube in a test tube rack. Immediately begin timing the reaction.
Step 4 Observe the color change for the next 5 minutes. Rotate the tube before each reading. Record the observed color at 0, 1, 2, 3, 4, and 5 minutes. (A cell phone and/or camera are excellent ways to record color change.)
Step 5 Use the color palette/chart (Figure 1) to help you quantify changes in color over time. Graph your data using Google Sheets. Consider the following questions before you proceed to the next experiment:
• You measured the color change at di%erent times. Which time will you use for your later test? Why?(!e time/color change that you select will serve as your baseline for additional investigations.)
o Time: ______________
• When you use this assay to assess factors that change enzyme activity, which components of the assaywill you change? Which will you keep constant?

S158 Investigation 13
3p4
! Procedure 2: Determining the Effect of pH on EnzymaticActivity
Numerous variables can be employed to observe the e%ects on the rate of an enzymaticreaction and possibly the speci"c "t of the enzyme with the substrate.• What do you predict will occur if the pH in the reaction changes? How do you justify
your prediction?
Materials• Turnip peroxidase• 0.1% hydrogen peroxide• Guaiacol• Bu%ers with range of pH• Distilled (deionized) water• 12 test tubes (approximately 16 x
150 mm) and appropriate test tuberack
• Timer• 1, 5, and 10 mL graduated pipettes,
pipette pumps, or syringes (1, 2, 5,and 10 mL)
Step 1 Using clean 16 x 150 mL test tubes, make six sets of pairs of original substrate and enzyme tubes for a total of 12 tubes or 6 pairs. !is time you will substitute a di%erent pH buffer for the distilled water used in the original enzyme tubes. Prepare the tubes as follows and be sure to label them.• For each substrate tube in a pair, add 7 mL of distilled water, 0.3 mL of hydrogen
peroxide, and 0.2 mL of guaiacol for a total volume of 7. 5 mL.• For each enzyme tube in the pair, add 6.0 mL of a speci"c pH solution and 1.5 mL of
peroxidase for a total volume of 7.5 mL. For example, in the enzyme tube of the "rstpair, you can substitute 6.0 mL of bu%er solution of pH 3 for the distilled water; inthe enzyme tube of the second pair, you can substitute 6.0 mL of bu%er solution ofpH 5 for the distilled water, and so forth.
• Cover each test tube with a piece of Para"lm, and gently mix.
Step 2 Combine the substrate and enzyme tubes for all six pairs (total volume 15.0 mL per pair), cover with Para"lm, gently mix, and place the tubes back in the test tube rack. Immediately begin timing the reactions. (You may do each separately if necessary.
Step 3 Record the observed color for each tube at 0 minutes and again at the time you chose based on your results in Procedure 1. (Again, a cell phone and/or camera are excellent ways to record color change.)

Investigation 13 S159
Step 4 Use the palette/color chart (Figure 1) to help you quantify the changes you observe. Graph your data as color intensity versus pH. What conclusions can you draw from your results?
! Analyzing ResultsFrom the data that you collected from your independent investigation, graph the results. Based on thegraph and your observations, compare the e%ects of biotic and abiotic environmental factors on therate(s) of enzymatic reactions and explain any di%erences.
1 . Is the peroxidase/hydrogen peroxide enzyme reaction anabolic or catabolic? Explain.
2 . What was the purpose of adding the guaiacol to the reaction?
3 . What was the purpose of establishing a baseline for the reaction?
4 . When examining the rate of the enzyme-substrate reaction, when was the reaction occuring most rapidly? Why? What happened as the reaction continued?
5 . Suppose you were investigating a different enzyme-substrate reaction and knew little about the enzyme. Through experimentation you determined that the enzyme functioned most effectively at a pH of 3. What might this suggest about the enzyme?
6 . Enzymes have proven to have many uses in commercial applications, including household uses. Give one example of how enzymes might be used in a household application. (Give details on how it's being used, don't just say "as a cleaner".)
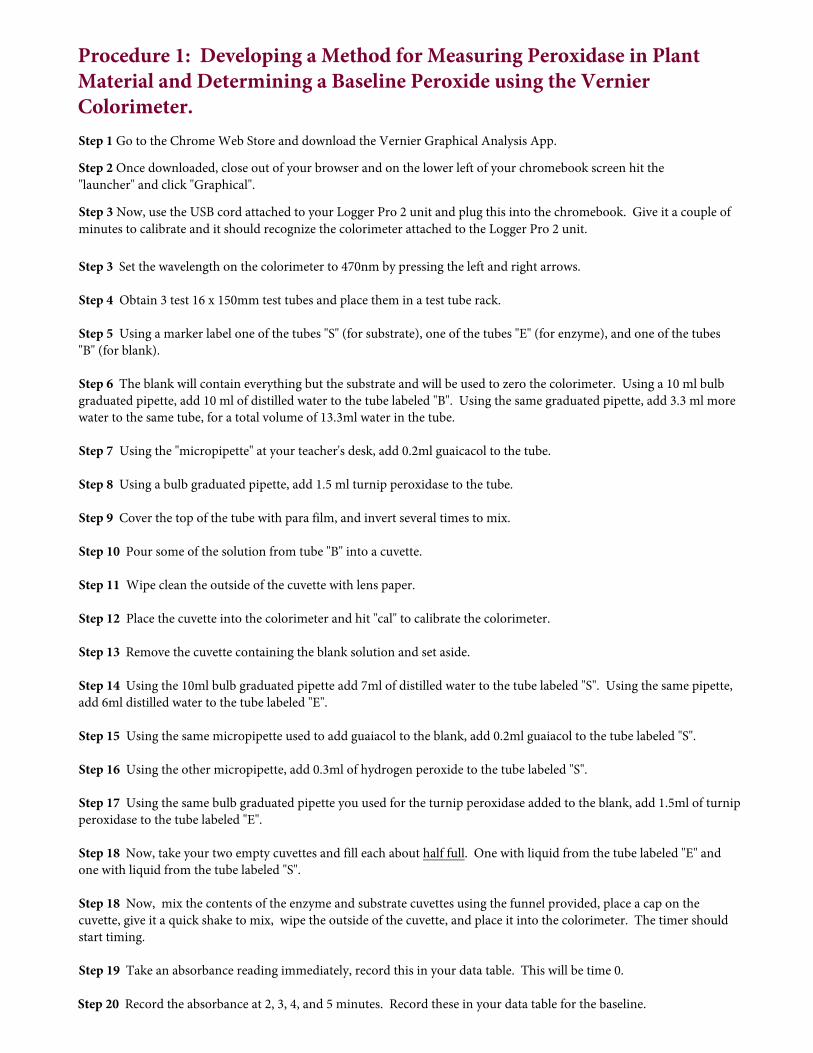
Procedure 1: Developing a Method for Measuring Peroxidase in Plant Material and Determining a Baseline Peroxide using the Vernier Colorimeter.Step 1 Go to the Chrome Web Store and download the Vernier Graphical Analysis App.
Step 2 Once downloaded, close out of your browser and on the lower left of your chromebook screen hit the"launcher" and click "Graphical".
Step 3 Now, use the USB cord attached to your Logger Pro 2 unit and plug this into the chromebook. Give it a couple of minutes to calibrate and it should recognize the colorimeter attached to the Logger Pro 2 unit.
Step 3 Set the wavelength on the colorimeter to 470nm by pressing the left and right arrows.
Step 4 Obtain 3 test 16 x 150mm test tubes and place them in a test tube rack.
Step 5 Using a marker label one of the tubes "S" (for substrate), one of the tubes "E" (for enzyme), and one of the tubes "B" (for blank).
Step 6 The blank will contain everything but the substrate and will be used to zero the colorimeter. Using a 10 ml bulb graduated pipette, add 10 ml of distilled water to the tube labeled "B". Using the same graduated pipette, add 3.3 ml more water to the same tube, for a total volume of 13.3ml water in the tube.
Step 7 Using the "micropipette" at your teacher's desk, add 0.2ml guaicacol to the tube.
Step 8 Using a bulb graduated pipette, add 1.5 ml turnip peroxidase to the tube.
Step 9 Cover the top of the tube with para film, and invert several times to mix.
Step 10 Pour some of the solution from tube "B" into a cuvette.
Step 11 Wipe clean the outside of the cuvette with lens paper.
Step 12 Place the cuvette into the colorimeter and hit "cal" to calibrate the colorimeter.
Step 13 Remove the cuvette containing the blank solution and set aside.
Step 14 Using the 10ml bulb graduated pipette add 7ml of distilled water to the tube labeled "S". Using the same pipette, add 6ml distilled water to the tube labeled "E".
Step 15 Using the same micropipette used to add guaiacol to the blank, add 0.2ml guaiacol to the tube labeled "S".
Step 16 Using the other micropipette, add 0.3ml of hydrogen peroxide to the tube labeled "S".
Step 17 Using the same bulb graduated pipette you used for the turnip peroxidase added to the blank, add 1.5ml of turnip peroxidase to the tube labeled "E".
Step 18 Now, take your two empty cuvettes and fill each about half full. One with liquid from the tube labeled "E" and one with liquid from the tube labeled "S".
Step 18 Now, mix the contents of the enzyme and substrate cuvettes using the funnel provided, place a cap on the cuvette, give it a quick shake to mix, wipe the outside of the cuvette, and place it into the colorimeter. The timer should start timing.
Step 19 Take an absorbance reading immediately, record this in your data table. This will be time 0.
Step 20 Record the absorbance at 2, 3, 4, and 5 minutes. Record these in your data table for the baseline.

Data Table - Determining a Baseline of Absorbance and at different pH
Procedure 2: Determining the effect of pH on enzyme activity using the Vernier Colorimeter.
Step 1 Now, obtain 12 test tubes and place them in your test tube rack.
Step 2 Using your marker, label six of the tubes "S" (for substrate) and six of the tubes "E" (for enzyme).
Step 3 Wipe clean your cuvette containing the blank solution in Part 1 and place it into the colorimeter. Hit "cal" to calibrate the colorimeter.
Step 4 Remove the cuvette and set this aside. You will use this blank solution to calibrate the colorimeter between each trial (different pH).
Step 5 Using the 10ml bulb graduated pipette, add 7ml of distilled water to one of the test tubes labeled "S".
Step 6 Using a syringe, add 6 ml of pH buffer 3 to one of the tubes labeled "E".
Step 7 Using the micropipette at your teachers desk, add 0.2ml guaiacol to the tube labeled "S".
Step 8 Using the micropipette at your teacher's desk, add 0.3ml hydrogen peroxide to the tube labeled "S".
Step 9 Using the bulb graduated pipette, add 1.5ml of turnip peroxidase to the tube labeled "E".
Step 10 Now, take your two CLEAN empty cuvettes and fill each about half full. One with liquid from the tube labeled "E" and one with liquid from the tube labeled "S".
Step 11 Now, mix the contents of the enzyme and substrate cuvettes using the funnel provided, place a cap on the cuvette, give it a quick shake to mix, wipe the outside of the cuvette, and place it into the colorimeter. The timer should start timing.

Procedure 2: Determining the effect of pH on enzyme activity using the Vernier Colorimeter. (CONTINUED)
Step 12 Take an absorbance reading immediately, record this in your data table. This will be time 0.
Step 13 Record the absorbance at 2, 3, 4, and 5 minutes. Record these in your data table for the pH being studied.
Step 14 Repeat steps 3-13 for each of the remaining pH buffers (pH 5, pH 6, pH 7, pH 8, pH 10).
*** BE SURE to use a NEW syringe for each buffer and zero the colorimeter with the blank before each remaining trial.
GRAPH
Use Google Sheets to create a graph which shows the baseline information compared to the results obtained for each pH buffer. Graph time against absorbance with time on the x-axis and absorbance on the y-axis.
ANALYSIS
Answer the analysis items on the previous page. (At the end of the original instructions which used the "color palate".