Embed Size (px)
Citation preview
Investigating the Validity of TOEFL:
A Feasibility Study Using Content and Criterion-Related Strategies
Michael RosenfeldPhilip K. OltmanKen Sheppard
Research ReportsReport 71January 2004
Investigating the Validity of TOEFL: A Feasibility Study Using Content and
Criterion-Related Strategies
Michael Rosenfeld Philip K. Oltman
Ken Sheppard
Educational Testing Service Princeton, New Jersey
RR-03-18
Educational Testing Service is an Equal Opportunity/Affirmative Action Employer. Copyright © 2004 by Educational Testing Service. All rights reserved. No part of this report may be reproduced or transmitted in any form or by any means, electronic or mechanical, including photocopy, recording, or any information storage and retrieval system, without permission in writing from the publisher. Violators will be prosecuted in accordance with both U.S. and international copyright laws. EDUCATIONAL TESTING SERVICE, ETS, the ETS logos, Graduate Record Examinations, GRE, and TOEFL are registered trademarks of Educational Testing Service. Test of English as a Foreign Language is a trademark of Educational Testing Service.
i
Abstract
The purpose of this study was to investigate the feasibility of two complementary approaches to assessing the validity of the TOEFL examination. One approach used evidence based on test content. In the context described in this report, evidence based on test content refers to the degree to which the items on the TOEFL examination are representative of the knowledge and skills required to demonstrate English proficiency in undergraduate and graduate programs throughout the United States and Canada. The content-oriented approach used in this pilot study involved item rating procedures that were designed to evaluate and document the relationship between the language tasks or behaviors previously identified as important for academic success and the test items used to measure them. The second approach used a criterion-related validation strategy. In this aspect of the study, experimental rating scales were developed for use by faculty to evaluate students’ current levels of English language proficiency. These scales were designed to sample the domain of behaviors previously identified as important. Key words: validity, language testing, rating scales
ii
The Test of English as a Foreign Language™ (TOEFL®) was developed in 1963 by the National Council on the Testing of English as a Foreign Language. The Council was formed through the cooperative effort of more than 30 public and private organizations concerned with testing the English proficiency of nonnative speakers of the language applying for admission to institutions in the United States. In 1965, Educational Testing Service® (ETS®) and the College Board® assumed joint responsibility for the program. In 1973, a cooperative arrangement for the operation of the program was entered into by ETS, the College Board, and the Graduate Record Examinations® (GRE®) Board. The membership of the College Board is composed of schools, colleges, school systems, and educational associations. GRE Board members are associated with graduate education.
ETS administers the TOEFL program under the general direction of a policy board that was
established by, and is affiliated with, the sponsoring organizations. Members of the TOEFL Board represent the College Board, the GRE Board, and such institutions and agencies as graduate schools of business, junior and community colleges, nonprofit educational exchange agencies, and agencies of the United States government.
A continuing program of research related to the TOEFL test is carried out under the direction of the
TOEFL Committee of Examiners. Its 13 members include representatives of the TOEFL Board, and distinguished English as a second language specialists from the academic community. The Committee meets twice yearly to oversee the review and approval of proposals for test-related research and to set guidelines for the entire scope of the TOEFL research program. Members of the Committee of Examiners serve three-year terms at the invitation of the Board; the chair of the committee serves on the Board.
Because the studies are specific to the TOEFL test and the testing program, most of the actual research
is conducted by ETS staff rather than by outside researchers. Many projects require the cooperation of other institutions, however, particularly those with programs in the teaching of English as a foreign or second language and applied linguistics. Representatives of such programs who are interested in participating in or conducting TOEFL-related research are invited to contact the TOEFL program office. All TOEFL research projects must undergo appropriate ETS review to ascertain that data confidentiality will be protected.
Current (2003-04) members of the TOEFL Committee of Examiners are: Lyle Bachman University of California, Los Angeles Deena Boraie The American University in Cairo Micheline Chalhoub-Deville (chair) University of Iowa Cathy Elder University of Auckland Glenn Fulcher University of Dundee Bill Grabe Northern Arizona University Keiko Koda Carnegie Mellon University Richard Luecht University of North Carolina at Greensboro Tim McNamara University of Melbourne James Purpura Columbia University Terry Santos Humboldt State University Richard Young University of Wisconsin, Madison
To obtain more information about TOEFL programs and services, use one of the following: Email: [email protected]
Web site: www.toefl.org
iii
Acknowledgments
This report is the product of the efforts of a great many people to whom the authors are indebted. In particular, we would like to recognize the ESL coordinators and faculty who participated in this study. Their assistance in the design and administration of the faculty rating scales and their cooperation throughout the study played a major role in the success of this project. The authors would also like to recognize Regina Mercadante for her administrative assistance throughout this project and Gerry Kokolis, who was responsible for data analysis.

iv
v
Table of Contents
Introduction .....................................................................................................................................1 Background ...............................................................................................................................1 Purpose of the Study .................................................................................................................2 Research Questions to Be Answered ........................................................................................3 Method .............................................................................................................................................4 Evidence of Content Relevance and Representativeness: Linking TOEFL Test Questions to Task Statements ...................................................................................................4 Evidence for Criterion-Related Validity: Language Skills Rating Scales ................................8 Administration of Rating Scales ...............................................................................................9 Data Analyses .........................................................................................................................10 Results............................................................................................................................................11 The Item Rating Study.............................................................................................................11 The Criterion Study..................................................................................................................22 Discussion .....................................................................................................................................28 The Item Rating Study ............................................................................................................28 Faculty Ratings .......................................................................................................................30 Conclusions ...................................................................................................................................31 References .....................................................................................................................................33 Appendixes ...................................................................................................................................35 A. Test Items Used in the Item Rating Study .....................................................................35 B. Item Linking Rating Form .............................................................................................54 C. Faculty Member’s Student Evaluation Form .................................................................57 D. Item Rating Results for ETS Test Specialists and ESL Faculty Raters .........................72 E. Faculty Ratings of Student Performance for Each of the Three Participating Schools ...........................................................................................80
vi
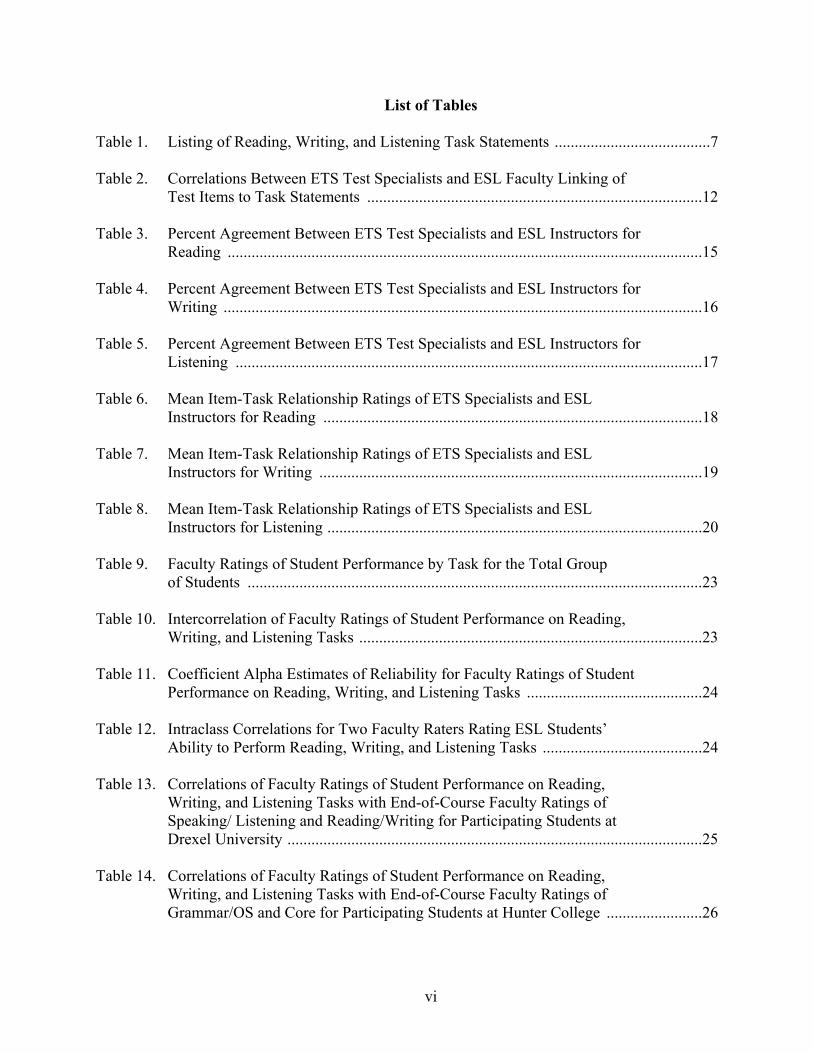
List of Tables
Table 1. Listing of Reading, Writing, and Listening Task Statements .......................................7 Table 2. Correlations Between ETS Test Specialists and ESL Faculty Linking of Test Items to Task Statements ....................................................................................12 Table 3. Percent Agreement Between ETS Test Specialists and ESL Instructors for Reading .......................................................................................................................15 Table 4. Percent Agreement Between ETS Test Specialists and ESL Instructors for Writing ........................................................................................................................16 Table 5. Percent Agreement Between ETS Test Specialists and ESL Instructors for Listening .....................................................................................................................17 Table 6. Mean Item-Task Relationship Ratings of ETS Specialists and ESL Instructors for Reading ...............................................................................................18 Table 7. Mean Item-Task Relationship Ratings of ETS Specialists and ESL Instructors for Writing ................................................................................................19 Table 8. Mean Item-Task Relationship Ratings of ETS Specialists and ESL Instructors for Listening ..............................................................................................20 Table 9. Faculty Ratings of Student Performance by Task for the Total Group of Students ..................................................................................................................23 Table 10. Intercorrelation of Faculty Ratings of Student Performance on Reading, Writing, and Listening Tasks ......................................................................................23 Table 11. Coefficient Alpha Estimates of Reliability for Faculty Ratings of Student Performance on Reading, Writing, and Listening Tasks ............................................24 Table 12. Intraclass Correlations for Two Faculty Raters Rating ESL Students’ Ability to Perform Reading, Writing, and Listening Tasks ........................................24 Table 13. Correlations of Faculty Ratings of Student Performance on Reading, Writing, and Listening Tasks with End-of-Course Faculty Ratings of Speaking/ Listening and Reading/Writing for Participating Students at Drexel University ........................................................................................................25 Table 14. Correlations of Faculty Ratings of Student Performance on Reading, Writing, and Listening Tasks with End-of-Course Faculty Ratings of Grammar/OS and Core for Participating Students at Hunter College ........................26
vii
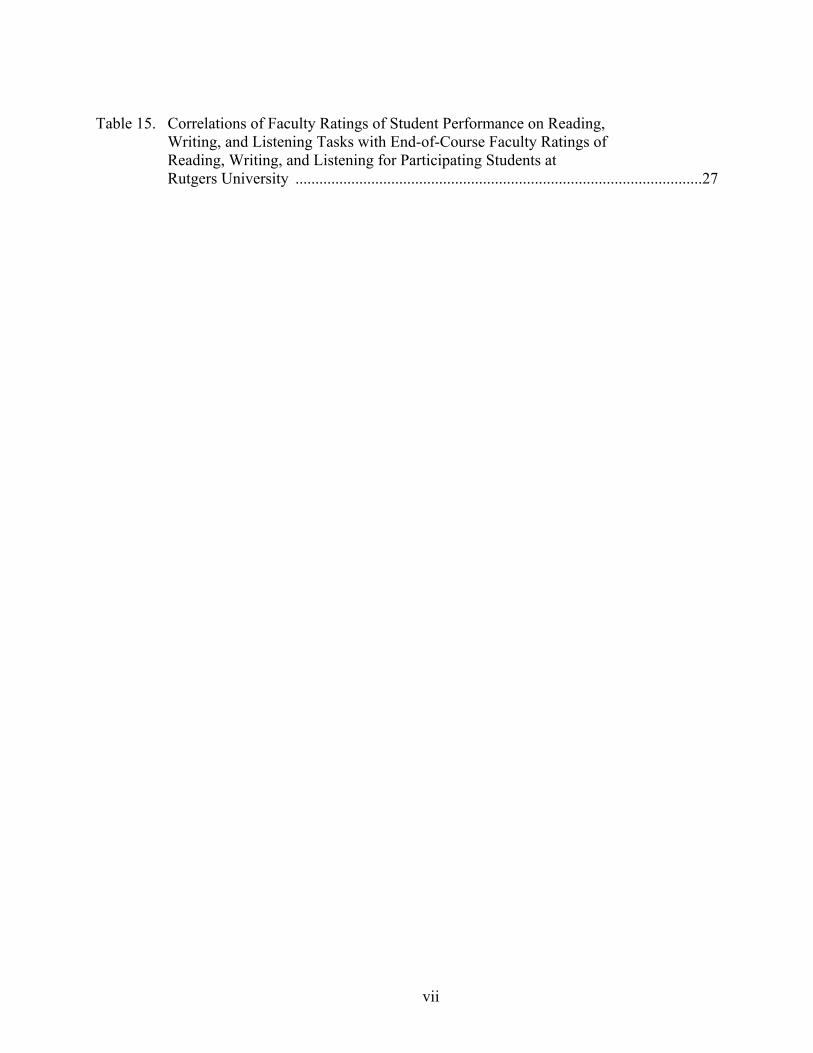
Table 15. Correlations of Faculty Ratings of Student Performance on Reading, Writing, and Listening Tasks with End-of-Course Faculty Ratings of Reading, Writing, and Listening for Participating Students at Rutgers University ......................................................................................................27

viii
1
Introduction Background
The purpose of the Test of English as a Foreign Language (TOEFL) is to evaluate the
English proficiency of people whose native language is not English. The test was initially developed to assess the English language proficiency of international students desiring to study at colleges and universities in the United States and Canada, and this continues to be its primary function. A number of studies have been conducted to support the validity of the test. Studies have been conducted that demonstrate the relationship between TOEFL scores and English language placement examinations for international students (Maxwell 1965; Upshur 1966). Other studies demonstrate differences in TOEFL scores between native and nonnative speakers of English (Angoff & Sharon, 1970; Clark 1977). There have also been studies that demonstrate the relationship between TOEFL scores and indices of language performance. Pike (1979) found relationships between TOEFL scores and scores obtained on oral interviews and writing samples. Henning and Cascallar (1992) found relationships between TOEFL scores and independent ratings of oral and written communication.
In recent years, work has been in progress to develop a new TOEFL that (1) is more
reflective of communicative competence models; (2) includes more constructed-response tasks and direct measures of writing and speaking; (3) includes tasks that integrate the language modalities tested; and (4) provides more information than current TOEFL scores do about the ability of international students to use English in an academic environment. The introduction of the computer-based TOEFL was a first step in this test improvement process. As these efforts toward the development of a new TOEFL continue, there will be a continuing need for test validation.
Validation is a continuous process that involves accumulating evidence to provide
support for the proposed score interpretations. The Standards for Educational and Psychological Testing (American Educational Research Association, American Psychological Association, & National Council on Measurement in Education, 1999) describe five major sources of evidence that can be used to evaluate the appropriateness of a particular test score interpretation. Two of these sources, evidence based on test content and evidence based on relations to other variables, are the main focus of the study described in this report.
According to the Standards, “evidence based on test content can include logical or
empirical analyses of the adequacy with which the test content represents the content domain and the relevance of the content domain to the proposed interpretation of test scores. Evidence based on test content can also come from expert judgment of the relationship between parts of the test and the construct. For example, in developing a licensure test, the major facets of the specific occupation can be specified, and experts in that occupation can be asked to assign test items to the categories defined by those facets (p. 11).”
Messick (1989) indicates that considerations of content relevance and representativeness
clearly do and should influence the nature of score inferences. Messick also indicates that a key issue of the content aspect of construct validity is the specification of the boundaries of the
2
construct domain to be assessed. He believes these boundaries can be addressed by means of job analysis.
The Standards also specify that test criterion-relationships are a major source of validity
evidence and are subsumed under the general category of relations to other variables. When using this source of validity evidence, the fundamental issue is the accuracy with which test scores predict criterion performance. It is also extremely important that the relevance of the criterion measure be demonstrated. Messick (1989), in a discussion of criterion-related validity, notes that it is not the pattern of relationships of test scores with other measures in general that is of interest, rather it is the selected relationship with relevant criterion measures for a particular applied purpose.
Weir (1988), among others, has distinguished a priori and a posteriori construct
validation. The first type entails validation of a test under development, and the latter involves assessment of a test that has already been developed. The procedures being developed and piloted in this study can be used to explore both aspects described by Weir. Evidence based on test content can be used to determine if the items being written are related to the test plan before the test is finalized. The rating scales being developed as criterion measures can be used to evaluate the criterion-related validity of the examination after it has been developed.
Purpose of the Study
This study was conducted in anticipation of the new TOEFL and was intended to develop
and pilot procedures that could be used as part of the validation process for the new examination. The purpose was to investigate the feasibility of two complementary approaches for providing evidence to support the validity of new versions of the TOEFL examination.
One of the approaches uses evidence based on test content. In the context described in
this report, this refers to the degree to which the items on the TOEFL examination are representative of the knowledge and skills required to demonstrate English proficiency in undergraduate and graduate programs in the United States and Canada. Implementing this approach involved the development of item rating procedures to be used by internal ETS test specialists and external content experts. These procedures were designed to evaluate and document the relationship between TOEFL test items and the reading, writing, speaking, and listening tasks judged to be important for competent academic performance at both the undergraduate and graduate levels.
Because this study preceded development of the new TOEFL test specifications and
items, it was necessary to use existing TOEFL items. Existing paper-based items were used to determine the feasibility of this methodology for investigating the validity of new versions of TOEFL. Since speaking is not part of the paper-based TOEFL, items measuring that content/skill area were not included in the pilot study. The procedures developed in this study could be adapted to include speaking skills in later studies.
The second approach is based on a criterion-related validation strategy. In this aspect of
the study, rating scales were developed that could be used by faculty to evaluate students’ current
3
levels of English language proficiency as part of the process of documenting the criterion-related validity of the new TOEFL.
The current study builds on research that was conducted for TOEFL (Rosenfeld, Leung, &
Oltman, 2001) that identified reading, writing, listening, and speaking tasks judged to be important for competent academic performance by faculty and students at both the undergraduate and graduate levels. If new TOEFL test items can be linked or related to these reading, writing, speaking, and listening task statements, the results would provide an important source of evidence of the content relevance and representativeness of those items and of the new TOEFL. In addition, because these task statements describe important aspects of the job of a student, the same statements can be used to design rating scales that would serve as relevant criterion measures to independently evaluate the English language proficiency of students.
Although TOEFL is used as part of the admissions process for nonnative speakers of
English at more than 2,400 colleges and universities across the United States and Canada, the exclusive use of course grades as a criterion measure to evaluate the validity of TOEFL is inappropriate. The test was not designed to predict academic success. Certainly, facility with English contributes to students’ success in a given course. However, many other factors also contribute to success or failure. TOEFL was designed to evaluate English proficiency. Instructors in subject matter courses (e.g., chemistry, mathematics, history) are not likely to have the background and training to fully evaluate the English language proficiency of students in their classes who are nonnative speakers of English. Therefore, the rating scales developed in this study were designed to be used in English as a Second Language (ESL) classes by faculty providing English language instruction to nonnative speakers of English at a relatively high level of language acquisition. Because in these classes course content deals directly with English language proficiency, these language specialists brought an understanding of proficiency to the task as well as experience with the routine evaluation of their students’ proficiency and an understanding of the linguistic demands such students face in an academic setting. Therefore, their judgments are more likely to discriminate among levels of their students’ English language proficiency in a consistent manner than faculty from other subject areas.
Research Questions to Be Answered
This pilot study was designed to answer the following research questions. 1 . Can item rating procedures be developed that ETS test specialists and external ESL
instructors can use to link TOEFL items to reading, writing, and listening tasks that were judged by faculty and students to be important for competent academic performance?
2. Can the task statements judged to be important for competent academic performance
in a previous study (Rosenfeld et al., 2001) be used to develop rating scales that can be used by ESL faculty to evaluate students’ current levels of proficiency with regard to those tasks?
4
3. Is it feasible to design and conduct a criterion-related validity study in which faculty ratings of proficiency on academically relevant reading, writing, and listening tasks can be collected close in time to a TOEFL administration?
Method
The study was a pilot test of two complementary approaches to collecting evidence
bearing on the validity of the TOEFL examination.
Evidence of Content Relevance and Representativeness: Linking TOEFL Test Questions to Task Statements
The accurate identification of linguistic domains characterizing language use — or what
Bachman and Palmer (1996) call “target language use (TLU) domains” — and their adoption in test design are realistic priorities. Bachman and Palmer define these as “specific language use tasks that the test taker is likely to encounter outside of the test itself, and to which we want our inferences about language ability to generalize” (p. 44). Their view is also that “the key to designing tests that [are] useful for their intended purposes is to include. . .tasks whose distinguishing characteristics correspond to those of TLU tasks” (p. 45). Because the test should mirror those tasks, it follows that looking for validation evidence along the real-use dimension, by means of expert judgment, is a reasonable tack.
A good place to start is the identification of TLU domains. As indicated, this study was
based on research conducted for TOEFL 2000 (Rosenfeld et al., 2001) that identified reading, writing, listening, and speaking tasks judged to be important for competent academic performance at both the undergraduate and graduate levels. Similar studies, with variant foci, have been conducted in various contexts, many in relation to reading and writing requirements, few relevant to speaking and listening. Among them is a study of literacy demands in an undergraduate history course (Carson, Chase, Gibson, & Hargrove, 1992), which reveals a three-way mismatch among students’ abilities, their performance, and teachers’ expectations and argues strenuously for a tighter alignment between academic preparation and college courses. That study is only one voice in a growing chorus of support for more coherence across ESL instruction, proficiency testing, and actual language use.
The aim of this study was to estimate the extent to which the paper-based TOEFL test
provides an accurate and realistic picture of English proficiency in academic settings. As such, it is an a posteriori attempt to assess these relationships as a first step in a long-term project to obtain a better estimate of the relationship between test performance and underlying abilities. The paper-based TOEFL test, in use for many years, was the result of informed judgments about authentic language use. It was not, however, built on a formal analysis of TLU domains. Consonant with the definition of language in Bachman and Palmer (1996) (“creation or interpretation of intended meanings in discourse by an individual, or. . .the dynamic and interactive negotiation of intended meanings between two or more individuals in a particular situation,” p. 61) a new TOEFL test will have a more principled basis. This study is intended as an early step in that process.
5
This part of the study involved developing and piloting procedures that could be used by ETS test specialists and ESL faculty to assess the degree of linkage between TOEFL test questions and a set of task statements that had been developed in the Rosenfeld et al. (2001) study. That study used theoretical frameworks developed for reading, writing, speaking, and listening as a starting point (Bejar, Douglas, Jamieson, Nissan, & Turner, 2000; Butler, Eignor, Jones, McNamara, & Suomi, 2000; Cumming, Kantor, Powers, Santos, & Taylor, 2000; Enright, Grabe, Koda, Mosenthal, Mulcahy-Ernt, & Schedl, 2000; Jamieson, Jones, Kirsch, Mosenthal, & Taylor, 2000). In the Rosenfeld et al. study, framework team members were asked to write task statements that were consistent with their frameworks and reflective of important tasks for students’ competent academic performance. These task statements were then reviewed and revised by undergraduate and graduate faculty and undergraduate and graduate students. The final set of 42 task statements was placed in survey format and administered to undergraduate and graduate faculty and students at 21 colleges and universities in the United States and Canada. Respondents rated the importance of each task for competent academic performance. The study identified a set of reading, writing, speaking, and listening tasks that were judged to be important for competent academic performance by faculty and students at both the undergraduate and graduate levels.
Because the test specifications for the new TOEFL examination have not yet been
finalized, the reading, writing, and listening statements that had been identified in the Rosenfeld et al. (2001) study were used in the present study as the framework for item linking. Additionally, the unavailability of new test items meant that speaking tasks were omitted from the item rating exercise. Therefore, a set of procedures constrained by these givens was developed and pilot-tested to determine if an item-linking procedure could be developed that would be useful as part of the process for documenting evidence of the content relevance and representativeness of new versions of the TOEFL examination.
Developing the procedures. ETS research staff worked with TOEFL program direction
and ETS test specialists to develop the rating procedures. After some discussion, it was decided that the test items in this pilot procedure should be limited to exposed TOEFL items to avoid any test security problems. As a result, the test items used were selected from the TOEFL Practice Tests (volume 1) workbook (Educational Testing Service, 1999). In discussions with the TOEFL content area leader 30 reading items, 30 listening comprehension items, and 28 structure and written expression items were identified for use in the item-linking study. In addition, two prompts were selected from the TOEFL Test of Written English Guide (Educational Testing Service, 1966). The items selected are provided in Appendix A. It should be noted that because these were paper-based TOEFL items, they were written to the test specifications for that examination and not for the anticipated new versions of TOEFL.
After discussions with test development group leaders, it was decided that three separate
rating forms would be developed for linking the reading, writing, and listening items to be evaluated. An abbreviated example of the rating form used for reading is provided below. A complete rating form is provided in Appendix B.
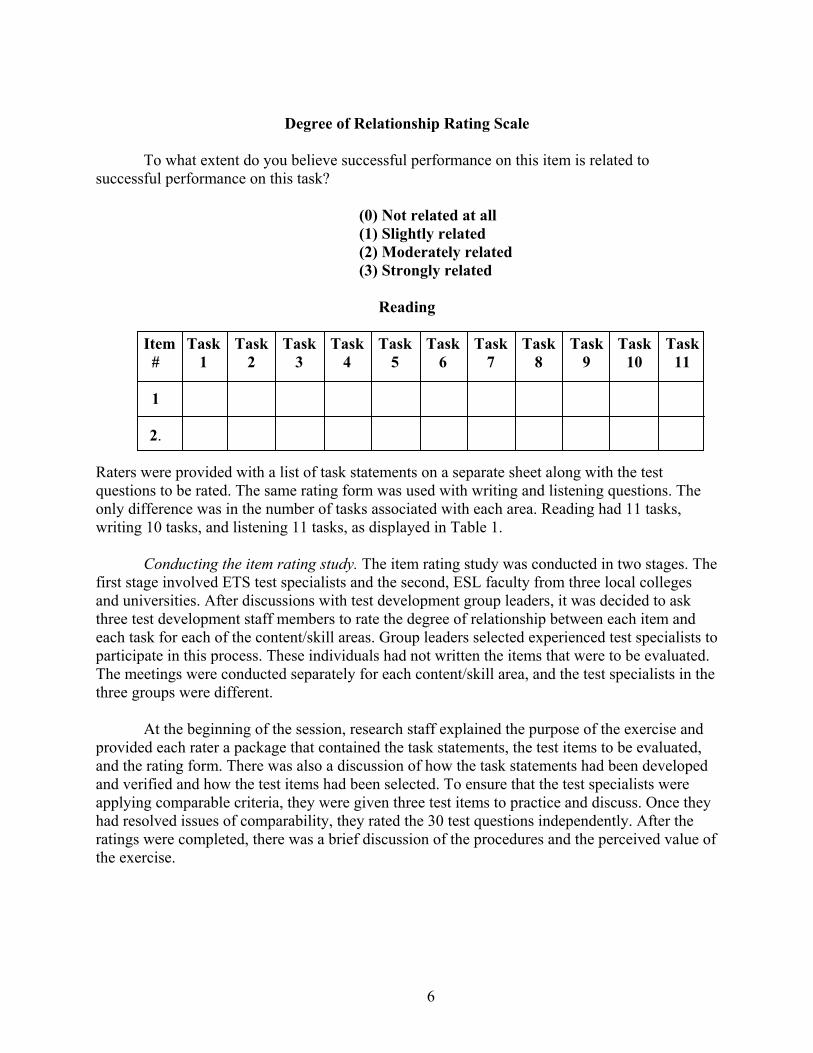
6
Degree of Relationship Rating Scale
To what extent do you believe successful performance on this item is related to
successful performance on this task?
(0) Not related at all (1) Slightly related (2) Moderately related (3) Strongly related
Reading
Item Task Task Task Task Task Task Task Task Task Task Task # 1 2 3 4 5 6 7 8 9 10 11 1 2.
Raters were provided with a list of task statements on a separate sheet along with the test questions to be rated. The same rating form was used with writing and listening questions. The only difference was in the number of tasks associated with each area. Reading had 11 tasks, writing 10 tasks, and listening 11 tasks, as displayed in Table 1.
Conducting the item rating study. The item rating study was conducted in two stages. The first stage involved ETS test specialists and the second, ESL faculty from three local colleges and universities. After discussions with test development group leaders, it was decided to ask three test development staff members to rate the degree of relationship between each item and each task for each of the content/skill areas. Group leaders selected experienced test specialists to participate in this process. These individuals had not written the items that were to be evaluated. The meetings were conducted separately for each content/skill area, and the test specialists in the three groups were different.
At the beginning of the session, research staff explained the purpose of the exercise and
provided each rater a package that contained the task statements, the test items to be evaluated, and the rating form. There was also a discussion of how the task statements had been developed and verified and how the test items had been selected. To ensure that the test specialists were applying comparable criteria, they were given three test items to practice and discuss. Once they had resolved issues of comparability, they rated the 30 test questions independently. After the ratings were completed, there was a brief discussion of the procedures and the perceived value of the exercise.
7
Table 1 Listing of Reading, Writing, and Listening Task Statements
Reading Task Statements 1 Through 11 Locating information 1. Locate and understand information that is clearly stated in the text by skimming and scanning 2. Locate and understand information provided in non-prose documents (e.g., charts, graphs, and tables) Basic comprehension 3. Use contextual cues to establish the meaning of a word in a passage 4. Determine the basic theme (main idea) of a passage 5. Read and understand written instructions/directions concerning classroom assignments and/or examinations Learning 6. Read text material with sufficient care and comprehension to remember major ideas and answer written questions later when the text is no
longer present
7. Read text material with sufficient care and comprehension to remember major ideas 8. Read text material and outline important ideas and concepts 9. Distinguish factual information from opinions Integration 10. Compare and contrast ideas in a single text and/or across texts 11. Synthesize ideas in a single text and/or across texts
Writing Task Statements 1 through 10 Content 1. Write in response to an assignment and stay on topic without digressions or redundancies 2. Show awareness of audience needs and write to a particular audience or reader 3. Use background knowledge, reference or non-text materials, personal view points, and other sources appropriately to support ideas, analyze,
and refine arguments 4. Produce writing that effectively summarizes and paraphrases the works and words of others Organization 5. Organize writing in order to convey major and supporting ideas 6. Use appropriate transitions to connect ideas and information Development 7. Use relevant reasons and examples to support a position or idea 8. Produce sufficient quantity of written text appropriate to the assignment and the time constraints Language 9. Demonstrate a command of standard written English, including grammar, phrasing, effective sentence structure, spelling, and punctuation 10. Demonstrate facility with a range of vocabulary appropriate to the topic
Listening Task Statements 1 through 11 Facts and details 1. Understand factual information and details 2. Understand the instructor’s spoken directions regarding assignments and their due dates Vocabulary 3. Understand important terminology related to the subject matter 4. Use background knowledge and context to understand unfamiliar terminology Main ideas 5. Understand the main ideas and their supporting information 6. Distinguish between important information and minor details Inferences 7. Make appropriate inferences based on information in a lecture, discussion, or conversation 8. Understand the parts of lectures, discussions, or conversations, such as the introduction, review of previous information, presentation of new
material, summary, and conclusion
Communicative functions 9. Understand the difference among communicative functions such as suggestions, advice, directives, and warnings 10. Recognize the use of examples, anecdotes, jokes, and digressions 11. Recognize the speaker’s attitudinal signals (e.g., tone of voice, humor, sarcasm)
8
ESL coordinators from three local colleges and universities with large ESL programs were also invited to participate in the linking study. This was done to gain a wider perspective, one that encompassed outside experts who were in frequent contact with actual learners of English, in the item rating process. Thus, instructors who had expertise in teaching normative speakers of English the reading, writing, and listening skills necessary for competent academic performance were selected to participate. The inclusion of this perspective, in addition to the judgments of internal test specialists, enhances the validity evidence provided by this process.
Representatives from Drexel University, Hunter College, and Rutgers University agreed
to participate in the study. The coordinators of intensive English programs at these sites attended a one-day workshop on the ETS campus along with nine of their ESL instructors, three from each school. Each instructor was knowledgeable about and experienced in the teaching of one of three areas, reading, writing, or listening, at a level appropriate for prospective TOEFL test takers.
At this workshop, research staff first explained the item rating exercise, its purpose, and
procedures. There was also a discussion of how the test items had been selected and the task statements developed. Participants were assigned to the content/skill area they felt most qualified to rate.
After this orientation, the group was divided into three teams (reading, writing, and
listening) and given the test items, task statements, and rating scales and two and one-half hours to complete the rating process. Each participant rated independently; there was no group discussion of the ratings. A member of the ETS project staff was available to each team to answer questions. Evidence for Criterion-Related Validity: Language Skills Rating Scales
This aspect of the study involved the development of experimental behavioral anchored
rating scales (BARS) as criterion measures to validate the new TOEFL examination. BARS were first introduced in 1963 (Smith & Kendall, 1963) and have been used in many contexts, including language research (e.g., North, 1999; Shohamy, Gordon, & Kramer, 1992). They are similar to graphic rating scales but use behavioral statements as anchors for points along the scale (e.g., the beginning, middle, and end points of the scale). Scales of this sort are believed to be an improvement over graphic rating scales because of their specificity. The rater’s task is to compare observed behaviors of the ratee with the behavioral anchors on the scale in order to assign a rating on a particular dimension or rating scale. Another positive feature of BARS is that the users of the scales typically participate in scale development, enhancing the credibility of the format.
Graphic rating scales typically use scale point descriptors such as “the student can
perform this task marginally” or “the student can perform this task well.” The definition of these levels of performance is typically left to the rater. An example of a behavioral anchor associated with performing reading task 4 (“Determine the main idea of a passage”) well is “can always identify the main idea across a variety of subject areas even when inference is necessary.” This
9
anchor is designed to describe the level of performance associated with that point on the rating scale.
Constructing the rating scales. Because these scales would be designed for use by ESL
faculty, it was important for faculty to play a major role in their development. Therefore, the 12 ESL faculty members at the meeting described above spent the afternoon developing behavioral descriptors for BARS that would be used to rate student proficiencies on each of the reading, writing, and listening tasks.
This portion of the meeting began with a brief orientation to the nature of BARS.
Participants were then asked to review each of the 32 reading, writing, and listening task statements and to identify any tasks on which they could not rate their students accurately. After some discussion, it was decided that all of the tasks described by the statements were observable and could be rated.
Next, there was a discussion regarding the number of behavioral anchors necessary for
defining the 6 points on each rating scale without losing discrimination. (A separate rating scale was to be developed for each of the 32 task statements.) After some discussion, it was agreed that two of the six scale points had been sufficiently defined. These were the zero scale point, “I have not observed the student perform this task,” and scale point one, “The student cannot perform this task.” In addition, participants felt that it would be most helpful to have behavioral anchors for points three and five on each scale.
The ESL faculty members were then divided into three subgroups (reading, writing, and
listening) on the basis of their preferences. Each subgroup was asked to write two behavioral descriptors for each task in its domain. Each descriptor was to provide task-specific behavioral descriptions to be associated with scale point three (to replace the generic statement, “The student can perform this task moderately well”) and scale point five (to replace the generic statement “The student can perform this task very well”). Each subgroup also contained a member of the ETS research staff who was available to answer questions and to provide advice. After approximately three hours, each subgroup returned for a full group session with a draft of its behavioral descriptors.
After the meeting, ETS project staff reviewed and edited the behavioral anchors written
by the ESL instructors and coordinators and formatted them for use in the rating scales. These revised drafts were sent to each of the three coordinators who distributed them to the participating instructors for review and comment. The coordinators collated the comments obtained at their institutions and provided them to ETS project staff. Revisions were made to the rating scales based on those comments. A copy of the Faculty Member’s Student Evaluation Form is contained in Appendix C.
Administration of Rating Scales
The rating scales were administered at each of the three participating institutions. The
ESL coordinator at each site had been asked to identify at least 35 students in the program who had sufficient English language proficiency to take the TOEFL examination because, if a
10
criterion-related validity study were to be conducted, it would have to include only students with the ability to take TOEFL.
The coordinators had been asked to identify ESL instructors who knew the students
sufficiently well to be able to use the Faculty Member’s Student Evaluation Form. It was recognized that a single ESL instructor might not be able to rate a student’s proficiency in reading, writing, and listening. If that was the case, the coordinators were asked to identify other ESL instructors who were familiar enough with the student’s performance to provide the ratings in the other content areas. In addition, the coordinators were asked to provide two raters to evaluate a student in each content area if that was possible.
Rating scale forms were sent to the ESL coordinators at each institution, who were
responsible for distributing the forms to faculty members selected to participate in the study. Faculty members rated the students selected by the ESL coordinators. The ratings were gathered at the end of the ESL course and faculty members were paid an honorarium for their participation.
In addition to managing the administration of rating scales, the coordinators were asked
to submit end-of-course evaluations of students that might be relevant for use in this study. Research staff were interested in determining if the ratings obtained were related to the routine end-of-course criteria that might be available.
Data Analyses
The item linking study. The degree-of-relationship ratings provided by ETS test
specialists and ESL faculty were used to compute means and standard deviations to summarize the relationship between each test question and each task in a given content/skill area. Mean ratings were computed separately for ETS test specialists and ESL faculty members. A mean rating of 2.5 (strongly related) was selected as the criterion for indicating that a test question was related or linked to a task statement. This criterion is consistent with the intent of evidence based on test content, which is to include important knowledge or skills in the assessment measure and to exclude those that are not important or not strongly related to the performance domain (in this instance, the task statements).
In addition to the item means, correlation coefficients were computed between the mean
ratings provided by ETS test specialists and ESL faculty for each test item. This analysis was designed to determine if ETS test specialists and ESL faculty agreed in the profile of their ratings for each test item across the tasks in a particular content/skill area. A percent agreement analysis was also conducted to obtain an estimate of interrater agreement. Two sets of conditions were used to define agreement. Under one condition, agreement was said to occur if at least 70% of the raters provided an item-task rating of 2 (moderately related) or above. The alternative condition for agreement occurred if at least 70% of the raters provided an item-task rating below 2.0 (slightly related or unrelated). Although these standards are somewhat arbitrary, it was felt that for purposes of this pilot study they were both useful and reasonable for describing interrater agreement.
11
The criterion study. Mean ratings and standard deviations were computed for each rating scale, separately for each of the three participating ESL programs as well as overall. They provide an indication of how well the students were judged to perform each task as well as the variability of the ratings within and across ESL programs. Internal consistency reliabilities (using coefficient alpha) were also computed for the Faculty Member’s Student Evaluation Form. These analyses were conducted separately for each of the three ESL programs and overall.
In addition to the above analyses, the ESL coordinator at each institution was asked, if it
was feasible, to have two raters who were knowledgeable about the students rate their performance on the reading, writing, and listening tasks. One institution was able to provide these data, and intraclass correlation coefficients were computed separately for each of the 32 ratings that compose the Faculty Member’s Student Evaluation Form to estimate the reliability of both raters.
Each ESL coordinator was also asked, if feasible, to provide end-of-course data that
might be an indicator of students’ English language proficiency. Each coordinator was able to provide this information and faculty ratings were correlated with the end-of-course assessments. These analyses were conducted separately for each of the three participating schools.
Results
The Item Rating Study
As indicated, the item rating study was conducted in two independent stages. In the first
stage, 11 ETS test specialists participated in the linking process (3 in reading, 5 in writing, and 3 in listening) rated the degree to which successful performance on each item was related to successful performance on each of the tasks. Means and standard deviations were computed for each item across each of the tasks in a given content area. The means ranged from 0 (not related at all) to 3 (strongly related). These results are provided in Appendix D.
The second stage of the item linking study involved 12 ESL faculty members from the
three participating schools. Means and standard deviations were computed for each item across each of the tasks in a given content area. The means ranged from 0 (not related at all) to 3 (strongly related). These results are also provided in Appendix D.
Correlational analysis. The mean ratings assigned by ETS test specialists and ESL
faculty to designate the degree of each item’s relationship to each of the tasks in a given content area were used to compute correlation coefficients for each test item. This analysis was designed to determine the extent to which ETS test specialists and ESL faculty agreed on the profile of their ratings for each test item across the tasks in a particular content area. These correlations are provided in Table 2.
12
Table 2 Correlations Between ETS Test Specialists and ESL Faculty Linking of Test Items to Task Statements
Item # READING WRITING LISTENING
**N=11 N=10 N=11 1 .66 .93 .79 2 .91 .99 .84 3 .62 .92 .75 4 .89 .98 .73 5 .94 .90 .75 6 .92 .95 .84 7 .74 .96 .85 8 .62 .90 .80 9 .85 .97 *.48
10 .91 .98 .83 11 .85 .92 .60 12 .80 .99 .63 13 .82 .92 .67 14 .86 .94 .91 15 .68 .93 .68 16 .91 .98 .72 17 .78 .96 .79 18 .85 .93 .63 19 .81 .96 .52 20 .82 .95 .74 21 *.46 .97 .91 22 .77 .96 .88 23 .80 .86 .82 24 .74 .86 .79 25 .67 .94 *.49 26 .69 .95 .79 27 .79 .93 .57 28 .97 .94 .72 29 .85 .96 .80 30 *.40 .99 .67
* Shaded areas indicate that the correlation coefficient was not statistically significant at the .05 level of confidence or less. ** N refers to the number of tasks in each of the content/skill areas.
For reading, the correlations computed between the mean ratings provided by ETS test
specialists and ESL faculty ranged from .40 to .97. Twenty-eight of the 30 correlation coefficients (93%) were statistically significant at the .05 level or less, indicating that ETS test specialists and ESL faculty agreed on the profile of ratings (across tasks) for each of these items. Items 21 and 30 were the only reading items on which there were relatively low levels of agreement.
13
For writing, the correlation coefficients computed ranged from .86 to .99. All 30 of the correlation coefficients were statistically significant beyond the .01 level indicating that ETS test specialists and ESL faculty agreed on the profile of ratings for each of the writing items.
For listening, the correlation coefficients computed ranged from .48 to .91. Twenty-eight
of the 30 correlation coefficients (93%) were statistically significant at the .05 level or less, indicating that ETS test specialists and ESL faculty agreed on the profile of ratings for these test items. Items 9 and 25 were the only items on which there was disagreement.
Percent agreement analysis. This analysis was conducted to provide an indication of the
interrater agreement of the item linking ratings. Because there were relatively few raters (either seven or nine, depending on the content/skill area) and because there were statistically significant correlation coefficients between the item linking ratings provided by ETS test specialists and ESL faculty on virtually all of the 90 item ratings included in this feasibility study, the two groups of raters were placed into a single pool. Separate analyses were performed for the item ratings conducted for reading, writing, and listening. These results are provided in Tables 3, 4, and 5. All cells containing item-task ratings with 70% or more of the raters in agreement are shaded. It should be recalled that two sets of conditions were used to define agreement. Under one condition, agreement was said to occur if at least 70% of the raters provided item-task ratings of 2.0 (moderately related) or above. The alternate condition for agreement occurred if at least 70% or more of the raters provided item-task ratings below 2.0 (slightly related or unrelated).
For reading, of the possible 330 comparisons (30 items × 11 tasks), 238 (72%) met the
standard. The task with the largest number of items on which there was agreement was Task 2 (“Locate and understand information provided in non-prose documents”). Task 6 (“Read text material with sufficient care and comprehension to remember major ideas and answer written questions later when the text is no longer present”) had the fewest number of items on which there was agreement. Items 11 and 13 had the largest number of agreements across tasks. Both items met the standard across all 11 tasks. Item 1 had the lowest number of agreements (4) across tasks.
For writing, of the possible 300 comparisons (30 items × 10 tasks), 255 (85%) met the
standard. There were six tasks on which all items met the agreement standard (Tasks 1, 3, 4, 5, 7, and 8. Task 10 (“Demonstrate facility with a range of vocabulary appropriate to the topic”) had the fewest number of agreements across items (4). Sixteen items met the agreement standards across 9 of the 10 writing tasks. Item 27 had the lowest number of item agreements across tasks (7).
For listening, of the possible 330 comparisons (30 items × 11 tasks), 234 (71%) met the
standard. Tasks 9 (“Understand the difference among communicative functions such as suggestions, advice, directives, and warnings”) and 10 (“Recognize the use of examples, anecdotes, jokes, and digressions”) had the largest number of items on which there was agreement (28). Task 8 (“Understand the parts of lectures, discussions, or conversations...”) had the lowest number of items on which there was agreement (14). Items 6 and 17 met the
14
agreement standards across all 11 tasks. Item 11 had the lowest number of item agreements across tasks (3).
Meeting the 2.5 standard. There were statistically significant correlation coefficients
between the item linking ratings provided by ETS test specialists and ESL faculty on 86 of the 90 test items (96%) included in this feasibility study. This indicates that both sets of raters agreed in the profile of their ratings for each test item across the tasks in a particular content/skill area. The mean ratings for each of these items were then averaged to provide an unweighted mean that reflected the best estimate of the degree of relationship between each test item and each task within a given content/skill area. These mean ratings are provided in Tables 6, 7, and 8. A cell is shaded if the mean rating was at least 2.5 (corresponding to a rating of strongly related) and if the ratings for that cell also met the interrater reliability standard. Given the rating scale employed (0-3 scale), a high standard was chosen that would be consistent with the intent of evidence based on test content. That intent is to include test items that assess important knowledge and skills or are strongly related to the constructs they are designed to measure and to exclude items that are not important or not strongly related.
The rows in Tables 6, 7, and 8 indicate the number of times a test item was judged to be
related to successful performance of a task. The columns show the number of items judged to be related to successful performance on a given task. Tables like these can be used to document the relationship between test items and the tasks or behaviors they are designed to assess. In addition, they can provide useful information for managing an item pool by indicating those aspects of the test domain that are well covered and those that need coverage.
As can be seen in Table 6, all reading items, except one (item 8), were judged to be
related to at least one task statement, and most were judged to be related to only one statement. Six of the 11 task statements had at least one test item that was rated as being strongly related to successful performance on that task. Task 1 (“Locate and understand information that is clearly stated in the text by skimming and scanning”) and Task 3 (“Use contextual cues to establish the meaning of a word in a passage”) received the most linkages. They had 16 of 30 items (53%) and 11 of 30 items (37%) linked to them, respectively. The following task statements received no linkages:
• Task 2, Locate and understand information in non-prose documents (charts and graphs).
• Task 5, Read and understand written instructions/directions concerning classroom assignments or examinations.
• Task 6, Read text material and remember main ideas when text is no longer present. • Task 8, Read text material and outline important ideas and concepts. • Task 9, Distinguish factual information from opinion.
15
Table 3 Percent Agreement Between ETS Test Specialists and ESL Instructors for Reading
Task 1 Task 2 Task 3 Task 4 Task 5 Task 6 Task 7 Task 8 Task 9 Task 10 Task 11 *Total
Item 1 57.1% 100.0% 100.0% 57.1% 71.4% 57.1% 57.1% 85.7% 57.1% 57.1% 57.1% 4
Item 2 100.0% 100.0% 57.1% 57.1% 71.4% 57.1% 100.0% 57.1% 71.4% 100.0% 85.7% 7
Item 3 100.0% 100.0% 57.1% 57.1% 85.7% 71.4% 85.7% 57.1% 57.1% 57.1% 57.1% 5
Item 4 100.0% 100.0% 100.0% 100.0% 71.4% 85.7% 57.1% 85.7% 85.7% 71.4% 57.1% 9
Item 5 71.4% 100.0% 85.7% 100.0% 85.7% 57.1% 100.0% 57.1% 71.4% 71.4% 100.0% 9
Item 6 71.4% 100.0% 100.0% 100.0% 85.7% 57.1% 100.0% 57.1% 85.7% 57.1% 100.0% 8
Item 7 85.7% 100.0% 100.0% 85.7% 71.4% 71.4% 71.4% 71.4% 100.0% 57.1% 57.1% 9
Item 8 85.7% 100.0% 71.4% 57.1% 71.4% 57.1% 57.1% 57.1% 71.4% 71.4% 57.1% 6
Item 9 100.0% 100.0% 85.7% 100.0% 85.7% 57.1% 71.4% 71.4% 71.4% 57.1% 85.7% 9
Item 10 100.0% 100.0% 100.0% 100.0% 85.7% 85.7% 57.1% 71.4% 85.7% 100.0% 100.0% 10
Item 11 71.4% 100.0% 100.0% 85.7% 71.4% 100.0% 85.7% 100.0% 85.7% 85.7% 85.7% 11
Item 12 100.0% 100.0% 85.7% 57.1% 71.4% 57.1% 71.4% 71.4% 71.4% 100.0% 100.0% 9
Item 13 100.0% 100.0% 85.7% 85.7% 71.4% 85.7% 71.4% 85.7% 100.0% 85.7% 85.7% 11
Item 14 85.7% 100.0% 100.0% 71.4% 71.4% 85.7% 71.4% 85.7% 100.0% 57.1% 57.1% 9
Item 15 85.7% 100.0% 100.0% 57.1% 57.1% 71.4% 57.1% 57.1% 85.7% 85.7% 71.4% 7
Item 16 100.0% 100.0% 100.0% 57.1% 71.4% 57.1% 71.4% 57.1% 85.7% 71.4% 71.4% 8
Item 17 85.7% 100.0% 100.0% 57.1% 71.4% 57.1% 71.4% 57.1% 85.7% 100.0% 71.4% 8
Item 18 57.1% 100.0% 100.0% 85.7% 71.4% 85.7% 85.7% 100.0% 100.0% 71.4% 71.4% 10
Item 19 85.7% 100.0% 100.0% 71.4% 85.7% 57.1% 71.4% 57.1% 85.7% 57.1% 57.1% 7
Item 20 85.7% 100.0% 85.7% 85.7% 85.7% 57.1% 100.0% 57.1% 71.4% 85.7% 57.1% 8
Item 21 85.7% 100.0% 71.4% 57.1% 71.4% 57.1% 71.4% 71.4% 71.4% 57.1% 71.4% 8
Item 22 57.1% 100.0% 100.0% 71.4% 71.4% 71.4% 71.4% 71.4% 71.4% 57.1% 57.1% 8
Item 23 71.4% 100.0% 85.7% 57.1% 57.1% 71.4% 57.1% 71.4% 100.0% 71.4% 57.1% 7
Item 24 100.0% 100.0% 66.7% 66.7% 66.7% 57.1% 100.0% 57.1% 57.1% 83.3% 83.3% 5
Item 25 66.7% 100.0% 100.0% 66.7% 66.7% 85.7% 83.3% 85.7% 85.7% 83.3% 83.3% 8
Item 26 100.0% 100.0% 66.7% 100.0% 50.0% 100.0% 66.7% 100.0% 85.7% 83.3% 66.7% 7
Item 27 80.0% 100.0% 100.0% 100.0% 60.0% 60.0% 100/0% 60.0% 83.3% 60.0% 80.0% 7
Item 28 80.0% 100.0% 100.0% 100.0% 60.0% 80.0% 100.0% 100.0% 1000% 100.0% 100.0% 10
Item 29 100.0% 100.0% 100.0% 80.0% 60.0% 80.0% 80.0% 80.0% 100.0% 60.0% 60.0% 8
Item 30 80.0% 100.0% 60.0% 80.0% 60.0% 60.0% 60.0% 60.0% 66.7% 80.0% 80.0% 5
**Total 26 30 25 18 21 15 22 18 26 19 18 238
* Total = Number of item-task links meeting the reliability standard ** Total = Number of items meeting the reliability standard
16
Table 4 Percent Agreement Between ETS Test Specialists and ESL Instructors for Writing
Task 1 Task 2 Task 3 Task 4 Task 5 Task 6 Task 7 Task 8 Task 9 Task 10 *Total
Item 1 100.0% 100.0% 100.0% 100.0% 88.9% 88.9% 100.0% 100.0% 88.9% 55.6% 9
Item 2 100.0% 100.0% 100.0% 100.0% 100.0% 100.0% 100.0% 100.0% 77.8% 66.7% 9
Item 3 100.0% 100.0% 100.0% 100.0% 88.9% 55.6% 100.0% 100.0% 88.9% 55.61% 8
Item 4 100.0% 100.0% 100.0% 100.0% 100.0% 100.0% 100.0% 100.0% 77.8% 55.6% 9
Item 5 100.0% 100.0% 100.0% 100.0% 88.9% 77.8% 100.0% 100.0% 88.9% 66.7% 9
Item 6 100.0% 100.0% 100.0% 100.0% 88.9% 100.0% 100.0% 100.0% 88.9% 55.6% 9
Item 7 100.0% 88.9% 100.0% 100.0% 100.0% 88.9% 100.0% 100.0% 88.9% 55.6% 9
Item 8 100.0% 100.0% 100.0% 100.0% 88.9% 77.8% 100.0% 100.0% 88.9% 55.6% 9
Item 9 100.0% 100.0% 100.0% 100.0% 100.0% 88.9% 100.0% 100.0% 66.7% 66.7% 8
Item 10 100.0% 100.0% 100.0% 100.0% 100.0% 100.0% 100.0% 100.0% 77.8% 66.7% 9
Item 11 100.0% 88.9% 100.0% 100.0% 88.9% 77.8% 100.0% 100.0% 77.8% 66.7% 9
Item 12 100.0% 100.0% 100.0% 100.0% 100.0% 100.0% 100.0% 100.0% 77.8% 66.7% 9
Item 13 100.0% 88.9% 100.0% 100.0% 88.9% 88.9% 100.0% 100.0% 66.7% 55.6% 8
Item 14 100.0% 88.9% 100.0% 100.0% 100.0% 100.0% 100.0% 100.0% 66.7% 66.7% 8
Item 15 100.0% 88.9% 100.0% 100.0% 100.0% 77.8% 100.0% 100.0% 66.7% 66.7% 8
Item 16 100.0% 100.0% 100.0% 100.0% 100.0% 88.9% 100.0% 100.0% 66.7% 66.7% 8
Item 17 100.0% 100.0% 88.9% 100.0% 100.0% 88.9% 100.0% 100.0% 55.6% 55.6% 8
Item 18 100.0% 100.0% 88.9% 100.0% 100.0% 88.9% 100.0% 100.0% 77.8% 55.6% 9
Item 19 100.0% 88.9% 88.9% 100.0% 100.0% 88.9% 100.0% 100.0% 66.7% 55.6% 8
Item 20 100.0% 88.9% 88.9% 100.0% 100.0% 88.9% 100.0% 100.0% 66.7% 77.8% 9
Item 21 100.0% 88.9% 100.0% 100.0% 100.0% 100.0% 100.0% 100.0% 66.7% 77.8% 9
Item 22 100.0% 88.9% 88.9% 100.0% 100.0% 100.0% 100.0% 100.0% 77.8% 66.7% 9
Item 23 100.0% 88.9% 88.9% 100.0% 100.0% 88.9% 100.0% 100.0% 66.7% 55.6% 8
Item 24 100.0% 88.9% 88.9% 100.0% 100.0% 77.8% 100.0% 100.0% 66.7% 55.6% 8
Item 25 100.0% 88.9% 88.9% 100.0% 100.0% 66.7% 100.0% 100.0% 77.8% 66.7% 8
Item 26 100.0% 88.9% 88.9% 100.0% 100.0% 88.9% 100.0% 100.0% 66.7% 66.7% 8
Item 27 100.0% 88.9% 100.0% 100.0% 77.8% 66.7% 100/0% 100.0% 66.7% 55.6% 7
Item 28 100.0% 88.9% 88.9% 100.0% 100.0% 100.0% 100.0% 100.0% 55.6% 55.6% 8
Item 29 100.0% 55.6% 100.0% 88.9% 100.0% 100.0% 100.0% 88.9% 100.0% 100.0% 9
Item 30 100.0% 55.6% 77.8% 88.9% 100.0% 100.0% 100.0% 88.9% 100.0% 100.0% 9
**Total 30 28 30 30 30 27 30 30 16 4 255
* Total = Number of item-task links meeting the reliability standard ** Total = Number of items meeting the reliability standard
17
Table 5 Percent Agreement Between ETS Test Specialists and ESL Instructors for Listening
Task 1 Task 2 Task 3 Task 4 Task 5 Task 6 Task 7 Task 8 Task 9 Task 10 Task 11 Total
Item 1 71.4% 85.7% 57.1% 57.1% 85.7% 57.1% 71.4% 100.0% 85.7% 100.0% 57.1% 7
Item 2 85.7% 100.0% 57.1% 71.4% 71.4% 57.1% 100.0% 57.1% 71.4% 100.0% 57.1% 7
Item 3 57.1% 85.7% 85.7% 71.4% 57.1% 85.7% 100.0% 100.0% 71.4% 100.0% 85.7% 9
Item 4 85.7% 57.1% 57.1% 71.4% 85.7% 57.1% 71.4% 57.1% 85.7% 100.0% 71.4% 7
Item 5 57.1% 100.0% 100.0% 71.4% 57.1% 71.4% 85.7% 57.1% 57.1% 100.0% 57.1% 6
Item 6 85.7% 85.7% 100.0% 71.4% 71.4% 85.7% 71.4% 71.4% 100.0% 85.7% 71.4% 11
Item 7 85.7% 85.7% 71.4% 57.1% 71.4% 85.7% 71.4% 71.4% 100.0% 100.0% 71.4% 10
Item 8 85.7% 71.4% 71.4% 71.4% 57.1% 57.1% 57.1% 71.4% 71.4% 100.0% 100.0% 8
Item 9 100.0% 85.7% 57.1% 57.1% 71.4% 71.4% 85.7% 57.1% 71.4% 71.4% 57.1% 8
Item 10 71.4% 100.0% 85.7% 57.1% 57.1% 57.1% 100.0% 71.4% 100.0% 100.0% 71.4% 8
Item 11 85.7% 57.1% 57.1% 57.1% 57.1% 57.1% 85.7% 57.1% 85.7% 57.1% 57.1% 3
Item 12 85.7% 85.7% 57.1% 57.1% 57.1% 71.4% 71.4% 57.1% 85.7% 85.7% 57.1% 6
Item 13 85.7% 57.1% 71.4% 71.4% 71.4% 57.1% 57.1% 57.1% 71.4% 100.0% 57.1% 6
Item 14 57.1% 57.1% 71.4% 85.7% 57.1% 85.7% 100.0% 57.1% 85.7% 85.7% 57.1% 6
Item 15 85.7% 85.7% 85.7% 71.4% 71.4% 71.4% 85.7% 71.4% 100.0% 85.7% 57.1% 10
Item 16 100.0% 71.4% 85.7% 85.7% 71.4% 85.7% 57.1% 71.4% 85.7% 100.0% 71.4% 10
Item 17 71.4% 71.4% 71.4% 71.4% 71.4% 85.7% 71.4% 71.4% 100.0% 100.0% 85.7% 11
Item 18 100.0% 71.4% 71.4% 71.4% 71.4% 57.1% 57.1% 57.1% 71.4% 85.7% 71.4% 9
Item 19 71.4% 85.7% 71.4% 85.7% 57.1% 57.1% 71.4% 57.1% 100.0% 85.7% 57.1% 7
Item 20 100.0% 71.4% 71.4% 57.1% 57.1% 85.7% 100.0% 57.1% 85.7% 100.0% 57.1% 7
Item 21 85.7% 85.7% 57.1% 71.4% 57.1% 71.4% 100.0% 71.4% 85.7% 100.0% 85.7% 9
Item 22 100.0% 71.4% 71.4% 57.1% 57.1% 57.1% 85.7% 57.1% 100.0% 100.0% 85.7% 7
Item 23 100.0% 71.4% 71.4% 71.4% 85.7% 100.0% 71.4% 71.4% 100.0% 85.7% 57.1% 10
Item 24 100.0% 71.4% 71.4% 57.1% 85.7% 71.4% 85.7% 57.1% 100.0% 100.0% 85.7% 9
Item 25 85.7% 71.4% 57.1% 71.4% 100.0% 57.1% 85.7% 57.1% 85.7% 85.7% 57.1% 7
Item 26 100.0% 71.4% 85.7% 57.1% 71.4% 57.1% 85.7% 57.1% 100.0% 85.7% 71.4% 8
Item 27 100.0% 71.4% 57.1% 57.1% 85.7% 85.7% 71.4% 71.4% 85.7% 57.1% 57.1% 7
Item 28 100.0% 71.4% 57.1% 57.1% 100.0% 71.4% 100.0% 85.7% 71.4% 85.7% 71.4% 9
Item 29 100.0% 71.4% 57.1% 57.1% 100.0% 85.7% 71.4% 71.4% 57.1% 71.4% 57.1% 7
Item 30 100.0% 85.7% 57.1% 57.1% 85.7% 57.1% 71.4% 57.1% 85.7% 71.4% 71.4% 7
Total 27 26 18 16 19 17 26 14 28 28 15 234
18
Table 6 Mean Item-Task Relationship Ratings of ETS Specialists and ESL Instructors for Reading
Task 1 Task 2 Task 3 Task 4 Task 5 Task 6 Task 7 Task 8 Task 9 Task 10 Task 11 Total
Item 1 1.83 0.00 3.00 1.46 1.04 1.29 1.67 0.83 1.17 1.13 1.50 1
Item 2 3.00 0.00 1.13 2.00 0.83 1.75 2.71 1.38 0.92 2.83 2.58 4
Item 3 3.00 0.00 1.50 1.29 0.67 1.17 2.17 1.50 1.04 1.21 1.75 1
Item 4 3.00 0.00 0.42 0.29 1.00 0.75 1.92 0.63 0.54 0.71 1.04 1
Item 5 2.13 0.00 0.50 3.00 0.79 1.88 2.83 1.71 0.67 0.83 2.83 3
Item 6 1.96 0.00 0.13 3.00 0.67 1.88 2.88 1.63 0.67 1.25 2.46 2
Item 7 2.04 0.00 3.00 0.42 1.04 0.75 0.88 1.04 0.25 1.13 1.13 1
Item 8 2.21 0.00 2.21 1.00 1.00 1.38 1.54 1.17 0.71 1.13 1.46 0
Item 9 3.00 0.00 0.88 0.42 0.67 1.50 1.17 1.04 0.71 1.42 0.75 1
Item 10 3.00 0.00 0.17 0.13 0.67 0.42 1.04 0.88 0.54 0.42 0.25 1
Item 11 1.92 0.00 3.00 0.54 1.04 0.13 0.67 0.29 0.38 0.50 0.50 1
Item 12 3.00 0.00 0.67 1.17 1.04 1.58 2.00 0.88 0.79 2.71 2.58 3
Item 13 2.75 0.00 2.50 0.25 0.92 0.54 0.63 0.42 0.29 0.50 0.38 2
Item 14 1.92 0.00 3.00 0.50 0.92 0.58 0.96 0.42 0.13 1.38 1.42 1
Item 15 2.67 0.00 0.42 1.00 1.63 1.00 1.79 1.25 0.54 2.21 1.92 1
Item 16 2.83 0.00 0.42 1.38 1.13 1.38 2.25 1.21 0.54 1.92 2.13 1
Item 17 2.50 0.00 0.42 1.58 1.13 1.25 2.13 1.38 0.67 2.67 2.00 2
Item 18 1.54 0.00 3.00 0.42 1.04 0.42 0.54 0.29 0.29 0.67 0.79 1
Item 19 2.67 0.00 0.54 0.88 0.67 1.13 2.00 1.13 0.42 1.42 1.71 1
Item 20 2.50 0.00 0.54 2.38 0.67 1.46 2.67 1.71 0.67 1.21 1.29 2
Item 21 2.50 0.00 1.08 1.13 1.13 1.63 1.79 1.29 0.79 1.42 1.83 1
Item 22 1.63 0.00 3.00 1.08 0.92 1.00 1.21 0.83 0.79 1.63 1.63 1
Item 23 2.17 0.00 2.50 0.75 1.17 0.50 1.00 0.63 0.25 0.63 1.21 1
Item 24 2.75 0.00 1.00 2.00 0.75 1.88 2.88 1.46 1.17 2.25 2.25 2
Item 25 1.75 0.00 3.00 0.88 0.75 0.67 0.88 0.67 0.54 0.75 0.75 1
Item 26 2.88 0.00 0.88 0.38 1.38 0.25 0.75 0.00 0.38 0.50 0.63 1
Item 27 2.13 0.00 0.13 3.00 1.38 0.75 3.00 0.88 0.38 1.00 2.63 3
Item 28 2.75 0.00 2.75 0.13 1.25 0.25 0.13 0.00 0.00 0.13 0.13 2
Item 29 2.25 0.00 3.00 0.50 1.25 0.25 0.88 0.25 0.13 0.50 1.50 1
Item 30 1.88 0.00 0.63 1.00 1.50 0.63 1.50 0.75 0.75 2.50 2.00 1
Total 16 0 11 3 0 0 6 0 0 4 4 44
Cells are shaded if the 2.50 standard was met.
19
Table 7 Mean Item-Task Relationship Ratings of ETS Specialists and ESL Instructors for Writing
Task 1 Task 2 Task 3 Task 4 Task 5 Task 6 Task 7 Task 8 Task 9 Task 10 Total
Item 1 0.00 0.00 0.10 0.10 0.38 0.38 0.00 0.00 2.50 1.58 1
Item 2 0.00 0.00 0.00 0.00 0.00 0.00 0.00 0.00 2.40 1.28 0
Item 3 0.00 0.00 0.10 0.10 0.70 1.63 0.00 0.00 2.50 1.33 1
Item 4 0.00 0.00 0.10 0.10 0.00 0.00 0.00 0.00 2.40 1.28 0
Item 5 0.00 0.00 0.10 0.10 0.38 0.85 0.00 0.00 2.50 1.60 1
Item 6 0.00 0.00 0.10 0.10 0.25 0.00 0.00 0.00 2.50 1.40 1
Item 7 0.00 0.25 0.00 0.10 0.00 0.25 0.00 0.00 2.60 1.50 1
Item 8 0.00 0.00 0.10 0.10 0.25 0.63 0.00 0.00 2.50 1.50 1
Item 9 0.00 0.00 0.10 0.10 0.13 0.25 0.00 0.00 2.40 1.73 0
Item 10 0.00 0.00 0.10 0.10 0.13 0.13 0.00 0.00 2.40 1.25 0
Item 11 0.00 0.25 0.10 0.10 0.25 0.73 0.00 0.00 2.40 1.25 0
Item 12 0.00 0.00 0.10 0.10 0.00 0.35 0.00 0.00 2.40 1.25 0
Item 13 0.00 0.25 0.00 0.10 0.25 0.50 0.00 0.00 2.30 1.53 0
Item 14 0.00 0.25 0.10 0.10 0.00 0.00 0.00 0.00 2.30 1.30 0
Item 15 0.00 0.25 0.10 0.10 0.13 0.73 0.00 0.00 2.30 1.28 0
Item 16 0.00 0.13 0.10 0.00 0.00 0.25 0.00 0.00 2.30 1.85 0
Item 17 0.00 0.13 0.20 0.00 0.13 0.35 0.00 0.00 2.20 1.73 0
Item 18 0.00 0.13 0.20 0.00 0.13 0.25 0.00 0.00 2.40 1.53 0
Item 19 0.00 0.25 0.20 0.00 0.00 0.48 0.00 0.00 2.40 1.60 0
Item 20 0.00 0.25 0.20 0.00 0.00 0.38 0.00 0.00 2.30 2.20 0
Item 21 0.00 0.25 0.10 0.00 0.00 0.13 0.00 0.00 2.30 2.10 0
Item 22 0.00 0.25 0.20 0.00 0.00 0.00 0.00 0.00 2.40 2.20 0
Item 23 0.00 0.25 0.20 0.00 0.00 0.38 0.00 0.00 2.30 1.55 0
Item 24 0.00 0.25 0.20 0.00 0.00 0.63 0.00 0.00 2.30 1.65 0
Item 25 0.00 0.25 0.30 0.00 0.10 1.03 0.00 0.00 2.40 2.08 0
Item 26 0.00 0.25 0.20 0.00 0.13 0.35 0.00 0.00 2.30 1.98 0
Item 27 0.00 0.25 0.10 0.00 0.58 1.08 0.00 0.00 2.40 1.63 0
Item 28 0.00 0.25 0.20 0.00 0.00 0.13 0.00 0.00 2.20 1.40 0
Item 29 2.90 1.90 2.68 1.05 2.80 2.68 2.90 2.80 3.00 3.00 8
Item 30 2.90 1.90 2.35 0.80 2.80 2.68 2.90 2.80 3.00 2.90 7
Total 2 0 1 0 2 2 2 2 8 2 21
Cells are shaded if the 2.50 standard was met.
20
Table 8 Mean Item-Task Relationship Ratings of ETS Specialists and ESL Instructors for Listening
Task 1 Task 2 Task 3 Task 4 Task 5 Task 6 Task 7 Task 8 Task 9 Task 10 Task 11 Total
Item 1 2.21 0.83 1.21 1.33 2.33 1.38 2.08 0.42 2.33 0.00 1.79 0
Item 2 2.29 0.42 1.88 2.17 2.00 1.71 2.17 1.13 2.21 0.00 1.96 0
Item 3 1.75 0.50 0.46 1.04 1.75 0.42 2.71 0.42 2.08 0.13 2.50 2
Item 4 2.58 1.50 1.33 1.00 2.29 0.83 2.13 0.92 2.17 0.13 1.63 1
Item 5 1.75 0.29 0.42 0.88 1.75 0.67 2.58 1.00 1.54 0.00 1.67 1
Item 6 2.17 0.46 0.42 0.75 2.00 0.67 1.71 1.04 0.58 0.75 0.88 0
Item 7 2.29 0.54 1.58 1.63 2.13 0.42 1.79 1.00 2.13 0.00 0.88 0
Item 8 2.63 1.04 1.04 1.04 1.88 1.00 1.17 0.83 0.50 0.13 0.46 1
Item 9 2.75 0.50 1.38 1.67 1.88 0.96 2.04 1.04 1.58 0.58 1.13 1
Item 10 2.08 0.29 0.54 1.13 1.33 1.50 2.88 0.67 2.17 0.46 2.21 1
Item 11 2.63 1.13 1.17 1.75 1.88 1.00 2.25 1.29 2.46 1.21 1.54 1
Item 12 2.33 0.46 1.46 1.17 1.92 1.00 1.96 0.92 0.42 0.25 1.50 0
Item 13 2.46 1.13 2.13 2.00 2.29 1.50 1.79 1.08 2.21 0.25 1.25 0
Item 14 1.88 1.29 1.29 0.67 1.75 0.54 2.46 1.00 2.29 0.42 1.63 0
Item 15 2.46 0.54 1.96 2.00 2.17 1.21 2.08 1.96 0.29 0.38 1.54 0
Item 16 2.58 0.50 0.46 0.79 2.13 0.83 1.83 0.96 1.04 0.25 1.29 1
Item 17 2.17 0.83 1.71 1.92 2.04 0.96 2.04 1.79 0.42 0.17 0.92 0
Item 18 2.71 1.46 1.92 1.13 1.92 1.63 1.96 1.33 1.00 0.25 1.38 1
Item 19 2.08 0.50 0.96 0.79 1.92 1.71 2.29 1.38 2.58 0.63 1.63 1
Item 20 2.71 0.75 1.50 1.71 1.88 0.83 2.58 1.29 0.46 0.13 1.04 2
Item 21 2.33 0.46 1.75 1.00 2.04 0.83 2.71 1.21 0.46 0.17 2.50 2
Item 22 2.88 1.00 2.38 1.71 1.88 1.29 0.50 1.63 0.13 0.29 1 1
Item 23 3.00 0.75 2.29 2.29 2.08 2.46 1.83 1.54 0.13 0.38 1.08 1
Item 24 2.83 0.88 2.13 1.54 2.17 1.08 0.38 1.00 0.13 0.25 0.42 1
Item 25 2.38 0.71 1.63 1.75 2.83 1.50 2.33 0.88 0.63 0.50 1.63 1
Item 26 2.83 0.58 2.17 1.50 2.08 1.13 0.83 1.17 0.13 0.75 0.58 1
Item 27 2.54 1.17 1.67 1.88 2.63 2.04 2.13 2.00 0.92 1.50 1.04 2
Item 28 2.71 0.75 1.63 1.50 2.88 2.00 2.71 2.50 1.17 0.50 0.75 4
Item 29 2.71 1.00 1.54 1.25 3.00 2.25 2.08 1.88 1.46 1.17 1.08 2
Item 30 2.71 0.63 1.75 1.13 2.29 1.67 2.21 1.21 0.79 0.71 0.58 1
Total 15 0 0 0 4 0 6 1 1 0 2 29
Cells are shaded if the 2.50 standard is met.
21
It is clear from Table 6 that the paper-based reading items used in this pilot study did not assess many of the behaviors under consideration for targeting in the new TOEFL. If one were using these data to manage the item writing process, it might be reasonable to conclude that Tasks 1, 3, and 7 were sufficiently covered and to focus item development on the remaining eight tasks, with particular attention paid to the five task statements with no linkages at all.
Table 7 shows that only 8 of the 30 writing items were linked to one or more of the task
statements. Items 29 and 30, which are essay prompts, were most often linked to the task statements. These items were taken from the Test of Written English and required students to write an essay. The remaining 28 items used a single-sentence format. The writing task statements indicate or strongly imply that productive writing is necessary in order to assess their attainment. This may explain why most of the multiple-choice items were not linked to any of the task statements. Task 9 (“Demonstrate a command of standard written English, including grammar, phrasing, effective sentence structure, spelling, and punctuation”) was the only task to have items other than the two essay questions (numbers 29 and 30) linked to it. The other six items linked to Task 9 assessed various aspects of sentence structure. Clearly, item types or formats other than those included in the paper-based TOEFL used in this pilot study will be needed to assess the writing skills being considered for the new TOEFL.
Table 8 shows that 15 items were linked to listening Task 1 (“Understand factual
information and details”) and it appears to be well covered. Task 7 (“Make appropriate inferences based on information in a lecture, discussion, or conversation”) had six items linked to it. Task 6 (“Distinguish between important information and minor details”) had four items linked to it. Five tasks had no linkages at all, and three tasks had either one or two item linkages. Clearly, item types other than those included in the paper-based TOEFL used in this pilot study will be needed to assess the listening skills being targeted for the new TOEFL.
Summary of item rating. Two types of evidence of rater agreement were provided. The
mean ratings assigned by ETS test specialists and ESL faculty to designate the degree of each item’s relationship to each of the tasks in each content/skill area were used to compute correlation coefficients for each test item. This analysis was conducted to determine the extent to which the item ratings of ETS test specialists and ESL faculty agreed on the profile of their ratings for each test item across the tasks in each of the three content areas (reading, writing, and listening). All 30 correlations were statistically significant at the .05 level or less for writing, and 28 of the 30 correlation coefficients (93%) were statistically significant at the .05 level or less for reading and listening. This indicates that both sets of raters agreed on the profile of item ratings for each of the three content areas.
A percent agreement analysis was conducted as a way of describing the level of interrater
agreement. Two sets of conditions were used to define agreement. Under one condition, agreement was said to occur if at least 70% of the raters provided an item-task rating of 2.0 (moderately related) or above. The alternative condition for agreement occurred if at least 70% of the raters provided an item-task rating below 2.0 (slightly related or unrelated). There was agreement on 72% of the ratings provided for reading, 85% for writing, and 71% for listening. It was felt that the item-task ratings meeting the standard were sufficiently reliable for further use in the item-linking portion of this pilot study.
22
A mean rating of 2.5 (strongly related) was set as the standard for establishing a linkage between an item and a task. In addition, the item-task rating also had to meet the 70% standard for interrater reliability. It should be noted that all item-task ratings meeting the 2.5 standard also met the 70% agreement standard. This outcome should not be surprising, because the use of a 2.5 standard on a 0-3 rating scale is a high standard that can only be met by having most raters provide a rating of either a 2 or a 3. The use of a high mean rating standard tends to ensure a high level of interrater agreement for the item-task ratings meeting that standard.
Although a number of linkages were made for each content/skill area, it was clear that the
paper-based TOEFL did not assess the full range of skills under consideration for the new TOEFL. The results indicate that the procedures employed in this portion of the study provide an efficient means of assessing the relevance of a test item to a real-world academic task. This process could also be used to evaluate an item pool and identify important tasks that are underrepresented in that item pool. Additional items could then be written to assess those parts of the test domain not fully covered. Discussions with ETS test specialists and ESL faculty indicate that they found the linking process delineated in this study to be a useful adjunct to the test development process. The Criterion Study
BARS were used by ESL faculty from each of the three participating schools to rate the
ability of their students to perform 32 reading, writing, and listening tasks. As described earlier, these tasks had been judged to be important for competent academic performance as well as being related to successful academic performance.
Nineteen ESL faculty members at the three participating schools rated 152 students.
Thirty-four students from Drexel University were rated along with 77 from Hunter College and 41 from Rutgers University. In most cases, a different faculty member rated the ability of a given student to perform the reading tasks, the writing tasks, and the listening tasks. In one school (Rutgers University), two faculty members were able to rate the ability of students to perform each of the 32 tasks. A majority of faculty reported being able to observe all 32 tasks that were being rated. Task 2 (“Locate and understand information provided in non-prose documents”) and Task 15 (“Produce writing that effectively summarizes and paraphrases the works and words of others”) were reported to be the most difficult to observe.
The mean ratings, standard deviations, standard error of the means, and percentage of
zero responses for each task statement for the total group of students are presented in Table 9. These same results for each of the three schools are presented in Appendix E. These results indicate that, on average, the participating students were judged to perform these tasks well (mean ratings above 3.50), as one might expect with relatively advanced ESL students. A standard deviation of about one point indicates some variability in the ratings that likely reflects the range in ability level within this cohort of students.
23
Table 9 Faculty Ratings of Student Performance by Task for the Total Group of Students
(N =152)
Reading
Tasks Mean SD SE %0 Writing
Tasks Mean SD SE %0 Listening
Tasks Mean SD SE %0
1 3.84 .96 .08 1 12 3.85 .92 .07 1 26 3.91 .96 .08 0
2 3.72 .94 .08 34 13 3.66 .96 .08 1 27 4.10 .94 .08 0
3 3.63 .92 .07 1 14 3.69 .99 .08 2 28 3.94 .90 .07 0
4 3.79 .95 .08 1 15 3.12 1.21 .10 28 29 3.74 .89 .07 0
5 4.15 .87 .07 8 16 3.69 1.10 .09 1 30 3.94 .96 .08 0
6 3.91 .94 .08 1 17 3.57 .93 .08 1 31 3.87 1.00 .08 0
7 3.73 .94 .08 9 18 3.80 .98 .08 1 32 3.74 .91 .07 0
8 3.72 .92 .07 11 19 3.95 .97 .08 1 33 3.89 .96 .08 1
9 3.70 1.01 .08 10 20 3.50 .91 .07 1 34 3.94 .97 .08 1
10 3.76 .93 .08 9 21 3.57 .89 .07 1 35 3.83 1.00 .08 0
11 3.78 .95 .08 8 * 36 3.79 1.02 .08 0
* Items 22-25 dealt with speaking tasks that were not included in this study. The above numbering reflects the numbering in the job analysis
questionnaire used in the Rosenfeld et al. (2001) study.
Table 10 contains the intercorrelation of the faculty rating scales. A subscore for reading was obtained by summing the 11 reading ratings. A similar process occurred for writing and listening. The intercorrelations of the rating scales range from .62 to .74. This indicates a moderate relationship across rating scales, but also indicates that each of the three scales appears to be measuring some unique aspect of a student’s language proficiency. These intercorrelations are somewhat lower than those obtained among TOEFL subtest scores which range from .69 to .76 for the computer-based test and from .68 to .80 for the paper-based test. A total score for each student was also obtained by summing the ratings across the three rating scales. The correlations between these scales (reading, writing, listening) and the total score are part-whole correlations.
Table 10 Intercorrelation of Faculty Ratings of Student Performance On Reading, Writing, and Listening Tasks
1 2 3 4
1. Reading 1.00
2. Writing .65 1.00
3. Listening .74 .62 1.00
4. TOTAL .92 .82 .87 1.00
24
Coefficient alphas were computed for each rating scale to obtain an estimate of the internal consistency reliability of the faculty ratings. These results are presented in Table 11. The reliability estimates range from .97 for writing to .98, indicating that each rating scale is internally consistent.
Table 11 Coefficient Alpha Estimates of Reliability for Faculty Ratings of Student Performance On Reading, Writing, and Listening Tasks
Reading .98
Writing .97
Listening .98
One of the participating schools, Rutgers University, provided two raters who were able
to rate each student using the reading, writing, and listening rating scales. This provided an opportunity to obtain an estimate of how well two raters agree on their evaluations of students’ ability to perform the reading, writing, and listening tasks. Intraclass correlation coefficients were computed separately for the ratings provided for each task statement. The reliability of the ratings for both raters is provided in Table 12.
Table 12 Intraclass Correlations (Adjusted Using the Spearman Brown Formula) for Two Faculty Raters Rating ESL Students’ Ability to Perform Reading, Writing, and Listening Tasks
(N’s range from 36 to 38)
Reading Tasks
Intraclass Correlation
Writing Tasks
Intraclass Correlation
Listening Tasks
IntraclassCorrelation
1 .91 1 .59 1 .90 2 .86 2 .74 2 .91 3 .72 3 .72 3 .85 4 .87 4 .90 4 .85 5 .90 5 .81 5 .87 6 .82 6 .68 6 .87 7 .70 7 .82 7 .92 8 .73 8 .86 8 .93 9 .91 9 .80 9 .95
10 .84 10 .73 10 .94 11 .84 11 .93
For reading, reliabilities range from .70 to .91, with a median reliability of .84. For
writing, the reliabilities range from .59 to .90, with a median of .74. For listening, the reliabilities range from .85 to .95, with a median of .91. These results indicate that raters were in agreement when evaluating students’ ability to perform the reading, writing, and listening tasks assessed by
25
these scales. The reliability estimates are sufficiently high to warrant their use as possible criterion measures in future validity studies of the new TOEFL examination.
Relationship between faculty ratings and end-of-course ratings. Each of the three
participating schools produces a set of end-of-course ratings for each student that it uses for internal purposes. The following analyses were conducted to determine the relationship between the ratings obtained from the Faculty Member’s Student Evaluation Form developed in this project and the end-of-course ratings provided as part of the standard procedures used in each of the participating schools.
Table 13 presents the results obtained from the Faculty Member’s Student Evaluation
Form at Drexel University and the end-of-course ratings provided for students in its ESL classes. Two overall ratings are provided for each student, one obtained from the speaking/listening class and the second from the reading/writing class. Each overall rating is based on a number of different criteria that are rated on a 1-5 scale and then summed.
Table 13 Correlations of Faculty Ratings of Student Performance on Reading, Writing, and Listening Tasks With End-of-Course Faculty Ratings of Speaking/Listening and Reading/Writing for Participating Students at Drexel University
(N’s range from 32 to 35)† 1 2 3 4 5 6 1. Reading Total 1.00 2. Writing Total .38 1.00 3. Listening Total .44 .50 1.00 4. Total Scale .84 .69 .80 1.00 5. Drexel Speaking/Listening **.40 **.50 **.62 **.63 1.00 6. Drexel Reading/Writing *.29 **.60 *.46 **.56 .59 1.00
* Statistically significant at the .05 level of confidence ** Statistically significant at the .01 level of confidence † Statistical significance is only shown for the correlations between the Drexel University end-of-course ratings and the
experimental rating scales. The reading/writing score is based on the following factors or criteria: reading
comprehension, inferencing, vocabulary, grammatical structures and mechanics, communication effectiveness, essay format, development of ideas, use of source material, writing process, and fulfillment of class responsibilities. The last factor is an assessment based on classroom participation that includes completing classroom assignments as well as attendance. The speaking/listening score is based on the following factors or criteria: pronunciation/fluency, vocabulary, listening comprehension in informal contexts, listening comprehension in formal contexts, grammatical competence, strategic competence, presentations, and fulfillment of class responsibilities. The last factor is similar to the one in the reading/writing score described above.
26
The intercorrelations of faculty ratings of student performance for reading, writing, and listening ranged from. 38 to .50, indicating moderate relationships across rating scales. The correlation of reading, writing, and listening scales with the total scale (computed by summing the ratings from each of the three scales) ranged from .69 to .84. These are part-whole correlations. Statistically significant correlation coefficients were obtained when correlating the reading, writing, listening, and total scales with the two end-of-course ratings produced by Drexel ESL faculty. These correlations ranged from .40 to .62 for the speaking/listening score and from .29 to .60 for the reading/writing score. The correlation between the two end-of-course scores was .59. These results indicate that the experimental rating scales developed in this study were significantly related to the end-of-course ratings provided by Drexel University ESL faculty.
Table 14 presents the results obtained from the Faculty Member’s Student Evaluation
Form at Hunter College and the end-of-course ratings provided for students in its ESL classes. Hunter College produces two overall ratings for each student on a 1-5 point rating scale. One score is provided for “core” that is an evaluation of reading and writing proficiency. The second is an evaluation of students’ grammar and oral skills proficiencies.
Table 14 Correlations of Faculty Ratings of Student Performance on Reading, Writing, and Listening Tasks With End-of-Course Faculty Ratings of Grammar/OS and Core for Participating Students at Hunter College
N’s range from 41 – 77† 1 2 3 4 5 6 1. Reading Total 1.00
2. Writing Total .45 1.00
3. Listening Total .76 .33 1.00
4. Total Scale .90 .66 .87 1.00
5. Hunter Grammar/OS .18 **.35 .12 *.25 1.00
6. Core **.56 **.51 **.53 **.67 .24 1.00
* Statistically significant at the .05 level of confidence ** Statistically significant at the .01 level of confidence † Statistical significance is only shown for the correlations between the Hunter College end-of-course ratings and the
experimental rating scales. The intercorrelations of faculty ratings of student performance for reading, writing, and
listening ranged from .33 to .76, indicating a moderate relationship across rating scales. The correlation of reading, writing, and listening scales with the total scale (part-whole correlations) ranged from .66 to .90. Significant correlation coefficients were obtained for the writing and total scales with grammar and oral skills; these correlations were .35 and .25, respectively. Reading, writing, listening, and the total scale all yielded significant relationships with the “core” rating; the correlations ranged from .51 to .67. The correlation between the two end-of-course ratings
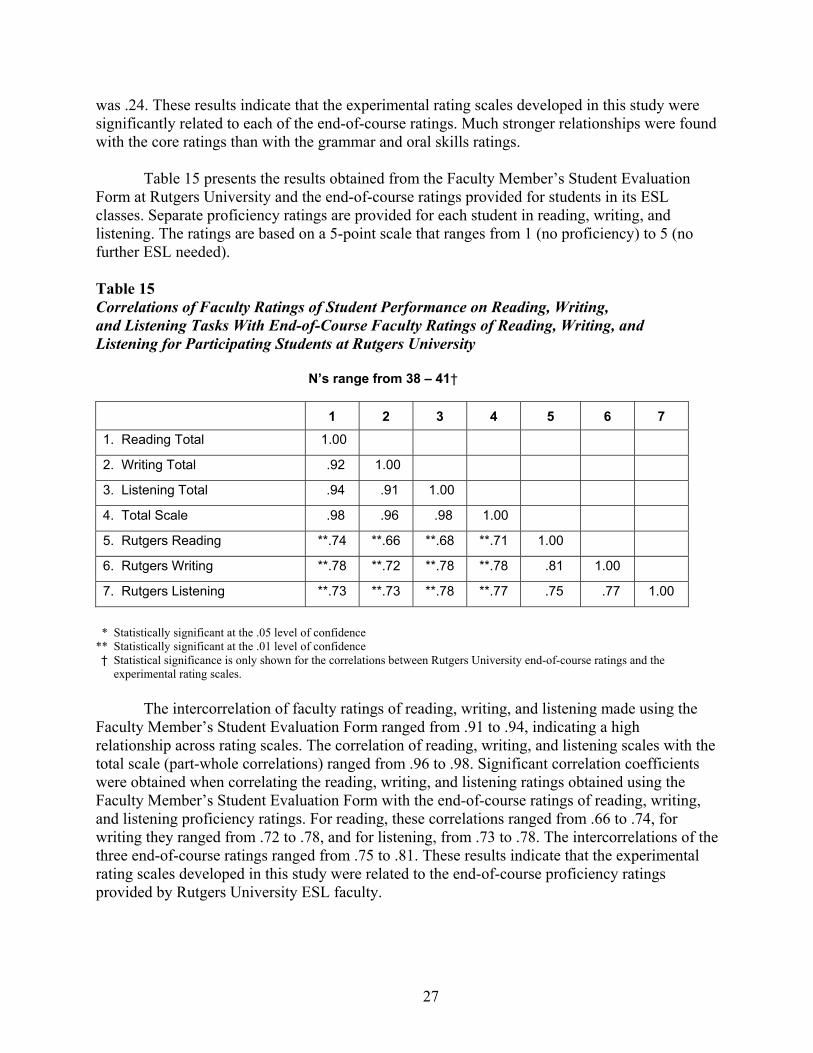
27
was .24. These results indicate that the experimental rating scales developed in this study were significantly related to each of the end-of-course ratings. Much stronger relationships were found with the core ratings than with the grammar and oral skills ratings.
Table 15 presents the results obtained from the Faculty Member’s Student Evaluation
Form at Rutgers University and the end-of-course ratings provided for students in its ESL classes. Separate proficiency ratings are provided for each student in reading, writing, and listening. The ratings are based on a 5-point scale that ranges from 1 (no proficiency) to 5 (no further ESL needed). Table 15 Correlations of Faculty Ratings of Student Performance on Reading, Writing, and Listening Tasks With End-of-Course Faculty Ratings of Reading, Writing, and Listening for Participating Students at Rutgers University
N’s range from 38 – 41† 1 2 3 4 5 6 7 1. Reading Total 1.00
2. Writing Total .92 1.00
3. Listening Total .94 .91 1.00
4. Total Scale .98 .96 .98 1.00
5. Rutgers Reading **.74 **.66 **.68 **.71 1.00
6. Rutgers Writing **.78 **.72 **.78 **.78 .81 1.00
7. Rutgers Listening **.73 **.73 **.78 **.77 .75 .77 1.00
* Statistically significant at the .05 level of confidence ** Statistically significant at the .01 level of confidence † Statistical significance is only shown for the correlations between Rutgers University end-of-course ratings and the
experimental rating scales. The intercorrelation of faculty ratings of reading, writing, and listening made using the
Faculty Member’s Student Evaluation Form ranged from .91 to .94, indicating a high relationship across rating scales. The correlation of reading, writing, and listening scales with the total scale (part-whole correlations) ranged from .96 to .98. Significant correlation coefficients were obtained when correlating the reading, writing, and listening ratings obtained using the Faculty Member’s Student Evaluation Form with the end-of-course ratings of reading, writing, and listening proficiency ratings. For reading, these correlations ranged from .66 to .74, for writing they ranged from .72 to .78, and for listening, from .73 to .78. The intercorrelations of the three end-of-course ratings ranged from .75 to .81. These results indicate that the experimental rating scales developed in this study were related to the end-of-course proficiency ratings provided by Rutgers University ESL faculty.
28
Summary of rating study results. Mean ratings provided by faculty using the Faculty Member’s Student Assessment Form indicated that students, on average, were rated as being able to perform these tasks well. This is consistent with the criterion used to select students for participation in this project that required that students have a sufficient level of English language proficiency to take the TOEFL examination. The intercorrelation of rating scales range from .62 to .74, similar to the intercorrelation of TOEFL subscores. The internal consistency reliability of each scale was high (.97 for reading, .96 for writing, and .98 for listening).
For the one school that was able to have two raters rate each student’s performance of
each task, intraclass correlation coefficients were computed separately for each task. The median reliability of the means for both raters for reading tasks was .84, for writing .74, and for listening .91. These results indicate that raters were in good agreement when evaluating students’ ability to perform the reading, writing, and listening tasks included in this study.
The relationship of the ratings obtained using the Faculty Member’s Student Rating Form
and end-of-course ratings varied by school. For Drexel University, statistically significant correlation coefficients were obtained for each rating scale and the two end-of-course ratings provided (speaking/listening and reading/writing). For Hunter College, statistically significant correlation coefficients were obtained for each of their two end-of-course ratings (grammar/oral skills and core). The strongest relationships were found with the core rating. For Rutgers University, statistically significant correlation coefficients were obtained with the reading, writing, and listening ratings obtained using the Faculty Member’s Student Rating Form and the three ratings given all students at the end of their coursework (reading, writing, and listening).
Overall, faculty ratings of students using the experimental ratings developed in this
project appear to be reliable and related to the ratings provided by faculty at each of the participating schools as part of their end-of-course administrative procedures.
Discussion
The purpose of the study described in this report was to investigate the feasibility of two
complementary approaches to assessing the validity of new versions of the TOEFL examination. The content relevance and representativeness strategy provides information on how the construct (English language proficiency) was defined as well as evidence of the degree to which the test items measure that construct. The criterion-related validity strategy provides evidence of the degree to which test scores are related to an external (to the test) evaluation of proficiency.
Item Rating Study
The item rating study described in this report was designed to be consistent with Standard
1.6 of the 1999 “APA Standards.” That standard states (p.16): When the validation rests in part on the appropriateness of test content, the procedures followed in specifying and generating test content should be described and justified in reference to the construct the test is intended to measure or the domain it is intended to represent...
29
The comment to this standard is also important to consider. It states: For example, test developers might provide a logical structure that maps the items on the test to the content domain, illustrating the relevance of each item and the adequacy with which the set of items represents the content domain. Areas of the content domain that are not included among the test items could be indicated as well. The item rating study built on research that was conducted in support of the new TOEFL.
First a series of papers were written to define the theoretical frameworks for reading, writing, listening, and speaking that would support the development of the new test (Bejar et al., 2000; Butler et al., 2000; Cumming et al., 2000; Enright et al., 2000; and Jamieson et al., 2000). Rosenfeld et al. (2001) used these frameworks to construct reading, writing, listening, and speaking tasks that were judged to be important for competent academic performance by faculty and students at both the undergraduate and graduate levels. It was these task statements that were used to define the construct domain to which existing paper-based TOEFL test questions were linked. If these task statements form the basis for the new TOEFL test specifications or can be clearly linked to them, this linking process adds to the documentation of validity. The use of external experts in addition to ETS test specialists in the linking process enhances the validity information.
The results obtained in the item rating study indicate that ETS test specialists and ESL
faculty were able to use the rating procedures and generally agreed in their ratings linking test items to task statements. The tables developed based on the mean ratings obtained from each of the two groups of raters provided a good summary of the number of tasks to which a given item was linked as well as the number of items linked to each task statement. If the task statements reflect the test specifications, this would indicate how well the test specifications were covered and where additional items were needed. In addition to providing evidence in support of validity based on content relevance and representativeness, the tables can be used as a tool to manage the test development process. For example, if a number of test items are linked to multiple task statements, some of them could be assigned to the tasks with the least coverage. If some parts of the test specifications are not well covered, those areas could be made the focus of more intense test development and/or trigger the need for new item types to assess them. The item rating procedures appear to be useful for providing data to support the validity of an examination as well as being an aid in managing the test development process.
The results indicated that the paper-based TOEFL items did not cover the likely content
domain of the new TOEFL very well. This is not surprising because those items were developed to meet a different set of test specifications. It should be recognized that because the items in this study were used as a proxy for the new TOEFL items and the tasks were a proxy for the set of tasks or test specifications to be used for the new test, the procedures in this study will have to be modified to evaluate the new test. It is recommended that construct specialists be involved in developing detailed training materials for the item raters before the item ratings are conducted. These materials should reflect the most up-to-date definitions of the tasks included in the new TOEFL. It is likely that such training will improve the interrater reliability of the ratings. The use of a high mean rating standard (e.g., a mean rating of 2.5) will also help to ensure a reasonable
30
level of reliability. To be most useful, these revised procedures should be used on an a priori basis to aid in the selection of items for inclusion in the new TOEFL.
Faculty Ratings
The BARS developed in this study and used to create the Faculty Member’s Student
Evaluation Form were designed as a possible criterion measure in studies to aid in supporting the validity of the new TOEFL. The rating scales were found to be internally consistent and when two raters were able to rate a student on the same task, the two raters tended to agree in their rating. When these experimental ratings were correlated with the end-of-course proficiency ratings that are part of each school’s administrative process, statistically significant correlation coefficients were obtained with these criteria in each school (correlations ranged from .25 to .80). Clearly, the experimental scales developed in this study and the end-of-course ratings measure overlapping aspects of English language proficiency.
The end-of-course ratings were designed to meet the educational and administrative
needs of each participating institution. As a result, they are likely to assess some elements that are not part of TOEFL. For example, the two ratings provided at Drexel University include evaluations of classroom participation, attendance, and the completion of classroom assignments. The primary advantage of using the scales contained in the Faculty Member’s Student Evaluation Form to aid in assessing the validity of the new TOEFL is that they assess the same skills purported to be measured by the new TOEFL and, therefore, should provide a more accurate evaluation of its validity. In addition, they could function as a common criterion measure for use across schools and would provide an opportunity to evaluate the reliability of these scales in many of the studies in which they were used. It is likely to be quite difficult, if not impossible, to assess the reliability of the end-of-course ratings provided by many schools.
Just as with the item rating procedures, changes in the tasks assessed by the new TOEFL
must be reflected in revised rating scales. Construct specialists should participate in selecting and phrasing the task statements and behavioral anchors to ensure that they reflect the most current design and are in alignment with the most current TOEFL constructs. In addition, rating scales will need to be developed to assess the speaking tasks included in the new TOEFL.
31
Conclusions This pilot study was designed to answer the following methodological questions.
1. Can item rating procedures be developed that ETS test specialists and external ESL instructors can use to link TOEFL items to important academic reading, writing, and listening tasks? The answer appears to be yes. Both ETS specialists and ESL faculty indicated that they
were able to use the linking procedures and found the process useful. The tables presenting these results provide a good summary of how well the tasks are covered by the item pool as well as indicating the number of tasks to which each item is linked. This type of presentation of results is directly related to the commentary provided in the Standards for Educational and Psychological Measurement under validity standard 1.6, which emphasizes the need for test developers to provide a structure for linking items on the test to the content domain. In addition, results of this type provide useful information for managing the test development process. These procedures can be used to identify the content areas in which additional item writing should be focused as well as where the development of new item types may be necessary to more adequately assess underrepresented areas of that domain. The item rating process could also be used as an early step in the evaluation of new item types to ensure that they are related to the task statements they were designed to assess. Another application of the item rating process would be to demonstrate the differences in item coverage of the content domains of older versions of the TOEFL (e.g., paper-based) and new versions of TOEFL.
2. Can the task statements judged to be important for competent academic performance in a
previous study (Rosenfeld et al., 2001), be used to develop rating scales that can be used by ESL faculty to evaluate students’ current levels of proficiency with regard to those tasks? The answer to this question also appears to be yes. The behaviorally anchored rating
scales used to build the Faculty Member’s Student Assessment Form appeared to work well. They demonstrated reasonable reliability and were correlated with end-of-course measures of students’ English language proficiency in each of the three participating schools. ESL faculty members were active participants in the design of the behaviorally anchored rating scales and indicated that they had little or no trouble using them to evaluate their students’ English proficiency. These scales or others developed using similar procedures could be used to assist in the validation of the new TOEFL. These scales would need to be aligned with the claims that are the basis for new versions of TOEFL and should provide a more accurate assessment of the validity of TOEFL than do existing school measures that were designed to meet schools’ instructional and administrative needs.
3. Is it feasible to design and conduct a criterion-related validity study in which faculty
ratings of proficiency on academically relevant reading, writing, and listening tasks can be collected close in time to a TOEFL administration?
32
Discussions with ESL faculty and ETS program direction staff were used to help answer this question. Both ESL faculty and ETS program staff believe it would be possible to collect ratings, using scales like those developed in this study, toward the end of ESL courses and to also arrange for an administration of TOEFL close in time to the conduct of the rating process. A study of this type would use both a predictor (TOEFL) and criterion measures (faculty ratings) that assess the same or very similar domains. In addition, the scores would be collected soon after each other, thus reducing the measurement error associated with learning that takes place between the time the TOEFL test is given and the ratings are obtained. Because TOEFL was designed to evaluate English proficiency and not to predict grades in college, it would seem that criterion-related validity studies conducted in ESL programs that use an evaluation of English proficiency as the criterion measure and ESL faculty as assessors would provide an appropriate evaluation of the validity of the TOEFL test.
33
References
American Educational Research Association, American Psychological Association, & National Council on Measurement in Education (1999). Standards for educational and psychological testing. Washington, DC: American Psychological Association.
Angoff, W. A., and Sharon, A. T. (1970). A comparison of scores earned on the Test of English
as a Foreign Language by native American college students and foreign applicants to United States colleges. (ETS Research Bulletin No. 70-8). Princeton, NJ: Educational Testing Service.
Bachman, L. & Palmer, A. F. (1996). Language Testing in Practice. Oxford and New York:
OUP. Bejar, I., Douglas, D., Jamieson, J., Nissan, S., & Turner, J. (2000). TOEFL 2000 listening
framework: A working paper. (TOEFL Monograph Series Rep. No. 19). Princeton, NJ: Educational Testing Service.
Butler, F. A., Eignor, D., Jones, S., McNamara, T., & Suomi, B. (2000). TOEFL 2000 speaking
framework: A working paper. (TOEFL Monograph Series Rep. No. 20). Princeton, NJ: Educational Testing Service.
Carson, J. G., Chase, N. D., Gibson, S. U., & Hargrove, M. F. (1992). Literacy demands of the
undergraduate curriculum. Reading Research and Instruction, 31, 25-50. Clark, J. L. D. (1977). The performance of native speakers of English on the Test of English as a
Foreign Language. (TOEFL Research Rep. 1). Princeton, NJ: Educational Testing Service.
Cumming, A., Kantor, R., Powers, D., Santos, T., & Taylor, C. (2000). TOEFL 2000 writing
framework: A working paper. (TOEFL Monograph Series Rep. No. 18). Princeton, NJ: Educational Testing Service.
Educational Testing Service (1999). TOEFL Practice Tests Workbook (Vol. 1). Princeton, NJ:
Author. Educational Testing Service (1999). TOEFL Test of Written English Guide (4th ed.). Princeton,
NJ: Author. Educational Testing Service (2000).Computer-Based TOEFL Score User Guide, 2000-2001
edition. Princeton, NJ: Author. Enright, M., Grabe, W., Koda, K., Mosenthal, P., Mulcahy-Ernt, P., & Schedl, M. (2000).
TOEFL 2000 reading framework: A working paper. (TOEFL Monograph Series Rep. No. 17). Princeton, NJ: Educational Testing Service.
34
Henning, G., & Cascallar, E. (1992). A preliminary study of the nature of communicative competence. (TOEFL Research Rep. 36). Princeton, NJ: Educational Testing Service.
Jamieson, J., Jones, S., Kirsch, I., Mosenthal, P., & Taylor, C. (2000). TOEFL 2000 framework:
A working paper. (TOEFL Monograph Series Rep. No. 16). Princeton, NJ: Educational Testing Service.
Maxwell, A. (1965). A comparison of two English as foreign language tests. Unpublished
manuscript. University of California (Davis). Messick, S. (1989). Validity. In Linn, R. L. (Ed.), Educational Measurement. New York:
Macmillan, 13-103. North, B. (1999). Scales for rating language performance: Descriptive models, formulation
styles, and presentation formats. Unpublished TOEFL 2000 Research Paper. Princeton, NJ: Educational Testing Service.
Pike, L. (1979). An evaluation of alternative item formats for testing English as a foreign
language. (TOEFL Research Rep. 2). Princeton, NJ: Educational Testing Service. Rosenfeld, M., Leung, S., & Oltman, P. K. (2001). The reading, writing, speaking, and listening
tasks important for academic success at the undergraduate and graduate levels. (TOEFL Monograph Series Rep. No. 21). Princeton, NJ: Educational Testing Service.
Shohamy, E., Gordon, C. M., & Kramer, R. (1992). The effect of raters’ background and training
on the reliability of direct writing tests. Modern Language Journal, 76, 202-220. Smith, P. C., & Kendall, L. M. (1963). Retranslation of expectations: An approach to the
construction of unambiguous anchors for rating scales. Journal of Applied Psychology, 47(2),149-155.
Upshur, J. A. (1966). Comparison of performance on “Test of English as a Foreign Language”
and “Michigan Test of English Language Proficiency.” Unpublished manuscript. University of Michigan.
Weir, C. J. (1988). Construct validity. In Hughes, A., Porter, D., & Weir, C. J. (Eds.), ELTS
Validation Project: Proceedings. ELTS Research Report 1 (ii). London: British Council and Cambridge Local Examinations Syndicate, 15-25.
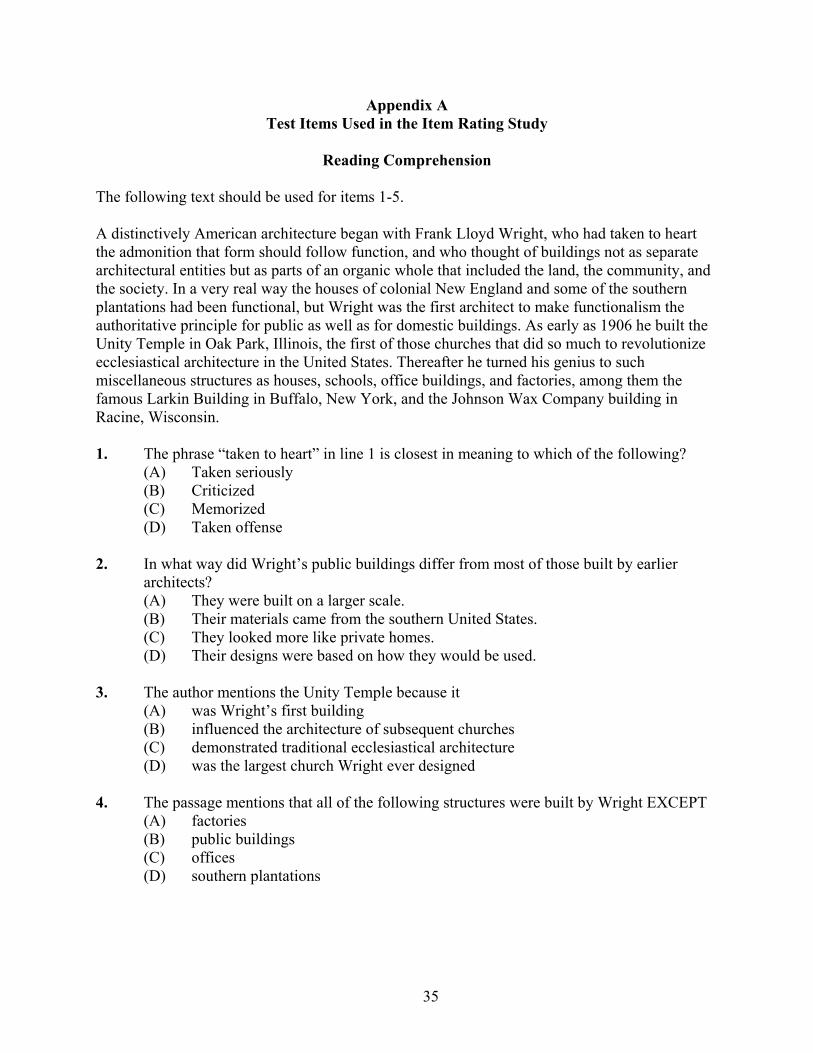
35
Appendix A Test Items Used in the Item Rating Study
Reading Comprehension
The following text should be used for items 1-5. A distinctively American architecture began with Frank Lloyd Wright, who had taken to heart the admonition that form should follow function, and who thought of buildings not as separate architectural entities but as parts of an organic whole that included the land, the community, and the society. In a very real way the houses of colonial New England and some of the southern plantations had been functional, but Wright was the first architect to make functionalism the authoritative principle for public as well as for domestic buildings. As early as 1906 he built the Unity Temple in Oak Park, Illinois, the first of those churches that did so much to revolutionize ecclesiastical architecture in the United States. Thereafter he turned his genius to such miscellaneous structures as houses, schools, office buildings, and factories, among them the famous Larkin Building in Buffalo, New York, and the Johnson Wax Company building in Racine, Wisconsin.
1. The phrase “taken to heart” in line 1 is closest in meaning to which of the following?
(A) Taken seriously (B) Criticized (C) Memorized (D) Taken offense
2. In what way did Wright’s public buildings differ from most of those built by earlier architects? (A) They were built on a larger scale. (B) Their materials came from the southern United States. (C) They looked more like private homes. (D) Their designs were based on how they would be used.
3. The author mentions the Unity Temple because it (A) was Wright’s first building (B) influenced the architecture of subsequent churches (C) demonstrated traditional ecclesiastical architecture (D) was the largest church Wright ever designed
4. The passage mentions that all of the following structures were built by Wright EXCEPT (A) factories (B) public buildings (C) offices (D) southern plantations
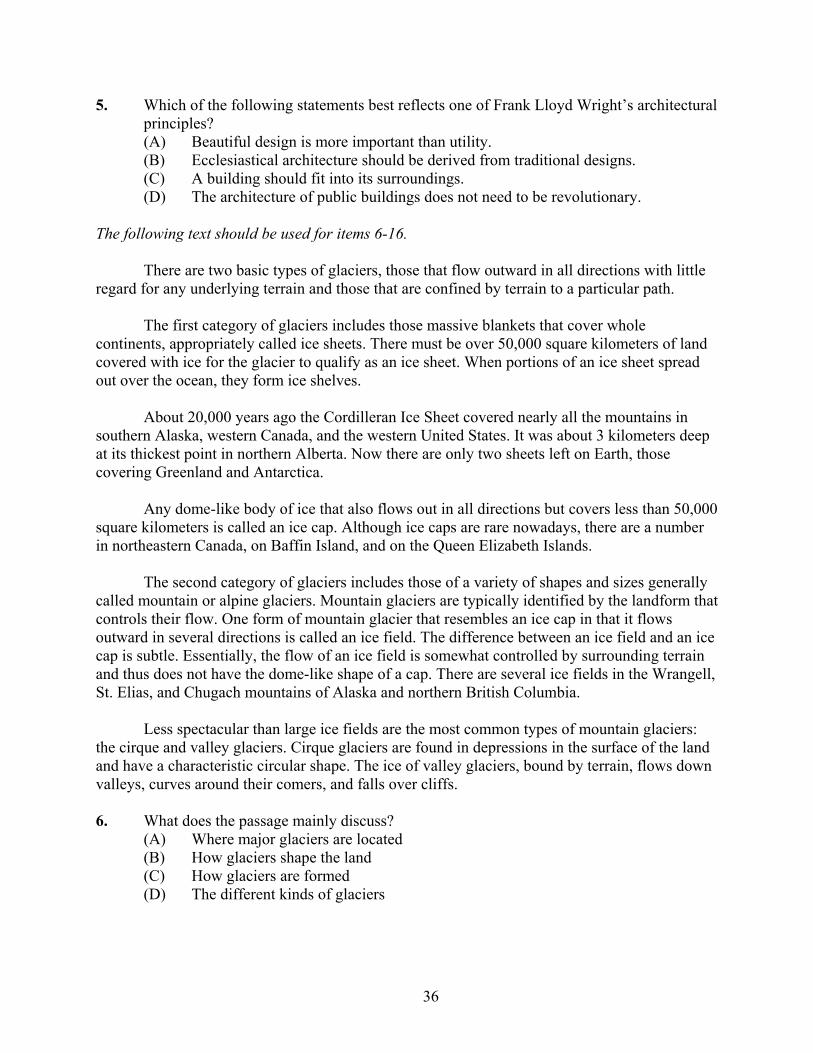
36
5. Which of the following statements best reflects one of Frank Lloyd Wright’s architectural principles? (A) Beautiful design is more important than utility. (B) Ecclesiastical architecture should be derived from traditional designs. (C) A building should fit into its surroundings. (D) The architecture of public buildings does not need to be revolutionary.
The following text should be used for items 6-16. There are two basic types of glaciers, those that flow outward in all directions with little
regard for any underlying terrain and those that are confined by terrain to a particular path. The first category of glaciers includes those massive blankets that cover whole
continents, appropriately called ice sheets. There must be over 50,000 square kilometers of land covered with ice for the glacier to qualify as an ice sheet. When portions of an ice sheet spread out over the ocean, they form ice shelves.
About 20,000 years ago the Cordilleran Ice Sheet covered nearly all the mountains in
southern Alaska, western Canada, and the western United States. It was about 3 kilometers deep at its thickest point in northern Alberta. Now there are only two sheets left on Earth, those covering Greenland and Antarctica.
Any dome-like body of ice that also flows out in all directions but covers less than 50,000
square kilometers is called an ice cap. Although ice caps are rare nowadays, there are a number in northeastern Canada, on Baffin Island, and on the Queen Elizabeth Islands.
The second category of glaciers includes those of a variety of shapes and sizes generally
called mountain or alpine glaciers. Mountain glaciers are typically identified by the landform that controls their flow. One form of mountain glacier that resembles an ice cap in that it flows outward in several directions is called an ice field. The difference between an ice field and an ice cap is subtle. Essentially, the flow of an ice field is somewhat controlled by surrounding terrain and thus does not have the dome-like shape of a cap. There are several ice fields in the Wrangell, St. Elias, and Chugach mountains of Alaska and northern British Columbia.
Less spectacular than large ice fields are the most common types of mountain glaciers:
the cirque and valley glaciers. Cirque glaciers are found in depressions in the surface of the land and have a characteristic circular shape. The ice of valley glaciers, bound by terrain, flows down valleys, curves around their comers, and falls over cliffs.
6. What does the passage mainly discuss?
(A) Where major glaciers are located (B) How glaciers shape the land (C) How glaciers are formed (D) The different kinds of glaciers
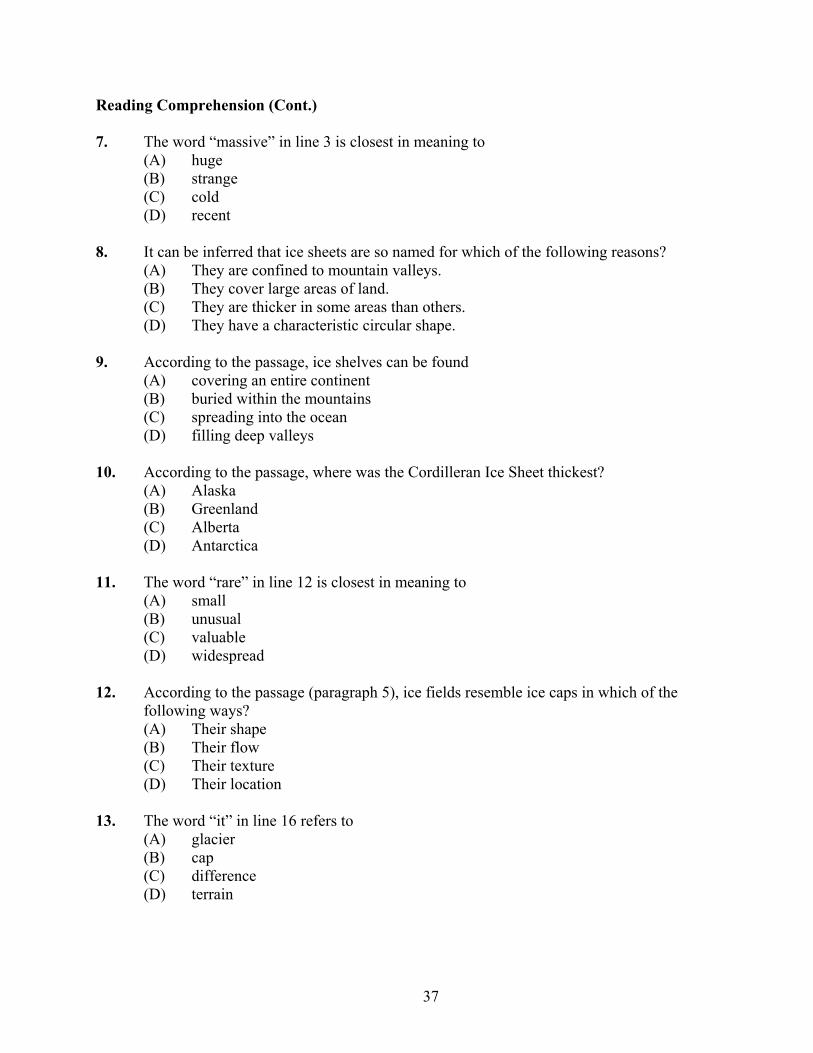
37
Reading Comprehension (Cont.)
7. The word “massive” in line 3 is closest in meaning to (A) huge (B) strange (C) cold (D) recent
8. It can be inferred that ice sheets are so named for which of the following reasons? (A) They are confined to mountain valleys. (B) They cover large areas of land. (C) They are thicker in some areas than others. (D) They have a characteristic circular shape.
9. According to the passage, ice shelves can be found (A) covering an entire continent (B) buried within the mountains (C) spreading into the ocean (D) filling deep valleys
10. According to the passage, where was the Cordilleran Ice Sheet thickest? (A) Alaska (B) Greenland (C) Alberta (D) Antarctica
11. The word “rare” in line 12 is closest in meaning to (A) small (B) unusual (C) valuable (D) widespread
12. According to the passage (paragraph 5), ice fields resemble ice caps in which of the following ways? (A) Their shape (B) Their flow (C) Their texture (D) Their location
13. The word “it” in line 16 refers to (A) glacier (B) cap (C) difference (D) terrain
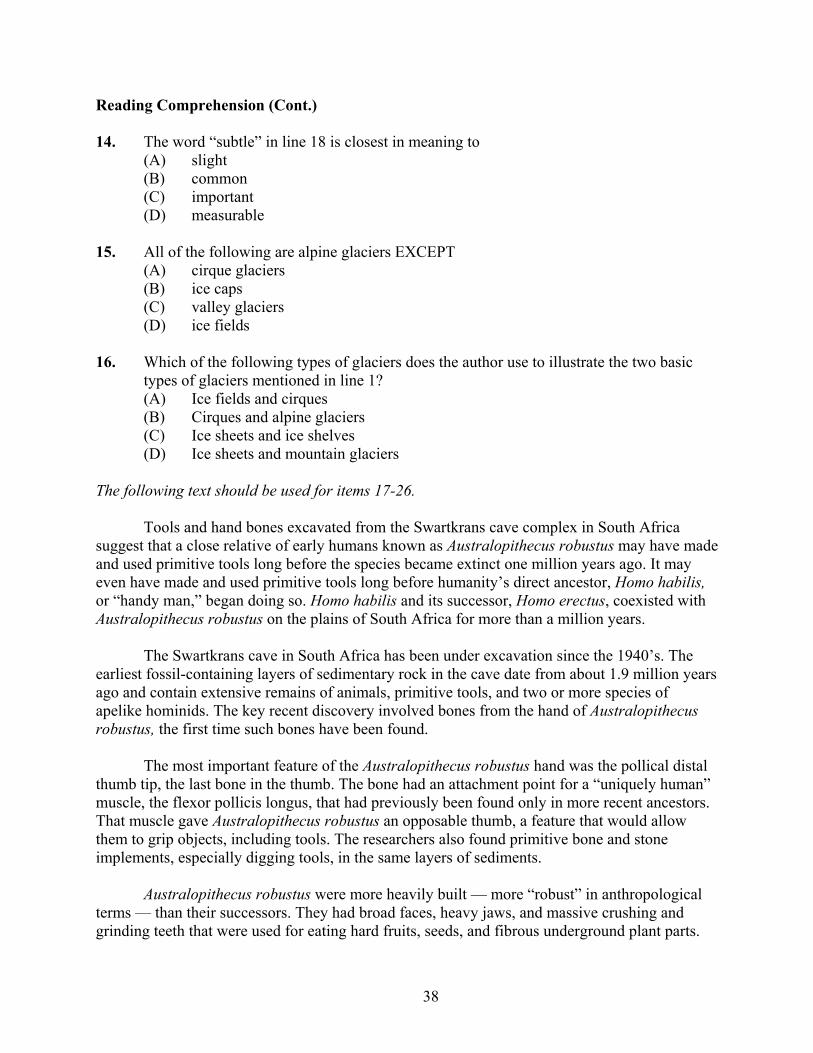
38
Reading Comprehension (Cont.)
14. The word “subtle” in line 18 is closest in meaning to (A) slight (B) common (C) important (D) measurable
15. All of the following are alpine glaciers EXCEPT (A) cirque glaciers (B) ice caps (C) valley glaciers (D) ice fields
16. Which of the following types of glaciers does the author use to illustrate the two basic types of glaciers mentioned in line 1? (A) Ice fields and cirques (B) Cirques and alpine glaciers (C) Ice sheets and ice shelves (D) Ice sheets and mountain glaciers
The following text should be used for items 17-26. Tools and hand bones excavated from the Swartkrans cave complex in South Africa
suggest that a close relative of early humans known as Australopithecus robustus may have made and used primitive tools long before the species became extinct one million years ago. It may even have made and used primitive tools long before humanity’s direct ancestor, Homo habilis, or “handy man,” began doing so. Homo habilis and its successor, Homo erectus, coexisted with Australopithecus robustus on the plains of South Africa for more than a million years.
The Swartkrans cave in South Africa has been under excavation since the 1940’s. The
earliest fossil-containing layers of sedimentary rock in the cave date from about 1.9 million years ago and contain extensive remains of animals, primitive tools, and two or more species of apelike hominids. The key recent discovery involved bones from the hand of Australopithecus robustus, the first time such bones have been found.
The most important feature of the Australopithecus robustus hand was the pollical distal
thumb tip, the last bone in the thumb. The bone had an attachment point for a “uniquely human” muscle, the flexor pollicis longus, that had previously been found only in more recent ancestors. That muscle gave Australopithecus robustus an opposable thumb, a feature that would allow them to grip objects, including tools. The researchers also found primitive bone and stone implements, especially digging tools, in the same layers of sediments.
Australopithecus robustus were more heavily built — more “robust” in anthropological
terms — than their successors. They had broad faces, heavy jaws, and massive crushing and grinding teeth that were used for eating hard fruits, seeds, and fibrous underground plant parts.
39
They walked upright, which would have allowed them to carry and use tools. Most experts had previously believed that Homo habilis were able to supplant Australopithecus robustus because the former’s ability to use tools gave them an innate superiority. The discovery that Australopithecus robustus also used tools means that researchers will have to seek other explanations for their extinction. Perhaps their reliance on naturally occurring plants led to their downfall as the climate became drier and cooler, or perhaps Homo habilis, with their bigger brains, were simply able to make more sophisticated tools.
17. It can be inferred from the first paragraph that all of the following may have made and
used tools EXCEPT (A) Australopithecus robustus (B) Homo erectus (C) Homo habilis (D) Australopithecus robustus’ ancestors
18. The word “extensive” in line 9 is closest in meaning to (A) numerous (B exposes (C) ancient (D) valuable
19. Which of the following does the author mention as the most important recent discovery made in the Swartkrans cave? (A) Tools (B) Teeth (C) Plant fossils (D) Hand bones
20. What does the third paragraph mainly discuss? (A) Features of Australopithecus robustus’ hand (B) Purposes for which hominids used tools (C) Methods used to determine the age of fossils (D) Significant plant fossils found in layers of sediment
21. It can be inferred from the description in the last paragraph that Australopithecus robustus was so named because of the species’ (A) ancestors (B) thumb (C) build (D) diet
22. The word “supplant” in line 22 is closest in meaning to (A) exploit (B) displace (C) understand (D) imitate
40
Reading Comprehension (Cont.)
23. The word “them” in line 18 refers to (A) tools (B) Homo habilis (C) Australopithecus robustus (D) Experts
24. What does the author suggest is unclear about Australopithecus robustus? (A) Whether they used tools (B) What they most likely ate (C) Whether they are closely related to humans (D) Why they became extinct
25. The phrase “reliance on” in line 20 is closest in meaning to (A) impact on (B) dependence on (C) tolerance of (D) discovery of
26. Where in the passage does the author mention the materials from which tools were made? (A) Lines 9-11 (B) Lines 13-14 (C) Lines 17-19 (D) Lines 23-24
The following text should be used for items 27-30. The first two decades of this century were dominated by the microbe hunters. These
hunters had tracked down one after another of the microbes responsible for the most dreaded scourges of many centuries: tuberculosis, cholera, diphtheria. But there remained some terrible diseases for which no microbe could be incriminated: scurvy, pellagra, rickets, and beriberi. Then it was discovered that these diseases were caused by the lack of vitamins, a trace substance in the diet. The diseases could be prevented or cured by consuming foods that contained the vitamins. And so in the decades of the 1920’s and 1930’s, nutrition became a science and the vitamin hunters replaced the microbe hunters.
In the 1940’s and 1950’s, biochemists strived to learn why each of the vitamins was
essential for health. They discovered that key enzymes in metabolism depend on one or another of the vitamins as coenzymes to perform the chemistry that provides cells with energy for growth and function. Now, these enzyme hunters occupied center stage.
You are aware that the enzyme hunters have been replaced by a new breed of hunters
who are tracking genes — the blueprints for each of the enzymes — and are discovering the defective genes that cause inherited diseases — diabetes, cystic fibrosis. These gene hunters, or
41
genetic engineers, use recombinant DNA technology to identify and clone genes and introduce them into bacterial cells and plants to create factories for the massive production of hormones and vaccines for medicine and for better crops for agriculture. Biotechnology has become a multibillion-dollar industry.
In view of the inexorable progress in science, we can expect that the gene hunters will be
replaced in the spotlight. When and by whom? Which kind of hunter will dominate the scene in the last decade of our waning century and in the early decades of the next? I wonder whether the hunters who will occupy the spotlight will be neurobiologists who apply the techniques of the enzyme and gene hunters to the functions of the brain. What to call them? The head hunters. I will return to them later.
27. What is the main topic of the passage?
(A) The microbe hunters (B) The potential of genetic engineering (C) The progress of modern medical research (D) The discovery of enzymes
28. The word “which” in line 4 refers to (A) diseases (B) microbe (C) cholera (D) diphtheria
29. The word “incriminated” in line 4 is closest in meaning to (A) investigated (B) blamed (C) eliminated (D) produced
30. Which of the following can be cured by a change in diet? (A) Tuberculosis (B) Cholera (C) Cystic fibrosis (D) Pellagra
42
Structure and Written Expression
For items 1-12 select the response that best completes the sentence.
1. Andy Warhol was ------ in the Pop Art movement who was known for his multi-image silk-screen paintings. (A) that one of a leading figure (B) a leading figure (C) leading figures (D) who leads figures
2. Even with vast research, there is still a great deal that is ------ known about the workings of the human brain. (A) neither (B) none (C) no (D) not
3. ------ the United States consists of many different immigrant groups, many sociologists believe there is a distinct national character. (A) In spite of (B) Despite (C) Even though (D) Whether
4. Typically ------ in meadows or damp woods and bloom in the spring. (A) wild violets grow (B) wild violets growth (C) growing wild violets (D) the growth of wild violets
5. The art works of Madlyn-Ann Woolwich are characterized by strong, dark colors and fine attention to patterns of light ------ the viewer’s eye. (A) that attract (B) when attracted (C) which attraction (D) attract to
6. A grass-eating, river-dwelling mammal, the hippopotamus ------ to the pig. (A) being related (B) is related (C) relate (D) relating
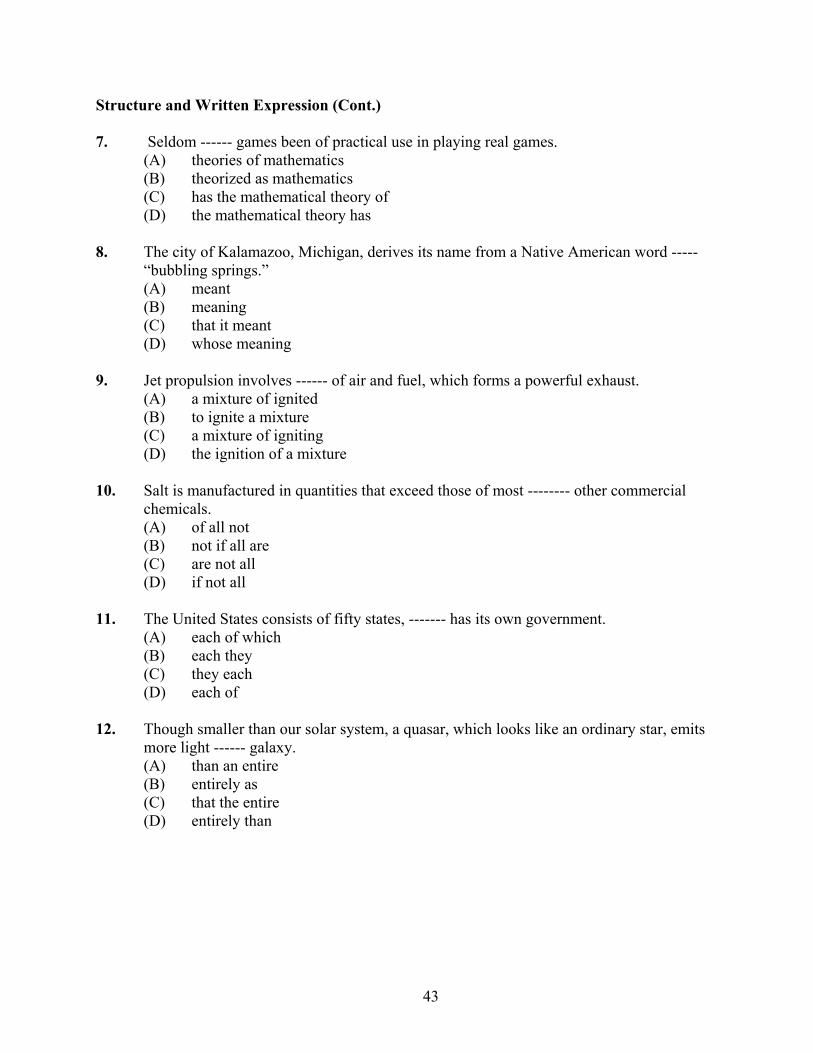
43
Structure and Written Expression (Cont.)
7. Seldom ------ games been of practical use in playing real games. (A) theories of mathematics (B) theorized as mathematics (C) has the mathematical theory of (D) the mathematical theory has
8. The city of Kalamazoo, Michigan, derives its name from a Native American word ----- “bubbling springs.” (A) meant (B) meaning (C) that it meant (D) whose meaning
9. Jet propulsion involves ------ of air and fuel, which forms a powerful exhaust. (A) a mixture of ignited (B) to ignite a mixture (C) a mixture of igniting (D) the ignition of a mixture
10. Salt is manufactured in quantities that exceed those of most -------- other commercial chemicals. (A) of all not (B) not if all are (C) are not all (D) if not all
11. The United States consists of fifty states, ------- has its own government. (A) each of which (B) each they (C) they each (D) each of
12. Though smaller than our solar system, a quasar, which looks like an ordinary star, emits more light ------ galaxy. (A) than an entire (B) entirely as (C) that the entire (D) entirely than
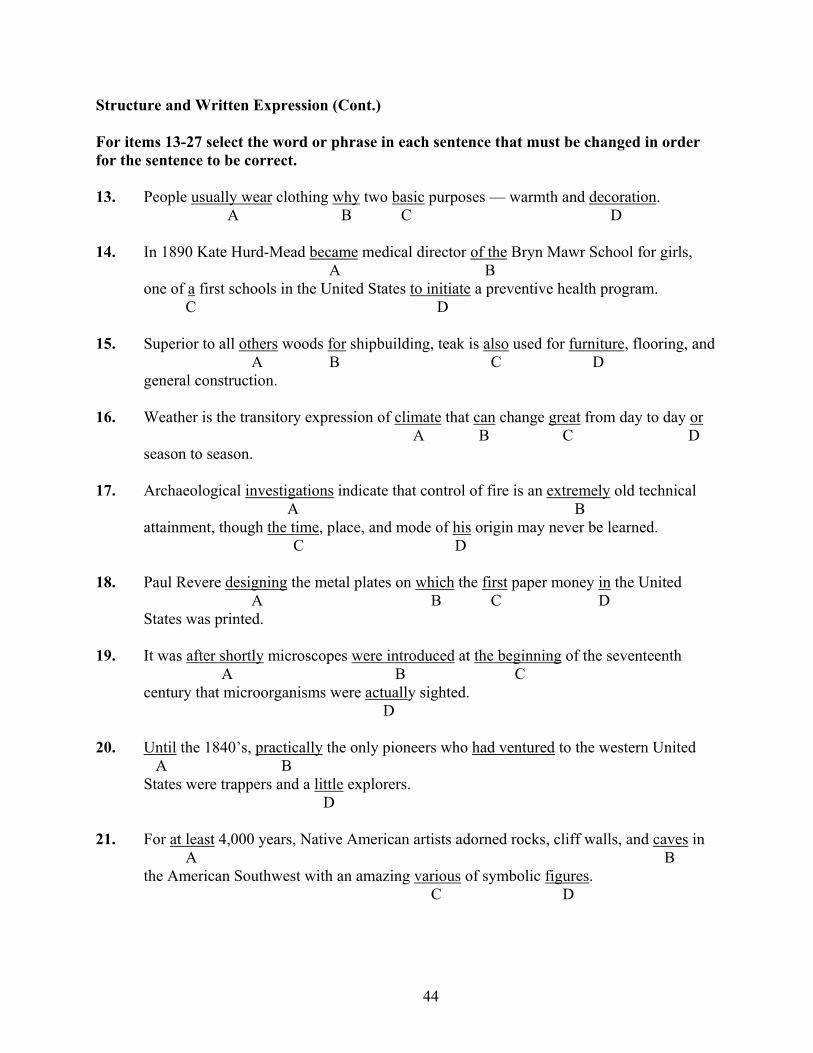
44
Structure and Written Expression (Cont.) For items 13-27 select the word or phrase in each sentence that must be changed in order for the sentence to be correct.
13. People usually wear clothing why two basic purposes — warmth and decoration.
A B C D
14. In 1890 Kate Hurd-Mead became medical director of the Bryn Mawr School for girls, A B one of a first schools in the United States to initiate a preventive health program. C D
15. Superior to all others woods for shipbuilding, teak is also used for furniture, flooring, and A B C D general construction.
16. Weather is the transitory expression of climate that can change great from day to day or A B C D
season to season.
17. Archaeological investigations indicate that control of fire is an extremely old technical A B attainment, though the time, place, and mode of his origin may never be learned. C D
18. Paul Revere designing the metal plates on which the first paper money in the United A B C D States was printed.
19. It was after shortly microscopes were introduced at the beginning of the seventeenth
A B C century that microorganisms were actually sighted. D
20. Until the 1840’s, practically the only pioneers who had ventured to the western United A B States were trappers and a little explorers. D
21. For at least 4,000 years, Native American artists adorned rocks, cliff walls, and caves in A B the American Southwest with an amazing various of symbolic figures.
C D
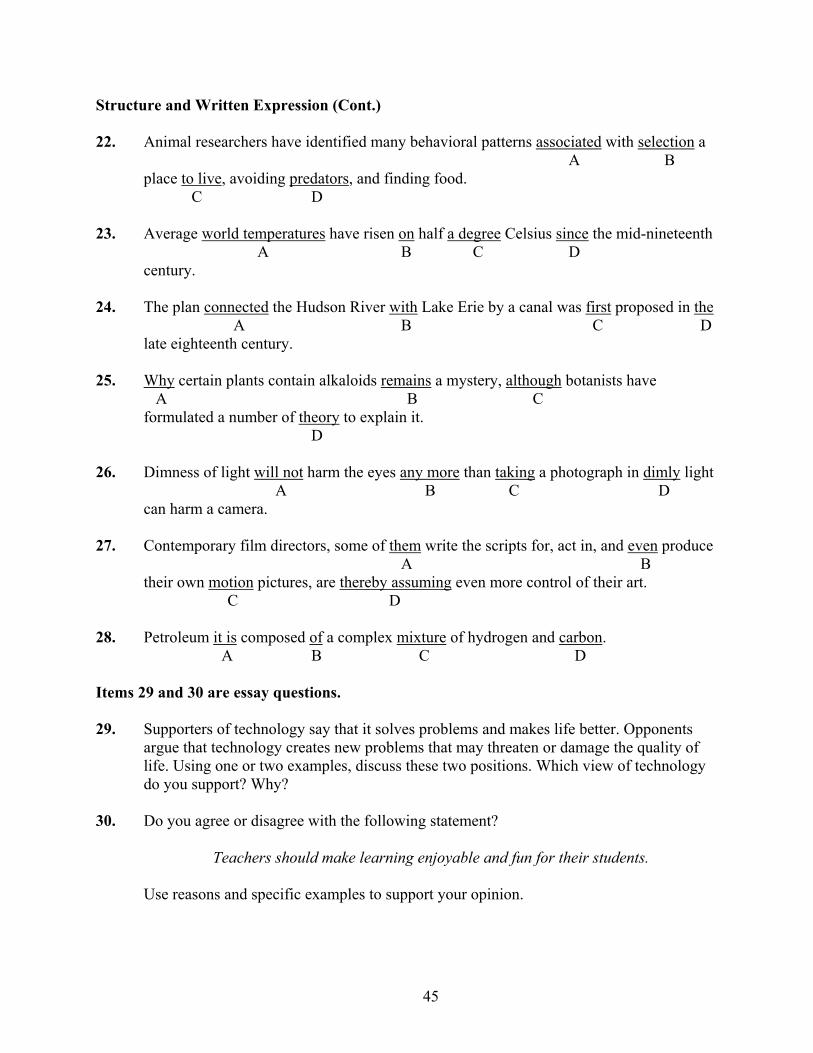
45
Structure and Written Expression (Cont.)
22. Animal researchers have identified many behavioral patterns associated with selection a A B
place to live, avoiding predators, and finding food. C D
23. Average world temperatures have risen on half a degree Celsius since the mid-nineteenth A B C D century.
24. The plan connected the Hudson River with Lake Erie by a canal was first proposed in the A B C D
late eighteenth century.
25. Why certain plants contain alkaloids remains a mystery, although botanists have A B C formulated a number of theory to explain it. D
26. Dimness of light will not harm the eyes any more than taking a photograph in dimly light A B C D
can harm a camera.
27. Contemporary film directors, some of them write the scripts for, act in, and even produce A B their own motion pictures, are thereby assuming even more control of their art. C D
28. Petroleum it is composed of a complex mixture of hydrogen and carbon. A B C D
Items 29 and 30 are essay questions.
29. Supporters of technology say that it solves problems and makes life better. Opponents argue that technology creates new problems that may threaten or damage the quality of life. Using one or two examples, discuss these two positions. Which view of technology do you support? Why?
30. Do you agree or disagree with the following statement?
Teachers should make learning enjoyable and fun for their students. Use reasons and specific examples to support your opinion.
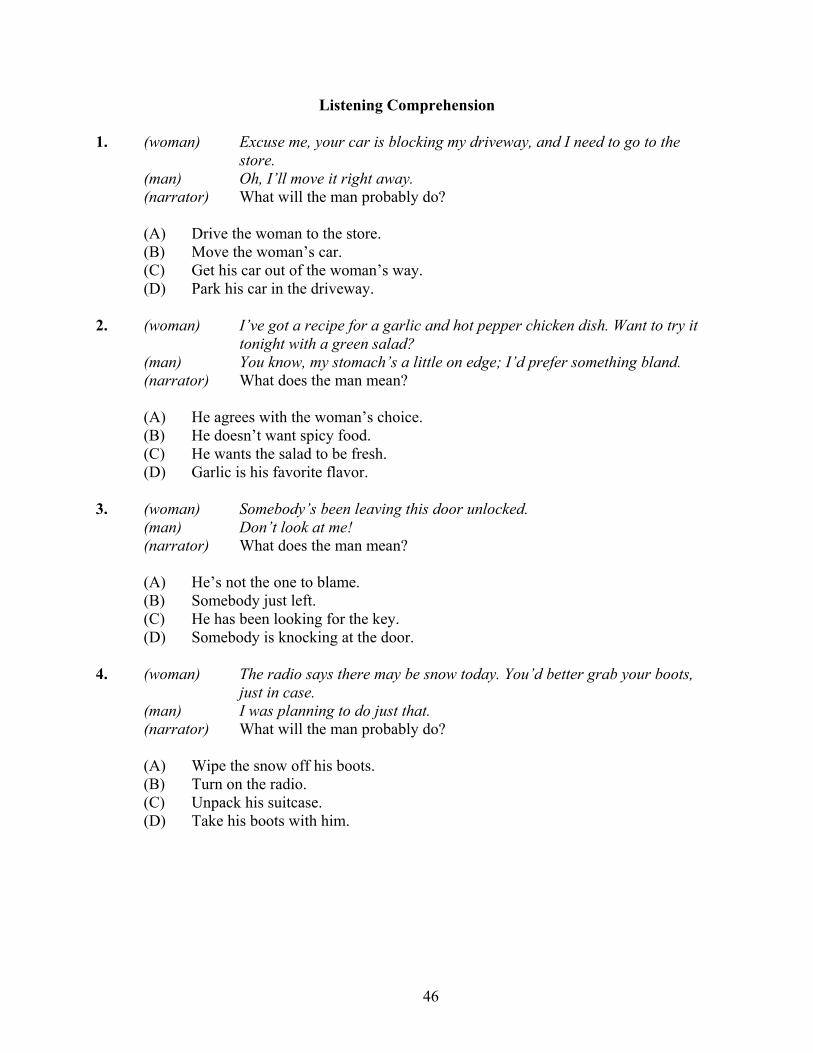
46
Listening Comprehension
1. (woman) Excuse me, your car is blocking my driveway, and I need to go to the store. (man) Oh, I’ll move it right away. (narrator) What will the man probably do? (A) Drive the woman to the store. (B) Move the woman’s car. (C) Get his car out of the woman’s way. (D) Park his car in the driveway.
2. (woman) I’ve got a recipe for a garlic and hot pepper chicken dish. Want to try it tonight with a green salad? (man) You know, my stomach’s a little on edge; I’d prefer something bland. (narrator) What does the man mean? (A) He agrees with the woman’s choice. (B) He doesn’t want spicy food. (C) He wants the salad to be fresh. (D) Garlic is his favorite flavor. 3. (woman) Somebody’s been leaving this door unlocked. (man) Don’t look at me! (narrator) What does the man mean? (A) He’s not the one to blame. (B) Somebody just left. (C) He has been looking for the key. (D) Somebody is knocking at the door.
4. (woman) The radio says there may be snow today. You’d better grab your boots, just in case. (man) I was planning to do just that. (narrator) What will the man probably do? (A) Wipe the snow off his boots. (B) Turn on the radio. (C) Unpack his suitcase. (D) Take his boots with him.
47
Listening Comprehension (Cont.)
5. (man) It’s too bad you didn’t tell me the news about Professor Tompkins earlier. (woman) I only found out myself just now. (narrator) What does the woman mean? (A) She doesn’t think the news is bad. (B) She heard the news quite recently. (C) She is the only one who has heard the news. (D) She found the newspaper article earlier.
6. (man) Hi, Cindy. Welcome back! Did you take many pictures on your vacation? (woman) Thanks. Yes, I must have taken a million of them. (narrator) What does the woman mean? (A) She took a lot of photographs. (B) She’d like to take many more vacations. (C) She missed taking many of the pictures she wanted. (D) She spent too much money on her vacation.
7. (woman) It’s going to be expensive to take the train to Chicago. Have you seen rates? (man) Yes. I think we’d be better off driving.
(narrator) What does the man mean? (A) Driving would be cheaper than taking the train. (B) The train is faster than traveling by car. (C) They should cancel the trip. (D) It would be a good idea to start driving early. 8. (woman) Did you know that Susan has three exams next week? (man) I guess that would account for her spending so much time in the library lately. (narrator) What does the man say about Susan? (A) She’s studying for an accounting exam. (B) She’s been working in the library a lot. (C) She’ll be going to the library after her exams. (D) She has more exams than he does.
48
Listening Comprehension (Cont.) 9. (woman) It’s really cold in this apartment, can we turn up the heat?
(man) No, my last fuel bill was so high, I had trouble paying it. Would you like a sweater?
(narrator) Why does the man refuse the woman’s request? (A) He’s already too hot. (B) He hasn’t received a fuel bill yet. (C) He can’t afford to turn the heat up. (D) He has no more sweaters. 10. (man) I think I’ll play some golf today. (woman) But I thought you were going to work on the car. (narrator) What does the woman imply the man should do? (A) Drive to work. (B) Go to the golf course. (C) Try to fix the car. (D) Take care of himself. 11. (man) These mosquito bites are killing me. I just can’t stop scratching.
(woman) Next time wear long sleeves when you work in the garden. (narrator) What can be inferred about the man? (A) He used insect spray to control the mosquitoes. (B) He was wearing short sleeves when he got bitten. (C) He finds working in the garden relaxing. (D) Some plants in the garden irritated his skin. 12. (man) What a concert that was! You must be feeling pleased with yourselves. (woman) We are, and judging by the amount of applause, everybody appreciated it. (narrator) What does the woman mean? (A) The audience seemed to like the concert. (B) She was satisfied with her seat. (C) More people attended the concert than expected. (D) She was pleased to be asked to perform.
49
Listening Comprehension (Cont.)
13. (woman) I’m soaked! It started to pour the minute I got off the bus. (man) Well, change into something dry while I make you a cup of hot tea. (narrator) What happened to the woman? (A) She got caught in the rain. (B) She took the wrong bus. (C) Some tea spilled on her. (D) Her laundry didn’t dry. 14. (man) Professor Anderson suggested I get a tutor for calculus. (woman) Well, it surely couldn’t hurt. (narrator) What does the woman mean? (A) The tutor wasn’t seriously hurt. (B) She could tutor the man in math. (C) It’s a good idea to get a tutor. (D) She’s sure Professor Anderson is a good tutor. 15. (woman) I read about your promotion in the newspaper. You must be very pleased. (man) To be honest, I can take it or leave it. The new office is nice, but the workload has doubled. (narrator) What does the man imply? (A) He doesn’t like the newspaper job. (B) He isn’t enthusiastic about his job. (C) He will leave his job if he’s not promoted. (D) His job is going well. 16. (woman) Do you know who took this message from Donald? I can hardly read it. (man) It wasn’t me. I think it might’ve been Laura. (narrator) What does the man mean? (A) Laura probably spoke with Donald. (B) He’ll give the message to Laura. (C) He took a message for Laura. (D) Laura wasn’t able to reach Donald.
50
Listening Comprehension (Cont.) 17. (man) What did you think of the article we had to read for physics? (woman) It got off to a promising start, but the conclusions were unfounded. (narrator) What does the woman mean? (A) She promises to help the man learn physics. (B) She can’t find the article she has to read. (C) She found the conclusions to be very promising. (D) She disagrees with the article’s logic. 18. (woman) Christine’s been frantic. She has to get all her paintings from Johnson’s class framed in time for the exhibition next week. (man) Didn’t she know about the exhibition at the beginning of the term? (narrator) What can be inferred about Christine? (A) She doesn’t know much about painting. (B) She should have started sooner. (C) She ought to know when the class begins. (D) She worries too much. 19. (man) What do you think I should name this kitten I found? (woman) If I were you I’d find it a new home — you know the dorm rules. (narrator) What does the woman suggest the man do? (A) Learn more about caring for cats before bringing one home. (B) Choose a good name for the kitten. (C) Give the cat away since he can’t keep it. (D) Keep the kitten in his dorm room.
20. (woman) Don’t you think it’s strange that we haven’t started receiving any mail here yet? (woman) Well, sometimes it takes awhile for the post office to forward it. I’m sure it’ll come. (narrator) What can be inferred about the speakers? (A) They don’t usually get much mail. (B) They just moved to a new address. (C) They pick up their mail at the post office. (D) They are looking forward to receiving the letter.
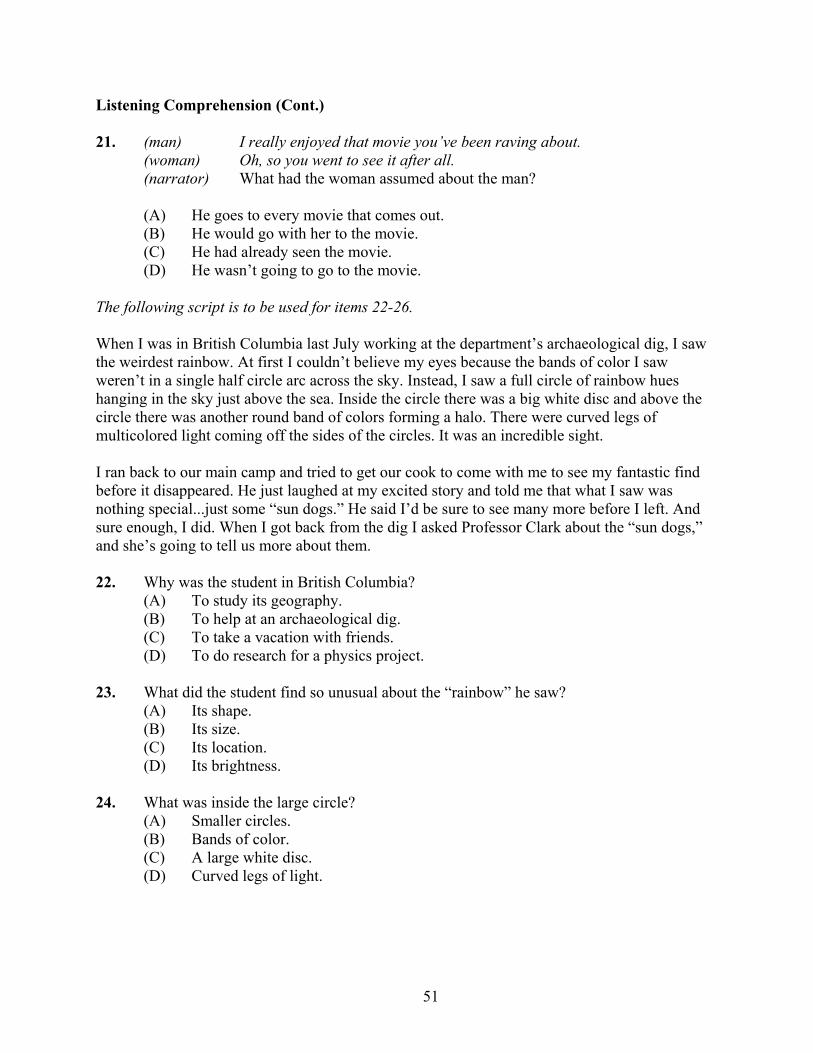
51
Listening Comprehension (Cont.)
21. (man) I really enjoyed that movie you’ve been raving about. (woman) Oh, so you went to see it after all. (narrator) What had the woman assumed about the man? (A) He goes to every movie that comes out. (B) He would go with her to the movie. (C) He had already seen the movie. (D) He wasn’t going to go to the movie.
The following script is to be used for items 22-26. When I was in British Columbia last July working at the department’s archaeological dig, I saw the weirdest rainbow. At first I couldn’t believe my eyes because the bands of color I saw weren’t in a single half circle arc across the sky. Instead, I saw a full circle of rainbow hues hanging in the sky just above the sea. Inside the circle there was a big white disc and above the circle there was another round band of colors forming a halo. There were curved legs of multicolored light coming off the sides of the circles. It was an incredible sight. I ran back to our main camp and tried to get our cook to come with me to see my fantastic find before it disappeared. He just laughed at my excited story and told me that what I saw was nothing special...just some “sun dogs.” He said I’d be sure to see many more before I left. And sure enough, I did. When I got back from the dig I asked Professor Clark about the “sun dogs,” and she’s going to tell us more about them.
22. Why was the student in British Columbia? (A) To study its geography. (B) To help at an archaeological dig. (C) To take a vacation with friends. (D) To do research for a physics project. 23. What did the student find so unusual about the “rainbow” he saw? (A) Its shape. (B) Its size. (C) Its location. (D) Its brightness. 24. What was inside the large circle? (A) Smaller circles. (B) Bands of color. (C) A large white disc. (D) Curved legs of light.
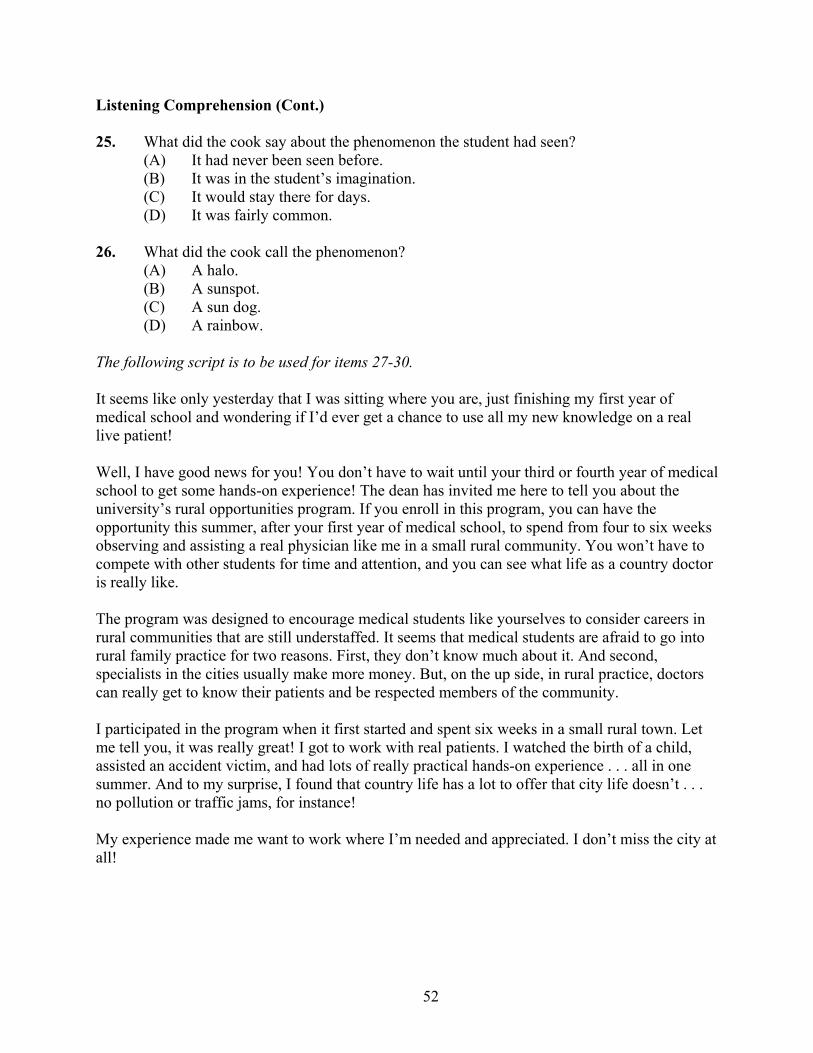
52
Listening Comprehension (Cont.)
25. What did the cook say about the phenomenon the student had seen? (A) It had never been seen before. (B) It was in the student’s imagination. (C) It would stay there for days. (D) It was fairly common. 26. What did the cook call the phenomenon? (A) A halo. (B) A sunspot. (C) A sun dog. (D) A rainbow. The following script is to be used for items 27-30. It seems like only yesterday that I was sitting where you are, just finishing my first year of medical school and wondering if I’d ever get a chance to use all my new knowledge on a real live patient! Well, I have good news for you! You don’t have to wait until your third or fourth year of medical school to get some hands-on experience! The dean has invited me here to tell you about the university’s rural opportunities program. If you enroll in this program, you can have the opportunity this summer, after your first year of medical school, to spend from four to six weeks observing and assisting a real physician like me in a small rural community. You won’t have to compete with other students for time and attention, and you can see what life as a country doctor is really like.
The program was designed to encourage medical students like yourselves to consider careers in rural communities that are still understaffed. It seems that medical students are afraid to go into rural family practice for two reasons. First, they don’t know much about it. And second, specialists in the cities usually make more money. But, on the up side, in rural practice, doctors can really get to know their patients and be respected members of the community. I participated in the program when it first started and spent six weeks in a small rural town. Let me tell you, it was really great! I got to work with real patients. I watched the birth of a child, assisted an accident victim, and had lots of really practical hands-on experience . . . all in one summer. And to my surprise, I found that country life has a lot to offer that city life doesn’t . . . no pollution or traffic jams, for instance! My experience made me want to work where I’m needed and appreciated. I don’t miss the city at all!
53
Listening Comprehension (Cont.)
27. For whom is the talk intended? (A) Nursing students. (B) Undergraduate college students. (C) The graduating class at a medical school. (D) First-year medical students. 28. What would be a successful result of the program being described? (A) More people would apply to medical school. (B) Understaffed areas would gain more physicians. (C) Students would finish medical school in three years. (D) More students would enter specialty areas.
29. What benefit does the program offer to participants? (A) Practical experience. (B) Extra income. (C) Course credit. (D) Tuition reduction. 30. According to the speaker, what is one disadvantage of a rural medical practice? (A) It’s difficult to get to know one’s patients. (B) Income tends to be relatively low. (C) It’s difficult to gain the respect of the community. (D) There is very little business for specialists.
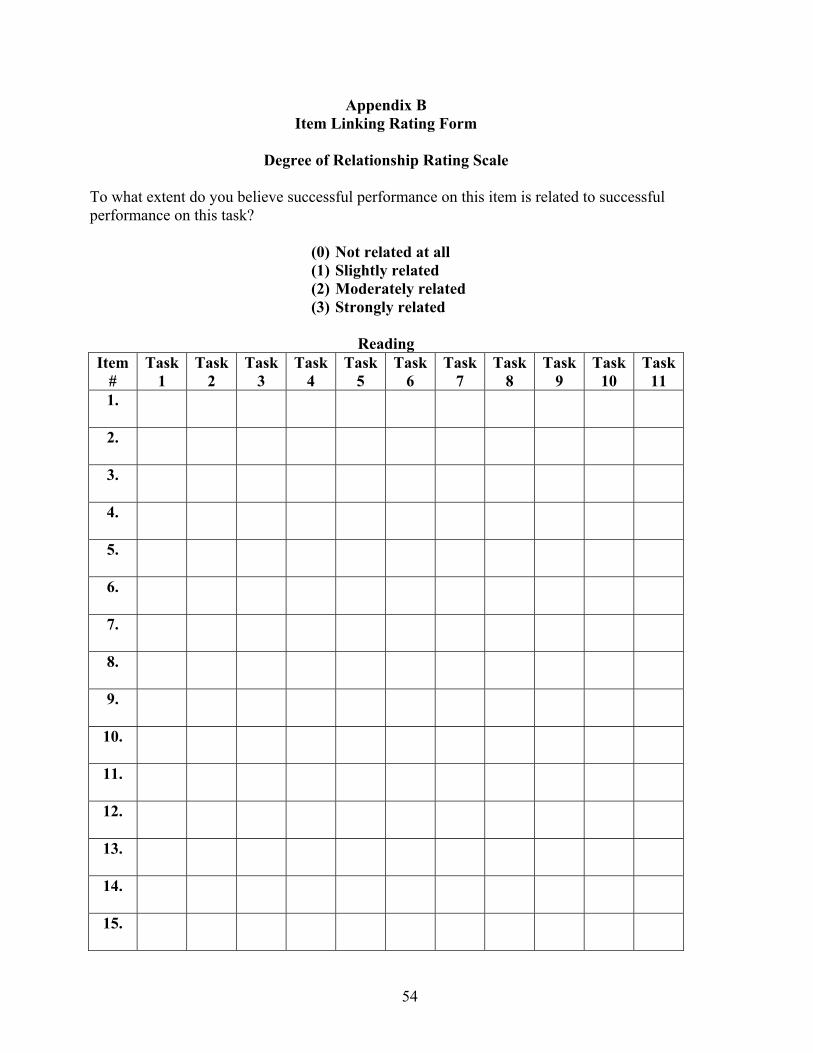
54
Appendix B Item Linking Rating Form
Degree of Relationship Rating Scale
To what extent do you believe successful performance on this item is related to successful performance on this task?
(0) Not related at all (1) Slightly related (2) Moderately related (3) Strongly related
Reading
Item #
Task 1
Task 2
Task 3
Task 4
Task 5
Task 6
Task 7
Task 8
Task 9
Task 10
Task 11
1.
2.
3.
4.
5.
6.
7.
8.
9.
10.
11.
12.
13.
14.
15.
55
Degree of Relationship Rating Scale
To what extent do you believe successful performance on this item is related to successful performance on this task?
(0) Not related at all (1) Slightly related (2) Moderately related (3) Strongly related
Writing
Item #
Task 1
Task 2
Task 3
Task 4
Task 5
Task 6
Task 7
Task 8
Task 9
Task 10
1.
2.
3.
4.
5.
6.
7.
8.
9.
10.
11.
12.
13.
14.
15.
56
Degree of Relationship Rating Scale
To what extent do you believe successful performance on this item is related to successful performance on this task?
(0) Not related at all (1) Slightly related (2) Moderately related (3) Strongly related
Listening
Item #
Task 1
Task 2
Task 3
Task 4
Task 5
Task 6
Task 7
Task 8
Task 9
Task 10
Task 11
1.
2.
3.
4.
5.
6.
7.
8.
9.
10.
11.
12.
13.
14.
15.
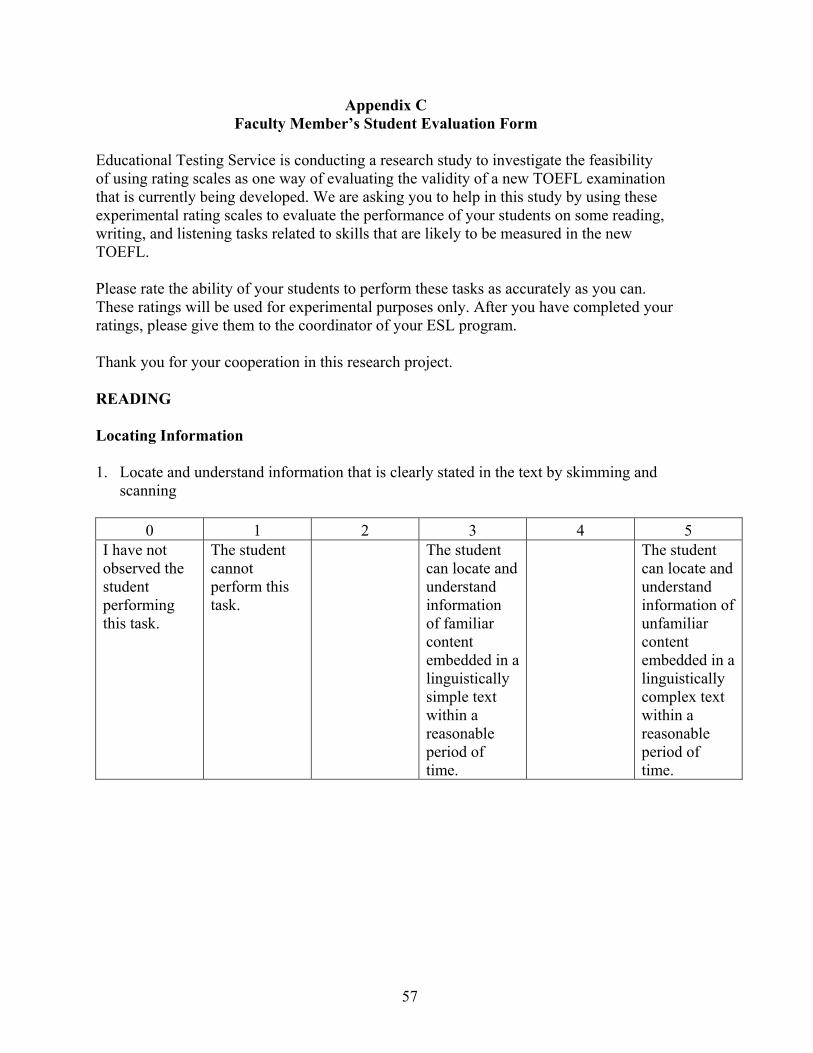
57
Appendix C Faculty Member’s Student Evaluation Form
Educational Testing Service is conducting a research study to investigate the feasibility of using rating scales as one way of evaluating the validity of a new TOEFL examination that is currently being developed. We are asking you to help in this study by using these experimental rating scales to evaluate the performance of your students on some reading, writing, and listening tasks related to skills that are likely to be measured in the new TOEFL. Please rate the ability of your students to perform these tasks as accurately as you can. These ratings will be used for experimental purposes only. After you have completed your ratings, please give them to the coordinator of your ESL program. Thank you for your cooperation in this research project. READING Locating Information 1. Locate and understand information that is clearly stated in the text by skimming and
scanning
0 1 2 3 4 5 I have not observed the student performing this task.
The student cannot perform this task.
The student can locate and understand information of familiar content embedded in a linguistically simple text within a reasonable period of time.
The student can locate and understand information of unfamiliar content embedded in a linguistically complex text within a reasonable period of time.
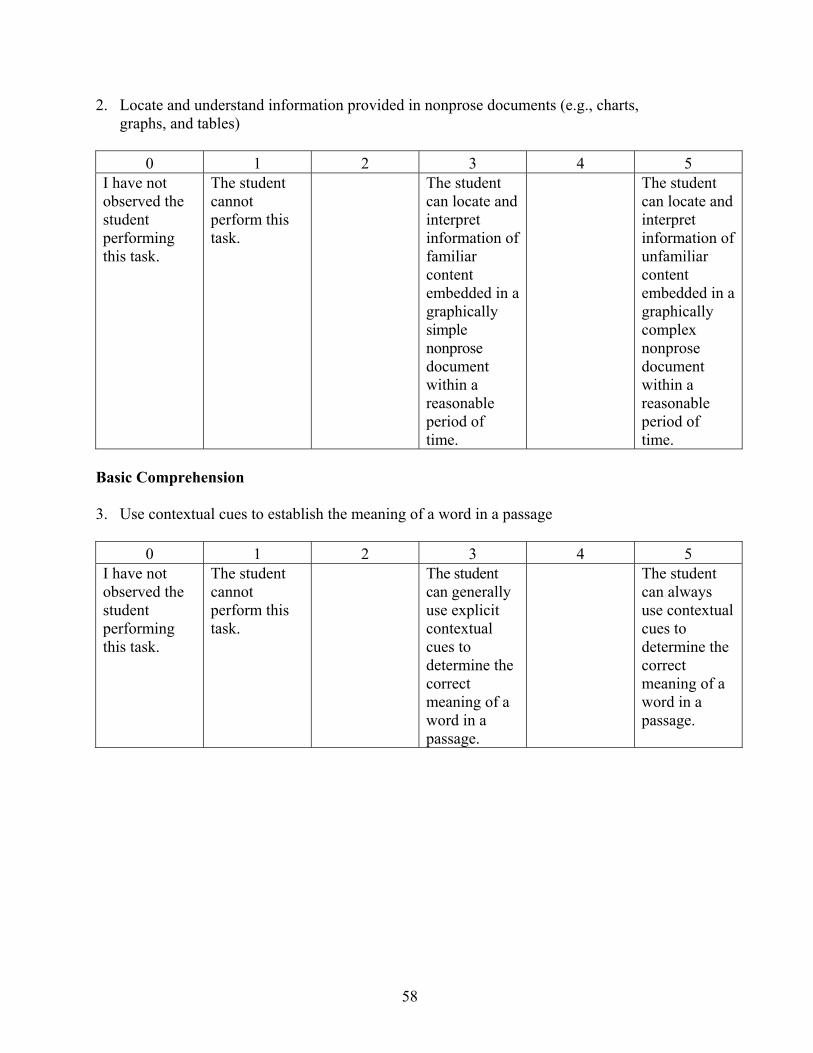
58
2. Locate and understand information provided in nonprose documents (e.g., charts, graphs, and tables)
0 1 2 3 4 5
I have not observed the student performing this task.
The student cannot perform this task.
The student can locate and interpret information of familiar content embedded in a graphically simple nonprose document within a reasonable period of time.
The student can locate and interpret information of unfamiliar content embedded in a graphically complex nonprose document within a reasonable period of time.
Basic Comprehension 3. Use contextual cues to establish the meaning of a word in a passage
0 1 2 3 4 5 I have not observed the student performing this task.
The student cannot perform this task.
The student can generally use explicit contextual cues to determine the correct meaning of a word in a passage.
The student can always use contextual cues to determine the correct meaning of a word in a passage.
59
4. Determine the basic theme (main idea) of a passage
0 1 2 3 4 5 I have not observed the student performing this task.
The student cannot perform this task.
The student can generally identify the main idea when it is explicitly stated.
The student can always identify the main idea across a variety of subject areas even when inference is necessary.
5. Read and understand written instructions/directions concerning classroom assignments
and/or examinations
0 1 2 3 4 5 I have not observed the student performing this task.
The student cannot perform this task.
The student can generally understand most details in simple written instructions.
The student can always understand the details in written instructions.
Learning 6. Read text material with sufficient care and comprehension to remember major ideas
0 1 2 3 4 5 I have not observed the student performing this task.
The student cannot perform this task.
The student can usually comprehend, remember, and state major ideas.
The student can comprehend, remember, and paraphrase major ideas.
60
7. Read text material with sufficient care and comprehension to remember major ideas and answer written questions later when the text is no longer present
0 1 2 3 4 5
I have not observed the student performing this task.
The student cannot perform this task.
The student can usually comprehend, remember, and state major ideas and answer simple pertinent questions correctly.
The student can comprehend, remember, and paraphrase major ideas and answer any pertinent questions correctly.
8. Read text material and outline important ideas and concepts
0 1 2 3 4 5 I have not observed the student performing this task.
The student cannot perform this task.
The student can generally identify and prioritize main ideas and their supporting details in simple texts.
The student can identify and prioritize main ideas and their supporting details across a wide variety of texts.
9. Distinguish factual information from opinions
0 1 2 3 4 5 I have not observed the student performing this task.
The student cannot perform this task.
The student can sometimes distinguish objective from subjective statements, primarily on the basis of context.
The student can always distinguish objective from subjective statements on the basis of key vocabulary, tone, and context.
61
Integration 10. Compare and contrast ideas in a single text and/or across texts
0 1 2 3 4 5 I have not observed the student performing this task.
The student cannot perform this task.
The student can generally identify and define some important similarities and differences in key points and supporting details in simple texts.
The student can identify and define important similarities and differences in key points and supporting details across a wide variety of texts.
11. Synthesize ideas in a single text and/or across texts
0 1 2 3 4 5 I have not observed the student performing this task.
The student cannot perform this task.
The student can draw and express logical conclusions from simple texts.
The student can analyze and interpret a broad range of texts effectively, to gain new understanding or insight.
Your Full Name:_______________________________________________ Name of Student You Are Rating:_________________________________ SCHOOL: (Please make an “X” next to the school at which you teach.) ____ Drexel University ____ Hunter College ____ Rutgers University
62
Faculty Member’s Student Rating Form Educational Testing Service is conducting a research study to investigate the feasibility of using rating scales as one way of evaluating the validity of a new TOEFL examination that is currently being developed. We are asking you to help in this study by using these experimental rating scales to evaluate the performance of your students on some reading, writing, and listening tasks related to skills that are likely to be measured in the new TOEFL. Please rate the ability of your students to perform these tasks as accurately as you can. These ratings will be used for experimental purposes only. After you have completed your ratings, please give them to the coordinator of your ESL program. Thank you for your cooperation in this research project. WRITING Content 12. Write in response to an assignment and stay on topic without digressions or redundancies
0 1 2 3 4 5 I have not observed the student performing this task.
The student cannot perform this task.
The student generally stays on topic but may have occasional digressions or redundancies.
The student consistently stays on topic with minimal digressions or redundancies
13. Show awareness of audience needs and write to a particular audience or reader
0 1 2 3 4 5 I have not observed the student performing this task.
The student cannot perform this task.
The student generally uses appropriate language (e.g., tone, register, vocabulary) and cites background information for an intended audience.
The student consistently uses appropriate language (e.g., tone, register, vocabulary) and cites background information for an intended audience.
63
14. Use background knowledge, reference or non-text materials, personal viewpoints, and other sources appropriately to support ideas, analyze, and refine arguments
0 1 2 3 4 5
I have not observed the student performing this task.
The student cannot perform this task.
The student generally identifies and uses minimal appropriate evidence (e.g., background knowledge, personal viewpoints, facts) to support ideas, arguments, and generalizations.
The student consistently identifies and uses appropriate evidence (e.g., background knowledge, personal viewpoints, facts) to support ideas, arguments, and generalizations.
15. Produce writing that effectively summarizes and paraphrases the works and words of others
0 1 2 3 4 5 I have not observed the student performing this task.
The student cannot perform this task.
The student shows moderate skill at summarizing and paraphrasing the ideas of other writers.
The student effectively summarizes and paraphrases the ideas of other writers.
64
Organization 16. Organize writing in order to convey major and supporting ideas
0 1 2 3 4 5 I have not observed the student performing this task.
The student cannot perform this task.
The student generally expresses the relationship between major and supporting ideas.
The student consistently expresses the relationship between major and supporting ideas in a variety of rhetorical patterns.
17. Use appropriate transitions to connect ideas and information
0 1 2 3 4 5 I have not observed the student performing this task.
The student cannot perform this task.
The student uses a limited range of cohesive devices correctly (e.g., pronouns, transition words and expressions, without repetitions of key words).
The student uses a broad range of cohesive devices correctly and can produce connected narratives and descriptions of a factual nature.
65
Development 18. Use relevant reasons and examples to support a position or idea
0 1 2 3 4 5 I have not observed the student performing this task.
The student cannot perform this task.
The student supports ideas and positions with reasons and examples which may not always be relevant.
The student clearly and consistently supports ideas and positions with relevant reasons and examples.
19. Produce sufficient quantity of written text appropriate to the assignment and the time
constraints
0 1 2 3 4 5 I have not observed the student performing this task.
The student cannot perform this task.
The student produces text of a length NOT always appropriate to the topic, task, and time.
The student consistently produces text of a length appropriate to the topic, task, and time.
Language
20. Demonstrate a command of standard written English, including grammar, phrasing, effective
sentence structure, spelling, and punctuation
0 1 2 3 4 5 I have not observed the student performing this task.
The student cannot perform this task.
The student uses standard written English with occasional errors that may obscure meaning.
The student uses standard written English (e.g., grammar, phrasing, mechanics) without errors that obscure meaning.
66
21. Demonstrate facility with a range of vocabulary appropriate to the topic
0 1 2 3 4 5 I have not observed the student performing this task.
The student cannot perform this task.
The student uses a limited range of words and expressions with occasional word choice and word form errors.
The student uses a wide range of appropriate words and expressions.
Your Full Name:_______________________________________________ Name of Student You Are Rating:_________________________________ SCHOOL: (Please make an “X” next to the school at which you teach.) ____ Drexel University ____ Hunter College ____ Rutgers University
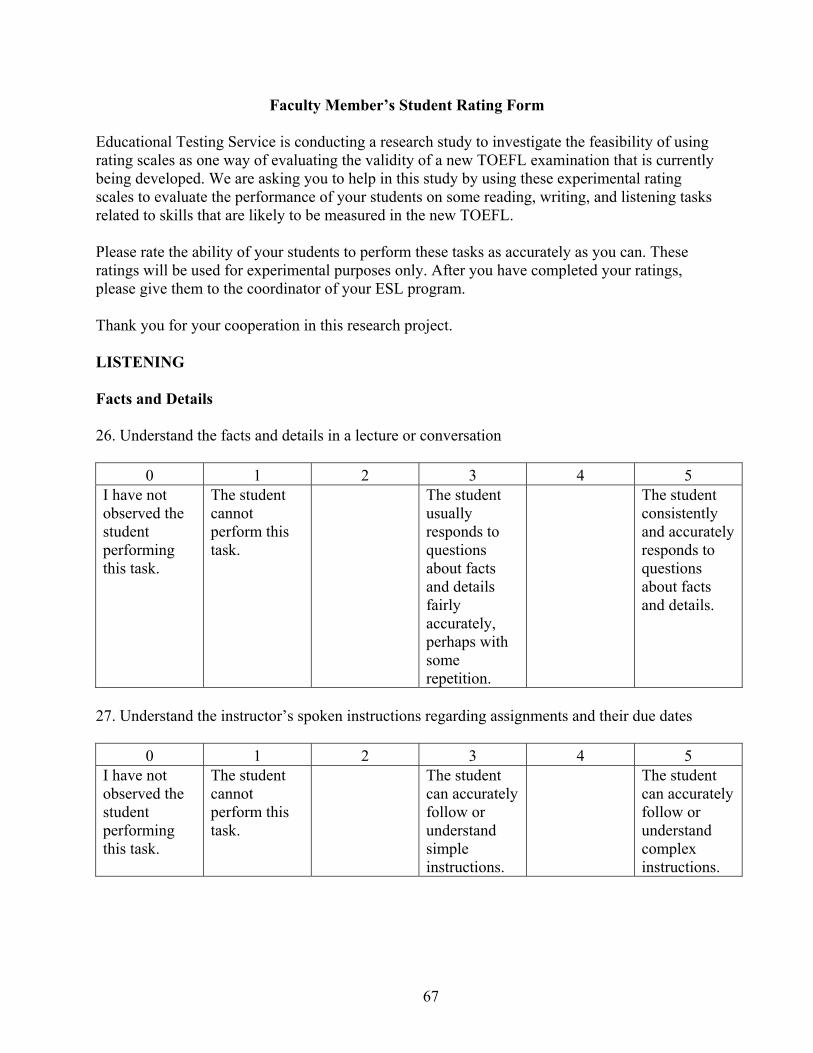
67
Faculty Member’s Student Rating Form Educational Testing Service is conducting a research study to investigate the feasibility of using rating scales as one way of evaluating the validity of a new TOEFL examination that is currently being developed. We are asking you to help in this study by using these experimental rating scales to evaluate the performance of your students on some reading, writing, and listening tasks related to skills that are likely to be measured in the new TOEFL. Please rate the ability of your students to perform these tasks as accurately as you can. These ratings will be used for experimental purposes only. After you have completed your ratings, please give them to the coordinator of your ESL program. Thank you for your cooperation in this research project. LISTENING Facts and Details 26. Understand the facts and details in a lecture or conversation
0 1 2 3 4 5 I have not observed the student performing this task.
The student cannot perform this task.
The student usually responds to questions about facts and details fairly accurately, perhaps with some repetition.
The student consistently and accurately responds to questions about facts and details.
27. Understand the instructor’s spoken instructions regarding assignments and their due dates
0 1 2 3 4 5 I have not observed the student performing this task.
The student cannot perform this task.
The student can accurately follow or understand simple instructions.
The student can accurately follow or understand complex instructions.
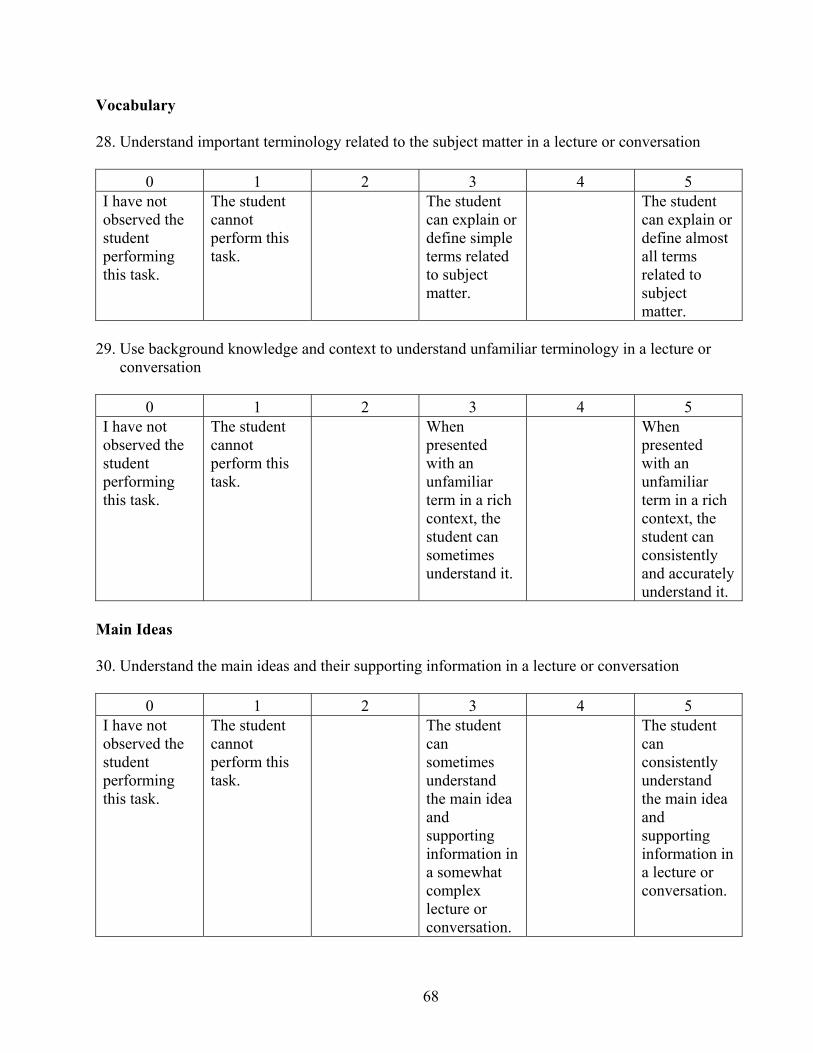
68
Vocabulary 28. Understand important terminology related to the subject matter in a lecture or conversation
0 1 2 3 4 5 I have not observed the student performing this task.
The student cannot perform this task.
The student can explain or define simple terms related to subject matter.
The student can explain or define almost all terms related to subject matter.
29. Use background knowledge and context to understand unfamiliar terminology in a lecture or
conversation
0 1 2 3 4 5 I have not observed the student performing this task.
The student cannot perform this task.
When presented with an unfamiliar term in a rich context, the student can sometimes understand it.
When presented with an unfamiliar term in a rich context, the student can consistently and accurately understand it.
Main Ideas 30. Understand the main ideas and their supporting information in a lecture or conversation
0 1 2 3 4 5 I have not observed the student performing this task.
The student cannot perform this task.
The student can sometimes understand the main idea and supporting information in a somewhat complex lecture or conversation.
The student can consistently understand the main idea and supporting information in a lecture or conversation.
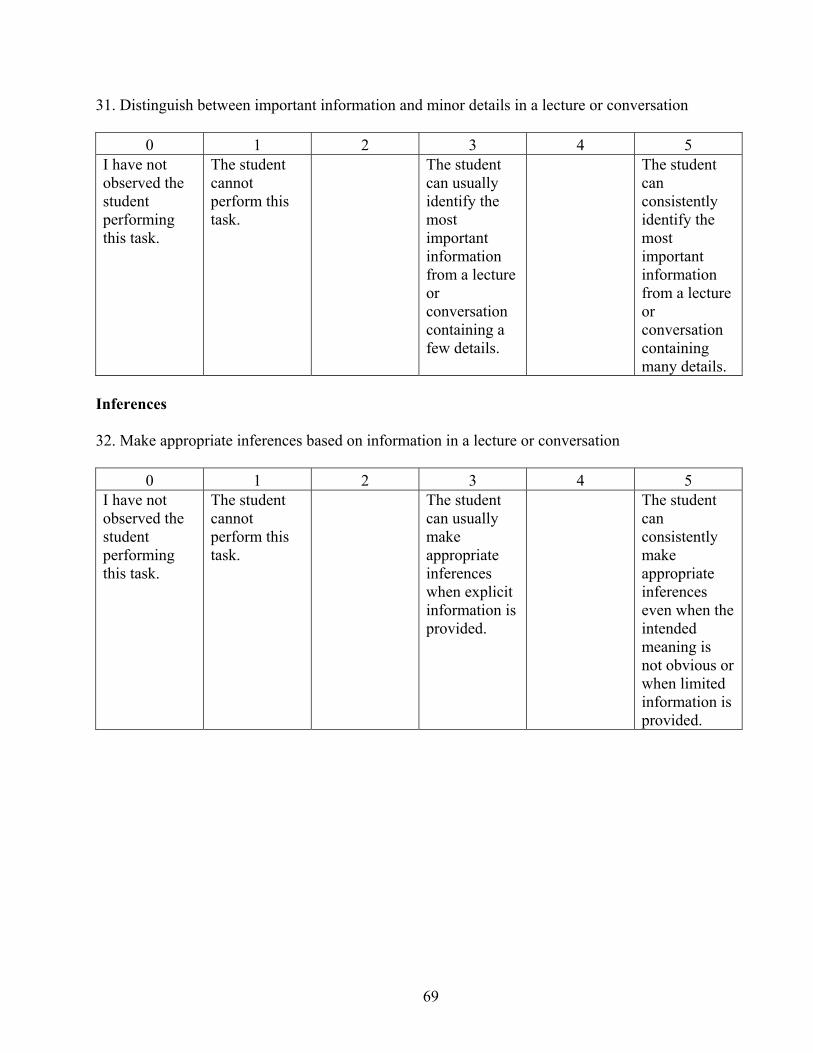
69
31. Distinguish between important information and minor details in a lecture or conversation
0 1 2 3 4 5 I have not observed the student performing this task.
The student cannot perform this task.
The student can usually identify the most important information from a lecture or conversation containing a few details.
The student can consistently identify the most important information from a lecture or conversation containing many details.
Inferences 32. Make appropriate inferences based on information in a lecture or conversation
0 1 2 3 4 5 I have not observed the student performing this task.
The student cannot perform this task.
The student can usually make appropriate inferences when explicit information is provided.
The student can consistently make appropriate inferences even when the intended meaning is not obvious or when limited information is provided.
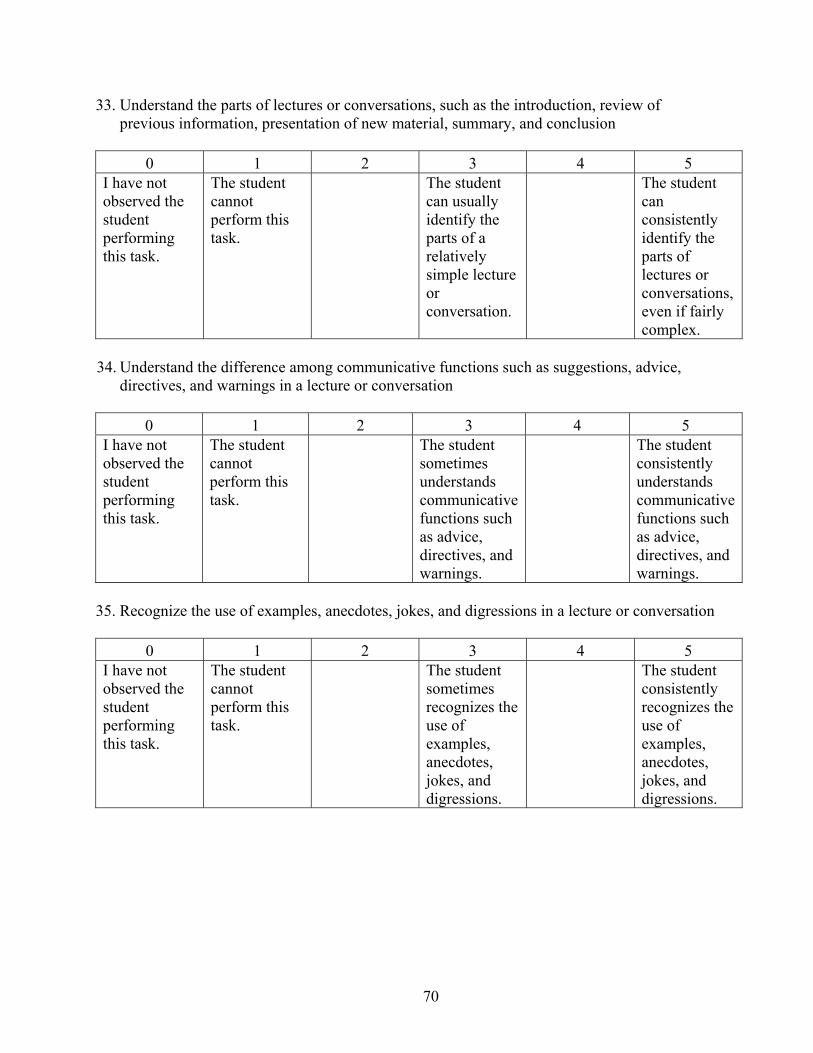
70
33. Understand the parts of lectures or conversations, such as the introduction, review of previous information, presentation of new material, summary, and conclusion
0 1 2 3 4 5
I have not observed the student performing this task.
The student cannot perform this task.
The student can usually identify the parts of a relatively simple lecture or conversation.
The student can consistently identify the parts of lectures or conversations, even if fairly complex.
34. Understand the difference among communicative functions such as suggestions, advice,
directives, and warnings in a lecture or conversation
0 1 2 3 4 5 I have not observed the student performing this task.
The student cannot perform this task.
The student sometimes understands communicative functions such as advice, directives, and warnings.
The student consistently understands communicative functions such as advice, directives, and warnings.
35. Recognize the use of examples, anecdotes, jokes, and digressions in a lecture or conversation
0 1 2 3 4 5 I have not observed the student performing this task.
The student cannot perform this task.
The student sometimes recognizes the use of examples, anecdotes, jokes, and digressions.
The student consistently recognizes the use of examples, anecdotes, jokes, and digressions.
71
36. Recognize the speaker’s attitudinal signals (e.g., tone of voice, humor, sarcasm) in a lecture or conversation
0 1 2 3 4 5
I have not observed the student performing this task.
The student cannot perform this task.
The student sometimes recognizes the speaker’s attitudinal signals.
The student consistently recognizes the speaker’s attitudinal signals.
Your Full Name:_______________________________________________ Name of Student You Are Rating:_________________________________ SCHOOL: (Please make an “X” next to the school at which you teach.) ____ Drexel University ____ Hunter College ____ Rutgers University
72
Appendix D Item Linking Ratings for ETS Test Specialists and ESL Faculty
Listening
ETS RATERS
Task 1 Task 2 Task 3
Mean SD Range Mean SD Range Mean SD Range
Item 1 2.67 0.6 2 - 3 0.67 0.6 0 - 1 1.67 1.5 0 - 3
Item 2 2.33 0.6 2 - 3 0.33 0.6 0 - 1 2.00 1.7 0 - 3
Item 3 2.00 1.0 1 - 3 1.00 1.7 0 - 3 0.67 1.2 0 - 2
Item 4 2.67 0.6 2 - 3 2.00 1.0 1 - 3 1.67 1.5 0 - 3
Item 5 2.00 1.0 1 - 3 0.33 0.6 0 - 1 0.33 0.6 0 - 1
Item 6 2.33 0.6 2 - 3 0.67 1.2 0 - 2 0.33 0.6 0 - 1
Item 7 2.33 0.6 2 - 3 0.33 0.6 0 - 1 1.67 1.5 0 - 3
Item 8 3.00 0.0 3 - 3 1.33 1.5 0 - 3 1.33 0.6 1 - 2
Item 9 3.00 0.0 3 - 3 0.00 0.0 0 - 0 2.00 1.0 1 - 3
Item 10 2.67 0.6 2 - 3 0.33 0.6 0 - 1 0.33 0.6 0 - 1
Item 11 3.00 0.0 3 - 3 1.00 1.0 0 - 2 1.33 1.5 0 - 3
Item 12 2..67 0.6 2 - 3 0.67 1.2 0 - 2 1.67 1.5 0 - 3
Item 13 2.67 0.6 2 - 3 1.00 1.7 0 - 3 2.00 1.0 1 - 3
Item 14 2.00 1.7 0 - 3 1.33 1.5 0 - 3 1.33 1.5 0 - 3
Item 15 2.67 0.6 2 - 3 0.33 0.6 0 - 1 1.67 1.5 0 - 3
Item 16 2.67 0.6 2 - 3 0.00 0.0 0 - 0 0.67 1.2 0 - 2
Item 17 2.33 0.6 2 - 3 0.67 1.2 0 - 2 1.67 1.5 0 - 3
Item 18 2.67 0.6 2 - 3 1.67 1.2 1 - 3 2.33 0.6 2 - 3
Item 19 2.67 0.6 2 - 3 0.00 0.0 0 - 0 1.67 1.5 0 - 3
Item 20 2.67 0.6 2 - 3 1.00 1.7 0 - 3 2.00 1.7 0 - 3
Item 21 2.67 0.6 2 - 3 0.67 1.2 0 - 2 2.00 1.7 0 - 3
Item 22 3.00 0.0 3 - 3 1.00 1.7 0 - 3 3.00 0.0 3 - 3
Item 23 3.00 0.0 3 - 3 1.00 1.7 0 - 3 2.33 1.2 1 - 3
Item 24 2.67 0.6 2 - 3 1.00 1.7 0 - 3 2.00 1.0 1 - 3
Item 25 2.00 1.0 1 - 3 0.67 1.2 0 - 2 1.00 1.7 0 - 3
Item 26 2.67 0.6 2 - 3 0.67 1.2 0 - 2 2.33 0.6 2 - 3
Item 27 2.33 0.6 2 - 3 1.33 0.6 1 - 2 1.33 1.5 0 - 3
Item 28 2.67 0.6 2 - 3 1.00 1.7 0 - 3 1.00 1.7 0 - 3
Item 29 2.67 0.6 2 - 3 1.00 1.7 0 - 3 1.33 1.5 0 - 3
Item 30 2.67 0.6 2 - 3 1.00 1.7 0 - 3 2.00 1.7 0 - 3
73
ETS RATERS (Cont.)
Task 4 Task 5 Task 6
Mean SD Range Mean SD Range Mean SD Range
Item 1 1.67 1.2 1 - 3 2.67 0.6 2 - 3 1.00 1.0 0 - 2
Item 2 2.33 1.2 1 - 3 2.00 1.7 0 - 3 1.67 0.6 1 - 2
Item 3 0.33 0.6 0 - 1 2.00 1.7 0 - 3 0.33 0.6 0 - 1
Item 4 1.00 1.7 0 - 3 2.33 1.2 1 - 3 0.67 1.2 0 - 2
Item 5 1.00 1.7 0 - 3 2.00 1.7 0 - 3 0.33 0.6 0 - 1
Item 6 1.00 1.7 0 - 3 2.00 1.7 0 - 3 0.33 0.6 0 - 1
Item 7 2.00 1.0 1 - 3 2.00 1.0 1 - 3 0.33 0.6 0 - 1
Item 8 1.33 1.5 0 - 3 2.00 1.7 0 - 3 1.00 1.0 0 - 2
Item 9 2.33 1.2 1 - 3 2.00 1.0 1 - 3 0.67 0.6 0 - 1
Item 10 1.00 1.7 0 - 3 1.67 1.5 0 - 3 2.00 1.7 0 - 3
Item 11 2.00 1.7 0 - 3 2.00 1.0 1 - 3 1.00 1.0 0 - 2
Item 12 1.33 1.5 0 - 3 2.33 1.2 1 - 3 1.00 1.0 0 - 2
Item 13 2.00 1.0 1 - 3 2.33 1.2 1 - 3 2.00 1.7 0 - 3
Item 14 0.33 0.6 0 - 1 2.00 1.0 1 - 3 0.33 0.6 0 - 1
Item 15 2.00 1.7 0 - 3 2.33 1.2 1 - 3 0.67 0.6 0 - 1
Item 16 1.33 1.5 0 - 3 2.00 1.7 0 - 3 0.67 0.6 0 - 1
Item 17 2.33 0.6 2 - 3 2.33 1.2 1 - 3 0.67 0.6 0 - 1
Item 18 1.00 1.7 0 - 3 2.33 0.6 2 - 3 2.00 1.0 1 - 3
Item 19 1.33 1.5 0 - 3 2.33 0.6 2 - 3 2.67 0.6 2 - 3
Item 20 2.67 0.6 2 - 3 2.00 1.0 1 - 3 0.67 0.6 0 - 1
Item 21 1.00 1.7 0 - 3 2.33 1.2 1 - 3 0.67 1.2 0 - 2
Item 22 1.67 1.5 0 - 3 2.00 1.7 0 - 3 1.33 0.6 1 - 2
Item 23 2.33 1.2 1 - 3 1.67 1.5 0 - 3 2.67 0.6 2 - 3
Item 24 1.33 1.5 0 - 3 2.33 0.6 2 - 3 0.67 0.6 0 - 1
Item 25 1.00 1.0 0 - 2 2.67 0.6 2 - 3 1.00 1.7 0 - 3
Item 26 1.00 1.7 0 - 3 2.67 0.6 2 - 3 1.00 1.0 0 - 2
Item 27 2.00 1.0 1 - 3 3.00 0.0 3 - 3 2.33 0.6 2 - 3
Item 28 1.00 1.7 0 - 3 3.00 0.0 3 - 3 2.00 1.7 0 - 3
Item 29 1.00 1.7 0 - 3 3.00 0.0 3 - 3 2.00 1.0 1 - 3
Item 30 1.00 1.7 0 - 3 2.33 0.6 2 - 3 1.33 1.5 0 - 3
74
ESL RATERS
Task 1 Task 2 Task 3
Mean SD Range Mean SD Range Mean SD Range
Item 1 1.75 1.5 0 - 3 1.00 1.4 0 - 3 0.75 1.0 0 - 2
Item 2 2.25 1.5 0 - 3 0.50 0.6 0 - 1 1.75 1.5 0 - 3
Item 3 1.50 1.3 0 - 3 0.00 0.0 0 - 0 0.25 0.5 0 - 1
Item 4 2.50 1.0 1 - 3 1.00 1.4 0 - 3 1.00 0.8 0 - 2
Item 5 1.50 1.3 0 - 3 0.25 0.5 0 - 1 0.50 0.6 0 - 1
Item 6 2.00 0.8 1 - 3 0.25 0.5 0 - 1 0.50 0.6 0 - 1
Item 7 2.25 1.0 1 - 3 0.75 1.0 0 - 2 1.50 1.0 0 - 2
Item 8 2.25 1.0 1 - 3 0.75 1.0 0 - 2 0.75 1.0 0 - 2
Item 9 2.50 0.6 2 - 3 1.00 1.4 0 - 3 0.75 1.0 0 - 2
Item 10 1.50 1.3 0 - 3 0.25 0.5 0 - 1 0.75 1.0 0 - 2
Item 11 2.25 1.0 1 - 3 1.25 1.5 0 - 3 1.00 1.2 0 - 2
Item 12 2.00 0.8 1 - 3 0.25 0.5 0 - 1 1.25 1.0 0 - 2
Item 13 2.25 1.0 1 - 3 1.25 1.5 0 - 3 2.25 1.0 1 - 3
Item 14 1.75 1.0 1 - 3 1.25 1.5 0 - 3 1.25 0.5 1 - 2
Item 15 2.25 1.0 1 - 3 0.75 1.5 0 - 3 2.25 0.5 2 - 3
Item 16 2.50 0.6 2 - 3 1.00 1.2 0 - 2 0.25 0.5 0 - 1
Item 17 2.00 1.2 1 - 3 1.00 0.8 0 - 2 1.75 1.3 0 - 3
Item 18 2.75 0.5 2 - 3 1.25 1.3 0 - 3 1.50 0.6 1 - 2
Item 19 1.50 1.3 0 - 3 1.00 1.4 0 - 3 0.25 0.5 0 - 1
Item 20 2.75 0.5 2 - 3 0.50 1.0 0 - 2 1.00 0.0 1 - 1
Item 21 2.00 0.8 1 - 3 0.25 0.5 0 - 1 1.50 0.6 1 - 2
Item 22 2.75 0.5 2 - 3 1.00 1.4 0 - 3 1.75 1.5 0 - 3
Item 23 3.00 0.0 3 - 3 0.50 1.0 0 - 2 2.25 1.0 1 - 3
Item 24 3.00 0.0 3 - 3 0.75 1.0 0 - 2 2.25 1.5 0 - 3
Item 25 2.75 0.5 2 - 3 0.75 1.0 0 - 2 2.25 1.5 0 - 3
Item 26 3.00 0.0 3 - 3 0.50 1.0 0 - 2 2.00 1.4 0 - 3
Item 27 2.75 0.5 2 - 3 1.00 1.4 0 - 3 2.00 1.4 0 - 3
Item 28 2.75 0.5 2 - 3 0.50 1.0 0 - 2 2.25 1.0 1 - 3
Item 29 2.75 0.5 2 - 3 1.00 0.8 0 - 2 1.75 1.5 0 - 3
Item 30 2.75 0.5 2 - 3 0.25 0.5 0 - 1 1.50 1.3 0 - 3
75
ESL RATERS (Cont.)
Task 4 Task 5 Task 6
Mean SD Range Mean SD Range Mean SD Range
Item 1 1.00 1.2 0 - 2 2.00 1.4 0 - 3 1.75 1.3 0 - 3
Item 2 2.00 1.4 0 - 3 2.00 1.4 0 - 3 1.75 1.5 0 - 3
Item 3 1.75 1.5 0 - 3 1.50 1.3 0 - 3 0.50 1.0 0 - 2
Item 4 1.00 1.4 0 - 3 2.25 0.5 2 - 3 1.00 1.2 0 - 2
Item 5 0.75 1.0 0 - 2 1.50 1.3 0 - 3 1.00 1.2 0 - 2
Item 6 0.50 1.0 0 - 2 2.00 0.8 1 - 3 1.00 0.8 0 - 2
Item 7 1.25 1.0 0 - 2 2.25 1.0 1 - 3 0.50 1.0 0 - 2
Item 8 0.75 1.0 0 - 2 1.75 1.0 1 - 3 1.00 1.2 0 - 2
Item 9 1.00 0.8 0 - 2 1.75 0.5 1 - 2 1.25 1.0 0 - 2
Item 10 1.25 1.0 0 - 2 1.00 1.2 0 - 2 1.00 1.4 0 - 3
Item 11 1.50 1.3 0 - 3 1.75 1.0 1 - 3 1.00 1.2 0 - 2
Item 12 1.00 1.2 0 - 2 1.50 1.3 0 - 3 1.00 1.4 0 - 3
Item 13 2.00 0.8 1 - 3 2.25 1.0 1 - 3 1.00 1.4 0 - 3
Item 14 1.00 0.8 0 - 2 1.50 1.3 0 - 3 0.75 1.5 0 - 3
Item 15 2.00 0.8 1 - 3 2.00 0.8 1 - 3 1.75 1.5 0 - 3
Item 16 0.25 0.5 0 - 1 2.25 1.0 1 - 3 1.00 1.4 0 - 3
Item 17 1.50 0.6 1 - 2 1.75 1.3 0 - 3 1.25 1.3 0 - 3
Item 18 1.25 0.5 1 - 2 1.50 1.3 0 - 3 1.25 1.3 0 - 3
Item 19 0.25 0.5 0 - 1 1.50 1.0 1 - 3 0.75 1.5 0 - 3
Item 20 0.75 0.5 0 - 1 1.75 1.5 0 - 3 1.00 1.4 0 - 3
Item 21 1.00 1.4 0 - 3 1.75 1.0 1 - 3 1.00 1.4 0 - 3
Item 22 1.75 1.5 0 - 3 1.75 1.5 0 - 3 1.25 1.5 0 - 3
Item 23 2.25 1.0 1 - 3 2.50 0.6 2 - 3 2.25 0.5 2 - 3
Item 24 1.75 1.3 0 - 3 2.00 1.4 0 - 3 1.50 1.3 0 - 3
Item 25 2.50 0.6 2 - 3 3.00 0.0 3 - 3 2.00 1.4 0 - 3
Item 26 2.00 1.4 0 - 3 1.50 1.3 0 - 3 1.25 1.0 0 - 2
Item 27 1.75 1.5 0 - 3 2.25 1.5 0 - 3 1.75 1.3 0 - 3
Item 28 2.00 1.4 0 - 3 2.75 0.5 2 - 3 2.00 1.4 0 - 3
Item 29 1.50 1.3 0 - 3 3.00 0.0 3 - 3 2.50 0.6 2 - 3
Item 30 1.25 1.0 0 - 2 2.25 1.5 0 - 3 2.00 1.4 0 - 3
76
Item Linking Ratings for ETS Test Specialists and ESL Faculty
Listening ETS RATERS
Task 7 Task 8 Task 9
Mean SD Range Mean SD Range Mean SD Range
2.67 0.6 2 - 3 0.33 0.6 0 - 1 2.67 0.6 2 - 3
2.33 0.6 2 - 3 1.00 1.0 0 - 2 2.67 0.6 2 - 3
2.67 0.6 2 - 3 0.33 0.6 0 - 1 2.67 0.6 2 - 3
3.00 0.0 3 - 3 1.33 1.2 0 - 2 2.33 0.6 2 - 3
2.67 0.6 2 - 3 1.00 1.0 0 - 2 2.33 0.6 2 - 3
1.67 0.6 1 - 2 1.33 0.6 1 - 2 0.67 0.6 0 - 1
2.33 0.6 2 - 3 1.00 1.0 0 - 2 2.00 0.0 2 - 2
1.33 1.2 0 - 2 0.67 0.6 0 - 1 0.00 0.0 0 - 0
2.33 0.6 2 - 3 0.33 0.6 0 - 1 1.67 1.5 0 - 3
3.00 0.0 3 - 3 0.33 0.6 0 - 1 2.33 0.6 2 - 3
2.00 1.7 0 - 3 1.33 0.6 1 - 2 2.67 0.6 2 - 3
1.67 0.6 1 - 2 0.33 0.6 0 - 1 0.33 0.6 0 - 1
1.33 1.5 0 - 3 0.67 0.6 0 - 1 2.67 0.6 2 - 3
2.67 0.6 2 - 3 1.00 1.0 0 - 2 2.33 1.2 1 - 3
1.67 0.6 1 - 2 2.67 0.6 2 - 3 0.33 0.6 0 - 1
1.67 0.6 1 - 2 0.67 0.6 0 - 1 1.33 1.5 0 - 3
2.33 0.6 2 - 3 2.33 0.6 2 - 3 0.33 0.6 0 - 1
1.67 1.2 1 - 3 1.67 1.2 1 - 3 1.00 1.0 0 - 2
2.33 1.2 1 - 3 2.00 0.0 2 - 2 2.67 0.6 2 - 3
2.67 0.6 2 - 3 1.33 0.6 1 - 2 0.67 1.2 0 - 2
2.67 0.6 2 - 3 1.67 1.2 1 - 3 0.67 1.2 0 - 2
0.00 0.0 0 - 0 2.00 1.7 0 - 3 0.00 0.0 0 - 0
1.67 1.5 0 - 3 1.33 1.2 0 - 2 0.00 0.0 0 - 0
0.00 0.0 0 - 0 0.00 0.0 0 - 0 0.00 0.0 0 - 0
2.67 0.6 2 - 3 0.00 0.0 0 - 0 1.00 1.0 0 - 2
0.67 0.6 0 - 1 1.33 1.2 0 - 2 0.00 0.0 0 - 0
2.00 1.7 0 - 3 2.00 1.7 0 - 3 1.33 1.5 0 - 3
2.67 0.6 2 - 3 3.00 0.0 3 - 3 1.33 1.5 0 - 3
1.67 1.5 0 - 3 2.00 1.7 0 - 3 1.67 1.5 0 - 3
1.67 1.2 1 - 3 0.67 0.6 0 - 1 1.33 1.5 0 - 3
77
Listening ETS RATERS (Cont.)
Task 10 Task 11
Mean SD Range Mean SD Range
0.00 0.0 0 - 0 2.33 1.2 1 - 3
0.00 0.0 0 - 0 2.67 0.6 2 - 3
0.00 0.0 0 - 0 3.00 0.0 3 - 3
0.00 0.0 0 - 0 2.00 0.0 2 - 2
0.00 0.0 0 - 0 2.33 0.6 2 - 3
1.00 1.7 0 - 3 1.00 1.0 0 - 2
0.00 0.0 0 - 0 1.00 1.0 0 - 2
0.00 0.0 0 - 0 0.67 0.6 0 - 1
0.67 1.2 0 - 2 1.00 1.0 0 - 2
0.67 0.6 0 - 1 2.67 0.6 2 - 3
1.67 1.5 0 - 3 2.33 0.6 2 - 3
0.00 0.0 0 - 0 1.00 1.0 0 - 2
0.00 0.0 0 - 0 1.00 1.0 0 - 2
0.33 0.6 0 - 1 2.00 1.0 1 - 3
0.00 0.0 0 - 0 1.33 0.6 1 - 2
0.00 0.0 0 - 0 1.33 1.5 0 - 3
0.33 0.6 0 - 1 1.33 1.5 0 - 3
0.00 0.0 0 - 0 2.00 1.0 1 - 3
1.00 1.0 0 - 2 2.00 1.7 0 - 3
0.00 0.0 0 - 0 1.33 1.2 0 - 2
0.33 0.6 0 - 1 3.00 0.0 3 - 3
0.33 0.6 0 - 1 0.00 0.0 0 - 0
0.00 0.0 0 - 0 1.67 1.5 0 - 3
0.00 0.0 0 - 0 0.33 0.6 0 - 1
0.00 0.0 0 - 0 2.00 1.7 0 - 3
1.00 1.7 0 - 3 0.67 1.2 0 - 2
1.00 1.7 0 - 3 1.33 1.2 0 - 2
0.00 0.0 0 - 3 1.00 1.7 0 - 3
1.33 1.5 0 - 3 0.67 1.2 0 - 2
0.67 1.2 0 - 2 0.67 1.2 0 - 2
78
ESL RATERS
Task 7 Task 8 Task 9
Mean SD Range Mean SD Range Mean SD Range
1.50 1.3 0 - 3 0.50 0.6 0 - 1 2.00 1.4 0 - 3
2.00 0.0 2 - 2 1.25 1.0 0 - 2 1.75 1.5 0 - 3
2.75 0.5 2 - 3 0.50 0.6 0 - 1 1.50 1.7 0 - 3
1.25 1.0 0 - 2 0.50 1.0 0 - 2 2.00 1.4 0 - 3
2.50 1.0 1 - 3 1.00 1.2 0 - 2 0.75 1.0 0 - 2
1.75 0.5 1 - 2 0.75 1.0 0 - 2 0.50 0.6 0 - 1
1.25 1.0 0 - 2 1.00 1.4 0 - 3 2.25 0.5 2 - 3
1.00 1.2 0 - 2 1.00 1.2 0 - 2 1.00 1.2 0 - 2
1.75 0.5 1 - 2 1.75 1.3 0 - 3 1.50 1.0 0 - 2
2.75 0.5 2 - 3 1.00 1.2 0 - 2 2.00 0.0 2 - 2
2.50 0.6 2 - 3 1.25 1.5 0 - 3 2.25 1.5 0 - 3
2.25 1.0 1 - 3 1.50 1.0 0 - 2 0.50 1.0 0 - 2
2.25 1.0 1 - 3 1.50 1.0 0 - 2 1.75 1.5 0 - 3
2.25 0.5 2 - 3 1.00 1.2 0 - 2 2.25 0.5 2 - 3
2.50 0.6 2 - 3 1.25 1.0 0 - 2 0.25 0.5 0 - 1
2.00 1.2 1 - 3 1.25 1.0 0 - 2 0.75 0.5 0 - 1
1.75 1.5 0 - 3 1.25 1.0 0 - 2 0.50 0.6 0 - 1
2.25 1.0 1 - 3 1.00 1.2 0 - 2 1.00 0.8 0 - 2
2.25 1.0 1 - 3 0.75 1.0 0 - 2 2.50 0.6 2 - 3
2.50 0.6 2 - 3 1.25 1.0 0 - 2 0.25 0.5 0 - 1
2.75 0.5 2 - 3 0.75 1.0 0 - 2 0.25 0.5 0 - 1
1.00 1.4 0 - 3 1.25 1.3 0 - 3 0.25 0.5 0 - 1
2.00 0.8 1 - 3 1.75 1.3 0 - 3 0.25 0.5 0 - 1
0.75 1.0 0 - 2 2.00 1.4 0 - 3 0.25 0.5 0 - 1
2.00 0.8 1 - 3 1.75 1.3 0 - 3 0.25 0.5 0 - 1
1.00 0.8 0 - 2 1.00 1.2 0 - 2 0.25 0.5 0 - 1
2.25 1.0 1 - 3 2.00 1.4 0 - 3 0.50 0.6 0 - 1
2.75 0.5 2 - 3 2.00 1.4 0 - 3 1.00 1.4 0 - 3
2.50 1.0 1 - 3 1.75 1.3 0 - 3 1.25 1.5 0 - 3
2.75 0.5 2 - 3 1.75 1.3 0 - 3 0.25 0.5 0 - 1
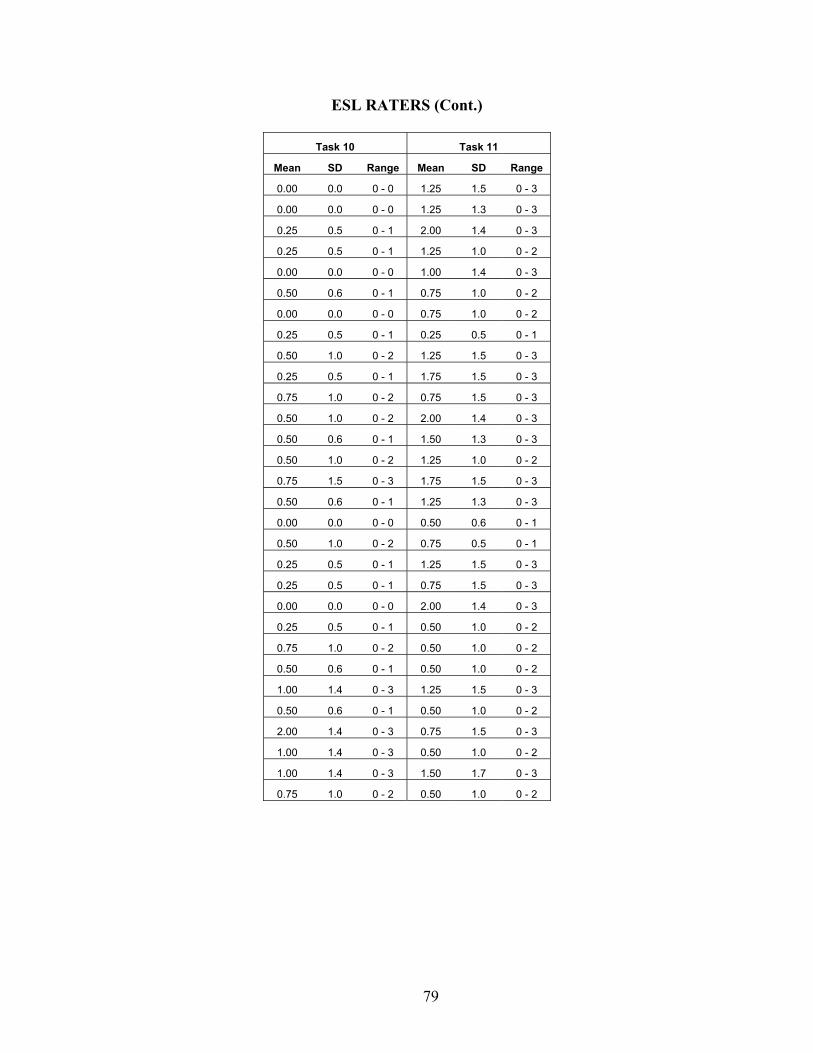
79
ESL RATERS (Cont.)
Task 10 Task 11
Mean SD Range Mean SD Range
0.00 0.0 0 - 0 1.25 1.5 0 - 3
0.00 0.0 0 - 0 1.25 1.3 0 - 3
0.25 0.5 0 - 1 2.00 1.4 0 - 3
0.25 0.5 0 - 1 1.25 1.0 0 - 2
0.00 0.0 0 - 0 1.00 1.4 0 - 3
0.50 0.6 0 - 1 0.75 1.0 0 - 2
0.00 0.0 0 - 0 0.75 1.0 0 - 2
0.25 0.5 0 - 1 0.25 0.5 0 - 1
0.50 1.0 0 - 2 1.25 1.5 0 - 3
0.25 0.5 0 - 1 1.75 1.5 0 - 3
0.75 1.0 0 - 2 0.75 1.5 0 - 3
0.50 1.0 0 - 2 2.00 1.4 0 - 3
0.50 0.6 0 - 1 1.50 1.3 0 - 3
0.50 1.0 0 - 2 1.25 1.0 0 - 2
0.75 1.5 0 - 3 1.75 1.5 0 - 3
0.50 0.6 0 - 1 1.25 1.3 0 - 3
0.00 0.0 0 - 0 0.50 0.6 0 - 1
0.50 1.0 0 - 2 0.75 0.5 0 - 1
0.25 0.5 0 - 1 1.25 1.5 0 - 3
0.25 0.5 0 - 1 0.75 1.5 0 - 3
0.00 0.0 0 - 0 2.00 1.4 0 - 3
0.25 0.5 0 - 1 0.50 1.0 0 - 2
0.75 1.0 0 - 2 0.50 1.0 0 - 2
0.50 0.6 0 - 1 0.50 1.0 0 - 2
1.00 1.4 0 - 3 1.25 1.5 0 - 3
0.50 0.6 0 - 1 0.50 1.0 0 - 2
2.00 1.4 0 - 3 0.75 1.5 0 - 3
1.00 1.4 0 - 3 0.50 1.0 0 - 2
1.00 1.4 0 - 3 1.50 1.7 0 - 3
0.75 1.0 0 - 2 0.50 1.0 0 - 2
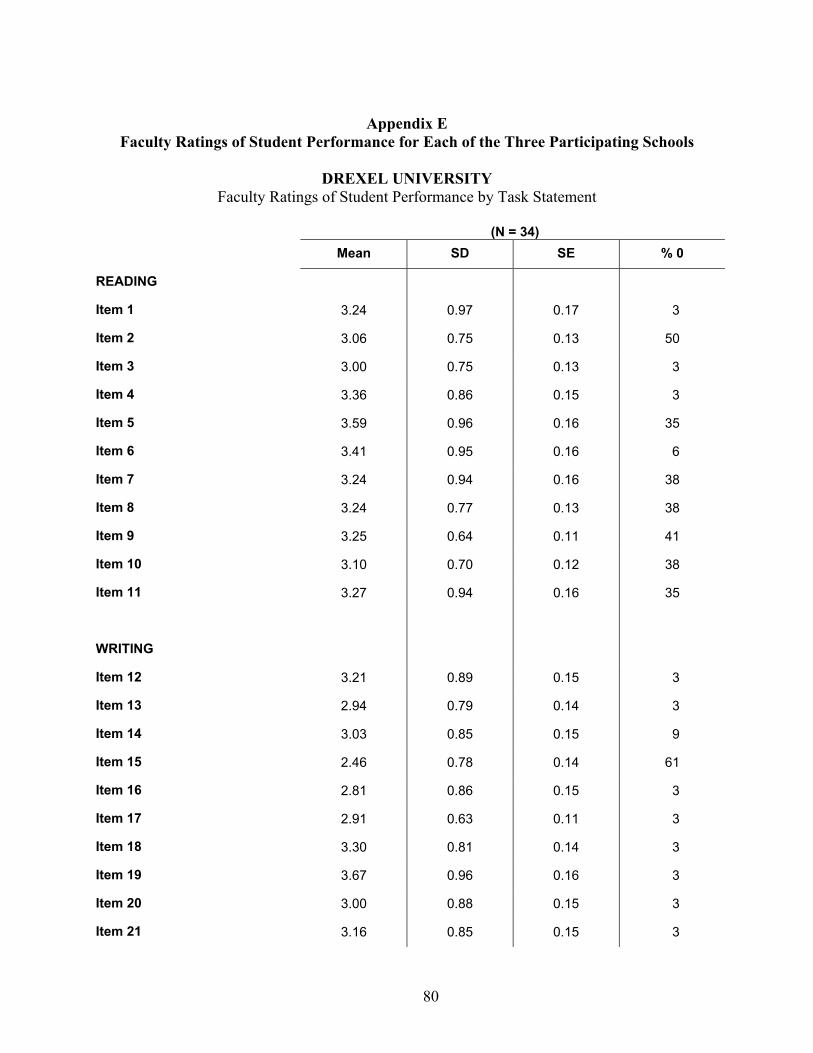
80
Appendix E
Faculty Ratings of Student Performance for Each of the Three Participating Schools
DREXEL UNIVERSITY Faculty Ratings of Student Performance by Task Statement
(N = 34)
Mean SD SE % 0
3.24 0.97 0.17 3
3.06 0.75 0.13 50
3.00 0.75 0.13 3
3.36 0.86 0.15 3
3.59 0.96 0.16 35
3.41 0.95 0.16 6
3.24 0.94 0.16 38
3.24 0.77 0.13 38
3.25 0.64 0.11 41
3.10 0.70 0.12 38
3.27 0.94 0.16 35
3.21 0.89 0.15 3
2.94 0.79 0.14 3
3.03 0.85 0.15 9
2.46 0.78 0.14 61
2.81 0.86 0.15 3
2.91 0.63 0.11 3
3.30 0.81 0.14 3
3.67 0.96 0.16 3
3.00 0.88 0.15 3
READING
Item 1
Item 2
Item 3
Item 4
Item 5
Item 6
Item 7
Item 8
Item 9
Item 10
Item 11
WRITING
Item 12
Item 13
Item 14
Item 15
Item 16
Item 17
Item 18
Item 19
Item 20
Item 21 3.16 0.85 0.15 3
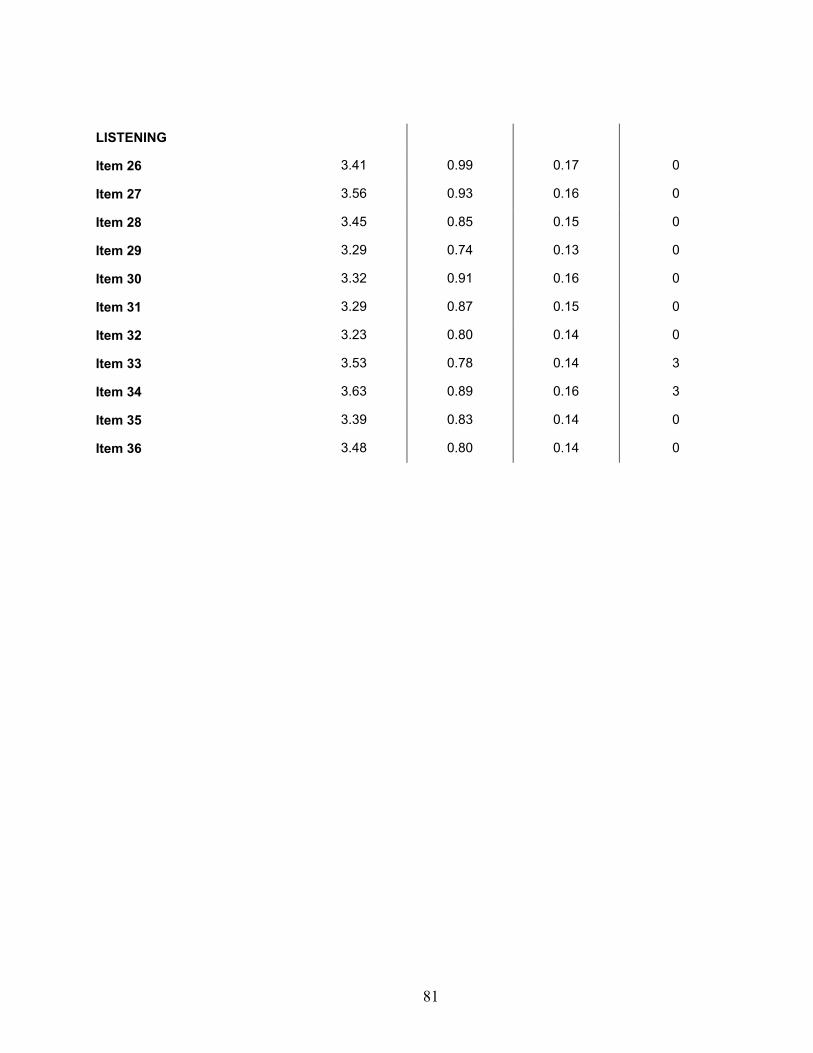
81
3.41 0.99 0.17 0
3.56 0.93 0.16 0
3.45 0.85 0.15 0
3.29 0.74 0.13 0
3.32 0.91 0.16 0
3.29 0.87 0.15 0
3.23 0.80 0.14 0
3.53 0.78 0.14 3
3.63 0.89 0.16 3
LISTENING
Item 26
Item 27
Item 28
Item 29
Item 30
Item 31
Item 32
Item 33
Item 34
Item 35
Item 36
3.39
3.48
0.83
0.80
0.14
0.14
0
0
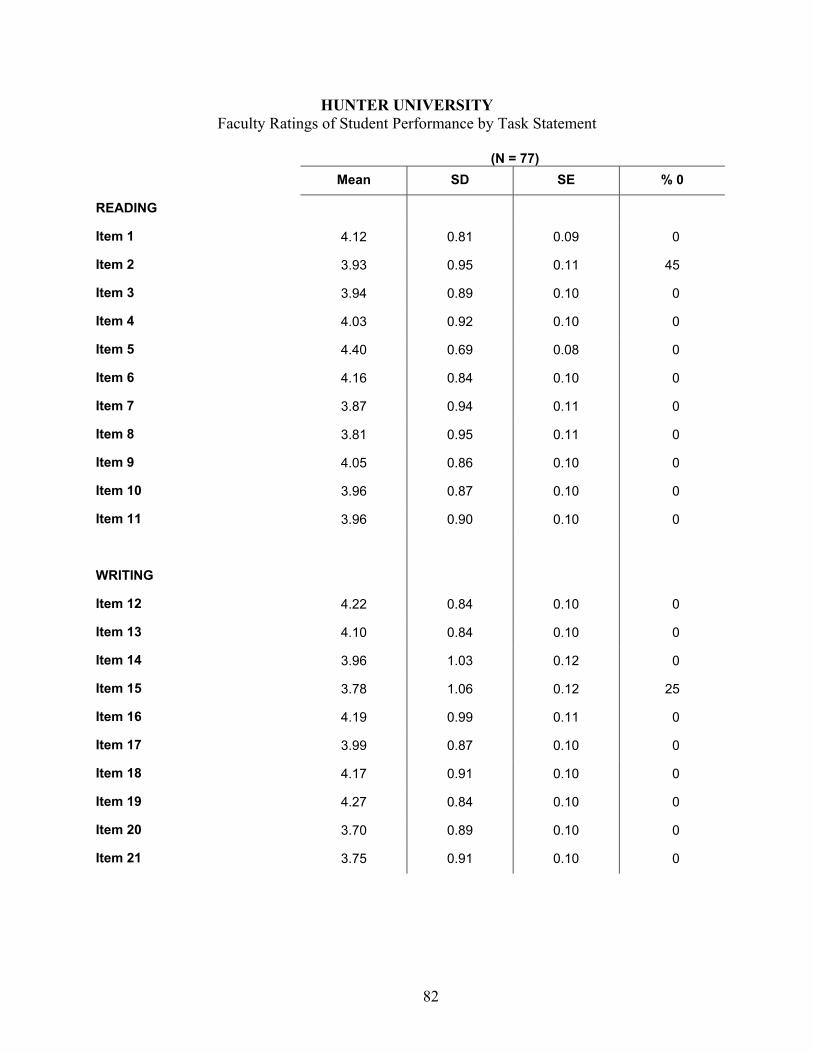
82
HUNTER UNIVERSITY Faculty Ratings of Student Performance by Task Statement
(N = 77)
Mean SD SE % 0
4.12 0.81 0.09 0
3.93 0.95 0.11 45
3.94 0.89 0.10 0
4.03 0.92 0.10 0
4.40 0.69 0.08 0
4.16 0.84 0.10 0
3.87 0.94 0.11 0
3.81 0.95 0.11 0
4.05 0.86 0.10 0
3.96 0.87 0.10 0
3.96 0.90 0.10 0
4.22 0.84 0.10 0
4.10 0.84 0.10 0
3.96 1.03 0.12 0
3.78 1.06 0.12 25
4.19 0.99 0.11 0
3.99 0.87 0.10 0
4.17 0.91 0.10 0
4.27 0.84 0.10 0
3.70 0.89 0.10 0
3.75 0.91 0.10 0
READING
Item 1
Item 2
Item 3
Item 4
Item 5
Item 6
Item 7
Item 8
Item 9
Item 10
Item 11
WRITING
Item 12
Item 13
Item 14
Item 15
Item 16
Item 17
Item 18
Item 19
Item 20
Item 21
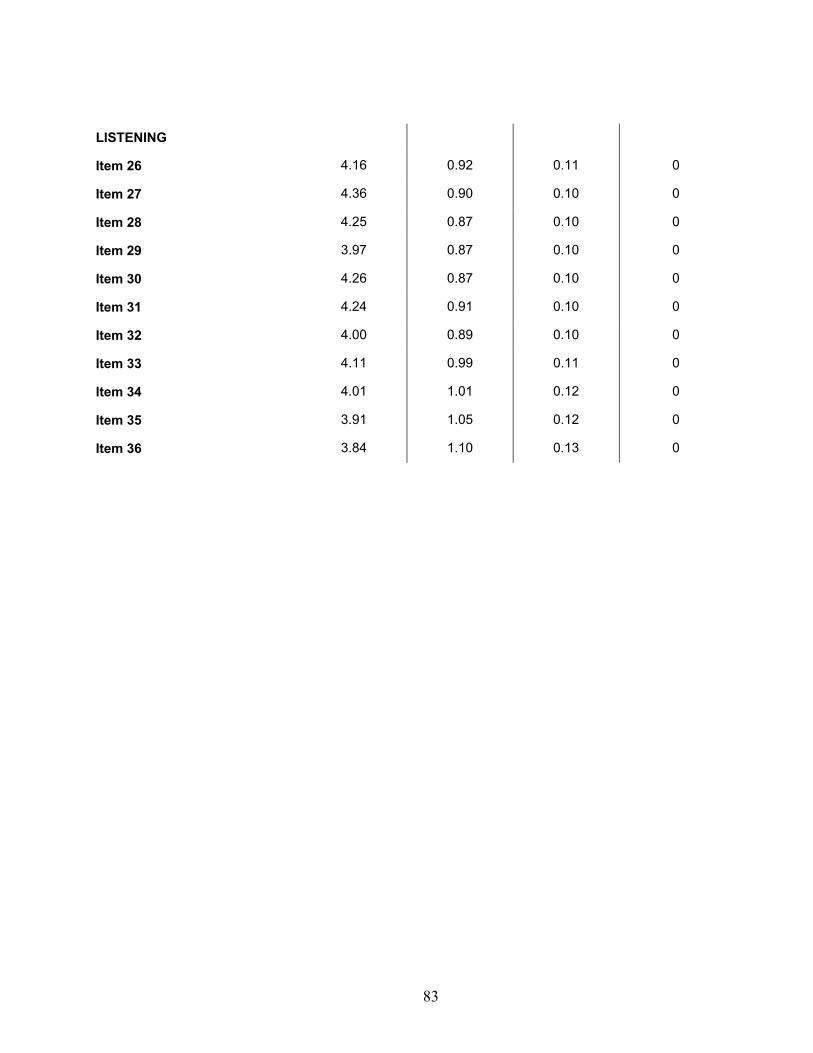
83
4.16 0.92 0.11 0
4.36 0.90 0.10 0
4.25 0.87 0.10 0
3.97 0.87 0.10 0
4.26 0.87 0.10 0
4.24 0.91 0.10 0
4.00 0.89 0.10 0
LISTENING
Item 26
Item 27
Item 28
Item 29
Item 30
Item 31
Item 32
Item 33
Item 34
Item 35
Item 36
4.11
4.01
3.91
3.84
0.99
1.01
1.05
1.10
0.11
0.12
0.12
0.13
0
0
0
0
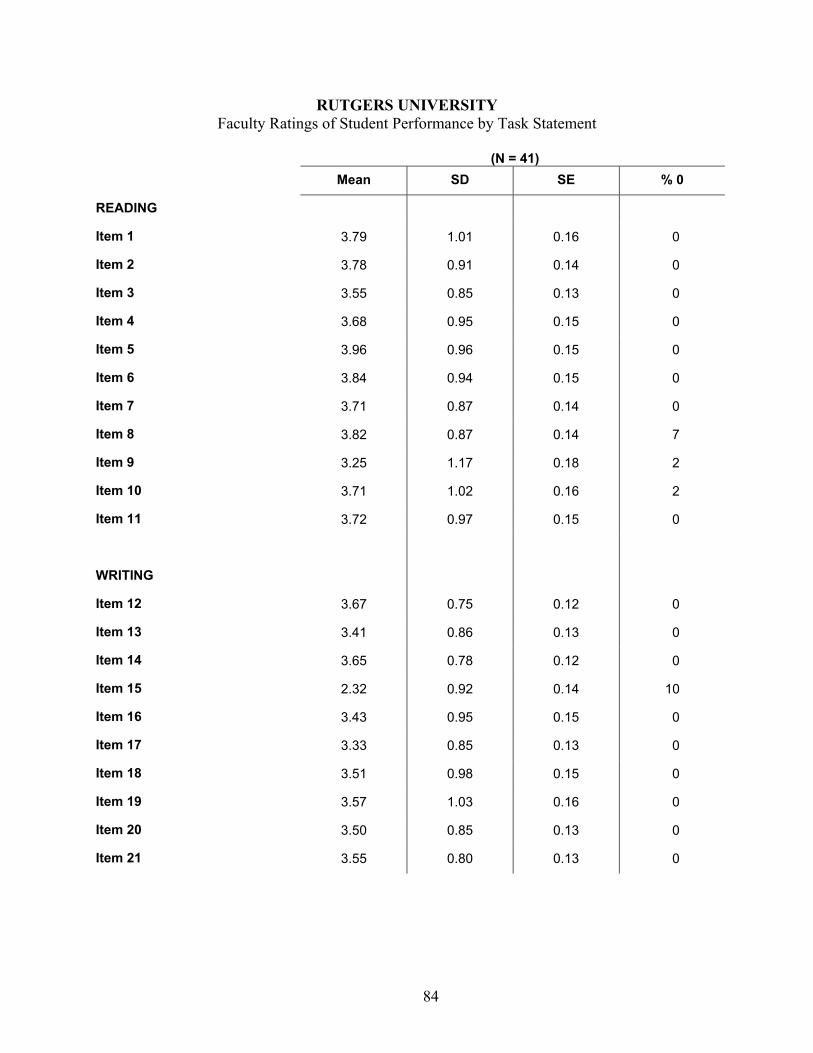
84
RUTGERS UNIVERSITY Faculty Ratings of Student Performance by Task Statement
(N = 41)
Mean SD SE % 0
3.79 1.01 0.16 0
3.78 0.91 0.14 0
3.55 0.85 0.13 0
3.68 0.95 0.15 0
3.96 0.96 0.15 0
3.84 0.94 0.15 0
3.71 0.87 0.14 0
3.82 0.87 0.14 7
3.25 1.17 0.18 2
3.71 1.02 0.16 2
3.72 0.97 0.15 0
3.67 0.75 0.12 0
3.41 0.86 0.13 0
3.65 0.78 0.12 0
2.32 0.92 0.14 10
3.43 0.95 0.15 0
3.33 0.85 0.13 0
3.51 0.98 0.15 0
3.57 1.03 0.16 0
3.50 0.85 0.13 0
3.55 0.80 0.13 0
READING
Item 1
Item 2
Item 3
Item 4
Item 5
Item 6
Item 7
Item 8
Item 9
Item 10
Item 11
WRITING
Item 12
Item 13
Item 14
Item 15
Item 16
Item 17
Item 18
Item 19
Item 20
Item 21

85
3.87 0.87 0.14 0
4.09 0.81 0.13 0
3.72 0.77 0.12 0
3.66 0.89 0.14 0
3.85 0.91 0.14 0
3.67 1.02 0.16 0
3.66 0.85 0.13 0
LISTENING
Item 26
Item 27
Item 28
Item 29
Item 30
Item 31
Item 32
Item 33
Item 34
Item 35
Item 36
3.74
4.01
4.04
3.95
0.93
0.93
0.94
0.99
0.15
0.14
0.15
0.16
0
0
0
0

Test of English as a Foreign LanguagePO Box 6155
Princeton, NJ 08541-6155USA
To obtain more information about TOEFL programs and services, use one of the following:
Phone: 609-771-7100Email: [email protected]
Web site: www.toefl.org
73313-025349 • Y44E.1 • Printed in U.S.A.I.N. 995209
®