Embed Size (px)
Citation preview

INVESTIGATING THE RHYTHMS OF HUMAN MOVEMENTS IN GENEVA LAKE
REGION USING MDC DATA
R. Javanmard*, R. Esmaeili, , M. Malekzadeh, F. Karimipour
School of Surveying and Geospatial Engineering, College of Engineering, University of Tehran, Tehran, Iran - (reyhanejavanmard,
roya.esmaeili, miladmalekzadeh, fkarimipour)@ut.ac.ir
Commission VI, WG VI/4
KEY WORDS: Movement pattern, Demographic Variables, time variable
ABSTRACT:
Movement data are becoming extensive and comprehensive with the advent of GPS (global positioning system) and pervasive use of
smartphones, which has led to an increasing rate of studies about movement such as mobility pattern of oil spills, taxies, storms and
animals. Studying the movement of people has long been the topic of much thought and debate among researchers within the field of
transportation, social issues, and policy. One of the basic prerequisites for studying human movement behavior is modeling the
movement, which show how people move so that the effect of different variables can be revealed. For this purpose, this research
intends to deploy the concept of activity space (i.e., the part of the space in which a person is active) and its determinants to display
the trajectory of individuals, and then modeling the effect of different variables on human mobility behavior. This study explores the
effect of time (movement on weekends and weekdays) and demographic (age, gender, occupation state) factors on the characteristics
of human mobility pattern and analyzes the extent to which the mobility pattern of different group of people is related to time by
using Swiss human movement sample dataset, called MDC. These movement characteristics can be used later in a wide range of
applications, such as predictions, urban planning, and traffic forecasting.
* Corresponding author
1. INTRODUCTION
Human mobility plays an important role in the study of traffic
forecasting, disease spreading, urban planning, and in the
general science and engineering of smart cities (Luo, Cao et al.
2016). In the past, most of the efforts to understand the human
movement were based on the data collected by questionnaires
(Yamamoto and Kitamura 1999), which were expensive, not big
enough and led to a time-consuming, inefficient process.
However, the amelioration of Web and mobile technologies
yields a set of reliable and cost-effective data sources that has
triggered studies of human mobility patterns (Shi, Chi et al.
2015). Human mobility is restricted by a multitude of demographic
factors such as age, gender, occupation, and income. In
addition, temporal order (e.g., weekends and weekdays) are
considered to have an important impact on individual
movement behavior (Yuan, Raubal et al. 2012). Due to the
inherent inconsistency of movement patterns on weekdays and
weekends, it is necessary to explore human mobility under
different temporal orders.
This paper aims to explore the correlation between demographic
variables (age, gender, and occupation) and human movement
pattern with time perspective by exploiting Swiss human
movement sample dataset, i.e., Mobile Data Challenge (MDC)
dataset, in Geneva Lake Region.
2. METHODOLOGY
Activity space is defined as a geographic coverage of an
individual's movement trajectory by considering visited places
and taken routes that helped her get to her destinations (Lee,
Voss et al. 2016). There are several related concepts, such as the
action space (Horton and Reynolds 1971), the awareness space
(Brown and Moore 1970), or space-time prisms (Hagerstrand
1970).
Figure 1. deviational ellipse (Wang, Kang et al. 2015)
The approximation and measurement of activity space depict
the basic characteristics of activity space (size, shape, etc.).
Historically, activity space is measured based on two types of
methods: Eclipse-based representation (Figure 1), e.g., standard
deviational ellipse, the radius of gyration (Song, Qu et al. 2010)
and network-based representation (e.g., road networks)
(Sherman 2011). We adopt the ellipse-based method to better
characterize the geometric properties of activity spaces. In order
to identify the characteristics of activity space, the following
determinants have been employed:
The International Archives of the Photogrammetry, Remote Sensing and Spatial Information Sciences, Volume XLII-4/W18, 2019 GeoSpatial Conference 2019 – Joint Conferences of SMPR and GI Research, 12–14 October 2019, Karaj, Iran
This contribution has been peer-reviewed. https://doi.org/10.5194/isprs-archives-XLII-4-W18-583-2019 | © Authors 2019. CC BY 4.0 License.
583

Area: It indicates the extent of the activity space (Newsome,
Walcott et al. 1998), and is used to depict the dispersion of
the visited locations (Schönfelder and Axhausen 2003). The
area of the standard deviation ellipse is calculated as follow:
area ab (1)
where a is the semi-major axis and b is the semi-minor
axis of the ellipse.
Shape index (1-eccentricity): As users’ trajectories are
approximated as ellipses, the movement eccentricity
represents how much a particular activity space’s shape
deviates from a circular shape:
2
1b
ea
(2)
For instance, if 1e , it is highly possible that the particular
person mostly moves between popular pegs of her life such as
work and home; therefore, the shape of activity space is close to
a regular straight line rather than a circle (Yuan and Raubal
2016). Here, we use 1-eccentricity to represent the extent to
which an activity space deviates from a straight line. The higher
the value of shape index, the more scattered is a user’s visited
places and the more is the shape of her activity space like a
circle rather than a thin ellipse.
3. RESULTS
3.1 MDC Dataset
In January 2009, Nokia Research Centre Lausanne and its Swiss
academic partners designed the Lausanne Data Collection
Campaign (LDCC) to create large-scale mobile data researcher
sources. Data was collected using Nokia N95 phones and
around 185 volunteers (38% male and 62% female) who lived
near Geneva Lake contributed in this project over a period of
one year. Although myriad types of data were recoded from the
smartphones of volunteers, this paper has used demographic
information of participants (age, gender, and the occupation),
and their location information produced by cell phone’s GPS
(time, longitude, latitude) in every 5 seconds (Kiukkonen, Blom
et al. 2010, Laurila, Gatica-Perez et al. 2012).
In the following section, users’ trajectories are separated based
on the days of the week and then the determinants of the activity
space are calculated for each individual. Subsequently, the
average and standard deviation of the mentioned parameters in
each group is used for detecting the impact of time on users’
movement.
3.2 Correlation between days of the week and activity space
Isaacman deployed median daily range and maximum daily
range to understand the effect of time on the movement of
people in America using mobile phone data (Isaacman, Becker
et al. 2011). In this research, activity space is fitted to the
maximum travel distance of some users in Switzerland instead
of the median of the daily range.
According to the area of activity spaces (Tables 1, 2 and Figure
2), users have on weekends bigger activity spaces than on
weekdays. It shows that users tend to travel to further places on
weekends, which could be due to the closure of schools and
having more free time during weekends. In addition, users have
a higher standard deviation of the area on weekends that
indicates bigger diversities among users’ movement behavior on
weekends (Table 2). One reason of this difference might be
stemmed from the idea that the majority of users tend to spend
their weekend at home but those who travel are eager to go to
further and scattered destinations (Isaacman, Becker et al.
2011). However, in contrast to Yuan’s results in 2013, the
difference between the shape index of the users’ activity space
on weekends and weekdays is not too much (Yuan 2013).
Note that general holidays are omitted from Table 1 and 2.
Days of the week No1. users Avg2 area Std3 area Avg SI Std SI4
Saturday 152 1206356320 1735113197 0.1108 0.1127
Sunday 150 1230619443 1812527016 0.1282 0.1355
Monday 150 540205863 1132220687 0.085 0.1128
Tuesday 152 610718147 1329976328 0.1016 0.129
Wednesday 153 565862949 946240586 0.0883 0.1014
Thursday 152 519474182 768785652 0.099 0.116
Friday 152 760972719 1247755746 0.1099 0.1253
Table 1. Average and standard deviation of area and shape index of users' activity space grouped by days of the week
Week No. users Avg area Std area Avg SI Std SI
weekends 152 1412443579 1790098291 0.1357 0.123
weekdays 155 784907146 1041589367 0.1219 0.124
1 Number of 2 Average of 3 Standard deviation of 4 Shape index
The International Archives of the Photogrammetry, Remote Sensing and Spatial Information Sciences, Volume XLII-4/W18, 2019 GeoSpatial Conference 2019 – Joint Conferences of SMPR and GI Research, 12–14 October 2019, Karaj, Iran
This contribution has been peer-reviewed. https://doi.org/10.5194/isprs-archives-XLII-4-W18-583-2019 | © Authors 2019. CC BY 4.0 License.
584

Table 2. Average and standard deviation of area and shape index of users' activity space grouped by weekdays and weekends
0
200,000,000
400,000,000
600,000,000
800,000,000
1,000,000,000
1,200,000,000
1,400,000,000
0 2 4 6 8
aver
age
of
Are
a
Days of Week
Figure 2. The relation between days of the week and users' activity space
Many other variables could affect the relationship between time
and the determinants of activity space. For example, as Crane
showed, having a car, job position, family and marital status,
etc., have an impact on the relationship between gender and
determinants of activity space (Crane 2007). Therefore, in the
following sections, in order to investigate the relationship
between demographic variables (gender, age, and occupation),
days of the week and users’ movement behavior, users in the
MDC dataset were first classified with regard to their gender,
age, and occupation. Then the effect of time on the determinants
of the activity space of individuals’ trajectories in each
demographic group was analyzed.
3.3 Correlation between gender, days of the week and
activity space
As seen in Tables 3, by calculating the parameters of activity
space for each user in male and female group and then
averaging them, it is determined that both men and women have
higher values for their activity space area and shape index on
weekends, which demonstrate that people on weekends, have a
longer distance travels, visit more scattered places, and shape of
their activity space is far from the straight line. However, with
regard to Table 4 and the greater standard deviation of the
average of men's activity space determinants, the impact of time
(days of the week) on their movement behavior is much higher
than that of women. Men experience further and more dispersed
travels during weekends. Moreover, having greater standard
deviation of activity space’s determinants shows that the
difference in their mobility behaviour is much higher on
weekends compared to women. This difference could be
attributed to the fact that most of men tend to spend their
weekend near their home, but those minorities who travel have
very long journeys with scattered destinations.
gender Week (female) No. users Avg area Std area Avg SI Std SI
Female Weekends 54 1067216087 1430578855 0.1272 0.1219
Weekdays 55 734150519 978573888 0.1154 0.1274
male Weekends 95 1544937519 1986419847 0.1461 0.1456
Weekdays 74 694896844 1003542127 0.1022 0.1274
Table 3. Average and standard deviation of area and shape index of user's activity space grouped by days of the week
Gender std (avg area) Std (avg SI)
Female 235512921 0.0083
Male 601069525 0.0311
Table 4. Effect of weekdays on the activity space of men and women.
3.4 Correlation between age, days of the week and activity
space
Individuals in all age groups have higher activity space’s area
and shape index on weekends. It indicates that individuals have
more distant and scattered travels and thus active lifestyle on
weekends. Moreover, it is observed that the physical shape of
activity space also deviates more from a straight line at
weekends. The standard deviation of the determinants of the
activity space is also higher on weekends, and thus the
difference in mobility behavior of individuals is greater (Tables
The International Archives of the Photogrammetry, Remote Sensing and Spatial Information Sciences, Volume XLII-4/W18, 2019 GeoSpatial Conference 2019 – Joint Conferences of SMPR and GI Research, 12–14 October 2019, Karaj, Iran
This contribution has been peer-reviewed. https://doi.org/10.5194/isprs-archives-XLII-4-W18-583-2019 | © Authors 2019. CC BY 4.0 License.
585
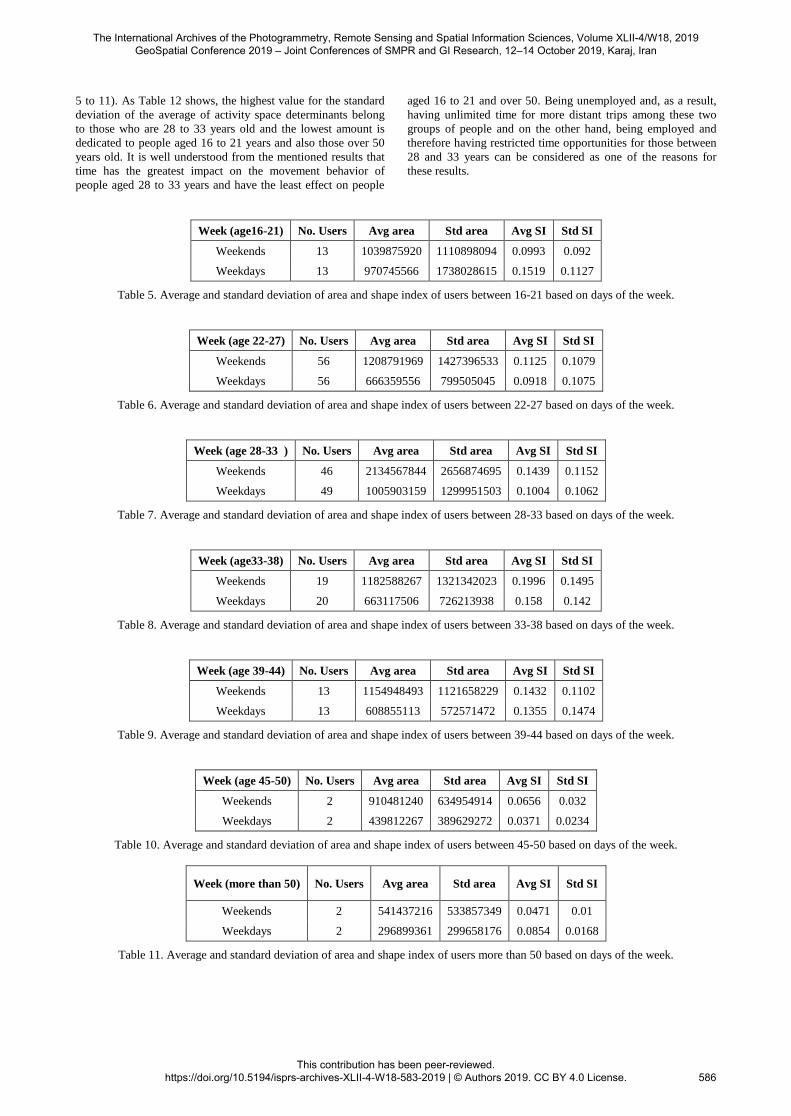
5 to 11). As Table 12 shows, the highest value for the standard
deviation of the average of activity space determinants belong
to those who are 28 to 33 years old and the lowest amount is
dedicated to people aged 16 to 21 years and also those over 50
years old. It is well understood from the mentioned results that
time has the greatest impact on the movement behavior of
people aged 28 to 33 years and have the least effect on people
aged 16 to 21 and over 50. Being unemployed and, as a result,
having unlimited time for more distant trips among these two
groups of people and on the other hand, being employed and
therefore having restricted time opportunities for those between
28 and 33 years can be considered as one of the reasons for
these results.
Week (age16-21) No. Users Avg area Std area Avg SI Std SI
Weekends 13 1039875920 1110898094 0.0993 0.092
Weekdays 13 970745566 1738028615 0.1519 0.1127
Table 5. Average and standard deviation of area and shape index of users between 16-21 based on days of the week.
Week (age 22-27) No. Users Avg area Std area Avg SI Std SI
Weekends 56 1208791969 1427396533 0.1125 0.1079
Weekdays 56 666359556 799505045 0.0918 0.1075
Table 6. Average and standard deviation of area and shape index of users between 22-27 based on days of the week.
Week (age 28-33 ) No. Users Avg area Std area Avg SI Std SI
Weekends 46 2134567844 2656874695 0.1439 0.1152
Weekdays 49 1005903159 1299951503 0.1004 0.1062
Table 7. Average and standard deviation of area and shape index of users between 28-33 based on days of the week.
Week (age33-38) No. Users Avg area Std area Avg SI Std SI
Weekends 19 1182588267 1321342023 0.1996 0.1495
Weekdays 20 663117506 726213938 0.158 0.142
Table 8. Average and standard deviation of area and shape index of users between 33-38 based on days of the week.
Week (age 39-44) No. Users Avg area Std area Avg SI Std SI
Weekends 13 1154948493 1121658229 0.1432 0.1102
Weekdays 13 608855113 572571472 0.1355 0.1474
Table 9. Average and standard deviation of area and shape index of users between 39-44 based on days of the week.
Week (age 45-50) No. Users Avg area Std area Avg SI Std SI
Weekends 2 910481240 634954914 0.0656 0.032
Weekdays 2 439812267 389629272 0.0371 0.0234
Table 10. Average and standard deviation of area and shape index of users between 45-50 based on days of the week.
Week (more than 50) No. Users Avg area Std area Avg SI Std SI
Weekends 2 541437216 533857349 0.0471 0.01
Weekdays 2 296899361 299658176 0.0854 0.0168
Table 11. Average and standard deviation of area and shape index of users more than 50 based on days of the week.
The International Archives of the Photogrammetry, Remote Sensing and Spatial Information Sciences, Volume XLII-4/W18, 2019 GeoSpatial Conference 2019 – Joint Conferences of SMPR and GI Research, 12–14 October 2019, Karaj, Iran
This contribution has been peer-reviewed. https://doi.org/10.5194/isprs-archives-XLII-4-W18-583-2019 | © Authors 2019. CC BY 4.0 License.
586

Age group Std (avg area) Std (avg SI)
21-16 48882542 0.0372
27-22 383557638 0.0147
33-28 798086453 0.0307
38-33 367321298 0.0294
44-39 386146332 0.0054
50-45 332813222 0.0202
more than 50 172914376 0.0271
Table 12. Comparison of the effect of weekdays on users' activity space with different age group.
3.5 Correlation between occupation, days of the week and
activity space
As is shown in tables 13 to 17, in all working groups the area,
shape index and the standard deviation of the activity space
determinants were higher on weekends due to the closure of
schools, universities, and workplaces which let people have
more free time on weekends. Thus, individuals tend to visit
more distant places and their destinations are spread out and are
not restricted to the pegs of their life. In addition, the result of
the comparison of the effect of time on the mobility behavior of
individuals with different working status is shown in Table 18.
With regard to the value of standard deviation for people in
different working groups, it can be concluded that the change in
time (days of the week) has the greatest effect on the mobility
behavior of employed people and has the least effect on
unemployed people. One of the interpretations might be lack of
sufficient time opportunity for staff to travel around on
weekdays.
Week (working full time) No Users Avg area Std area Avg SI Std SI
Weekends 82 1661450051 1986095364 0.1609 0.2062
Weekdays 84 841776417 934879644 0.1347 0.2027
Table 13. Average and standard deviation of area and shape index of full-time job users grouped based on weekdays.
Week (working part-time) No Users Avg area Std area Avg SI Std SI
Weekends 13 2290298195 2528344571 0.1122 0.0759
Weekdays 14 1091894605 1719317169 0.1273 0.1513
Table 14. Average and standard deviation of area and shape index of part-time job users grouped based on weekdays.
Week (not working) No Users Avg area Std area Avg SI Std SI
Weekends 7 536953830 529956734 0.1311 0.1244
Weekdays 7 383026570 358675271 0.1015 0.0847
Table 15. Average and standard deviation of area and shape index of not working users grouped based on weekdays.
Week (studying full time) No Users Avg area Std area Avg SI Std SI
Weekends 41 1007158761 1097836709 0.1083 0.1119
Weekdays 41 774265424 1103522258 0.1094 0.1189
Table 16. Average and standard deviation of area and shape index of full time studying users grouped based on weekdays.
Week (housewife) No Users Avg area Std area Avg SI Std SI
Weekends 5 573722326 477361844 0.0997 0.0087
Weekdays 5 122863208 156767262 0.098 0.1036
Table 17. Average and standard deviation of area and shape index of housewife users grouped based on weekdays.
The International Archives of the Photogrammetry, Remote Sensing and Spatial Information Sciences, Volume XLII-4/W18, 2019 GeoSpatial Conference 2019 – Joint Conferences of SMPR and GI Research, 12–14 October 2019, Karaj, Iran
This contribution has been peer-reviewed. https://doi.org/10.5194/isprs-archives-XLII-4-W18-583-2019 | © Authors 2019. CC BY 4.0 License.
587

Occupation Group Std (avg area) Std (avg SI)
working full time 579596785 0.0185
working part time 847399305 0.0107
not working 108843009 0.0209
studying full time 164680458 0.0008
housewife 318805539 0.0012
Table 18. Comparison the effect of days of week on users with different occupations.
4. CONCLUSION
This paper examines the effect of time (days of the week) on
movement characteristics of people and the extent to which it
has an impact on different groups of people with a particular
same demographic factor (gender, age, and working status). For
this, activity space and its determinants (area and shape index)
have been deployed to show the extent and the dispersion of
movement. The approach was applied on a set the MDC dataset.
It was concluded that people have further travels with a more
dispersed destination on weekends. Additionally, it has depicted
that time has the most effect on the movement behavior of men
particularly people aged 28-33 and the least effect on those aged
16-21 and people who are older than 50 years old. We believe
that the results of this study have the potential to contribute to
the betterment of urban planning, solving social issues and
mitigating traffic problems.
References
Brown, L. A. and E. G. J. G. A. S. B. Moore, Human
Geography (1970). "The intra-urban migration process: a
perspective." 52(1): 1-13.
Crane, R. J. J. o. t. A. p. a. (2007). "Is there a quiet revolution in
women's travel? Revisiting the gender gap in commuting."
73(3): 298-316.
Hagerstrand, T. J. R. S. A. (1970). "What about people in
spatial science." 24: 7-21.
Horton, F. E. and D. R. J. E. G. Reynolds (1971). "Effects of
urban spatial structure on individual behavior." 47(1): 36-48.
Isaacman, S., R. Becker, R. Cáceres, S. Kobourov, M.
Martonosi, J. Rowland and A. Varshavsky (2011). Ranges of
human mobility in Los Angeles and New York. 2011 IEEE
International Conference on Pervasive Computing and
Communications Workshops (PERCOM Workshops), IEEE.
Kiukkonen, N., J. Blom, O. Dousse, D. Gatica-Perez and J.
Laurila (2010). "Towards rich mobile phone datasets: Lausanne
data collection campaign." Proc. ICPS, Berlin 68.
Laurila, J. K., D. Gatica-Perez, I. Aad, O. Bornet, T.-M.-T. Do,
O. Dousse, J. Eberle and M. Miettinen (2012). The mobile data
challenge: Big data for mobile computing research.
Lee, N. C., C. Voss, A. D. Frazer, J. A. Hirsch, H. A. McKay
and M. Winters (2016). "Does activity space size influence
physical activity levels of adolescents?—A GPS study of an
urban environment." Preventive medicine reports 3: 75-78.
Luo, F., G. Cao, K. Mulligan and X. J. A. G. Li (2016).
"Explore spatiotemporal and demographic characteristics of
human mobility via Twitter: A case study of Chicago." 70: 11-
25.
Newsome, T. H., W. A. Walcott and P. D. J. T. Smith (1998).
"Urban activity spaces: Illustrations and application of a
conceptual model for integrating the time and space
dimensions." 25(4): 357-377.
Schönfelder, S. and K. W. J. T. p. Axhausen (2003). "Activity
spaces: measures of social exclusion?" 10(4): 273-286.
Shi, L., G. Chi, X. Liu and Y. J. A. o. G. Liu (2015). "Human
mobility patterns in different communities: a mobile phone
data-based social network approach." 21(1): 15-26.
Song, C., Z. Qu, N. Blumm and A.-L. J. S. Barabási (2010).
"Limits of predictability in human mobility." 327(5968): 1018-
1021.
Wang, Y., C. Kang, L. M. Bettencourt, Y. Liu and C. Andris
(2015). Linked activity spaces: Embedding social networks in
urban space. Computational approaches for urban
environments, Springer: 313-336.
Yamamoto, T. and R. J. T. Kitamura (1999). "An analysis of
time allocation to in-home and out-of-home discretionary
activities across working days and non-working days." 26(2):
231-250.
Yuan, Y. (2013). Characterizing human mobility from mobile
phone usage, University of California, Santa Barbara.
Yuan, Y., M. Raubal, Y. J. C. Liu, Environment and U. Systems
(2012). "Correlating mobile phone usage and travel behavior–A
case study of Harbin, China." 36(2): 118-130.
Yuan, Y. and M. J. I. J. o. G. I. S. Raubal (2016). "Analyzing
the distribution of human activity space from mobile phone
usage: an individual and urban-oriented study." 30(8): 1594-
1621.
The International Archives of the Photogrammetry, Remote Sensing and Spatial Information Sciences, Volume XLII-4/W18, 2019 GeoSpatial Conference 2019 – Joint Conferences of SMPR and GI Research, 12–14 October 2019, Karaj, Iran
This contribution has been peer-reviewed. https://doi.org/10.5194/isprs-archives-XLII-4-W18-583-2019 | © Authors 2019. CC BY 4.0 License.
588