Embed Size (px)
Citation preview

APPROVED: Victor R. Prybutok, Major Professor Mary C. Jones, Minor Professor and Chair of
the Department of Information Technology and Decision Sciences Nicolas Evangelopoulos, Committee Member Audhesh K. Paswan, Committee Member O. Finley Graves, Dean of the College of
Business Michael Monticino, Dean of the Robert B.
Toulouse School of Graduate Studies
INVESTIGATING THE RELATIONSHIP BETWEEN THE BUSINESS PERFORMANCE MANAGEMENT
FRAMEWORK AND THE MALCOLM BALDRIGE NATIONAL QUALITY AWARD FRAMEWORK
Muhammad Muazzem Hossain, B.B.A., M.S.
Dissertation Prepared for the Degree of
DOCTOR OF PHILOSOPHY
UNIVERSITY OF NORTH TEXAS
August 2009

Hossain, Muhammad Muazzem. Investigating the relationship between the business
performance management framework and the Malcolm Baldrige National Quality Award
framework
The business performance management (BPM) framework helps an organization
continuously adjust and successfully execute its strategies. BPM helps increase flexibility by
providing managers with an early alert about changes and, as a result, allows faster response to
such changes. The Malcolm Baldrige National Quality Award (MBNQA) framework provides a
basis for self-assessment and a systems perspective for managing an organization’s key
processes for achieving business results. The MBNQA framework is a more comprehensive
framework and encapsulates the underlying constructs in the BPM framework.
. Doctor of Philosophy (Management Science), August 2009, 149 pp., 24 tables, 15
figures, references, 60 titles.
The objectives of this dissertation are fourfold: (1) to validate the underlying
relationships presented in the 2008 MBNQA framework, (2) to explore the MBNQA framework
at the dimension level, and develop and test constructs measured at that level in a causal
model, (3) to validate and create a common general framework for the business performance
model by integrating the practitioner literature with basic theory including existing MBNQA
theory, and (4) to integrate the BPM framework and the MBNQA framework into a new
framework (BPM-MBNQA framework) that can guide organizations in their journey toward
achieving and sustaining competitive and strategic advantages.
The purpose of this study is to achieve these objectives by means of a combination of
methodologies including literature reviews, expert opinions, interviews, presentation
feedbacks, content analysis, and latent semantic analysis. An initial BPM framework was

developed based on the reviews of literature and expert opinions. There is a paucity of
academic research on business performance management. Therefore, this study reviewed the
practitioner literature on BPM and from the numerous organization-specific BPM models
developed a generic, conceptual BPM framework. With the intent of obtaining valuable
feedback, this initial BPM framework was presented to Baldrige Award recipients (BARs) and
selected academicians from across the United States who participated in the Fall Summit 2007
held at Caterpillar Financial Headquarter in Nashville, TN on October 1 and 2, 2007.
Incorporating the feedback from that group allowed refining and improving the proposed BPM
framework.
This study developed a variant of the traditional latent semantic analysis (LSA) called
causal latent semantic analysis (cLSA) that enables us to test causal models using textual data.
This method was used to validate the 2008 MBNQA framework based on article abstracts on
the Baldrige Award and program published in both practitioner and academic journals from
1987 to 2009. The cLSA was also used to validate the BPM framework using the full body text
data from all articles published in the practitioner journal entitled the Business Performance
Management Magazine since its inception in 2003. The results provide the first cLSA study of
these frameworks. This is also the first study to examine all the causal relationships within the
MBNQA and BPM frameworks.

ii
Copyright 2009
by
Muhammad Muazzem Hossain

ACKNOWLEDGMENTS
I would like to express my gratitude to my dissertation chair Dr. Victor Prybutok for his
advice, compassion, guidance, patience, and supervision from the very beginning of this
dissertation. Dr. Prybutok provided me unflinching encouragement, mentoring, and support in
various ways. I am indebted to him more than he knows.
I gratefully acknowledge Dr. Mary Jones, Dr. Nicolas Evangelopoulos, and Dr. Audhesh
Paswan for their insightful guidance, unconditional support and unlimited encouragement.
Many thanks to my fellow friends in the Ph.D. program who were there for me
whenever I needed them. Thanks to all my friends who helped me in many ways in completing
my Ph.D. program.
Lastly, to my parents, brothers, sisters, and my wife Mahfuja Islam, words cannot
express my gratitude for their unconditional love and support. Without their “you‐can‐do‐it”
encouragement, it would not have been possible for me to accomplish what I have today.
iii

TABLE OF CONTENTS
Page
ACKNOWLEDGMENTS ..................................................................................................................... iii
LIST OF TABLES ................................................................................................................................. v
LIST OF FIGURES ............................................................................................................................. vii
Chapters
1. INTRODUCTION ..................................................................................................................... 1
2. LITERATURE REVIEW ............................................................................................................. 8 The MBNQA Framework ..................................................................................................... 8 The BPM Framework ........................................................................................................ 19 Latent Semantic Analysis (LSA) ......................................................................................... 27 The BPM‐MBNQA Conceptual Framework ....................................................................... 31 Research Models and Propositions .................................................................................. 35
3. RESEARCH METHODOLOGY ................................................................................................ 83 Corpus 1: MBNQA Input‐Output (XY) Statements ............................................................ 84 Corpus 2: IJBPM Abstracts ................................................................................................ 87 Corpus 3: BPM Input‐Output (XY) Statements ................................................................. 87
4. ANALYSES and RESULTS ...................................................................................................... 89 cLSA of Corpus 1................................................................................................................ 89 LSA of Corpus 2 ............................................................................................................... 100 cLSA of Corpus 3.............................................................................................................. 106
5. DISCUSSION, IMPLICATIONS, and FUTURE DIRECTION .................................................... 119 Discussion........................................................................................................................ 119 Implications ..................................................................................................................... 123 Future Direction .............................................................................................................. 124
APPENDICES ................................................................................................................................ 126
REFERENCES ................................................................................................................................ 145
iv

LIST OF TABLES
Page
Table 1: Brief description of MBNQA categories .......................................................................... 12
Table 2: Brief description of MBNQA dimension level constructs ............................................... 13
Table 3: Major BPM consulting firms and their activities ............................................................. 22
Table 4: Brief description of the BPM framework constructs ...................................................... 26
Table 5: Correspondence of the BPM constructs to the MBNQA constructs .............................. 34
Table 6: Tabular view of results‐related propositions for MBNQA category level framework .... 52
Table 7: Tabular view of system’s propositions for MBNQA category level framework ............. 62
Table 8: Tabular view of the MBNQA dimension level propositions ............................................ 76
Table 9: List of journals with MBNQA‐related abstracts .............................................................. 86
Table 10: Summary of two factors of the causal MBNQA framework ......................................... 91
Table 11: Inter‐factor frequency measures .................................................................................. 92
Table 12: Inter‐factor percentage measures ................................................................................ 92
Table 13: Summary of seven factors of the causal MBNQA framework ...................................... 94
Table 14: Inter‐factor frequency measures for seven‐factor MBNQA framework ...................... 97
Table 15: Inter‐factor percentage measures for seven‐factor MBNQA framework .................... 98
Table 16: Summary of two semantic factors of BPM framework .............................................. 101
Table 17: Summary of ten semantic factors of BPM framework ............................................... 103
Table 18: Summary of two factors of the causal BPM framework ............................................. 108
Table 19: Inter‐factor frequency measures ................................................................................ 109
Table 20: Inter‐factor percentage measures .............................................................................. 109
v

Table 21: Summary of ten factors of the causal BPM framework .............................................. 111
Table 22: Inter‐factor frequency measures ................................................................................ 114
Table 23: Inter‐factor percentage measures .............................................................................. 115
Table 24: Significant percentage supports ................................................................................. 117
vi

vii
LIST OF FIGURES
Page
Figure 1: The 2008 MBNQA performance excellence framework ................................................ 15
Figure 2: MBNQA core values and concepts, criteria, and outcomes (NIST, 2008, p. 49) ........... 17
Figure 3: The proposed BPM framework ...................................................................................... 25
Figure 4: Schematic of term‐by‐document matrix X .................................................................... 28
Figure 5: The BPM‐MBNQA conceptual framework ..................................................................... 33
Figure 6: The 2008 MBNQA framework at the category level ..................................................... 36
Figure 7: The 2008 MBNQA framework at the dimension level ................................................... 62
Figure 8: The proposed BPM framework (repeated) ................................................................... 77
Figure 9: Causal semantic net for two‐factor MBNQA framework .............................................. 92
Figure 10: Causal semantic net for seven‐factor MBNQA framework ......................................... 99
Figure 11: Causal semantic net for two‐factor BPM framework ................................................ 109
Figure 12: Causal semantic net for ten‐factor BPM framework ................................................. 118
Figure 13: Empirical evidence of the MBNQA framework ......................................................... 120
Figure 14: The operational paths of BPM ................................................................................... 122
Figure 15: The strategic paths of BPM ....................................................................................... 123
CHAPTER 1
INTRODUCTION
The Malcolm Baldrige National Quality Award (MBNQA) framework provides a basis for
self‐assessment and a systems perspective for managing an organization’s key processes for
achieving business results. The business performance management (BPM) framework helps an
organization continuously adjust and successfully execute its strategies. BPM helps increase
flexibility by providing managers with a sense of uncertain changes earlier and allows faster
response to such changes. It thus helps organizations address market opportunities. The
simultaneous use of the Malcolm Baldrige National Quality Award (MBNQA) framework and the
business performance management (BPM) framework by an organization has the potential to
help organizations pursue excellence while simultaneously increasing their agility and
competitive advantage. Therefore, to facilitate the ability to use both frameworks
simultaneously for organizational advantage I examine the existing literature and from it glean
the common relationships among the frameworks and use these findings to posit an integrated
framework.
The Malcolm Baldrige National Quality Award criteria provide a comprehensive
framework for self‐assessment and embody a systematic approach to organizational quality
(Bemowski & Stratton, 1995; Evans 1997; Pannirselvam & Ferguson, 2001). The criteria are
grouped into seven categories that show the underlying relationships among and between
organizational performance and various quality management constructs (Pannirselvam &
Ferguson, 2001). These relationships are portrayed in the Malcolm Baldrige National Quality
Award (MBNQA) framework. The MBNQA criteria define practices in seven categories ‐ (1)
1

leadership, (2) strategic planning, (3) customer and market focus, (4) measurement, analysis,
and knowledge management, (5) workforce focus, (6) process management, and (7) results.
These seven categories are composed of a set of 18 performance‐oriented criteria items. Each
of these categories embodies two or more criteria items. For instance, the leadership category
is composed of two criteria items: senior leadership, and governance and social responsibilities.
The Baldrige criteria also shed light on asking questions that organizations can use to establish
vital linkages in their structure, operations, strategy, and results. For example, a key question
item regarding the customer and market knowledge criteria item is how organizations identify
customers, customer groups, and market segments. These question items provide practitioners
and academicians with invaluable insights for developing self testing instruments. However,
because of the use of the same term “items” to indicate criteria items and question items there
is the potential for the confusion in academic literature of these question items with the criteria
items. Therefore, I intend to make a distinction at the onset between the criteria items and the
question items by labeling the criteria items as the dimensions of the categories. Thus, the
Baldrige framework is a framework of seven interrelated constructs (categories) with each
construct having two or more dimensions with each dimension measured with multiple
question items.
The MBNQA framework was first created in 1987 for the purpose of improving
organizational competitiveness (Garvin, 1991; Gradig & Harris, 1994) and has evolved
continuously since its inception (National Institute of Standards and Technology [NIST], 1993;
Bemowski, 1996; NIST, 1997; NIST, 2000; NIST, 2007; NIST, 2008). The 2007 criteria bring
significant changes from the 2006 criteria in almost all categories and dimensions, and these
2

changes include adding seven terms to the Glossary of Key Terms (NIST, 2007, p. 8‐9). These
changes are reflected in the framework in terms of new and modified underlying relationships.
For example, the 2007 criteria assume that strategic planning has a stronger focus than in
previous frameworks on innovation, strategic advantages, and resource needs to achieve
strategic objectives. However, NIST (2008) posits:
In 2007, the Baldrige Criteria were significantly revised to encourage organizations to consider carefully their strategic advantages, core competencies, and opportunities for innovation and how these considerations drive key decisions on work systems (such as outsourcing, partnerships, and workforce decisions). In recognition of the challenges for organizations to address these opportunities, the decision was made to make no substantive revisions to the Criteria for 2008. (NIST, 2008, p. 27) The most significant changes in the 2008 booklet include the addition of the term
“Strategic Advantages” to the Glossary of Key Terms, and two new diagrams – one of which
illustrates the role of core values and concepts in underpinning the criteria, and the other
shows maturity levels in organizational learning (NIST, 2008). Therefore, the 2007 framework
and the 2008 framework can be used interchangeably. The relationships in the proposed
conceptually enhanced 2007/2008 framework are currently not validated in the academic
literature. Validating the 2007/2008 framework will support the framework’s current form as
well as provide managers with meaningful information that they can use in deciding where they
should focus their efforts in achieving performance excellence. Therefore, the first objective of
this study is to validate the underlying relationships presented in the 2007/2008 framework.
The MBNQA framework enjoys widespread acceptance at local, national, and
international levels (Kochan, 1992; Ettorre, 1996; Pannirselvam, Siferd, & Ruch, 1998). Various
studies have used, extended and tested this framework in several industries, such as health
3

care (Prybutok & Spink, 1999; Meyer & Collier, 2001), government organizations (Pannirselvam
et al., 1998; Pannirselvam & Ferguson, 2001), and higher education (Winn & Cameron, 1998).
However, these studies tested the framework at the category level. There is a paucity of
evidence testing the MBNQA framework at the dimension level. A dimension level analysis will
provide academicians and managers with better insight regarding how each item in a category
is related to specific items in other categories (Pannirselvam & Ferguson, 2001). That is,
dimension level analysis is necessary to better understand how various quality management
aspects affect each other and impact business performance (Evans, 1997). Therefore, the
second objective of this study is to explore the MBNQA framework at the dimension level, and
develop and test constructs measured at that level in a causal model.
The BPM framework embodies a closed‐loop. Cokins (2007) posits that business
performance management existed decades ago and that organizations were doing performance
management long before it was labeled such in 1990s by information technology research firms
and software vendors. There is little or no research in academia on business performance
management. Several practitioner BPM frameworks exist but these are industry specific and
vary from industry to industry (Eckerson, 2004; Cokins, 2007). However, all such frameworks
have common constructs – develop strategy; define, measure and manage performance against
strategic goal; continuously adjust and refine strategy; and optimize the strategic execution.
Therefore, the third objective of this work is to validate and create a common general
framework for the business performance management by integrating the practitioner literature
with basic theory including existing MBNQA theory.
4
The 2008 criteria place significant importance on competitive advantages, strategic
advantages, core competencies, and innovation. The Baldrige criteria ask thought‐provoking,
critical questions that emphasize an organizational infrastructure that is essential to maintain
and improve competitive advantage and bring about innovation. One impediment to achieving
improved organization effectiveness and competitiveness is the huge gap between strategy and
execution (Eckerson, 2004). Eckerson (2004) suggests that business performance management
(BPM) bridges the gap between strategy and execution. Eckerson also posits that BPM helps
organizations exploit market opportunities as they arise, and make organizations more
effective, and more competitive. Therefore, the final objective of this study is to integrate the
business performance management framework and the MBNQA framework into a new
framework (BPM‐MBNQA framework) that can guide organizations in their journey toward
achieving and sustaining competitive and strategic advantages.
In summary, the objectives are as follows:
1. Validate the underlying relationships presented in the 2008 MBNQA framework at the category level
2. Explore the MBNQA framework at the dimension level, and develop and test
constructs measured at that level in a causal model
3. Validate and create a common general framework for the business performance management by integrating the practitioner literature with basic theory including existing MBNQA theory
4. Integrate the BPM framework and the MBNQA framework into a new framework
(BPM‐MBNQA Framework) that can guide organizations in their journey toward achieving and sustaining competitive and strategic advantages
The purpose of this study is to achieve these objectives by means of a combination of
methodologies including literature reviews, expert opinions, interviews, presentation
5

feedbacks, content analysis, and latent semantic analysis. An initial BPM framework was
developed based on the reviews of literature and expert opinions. There is a paucity of
evidence of academic research in business performance management. Therefore, this study
reviewed the practitioner literature on BPM and developed a generic, conceptual BPM
framework. With the intent of obtaining valuable feedback, this initial BPM framework was
presented to Baldrige Award recipients (BARs) and selected academicians from across the
United States who participated in the Fall Summit 2007 held at Caterpillar Financial
Headquarter in Nashville, TN on October 1 and 2, 2007. Incorporating the feedback, a refined,
improved BPM framework has been proposed.
In line with the above‐mentioned research objectives, the study seeks to address the
following research questions:
1. Are the proposed relationships between the categories in the MBNQA 2008 framework supported?
2. How are the dimensions related within each category and between categories in the
MBNQA 2008 framework?
3. Is the proposed BPM framework supported by the extant literature?
4. Does BPM framework contribute to enhanced competitiveness and innovation? 5. How is the proposed BPM framework related to the 2008 MBNQA framework?
This study uses causal latent semantic analysis (cLSA) to validate the proposed BPM
framework and the 2008 MBNQA framework. The causal LSA (cLSA) is a modification and thus a
derivative of the traditional latent semantic analysis. In addition to uncovering the latent
factors, the cLSA establishes causal relationships among these factors based on the input and
output statements contained in the factors (see Appendix B for detail). To validate the BPM
6

framework, I performed cLSA on a BPM corpus developed based on the full body text data from
all articles published in the practitioner BPM journal entitled the Business Performance
Management Magazine since its inception in 2003. In addition, the traditional latent semantic
analysis (LSA) was used to uncover the latent semantics of the BPM framework from the article
abstracts published in the International Journal of Business Performance Management. To
validate the MBNQA framework, I performed cLSA on an MBNQA corpus obtained from the
article abstracts on the Baldrige Award and program published in practitioner and academic
journals from 1987 to 2009.
The remaining of the study is organized as follows. Chapter 2 provides a review of the
literature on the MBNQA, BPM and latent semantic analysis. Chapter 2 also delineates the
research models and generates propositions for testing the research objectives. Chapter 3
articulates the research methods, construct measurement, sample design, scale development,
and data collection so as to answer the research questions presented in Chapter 1. Chapter 4
provides the data analysis and results. Finally, Chapter 5 discusses the limitations, contributions
and implications of the study.
7

CHAPTER 2
LITERATURE REVIEW
This chapter provides a review of the literature on the Malcolm Baldrige National
Quality Award (MBNQA) framework, the business performance management (BPM) framework
and latent semantic analysis (LSA). There are five sections in this chapter. The first section
presents a review of the literature on the MBNQA framework. The second section provides a
review of the practitioner literature on BPM. A conceptual BPM framework is proposed based
on the review of the practitioner literature. The third section discusses latent semantic analysis.
Section four discusses how the BPM and the MBNQA framework can be integrated; and it
presents the integrated BPM‐MBNQA conceptual framework. Finally, research propositions are
detailed in section five.
The MBNQA Framework
The Malcolm Baldrige National Quality Award (MBNQA) is considered the highest honor
for business excellence in America (TYBEA, 2001). The United States Department of Commerce
established the Baldrige Award and the Baldrige National Quality Program in 1987 to jumpstart
a small, slowly growing quality movement (TYBEA, 2001). The Baldrige Award and program
plays a critical role in strengthening competitiveness (Bell & Keys, 1998) with the intent of
achieving three specific goals – to promote quality awareness, to recognize quality achievement
of U.S. companies, and to publicize successful strategies (Bemowski & Stratton, 1995; TYBEA,
2001; NIST, 2007). The National Institute of Standards and Technology (NIST) of the US
Commerce Department designs and manages the Baldrige Award and program. Congress
selected NIST to administer the Baldrige Award because of “its long‐standing role in helping
8

U.S. companies compete, its world‐renowned expertise in quality control and assurance, and its
reputation as an impartial third party” (TYBEA, 2001, p. 5).
The first Baldrige Awards were presented in 1988 to three companies. The United States
president presents the awards to the recipients. From 1988 to 1998, the awards were given to
each of three sectors – manufacturing, service, and small business. With the October 1998
passage of legislation, NIST established Baldrige Awards for education organizations and
healthcare providers; and the first applications for awards were accepted in 1999 (TYBEA,
2001). NIST was authorized to expand the Baldrige Award program to non‐profit organizations
by the October 2004 legislation signed into law by President Bush. The first applications for
awards in the non‐profit organizations sector were accepted in 2007 (NIST, 2007).
Now NIST designs and manages the Baldrige Award and program for manufacturing,
service, small business, education, healthcare, and non‐profit organizations. Three frameworks
are provided by NIST to administer awards in these categories. The first framework embodies
criteria for business and non‐profit organizations and is used for manufacturing, small business,
service and non‐profit categories. The second and third frameworks provide criteria for
education organizations and healthcare providers, respectively. NIST provides three
frameworks to capture the peculiarity that exists across industries. However, the bottom‐line
purposes and underpinnings of all frameworks are the same. Minor differences in frameworks
exist in the name of the dimensions of the frameworks and are needed to reflect the esoteric
characteristics of each industry. For instance, the term customer is better suited to businesses
and non‐profit organizations. The term patient is more appropriate in the healthcare industry.
The differences in frameworks are reflected as follows: (1) the category Customer and Market
9

Focus in the business and non‐profit criteria is replaced with Focus on Patients, Other
Customers, and Market in healthcare criteria, and with Student, Stakeholder, and Market Focus
in education criteria, and (2) the dimensions in the Results category have been named in the
frameworks to reflect the distinctive outcomes of each industry.
The underlying causal relationships and the design structure of the frameworks remain
unchanged across industries. Therefore, the terms “Malcolm Baldrige National Quality Award
framework,” “MBNQA performance excellence framework,” “MBNQA model,” “Baldrige
framework,” and “Baldrige model” are used to embody the causal relationships and the
skeleton of all frameworks. Because the relationships and the skeleton of the frameworks are
the same, the business and non‐profit framework is used hereon as a representation of the
Baldrige model, the MBNQA model or the MBNQA framework. In line with one of the objectives
of this research, the 2008 Baldrige criteria are referred to the theoretical MBNQA framework.
The bottom‐line philosophy of the Baldrige framework is to provide a systems
perspective for managing organizations and their key activities and processes to obtain results.
The MBNQA framework defines seven criteria categories that are designed to endow
organizations with an integrated approach to performance excellence. These criteria categories
are (1) leadership, (2) strategic planning, (3) customer and market focus, (4) measurement,
analysis, and knowledge management, (5) workforce focus, (6) process management, and (7)
results. The Baldrige scoring system encompasses these seven criteria categories and divides
them into two evaluation dimensions: (1) process and (2) results. “Process” refers to the
methods that organizations use to address the requirements in Categories 1 – 6, while “Results”
refers to organizations’ outputs and outcomes in achieving the requirements in Category 7
10
(NIST, 2008). The two evaluation dimensions are central to the Baldrige Award applicant
evaluation and feedback. A critical factor in evaluation and feedback is the importance of an
organization’s reported process and results to its key business factors. NIST suggests that
organizations identify the areas of their greatest importance and report them in their
organizational profile. NIST posits that organizational profile is the most important starting
point for self‐assessment and for writing an application. In addition, organizational profile helps
organizations identify potential gaps in key information and focus on key performance
requirements and results. It sets the context such as operating environment, key working
relationships, and strategic challenges and advantages for the way an organization operates.
Therefore, organizational profile serves as an overarching guide for an organization’s
performance management system. However, organizational profile is not considered a criteria
category and does not contribute toward the scoring system. This study investigates the
underlying relationships among the seven criteria categories and thus considers the discussion
of organizational profile for further research. A brief description of the criteria categories is
given in Table 1. Table 2 provides a brief description of the MBNQA constructs at the dimension
level.
11

Table 1: Brief description of MBNQA categories Constructs Description 1. Leadership Examines how organization’s senior leaders guide and sustain their
organization, how organizations view their governance system, and how organizations fulfill their ethical, legal, and community responsibilities (NIST, 2008).
2. Strategic planning
Examines how organizations determine their short and long term goals, and how organizations make plans to enhance relationships with customers, suppliers, and partners (NIST, 2008; Prybutok, Zhang, & Ryan, 2008).
3. Customer and market focus
Describes how organizations determine product and service expectations, identify customer groups and market segments, and measure customer satisfaction levels to ensure the continuing relevance of product and service and to develop new business opportunities (NIST, 2008; Prybutok et al., 2008).
4. Knowledge management
Examines organization’s selection, gathering, analysis, management, and improvement of data, information, knowledge, and information technology. Also examines how organizations use review to improve their performance (NIST, 2008).
5. Workforce focus
Examines organization’s ability to engage, manage, develop, and assess its workforce in alignment with its overall mission, strategy, and action plans (NIST, 2008).
6. Process management
Examines how organizations determine their core competencies and work systems, and how they design, manage and improve their key processes to implement those work systems (NIST, 2008).
7. Results Examines organization’s performance and improvement in all key areas including product and service outcomes, customer‐focused outcomes, financial and market outcomes, workforce‐focused outcomes, process effectiveness outcomes, and leadership outcomes (NIST, 2008).
12

Table 2: Brief description of MBNQA dimension level constructs Constructs Description 1.1 Senior leadership
The roles and responsibilities of senior leaders in setting and communicating the organization’s vision, values and practices to create a sustainable organization (NIST, 2008).
1.2 Governance and social responsibilities
A responsible, informed, and accountable advisory body to protect shareholders’ interests, and to fulfill social responsibilities in legal, ethical, and good citizenship manner (NIST, 2008).
2.1 Strategy development
The formulation of strategy and strategic objectives by weighing strategic challenges and advantages (i.e., strengths, weaknesses, opportunities, and threats) (NIST, 2008).
2.2 Strategy deployment
The conversion of strategic objectives into action plan while optimizing the utilization of available resources (NIST, 2008).
3.1 Customer and market knowledge
The process to understand the needs and expectations of current and future customers and markets (i.e., the process to understand the voice of the customer and market) (NIST, 2008).
3.2 Customer relationships and satisfaction
The process to establish customer relationships, and to ascertain customer satisfaction and dissatisfaction in order to retain the current customers, and acquire new customers and new markets (NIST, 2008).
4.1 Performance analysis, review and improvement
Effective selection and use of financial and non‐financial data and information to analyze, review, and improve organizational performance with a view toward achieving strategic objectives and to prepare for unexpected organizational or external changes (NIST, 2008).
4.2 Data and knowledge management
The development and management of knowledge assets (e.g., all sorts of data, information, software and hardware) to improve organization efficiency and effectiveness (NIST, 2008).
5.1 Workforce engagement
The mechanism that engages, develops, and assesses an organization’s workforce to foster high employee performance and to enable and encourage employees to contribute to the achievement of strategic objectives and organizational sustainability (NIST, 2008).
Continued
13

Table 2: Continued Constructs Description 5.2 Workforce environment
An effective and supportive workforce environment that encompasses standards for workforce safety, health care services, career counseling and development, recreational and cultural activities, benefits packages, formal and informal recognition, nonwork‐related education, etc. (NIST, 2008).
6.1 Work systems design
Identification of core competencies, work systems, and key work processes that are critical for creation of customer value, preparation for potential emergencies, and achievement of organizational success and sustainability. Key work processes include processes for innovation, research and development, technology acquisition, supply chain management, outsourcing, mergers and acquisition, global expansion, project management, sales and marketing, etc. (NIST, 2008).
6.2 Work process management and improvement
The implementation, management and improvement of key work processes that are critical for creation of customer value, and achievement of organizational success and sustainability (NIST, 2008).
7.1 Product and service outcomes
Measures of products and service performance such as internal quality measurements, field performance of products, defect levels, service errors, response time, etc. (NIST, 2008).
7.2 Customer‐focused outcomes
Measures of customer‐related performance such as customer satisfaction and dissatisfaction; retention, gains, and losses of customers; customer complaints, complaint management, effective complaint resolution, and warranty claims; customer‐perceived value based on quality and price; customer assessment of access and ease of use; awards, ratings and recognition from customers and independent rating agencies (NIST, 2008).
7.3 Financial and market outcomes
Measures of financial and market performance such as revenues, profits or losses, budgets, cash position, net assets, debt leverage, earnings per share, financial operations efficiency, financial returns, business growth, donations and grants received, percentage of revenues derived from new products, programs or services, etc. (NIST, 2008).
7.4 Workforce‐focused outcomes
Measures of workforce‐related performance such as increased workforce retention, leader development, workforce training, workforce safety, employee absenteeism, employee turnover, employee satisfaction, employee complaints, etc. (NIST, 2008).
Continued
14

Table 2: Continued Constructs Description 7.5 Process effectiveness outcomes
Measures of organizational and operational performance including measure and indicators of process effectiveness and efficiency (e.g., cost savings, higher productivity, reduced emission levels, etc.), internal responsiveness indicators (e.g., cycle times, production flexibility, lead times, setup times, etc.), improved performance of administrative and other support functions, business‐specific indicators (e.g., innovation rates, Six Sigma initiative results, etc.), and supply chain indicators (e.g., reduction in supply chain management costs, reductions in inventory and incoming inspections, improvements in electronic data exchange, etc.) (NIST, 2008).
7.6 Leadership outcomes
Measures of performance in the areas of leadership and governance, achievement of strategic objectives, and societal responsibilities such as environmental, legal and regulatory compliance; results of oversight audits by government or other agencies; indicators of support for key communities and other public purposes; etc. (NIST, 2008).
The MBNQA framework connects and integrates the criteria categories to form the
performance excellence framework. Figure 1 illustrates the MBNQA performance excellence
framework for 2008 criteria.
Figure 1: The 2008 MBNQA performance excellence framework
There are three integral parts in the MBNQA performance excellence framework: (1) the
leadership triad, (2) the results triad, and (3) measurement, analysis, and knowledge
15

management. The leadership triad comprises the leadership (Category 1), strategic planning
(Category 2), and customer and market focus (Category 3). The leadership, strategic planning,
and customer and market focus dimensions are placed together in the leadership triad to
recognize their collective importance (Prybutok et al., 2008). The leadership triad emphasizes
the importance of a leadership focus on strategy and customers, and implies that senior leaders
must set organization’s direction and develop new business opportunities. The results triad
consists of workforce focus (Category 5), process management (Category 6), and results
(Category 7). The focus of the results triad is on the employees and key processes of the
organization critical to implement the work system that yields results. Measurement, analysis,
and knowledge management (Category 4) provides the foundation for analyzing the
performance management system that is critical for improving performance, competitiveness,
and strategic advantage (NIST 2008).
The foundation of the MBNQA framework is that “the Criteria build on the Core Values
and Concepts which are embedded in systematic processes yielding performance results” (NIST,
2008, p. 49). Figure 2 portrays the general idea behind the 2008 MBNQA framework. This
diagram shows the relationship between (1) the criteria’s core values and concepts and the
criteria items and (2) the criteria process categories and the criteria results. NIST (2008) posits
that there are many possible specific relationships between the core values or concepts, the
criteria process categories, and the criteria results. NIST (2008) also posits that “the Core Values
or Concepts are shown in close proximity to the specific Criteria Process Categories with the
most direct relationship”, and that “each Criteria Results Item is shown in close proximity to the
Process Category to which it is most closely tied” (NIST, 2008, p. 27). For instance, process
16

effectiveness results item has the most direct relationship with the process management
category, and is thus in close proximity to it. Process effectiveness outcomes also provide key
information for analysis, review and improvement of organizational performance, and serve as
the operational basis for product and service outcomes, customer‐focused outcomes, and
financial and market outcomes (NIST, 2008).
Figure 2: MBNQA core values and concepts, criteria, and outcomes (NIST, 2008, p. 49)
The MBNQA framework is one of the most influential frameworks for measuring
organizational performance (Evans & Jack, 2003). It enjoys widespread acceptance at local,
national, and international levels (Kochan, 1992; Ettorre, 1996; Pannirselvam et al., 1998; Dow,
Samson, & Ford, 1999; Samson & Terziovski, 1999). For instance, Pannirselvam et al. (1998)
mirrored the Baldrige criteria in Arizona Governor’s Quality Award (AGQA) model. Dow et al.
17

(1999), and Samson and Terziovski (1999) used the Baldrige framework to study the quality of
manufacturing firms in Australia and New Zealand. Various studies have used, extended and
tested this framework in several industries including manufacturing (Handfield & Ghosh, 1995;
Dow et al., 1999; Samson & Terziovski, 1999; Wilson & Collier, 2000; Flynn & Saladin, 2001;
Prajogo, 2005), service (Prajogo, 2005), health care (Prybutok & Spink, 1999; Meyer & Collier,
2001), government (Pannirselvam et al., 1998; Pannirselvam & Ferguson, 2001; Prybutok et al.,
2008), and higher education (Winn & Cameron, 1998).
Numerous studies have investigated the linkages implied in the Malcolm Baldrige
National Quality Award framework. Most of these studies used the MBNQA frameworks
released prior to 2000 (Prybutok et al., 2008). There are two salient features of these studies.
First, the MBNQA frameworks (different versions of the MBNQA framework) were tested at the
category level only. Second, the MBNQA frameworks specified direction of cause from one
direction by using unidirectional arrows based on the general proposition that leadership drives
the system that creates results (e.g., Dow et al., 1999; Prybutok & Spink, 1999; Samson &
Terziovski, 1999; Wilson & Collier, 2000; Meyer & Collier, 2001). Therefore, they were
represented as recursive models (Byrne, 1998). For instance, Wilson and Collier (2000) tested
the relationships in 1995 MBNQA framework and portrayed the relationships in a recursive
causal model. They posited that the Baldrige quality experts did not follow their general theory
in defining the specific performance relationships between the criteria categories. Wilson and
Collier also argued that the Baldrige quality experts defaulted to the premise that everything is
related to everything else because they had no idea how these specific performance
relationships and directions of causation should be defined.
18

The Baldrige framework has undergone significant changes since 1995 and since its
inception in 1987. The 2008 Baldrige criteria represent the most recent and highly enhanced
framework. Significant changes are reflected in the criteria categories, the underlying
relationships, and the Glossary of Key Terms, among others. For example, while the 1995
Baldrige system consisted of four criteria categories – process management, human resource
development and management, strategic planning, and information and analysis, the 2008
Baldrige system (Figure 2) consists of six criteria categories – (1) leadership, (2) strategic
planning, (3) customer and market focus, (4) measurement, analysis, and knowledge
management, (5) workforce focus, and (6) process management.
Like the 1995 and other Baldrige frameworks, the 2008 Baldrige framework has used
two‐headed arrows among the Baldrige system criteria categories (Categories 1 – 6) (Figure 1).
This is in line with NIST’s underlying proposition that the Baldrige system categories are
reciprocally related – both directly and indirectly. Therefore, the Baldrige system represents a
non‐recursive causal model (Byrne, 1998). However, the 2008 Baldrige system is connected to
performance results (Category 7) with one‐directional arrows pointing to the latter. This implies
that the Baldrige quality experts did not default to the premise that everything is related to
everything else but rather posited the relationships as such. This also implies that there is a
recursive causal relationship between the Baldrige system and the performance results.
The BPM Framework
The acronym BPM in this study stands for business performance management, not to be
confused with the term business process management. Synonymous with the concept of BPM
are the concepts of corporate performance management (CPM) and enterprise performance
19

management (EPM). These concepts provide a systems perspective for optimizing the
execution of business strategy (Ballard, White, McDonald, Myllymaki, McDowell, Goerlich, &
Neroda, 2005; Clark, Jones, & Amstrong, 2007). The concept of BPM was introduced to business
in the 1990s by information technology research firms and software vendors (Cokins, 2007;
Pritchard, 2008). BPM is misunderstood by many companies as being a new category to
describe multiple applications including planning, budgeting, financial consolidation and
reporting, forecasting and scenario modeling, scorecarding or dashboards, business
intelligence, and key performance indicators (KPIs) reports. Eckerson (2004) argues that BPM is
a common strategic and technical framework that pulls these applications together in a
cohesive and concerted manner with a view to drive the whole organization toward
achievement of strategic goals and objectives. Therefore, BPM is a much broader and bigger
concept than planning, budgeting, forecasting, reporting, scorecarding, or business intelligence.
These latter concepts are all tools underlying the business performance management concept.
BPM defines and refines strategies, and manages them in order to enhance
performance. It bridges the gap between strategy and execution by means of improved
communication, collaboration, control, and coordination (Eckerson, 2004; Ballard et al., 2005).
Business performance management enables organizations to enhance the capabilities of
business intelligence systems for better monitoring, measurement, and management of
business performance (Clark et al., 2007). Eckerson posits that BPM improves (1)
communication of strategy and expectations to all levels of the organization through planning
models and performance metrics that are tied to strategic goals and objectives, (2)
collaboration across organization through two‐way exchange of ideas and information, (3)
20
control to continuously adjust plans and improve operations through dissemination of up‐to‐
date information about market conditions and operational processes, and (4) coordination
among business units and functional groups. He also suggests that BPM helps organizations
better exploit opportunities as well as detect and rectify operational problems before they
grow out of control.
Practitioners at various consulting firms such as Gartner, IBM and KPMG have used
some variants of the concept of business performance management since the late nineteenth
century (Business Performance Management Magazine [BPMM], 2005). For instance, the
concept of corporate performance management, a variant of business performance
management, was introduced into corporate world in 2001 by Gartner Research. However,
there is little or no research in academia on business performance management. One of the
objectives of this work is to examine the various practitioner versions of the business
performance management model and develop a generic BPM framework that can provide both
academicians and practitioners alike with a common frame of reference. In this vein, we
attempted to critically analyze each practitioner model and synthesize them based on their
common, shared foundations. Table 3 provides a brief account of major BPM consulting firms
and their BPM‐related activities.
21

Table 3: Major BPM consulting firms and their activities BPM Consulting Firm Brief Description Aster Group Incepted in 2001. Specializes in implementing OutlookSoft BPM
software. OutlookSoft BPM software uses a single, unified web‐based application that enables companies to plan, understand and leverage their performance. It unifies strategic planning, budgeting, forecasting, consolidation, reporting, analysis, and scorecarding (BPMM, 2005; Astergroup.com).
BearingPoint Inc. More than 100 years old. Focuses on business consulting, systems integration, and managed services. Serves Global 2000 and midsize companies, government agencies, and other organizations in the U.S. and around the world. Major services include customer relationship management, enterprise resource planning, key performance indicator (KPI) development, information management, performance management, enterprise strategy development and transformation, and information technology (IT) strategy development and transformation, among others (BPMM, 2005).
BPM Partners Inc. Established in 2002, BPM Partners Inc. is a vendor‐neutral firm that advises its member partners on requirements definition, KPI development, IT assessment, vendor selection, and deployment (BPMM, 2005).
Breakaway Technologies Inc.
Founded in 1996, the Breakaway Technologies Inc. specializes in the development of the business performance management (BPM) and the business intelligence (BI) applications. These BPM and BI applications focus on how enterprises work and how they use information. Major applications include financial and sales reporting, EIS, consolidation systems, balanced scorecard, product costing, budgeting and forecasting systems, production planning, unit level forecasting, and customer product profitability systems (BPMM, 2005).
Cohn Consulting Group
Cohn Consulting Group was established in 1968 and provides strategic, financial, performance and organizational advisory services to private and public companies across a variety of industries (BPMM, 2005).
Creeth, Richman & Associates Inc.
Established in 1985, this firm specializes in developing financial analytics systems using online analytical processing (OLAP), relational database, and Microsoft technologies for midsize to large corporations (BPMM, 2005).
Deloitte Deloitte, founded in 1996, is a multidisciplinary global consulting firm. However, its specialty is on the implementation of integrated performance management (BPMM, 2005).
Continued
22
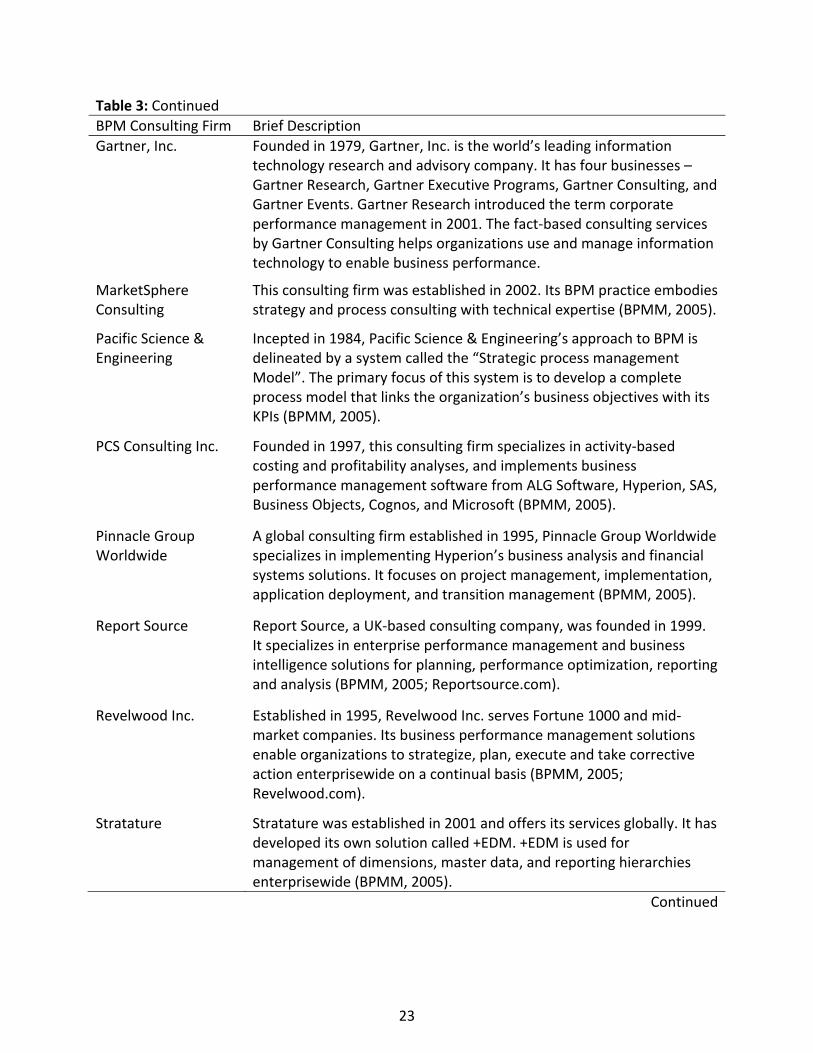
Table 3: Continued BPM Consulting Firm Brief Description Gartner, Inc. Founded in 1979, Gartner, Inc. is the world’s leading information
technology research and advisory company. It has four businesses – Gartner Research, Gartner Executive Programs, Gartner Consulting, and Gartner Events. Gartner Research introduced the term corporate performance management in 2001. The fact‐based consulting services by Gartner Consulting helps organizations use and manage information technology to enable business performance.
MarketSphere Consulting
This consulting firm was established in 2002. Its BPM practice embodies strategy and process consulting with technical expertise (BPMM, 2005).
Pacific Science & Engineering
Incepted in 1984, Pacific Science & Engineering’s approach to BPM is delineated by a system called the “Strategic process management Model”. The primary focus of this system is to develop a complete process model that links the organization’s business objectives with its KPIs (BPMM, 2005).
PCS Consulting Inc. Founded in 1997, this consulting firm specializes in activity‐based costing and profitability analyses, and implements business performance management software from ALG Software, Hyperion, SAS, Business Objects, Cognos, and Microsoft (BPMM, 2005).
Pinnacle Group Worldwide
A global consulting firm established in 1995, Pinnacle Group Worldwide specializes in implementing Hyperion’s business analysis and financial systems solutions. It focuses on project management, implementation, application deployment, and transition management (BPMM, 2005).
Report Source Report Source, a UK‐based consulting company, was founded in 1999. It specializes in enterprise performance management and business intelligence solutions for planning, performance optimization, reporting and analysis (BPMM, 2005; Reportsource.com).
Revelwood Inc. Established in 1995, Revelwood Inc. serves Fortune 1000 and mid‐market companies. Its business performance management solutions enable organizations to strategize, plan, execute and take corrective action enterprisewide on a continual basis (BPMM, 2005; Revelwood.com).
Stratature Stratature was established in 2001 and offers its services globally. It has developed its own solution called +EDM. +EDM is used for management of dimensions, master data, and reporting hierarchies enterprisewide (BPMM, 2005).
Continued
23
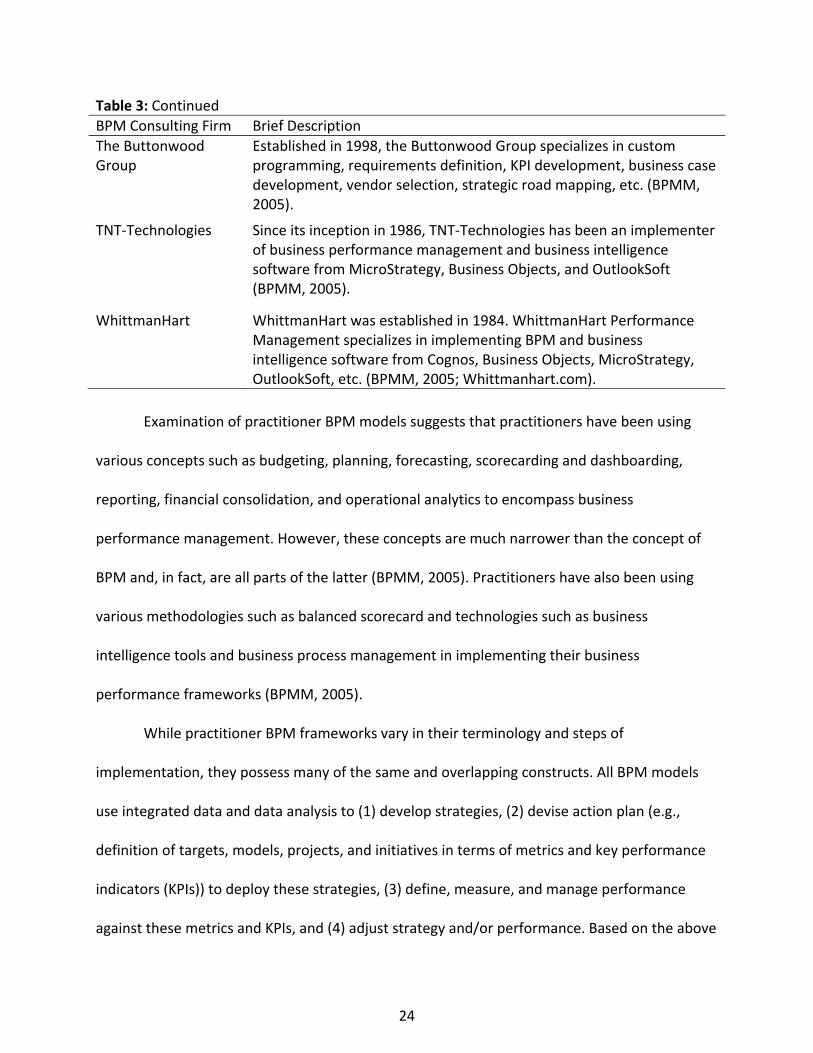
Table 3: Continued BPM Consulting Firm Brief Description The Buttonwood Group
Established in 1998, the Buttonwood Group specializes in custom programming, requirements definition, KPI development, business case development, vendor selection, strategic road mapping, etc. (BPMM, 2005).
TNT‐Technologies Since its inception in 1986, TNT‐Technologies has been an implementer of business performance management and business intelligence software from MicroStrategy, Business Objects, and OutlookSoft (BPMM, 2005).
WhittmanHart WhittmanHart was established in 1984. WhittmanHart Performance Management specializes in implementing BPM and business intelligence software from Cognos, Business Objects, MicroStrategy, OutlookSoft, etc. (BPMM, 2005; Whittmanhart.com).
Examination of practitioner BPM models suggests that practitioners have been using
various concepts such as budgeting, planning, forecasting, scorecarding and dashboarding,
reporting, financial consolidation, and operational analytics to encompass business
performance management. However, these concepts are much narrower than the concept of
BPM and, in fact, are all parts of the latter (BPMM, 2005). Practitioners have also been using
various methodologies such as balanced scorecard and technologies such as business
intelligence tools and business process management in implementing their business
performance frameworks (BPMM, 2005).
While practitioner BPM frameworks vary in their terminology and steps of
implementation, they possess many of the same and overlapping constructs. All BPM models
use integrated data and data analysis to (1) develop strategies, (2) devise action plan (e.g.,
definition of targets, models, projects, and initiatives in terms of metrics and key performance
indicators (KPIs)) to deploy these strategies, (3) define, measure, and manage performance
against these metrics and KPIs, and (4) adjust strategy and/or performance. Based on the above
24

review, a BPM framework was proposed and presented to the 2007 Monfort Summit. The 2007
Monfort Summit was a gathering of Baldrige Award recipients (BARs) and a small group of
selected researchers from across the United States. The summit had a total of 25 participants.
Twenty of those were from Baldrige Award winning organizations and 5 were academicians
from different universities. The BPM framework was then revised based on the feedback
provided by the 2007 Monfort Summit participants. Figure 3 illustrates the BPM framework,
and Table 4 presents a brief description of the BPM framework constructs.
Figure 3: The proposed BPM framework
25
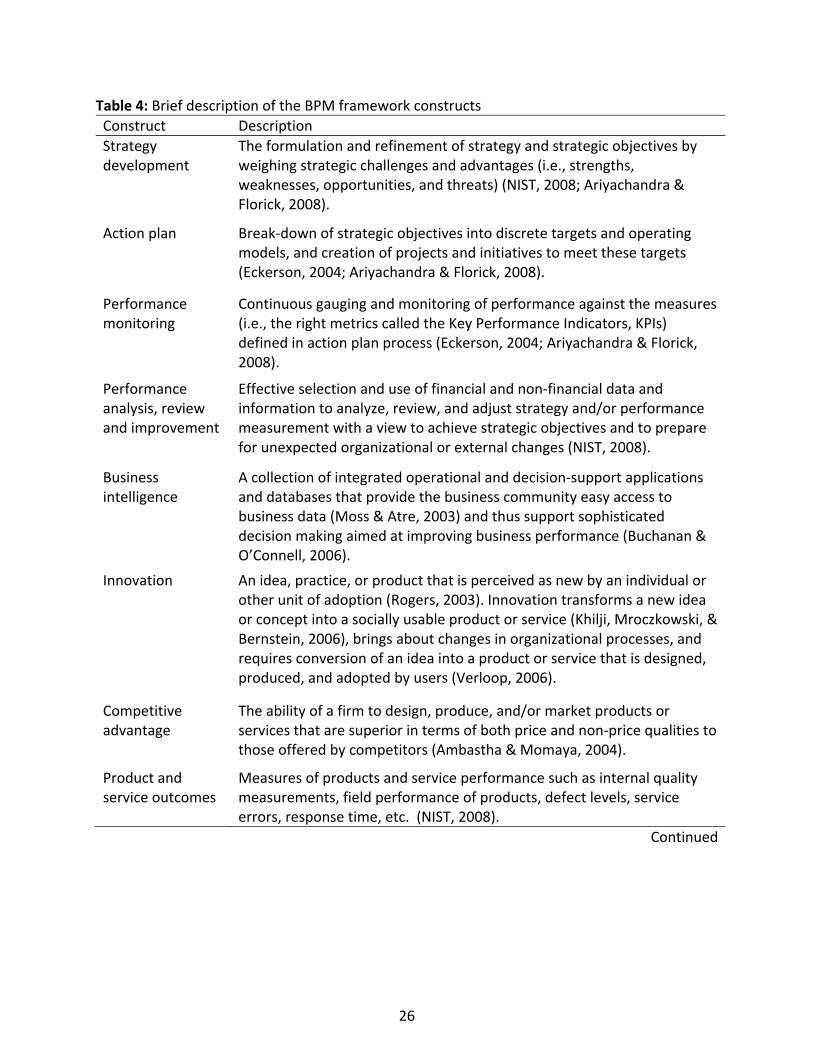
Table 4: Brief description of the BPM framework constructs Construct Description Strategy development
The formulation and refinement of strategy and strategic objectives by weighing strategic challenges and advantages (i.e., strengths, weaknesses, opportunities, and threats) (NIST, 2008; Ariyachandra & Florick, 2008).
Action plan Break‐down of strategic objectives into discrete targets and operating models, and creation of projects and initiatives to meet these targets (Eckerson, 2004; Ariyachandra & Florick, 2008).
Performance monitoring
Continuous gauging and monitoring of performance against the measures (i.e., the right metrics called the Key Performance Indicators, KPIs) defined in action plan process (Eckerson, 2004; Ariyachandra & Florick, 2008).
Performance analysis, review and improvement
Effective selection and use of financial and non‐financial data and information to analyze, review, and adjust strategy and/or performance measurement with a view to achieve strategic objectives and to prepare for unexpected organizational or external changes (NIST, 2008).
Business intelligence
A collection of integrated operational and decision‐support applications and databases that provide the business community easy access to business data (Moss & Atre, 2003) and thus support sophisticated decision making aimed at improving business performance (Buchanan & O’Connell, 2006).
Innovation An idea, practice, or product that is perceived as new by an individual or other unit of adoption (Rogers, 2003). Innovation transforms a new idea or concept into a socially usable product or service (Khilji, Mroczkowski, & Bernstein, 2006), brings about changes in organizational processes, and requires conversion of an idea into a product or service that is designed, produced, and adopted by users (Verloop, 2006).
Competitive advantage
The ability of a firm to design, produce, and/or market products or services that are superior in terms of both price and non‐price qualities to those offered by competitors (Ambastha & Momaya, 2004).
Product and service outcomes
Measures of products and service performance such as internal quality measurements, field performance of products, defect levels, service errors, response time, etc. (NIST, 2008).
Continued
26

Table 4: Continued Construct Description Customer‐focused outcomes
Measures of customer‐related performance such as customer satisfaction and dissatisfaction; retention, gains, and losses of customers; customer complaints, complaint management, effective complaint resolution, and warranty claims; customer‐perceived value based on quality and price; customer assessment of access and ease of use; awards, ratings and recognition from customers and independent rating agencies (NIST, 2008).
Financial and market outcomes
Measures of financial and market performance such as revenues, profits or losses, budgets, cash position, net assets, debt leverage, earnings per share, financial operations efficiency, financial returns, business growth, donations and grants received, percentage of revenues derived from new products, programs or services, etc. (NIST, 2008).
Workforce‐focused outcomes
Measures of workforce‐related performance such as increased workforce retention, leader development, workforce training, workforce safety, employee absenteeism, employee turnover, employee satisfaction, employee complaints, etc. (NIST, 2008).
Process effectiveness outcomes
Measures of organizational and operational performance including measure and indicators of process effectiveness and efficiency (e.g., cost savings, higher productivity, reduced emission levels, etc.), internal responsiveness indicators (e.g., cycle times, production flexibility, lead times, setup times, etc.), improved performance of administrative and other support functions, business‐specific indicators (e.g., innovation rates, six sigma initiative results, etc.), and supply chain indicators (e.g., reduction in supply chain management costs, reductions in inventory and incoming inspections, improvements in electronic data exchange, etc.) (NIST, 2008).
Leadership outcomes
Measures of performance in the areas of leadership and governance, achievement of strategic objectives, and societal responsibilities such as environmental, legal and regulatory compliance; results of oversight audits by government or other agencies; indicators of support for key communities and other public purposes; etc. (NIST, 2008).
Latent Semantic Analysis (LSA)
LSA is both a theory and a method that extracts the contextual‐usage meaning of words
and obtains approximate estimates of meaning similarities among words and text segments in a
large corpus (Landauer, Foltz, & Laham, 1998). It uses mathematical and statistical techniques
27

to derive the latent semantic structure within a text corpus (Berry, 1992; Deerwester, Dumais,
Furnas, Landauer, & Harshman, 1990). The text corpus comprises of documents that include
text passages, essays, research paper abstracts, or other contexts such as customer comments,
interview transcripts, etc. The major steps involved in LSA are given below.
First, the text corpus is represented as a term‐by‐document matrix X, in which the rows
and the columns stand for unique words and unique documents, respectively. Each cell of
matrix X contains the frequency of the word denoted by its row in the document denoted by its
column. Figure 4 shows the schematic of matrix X.
Figure 4: Schematic of term‐by‐document matrix X
Second, cell frequencies are transformed (weighted) by using some function. Various
transformation schemes can be used in weighting the cell frequencies. For instance, the log‐
entropy transformation method converts each cell frequency (+1) to its log, computes the
entropy of each word ( ) over all entries in its row, and then divides each cell entry by
the row entropy value. The columns of the transformed matrix are usually normalized so the
final X matrix is represented in terms of vector space model (VSM). The purpose of the
transformation is to show a word’s importance in a particular document and the degree to
which it carries information in the domain of discourse in general (Landauer et al., 1998).
∑ pp log
28

Third, singular value decomposition (SVD) is applied to the X matrix. Using SVD, the
rectangular matrix X with rank dt × ),min( dtr ≤ is decomposed into the product of three
matrices such that . Matrix T is the TTSDX = rt × matrix of term eigenvectors of the square
symmetric matrix TXXY = where Y is the tt × matrix of term covariances. Its columns are
called the left singular vectors, which are orthonormal (i.e., ITT T = where I is an rr × identity
matrix). Matrix D is the matrix of document eigenvectors of the square symmetric matrix rd ×
XXZ T= where Z is the matrix of document covariances. The columns of matrix D are
called the right singular vectors, which are also orthonormal (i.e.,
dd ×
IDDT = where I is an
rr × identity matrix). Thus, . Matrix S is the rT IDD =TTT = rr × diagonal matrix of singular
values. These singular values are the square roots of eigenvalues of both Y and Z.
In general, the matrices T, S, and D are of full rank for . Given
, the matrices T, S, and D each will have a
. Therefore, an SVD of the
TTSDX =
dt
),min()( dtrXrank ≤=
rankSrankTrank == )()( rD =)( × matrix of terms by documents
results in the r number of dimensions. For td ≤ , this means that each document represents a
unique dimension in the domain of discourse. Similarly, for dt ≤ , this means that each term
represents a unique dimension in the domain of discourse.
However, the dt × term‐by‐document matrix X can be decomposed using fewer than
the r number of factors, and the reconstructed matrix X
t
becomes a least‐squares best fit of
matrix X (Deerwester et al., 1990; Landauer et al., 1998). The fundamental idea behind using
fewer than the necessary number of factors is that the d× matrix X can be approximated by
, where is the diagonal matrix S with the first k largest original singular values TDTSX 0ˆ = 0S
29

and the remaining (r‐k) smaller singular values set to zero. The resulting matrix X is of rank k
(k<r) and is the best approximation of X in the least squares sense. The variability of X is now
explained by the first k factors and is equal to the sum of these k squared singular values. The
diagonal matrix can be simplified to the 0S kk × diagonal matrix S by deleting the rows and
columns of containing zeros. The corresponding columns of matrices T and D must also be
deleted, resulting in the matrix
ˆ
0S
kt × T and the kd × matrix , respectively. Thus, we obtain
the rank‐k reduced model, , which is the best possible least‐squares‐fit to X. This
truncated representation of the original structure using only the significant factors reduces
synonymy and polysemy effects, and was shown to drastically improve query performance
(Landauer et al., 1998; Landauer, 2002).
D
TDST ˆˆˆ=X
The choice of k is critical in LSA. Small number of dimensions can be used to detect local
unique components. On the other hand, large number of dimensions can capture similarities
and differences. The selection of k can be dealt with empirically. Deerwester et al. (1990)
suggest 70 to 100 dimensions frequently being the optimal choice for collections of about 5,000
terms by 1,000 documents. Efron (2005) selects k based on non‐parametric confidence
intervals obtained through simulations and bootstrapping. Interestingly, for collections of
similar size, his method selects k values in the range of 80 to 100. Other classic k selection
approaches include the total variance explained method (the number of components that
explain 85% of total variance) and the Kaiser‐Guttman rule (keeping components whose
eigenvalues are greater thanλ ).
30

LSA provides term and factor representation in the same factor space. From truncated
SVD of matrix X, , the term and document variance‐covariance matrices are given by TDSTX ˆˆˆˆ =
TXX ˆˆ and XX T ˆˆ , respectively. We see that the term variance‐covariance matrix TXX ˆˆ
TX T ˆˆ
is
reproduced as , therefore is a matrix of factor loadings for
terms. Similarly, the factor loadings for the documents are given by . Since
both the terms and documents are represented in the same factor space, LSA also provides
matrix expressions that allow comparison of terms and documents with each other.
TS)ˆT TSTXX ˆ(ˆˆˆˆ = DXSTLTˆˆˆˆ ==
SDLDˆˆ ==
LSA has a plethora of applications. It improves library indexing methods and the
performance of search engine queries (Berry, Dumais, & O’Brien, 1995; Deerwester et al., 1990;
Dumais, 2004). Psychology researchers use LSA to explain natural language processing such as
word sorting and category judgments (Landauer, 2002). LSA in combination with document
clustering was used on titles and keywords of articles published in 25 animal behavior journals
in 1968‐2002 (Ord, Martins, Thakur, Mane, & Börner, 2005) to produce lists of terms associated
with each research theme. The same method was used on titles, abstracts, and full body text of
articles published in the Proceedings of the National Academy of Science in 1997‐2002 to
produce visualization clusters projected on 3 dimensions (Landauer, Laham, & Derr, 2004).
The BPM‐MBNQA Conceptual Framework
There is considerable discussion in the literature about how to integrate two or more
models into one that provides, or purports to provide, better results than any of the individual
models. One widely used approach to integration of two models is to examine the structural
characteristics of both models and combine them when they share some common constructs or
concepts (Black, Mendenhall, & Oddou, 1991).
31

Most elements of BPM framework are also critical constructs of the current MBNQA
framework. The MBNQA framework embodies six business results and implies that innovation
and competitive advantage lead to and are integral parts of the business results. In fact, the
MBNQA framework is more comprehensive and provides the basis for the underlying
constructs in the BPM framework (Hossain & Prybutok, 2008). The 2007 Monfort Summit
participants alluded to this conclusion and posited that the BPM framework be used a subset of
the MBNQA framework. Consistent with this I posit that the BPM and MBNQA frameworks be
integrated into a new framework (BPM‐MBNQA framework) such that the BPM framework
serves as the start‐up model for the MBNQA framework. In other words, organizations can
initially deploy the BPM framework and gradually move to the adoption of MBNQA framework
(Hossain & Prybutok, 2008). Figure 5 illustrates the integrated BPM‐MBNQA framework.
Examination of the BPM constructs (Table 4) and the MBNQA constructs (Table 1 and
Table 2) reveals that the MBNQA framework encompasses the BPM framework. Most BPM
constructs – for example, strategy development, action plan (strategy deployment), results, and
performance analysis, review and improvement – are directly embedded in the MBNQA
frameworks. Table 5 provides the correspondence of the BPM constructs to those of the
MBNQA frameworks.
32

Figure 5: The BPM‐MBNQA conceptual framework
Time Transition
BPM Program
MBNQA Initiative
MBNQA Program
Leadership
Customer and Market Focus
Strategic Planning
Process Management
Workforce Focus
Results
Measurement, Analysis, and Knowledge Management
Strategy Development
Business Intelligence
Performance Analysis, Review, and Improvement
Performance Monitoring
Action Plan
Competitive Advantage
Innovation
Results(Same as MBNQA
Results)
33

Table 5: Correspondence of the BPM constructs to the MBNQA constructs BPM Constructs Corresponding MBNQA Constructs Strategy development Strategy development is a construct of the MBNQA framework at
the dimension level.
Action plan By definition, action plan corresponds to strategy deployment, which is a dimension level MBNQA construct.
Performance monitoring There is no direct correspondence of the construct performance monitoring in the MBNQA frameworks. However, performance monitoring falls within the scope of the measurement, analysis and knowledge management category of the MBNQA category level framework. One question item of the management, analysis and knowledge management category is how organizations track their daily operations and overall performance including progress relative to strategic objectives. This implies that performance monitoring is embedded as a critical question item in the measurement, analysis and knowledge management category of the MBNQA category level framework.
Performance analysis, review, and improvement
Performance analysis, review, and improvement is a dimension level construct of the MBNQA framework.
Business intelligence Business intelligence largely corresponds to the management, analysis and knowledge management category of the MBNQA framework. Like business intelligence in the BPM framework, the management, analysis and knowledge management works as the “brain center” for all key data and information, and their quality and availability to ensure effective measurement, analysis and improvement of organizational performance (NIST, 2008).
Innovation and competitive advantage
There are no direct corresponding constructs in the MBNQA frameworks. The 2008 MBNQA framework uses the term strategic advantage to encompass competitive advantage. NIST (2008) posits that innovation and strategic advantage are integral parts of the business results. Innovation helps organizations to improve products, services, programs, processes, operations, and business model. Strategic advantages provide sources of current and future competitive success.
Results This is identical to the MBNQA results category.
34

Nonetheless, the relationships among the constructs in the BPM framework are
different than those in the MBNQA framework. That is what makes the BPM framework
distinctive and independent, and not just a mere subset of the MBNQA framework. Therefore,
the BPM framework can be implemented independently with the intent of paving the way for
the implementation of the MBNQA framework. The use of BPM as a start‐up program for the
MBNQA program provides two important benefits. First, the BPM framework is a generic
performance management model that can be implemented across industries. The MBNQA
program uses separate frameworks for each sector that is eligible for the application of the
award. Therefore, the BPM framework can provide organizations with more common language
to bridge the sector‐specific gaps. Second, the MBNQA framework has been evolving since its
inception in 1987. Almost every year the criteria are updated and the framework is supposedly
enhanced. This has an implication on organizations attempting to implement the Baldrige
program because they have to adjust the changes within short period of time. However, BPM
helps organizations enhance their agility. Therefore, with the implementation of the BPM
framework, organizations can quickly adapt to the changes.
Research Models and Propositions
This study uses three research models – the MBNQA framework at the category level,
the MBNQA framework at the dimension level, and the proposed BPM framework.
The MBNQA Framework at the Category Level
The 2008 Baldrige framework (Figure 6) comprises the Baldrige system categories
(Categories 1 – 6) and the performance results category (Category 7). The system categories are
connected to each other with two‐headed arrows, implying that there exist non‐recursive
35

causal relationships among them. However, they are linked to the performance results category
with one‐directional arrows pointing to the latter. This suggests that there are recursive causal
relationships between the system categories and the performance results.
Figure 6: The 2008 MBNQA framework at the category level
There are many specific relationships among the criteria categories. No studies have
investigated all possible relationships in any Baldrige framework since its inception. Some
studies (e.g., Wilson & Collier, 2000; Pannirselvam & Ferguson, 2001) attempted to empirically
test the Baldrige causal model. However, none of them tested the model as a non‐recursive
causal model. The 2008 framework represents the most recent and enhanced version, and it
has not yet been tested. Therefore, the underlying relationships purported in the 2008
framework and in prior frameworks from the perspective of non‐recursive causality are simply
propositions. This study identifies and attempts to validate these propositions from the
perspective of both recursive and non‐recursive causalities.
The non‐recursive causal model of the Baldrige system (Categories 1 – 6) yields 30
([6!/(6‐2)!]) direct one‐to‐one causal relationships. That is, two categories give two direct one‐
to‐one causal relationships. For instance, leadership and strategic planning have two direct one‐
to‐one causal relationships: (1) leadership influences strategic planning, and (2) strategic
36
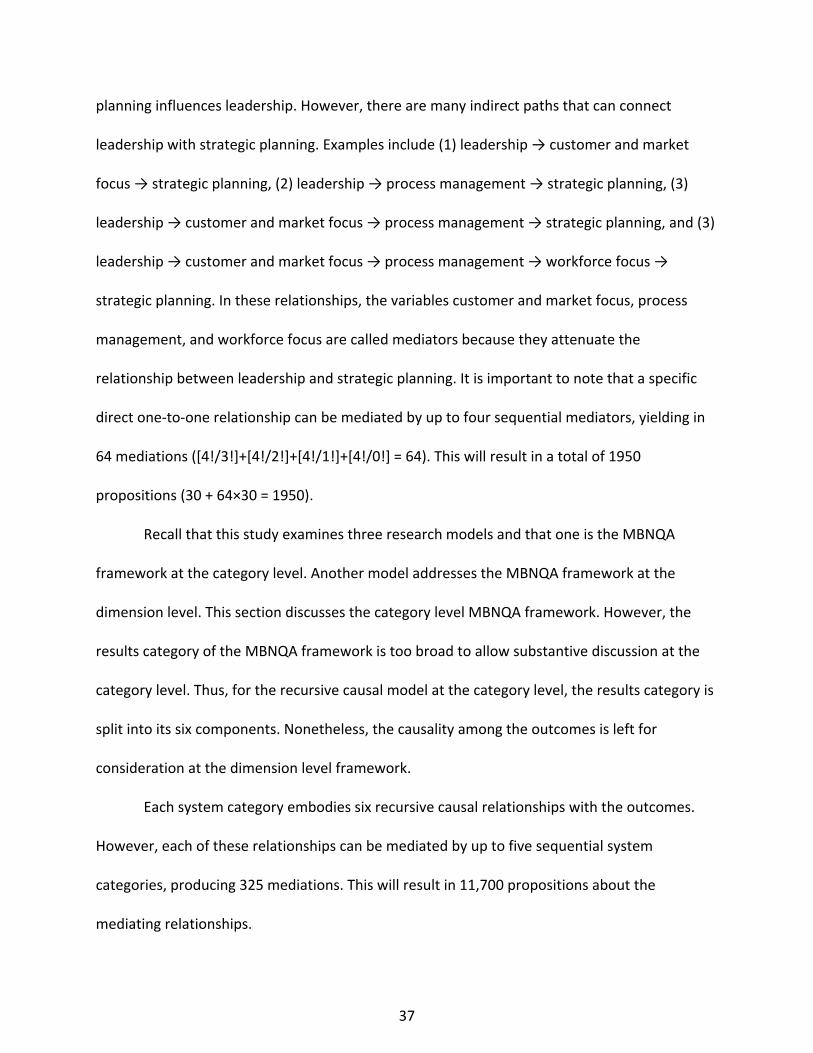
planning influences leadership. However, there are many indirect paths that can connect
leadership with strategic planning. Examples include (1) leadership → customer and market
focus → strategic planning, (2) leadership → process management → strategic planning, (3)
leadership → customer and market focus → process management → strategic planning, and (3)
leadership → customer and market focus → process management → workforce focus →
strategic planning. In these relationships, the variables customer and market focus, process
management, and workforce focus are called mediators because they attenuate the
relationship between leadership and strategic planning. It is important to note that a specific
direct one‐to‐one relationship can be mediated by up to four sequential mediators, yielding in
64 mediations ([4!/3!]+[4!/2!]+[4!/1!]+[4!/0!] = 64). This will result in a total of 1950
propositions (30 + 64×30 = 1950).
Recall that this study examines three research models and that one is the MBNQA
framework at the category level. Another model addresses the MBNQA framework at the
dimension level. This section discusses the category level MBNQA framework. However, the
results category of the MBNQA framework is too broad to allow substantive discussion at the
category level. Thus, for the recursive causal model at the category level, the results category is
split into its six components. Nonetheless, the causality among the outcomes is left for
consideration at the dimension level framework.
Each system category embodies six recursive causal relationships with the outcomes.
However, each of these relationships can be mediated by up to five sequential system
categories, producing 325 mediations. This will result in 11,700 propositions about the
mediating relationships.
37

Due to the complexity that the sequential multi‐variable mediation can create, this
study considers single variable mediation in all relationships. The propositions are grouped into
two categories – results‐related propositions, and system’s propositions. There are 216 results‐
related propositions and 150 system’s propositions, totaling 366 propositions at the category
level.
Results‐Related Propositions
Leadership’s Influence on the Results
P1 Leadership has a positive influence on product and service outcomes.
P2 Strategic planning mediates the relationship between leadership, and product and service outcomes.
P3 Customer and market focus mediates the relationship between leadership, and product and service outcomes.
P4 Measurement, analysis, and knowledge management mediates the relationship between leadership, and product and service outcomes.
P5 Workforce focus mediates the relationship between leadership, and product and service outcomes.
P6 Process management mediates the relationship between leadership, and product and service outcomes.
P7 Leadership has a positive influence on customer‐focused outcomes.
P8 Strategic planning mediates the relationship between leadership and customer‐focused outcomes.
P9 Customer and market focus mediates the relationship between leadership and customer‐focused outcomes.
P10 Measurement, analysis, and knowledge management mediates the relationship between leadership and customer‐focused outcomes.
P11 Workforce focus mediates the relationship between leadership and customer‐focused outcomes.
38

P12 Process management mediates the relationship between leadership and customer‐focused outcomes.
P13 Leadership has a positive influence on financial and market outcomes.
P14 Strategic planning mediates the relationship between leadership, and financial and market outcomes.
P15 Customer and market focus mediates the relationship between leadership, and financial and market outcomes.
P16 Measurement, analysis, and knowledge management mediates the relationship between leadership, and financial and market outcomes.
P17 Workforce focus mediates the relationship between leadership, and financial and market outcomes.
P18 Process management mediates the relationship between leadership, and financial and market outcomes.
P19 Leadership has a positive influence on workforce‐focused outcomes.
P20 Strategic planning mediates the relationship between leadership and workforce‐focused outcomes.
P21 Customer and market focus mediates the relationship between leadership and workforce‐focused outcomes.
P22 Measurement, analysis, and knowledge management mediates the relationship between leadership and workforce‐focused outcomes.
P23 Workforce focus mediates the relationship between leadership and workforce‐focused outcomes.
P24 Process management mediates the relationship between leadership and workforce‐focused outcomes.
P25 Leadership has a positive influence on process effectiveness outcomes.
P26 Strategic planning mediates the relationship between leadership and process effectiveness outcomes.
P27 Customer and market focus mediates the relationship between leadership and process effectiveness outcomes.
P28 Measurement, analysis, and knowledge management mediates the relationship between leadership and process effectiveness outcomes.
39

P29 Workforce focus mediates the relationship between leadership and process effectiveness outcomes.
P30 Process management mediates the relationship between leadership and process effectiveness outcomes.
P31 Leadership has a positive influence on leadership outcomes.
P32 Strategic planning mediates the relationship between leadership and leadership outcomes.
P33 Customer and market focus mediates the relationship between leadership and leadership outcomes.
P34 Measurement, analysis, and knowledge management mediates the relationship between leadership and leadership outcomes.
P35 Workforce focus mediates the relationship between leadership and leadership outcomes.
P36 Process management mediates the relationship between leadership and leadership outcomes.
Strategic Planning’s Influence on the Results
P37 Strategic planning has a positive influence on product and service outcomes.
P38 Leadership mediates the relationship between strategic planning and product and service outcomes.
P39 Customer and market focus mediates the relationship between strategic planning, and product and service outcomes.
P40 Measurement, analysis, and knowledge management mediates the relationship between strategic planning, and product and service outcomes.
P41 Workforce focus mediates the relationship between strategic planning, and product and service outcomes.
P42 Process management mediates the relationship between strategic planning, and product and service outcomes.
P43 Strategic planning has a positive influence on customer‐focused outcomes.
P44 Leadership mediates the relationship between strategic planning and customer‐focused outcomes.
40

P45 Customer and market focus mediates the relationship between strategic planning and customer‐focused outcomes.
P46 Measurement, analysis, and knowledge management mediates the relationship between strategic planning and customer‐focused outcomes.
P47 Workforce focus mediates the relationship between strategic planning and customer‐focused outcomes.
P48 Process management mediates the relationship between strategic planning and customer‐focused outcomes.
P49 Strategic planning has a positive influence on financial and market outcomes.
P50 Leadership mediates the relationship between strategic planning, and financial and market outcomes.
P51 Customer and market focus mediates the relationship between strategic planning, and financial and market outcomes.
P52 Measurement, analysis, and knowledge management mediates the relationship between strategic planning, and financial and market outcomes.
P53 Workforce focus mediates the relationship between strategic planning, and financial and market outcomes.
P54 Process management mediates the relationship between strategic planning and financial and market outcomes.
P55 Strategic planning has a positive influence on workforce‐focused outcomes.
P56 Leadership mediates the relationship between strategic planning and workforce‐focused outcomes.
P57 Customer and market focus mediates the relationship between strategic planning and workforce‐focused outcomes.
P58 Measurement, analysis, and knowledge management mediates the relationship between strategic planning and workforce‐focused outcomes.
P59 Workforce focus mediates the relationship between strategic planning and workforce‐focused outcomes.
P60 Process management mediates the relationship between strategic planning and workforce‐focused outcomes.
P61 Strategic planning has a positive influence on process effectiveness outcomes.
41

P62 Leadership mediates the relationship between strategic planning and process effectiveness outcomes.
P63 Customer and market focus mediates the relationship between strategic planning and process effectiveness outcomes.
P64 Measurement, analysis, and knowledge management mediates the relationship between strategic planning and process effectiveness outcomes.
P65 Workforce focus mediates the relationship between strategic planning and process effectiveness outcomes.
P66 Process management mediates the relationship between strategic planning and process effectiveness outcomes.
P67 Strategic planning has a positive influence on leadership outcomes.
P68 Leadership mediates the relationship between strategic planning and leadership outcomes.
P69 Customer and market focus mediates the relationship between strategic planning and leadership outcomes.
P70 Measurement, analysis, and knowledge management mediates the relationship between strategic planning and leadership outcomes.
P71 Workforce focus mediates the relationship between strategic planning and leadership outcomes.
P72 Process management mediates the relationship between strategic planning and leadership outcomes.
Influence of Customer and Market focus on the Results
P73 Customer and market focus has a positive influence on product and service outcomes.
P74 Leadership mediates the relationship between customer and market focus, and product and service outcomes.
P75 Strategic planning mediates the relationship between customer and market focus, and product and service outcomes.
P76 Measurement, analysis, and knowledge management mediates the relationship between customer and market focus, and product and service outcomes.
42

P77 Workforce focus mediates the relationship between customer and market focus, and product and service outcomes.
P78 Process management mediates the relationship between customer and market focus, and product and service outcomes.
P79 Customer and market focus has a positive influence on customer‐focused outcomes.
P80 Leadership mediates the relationship between customer and market focus, and customer‐focused outcomes.
P81 Strategic planning mediates the relationship between customer and market focus, and customer‐focused outcomes.
P82 Measurement, analysis, and knowledge management mediates the relationship between customer and market focus, and customer‐focused outcomes.
P83 Workforce focus mediates the relationship between customer and market focus, and customer‐focused outcomes.
P84 Process management mediates the relationship between customer and market focus, and customer‐focused outcomes.
P85 Customer and market focus has a positive influence on financial and market outcomes.
P86 Leadership mediates the relationship between customer and market focus, and financial and market outcomes.
P87 Strategic planning mediates the relationship between customer and market focus, and financial and market outcomes.
P88 Measurement, analysis, and knowledge management mediates the relationship between customer and market focus, and financial and market outcomes.
P89 Workforce focus mediates the relationship between customer and market focus, and financial and market outcomes.
P90 Process management mediates the relationship between customer and market focus, and financial and market outcomes.
P91 Customer and market focus has a positive influence on workforce‐focused outcomes.
P92 Leadership mediates the relationship between customer and market focus, and workforce‐focused outcomes.
P93 Strategic planning mediates the relationship between customer and market focus, and workforce‐focused outcomes.
43

P94 Measurement, analysis, and knowledge management mediates the relationship between customer and market focus, and workforce‐focused outcomes.
P95 Workforce focus mediates the relationship between customer and market focus, and workforce‐focused outcomes.
P96 Process management mediates the relationship between customer and market focus, and workforce‐focused outcomes.
P97 Customer and market focus has a positive influence on process effectiveness outcomes.
P98 Leadership mediates the relationship between customer and market focus, and process effectiveness outcomes.
P99 Strategic planning mediates the relationship between customer and market focus, and process effectiveness outcomes.
P100 Measurement, analysis, and knowledge management mediates the relationship between customer and market focus, and process effectiveness outcomes.
P101 Workforce focus mediates the relationship between customer and market focus, and process effectiveness outcomes.
P102 Process management mediates the relationship between customer and market focus, and process effectiveness outcomes.
P103 Customer and market focus has a positive influence on leadership outcomes.
P104 Leadership mediates the relationship between customer and market focus, and leadership outcomes.
P105 Strategic planning mediates the relationship between customer and market focus, and leadership outcomes.
P106 Measurement, analysis, and knowledge management mediates the relationship between customer and market focus, and leadership outcomes.
P107 Workforce focus mediates the relationship between customer and market focus, and leadership outcomes.
P108 Process management mediates the relationship between customer and market focus, and leadership outcomes.
Influence of Measurement, Analysis, and Knowledge Management on the Results
P109 Measurement, analysis, and knowledge management has a positive influence on product and service outcomes.
44

P110 Leadership mediates the relationship between measurement, analysis, and knowledge management, and product and service outcomes.
P111 Strategic planning mediates the relationship between measurement, analysis, and knowledge management, and product and service outcomes.
P112 Customer and market focus mediates the relationship between measurement, analysis, and knowledge management, and product and service outcomes.
P113 Workforce focus mediates the relationship between measurement, analysis, and knowledge management, and product and service outcomes.
P114 Process management mediates the relationship between measurement, analysis, and knowledge management, and product and service outcomes.
P115 Measurement, analysis, and knowledge management has a positive influence on customer‐focused outcomes.
P116 Leadership mediates the relationship between measurement, analysis, and knowledge management, and customer‐focused outcomes.
P117 Strategic planning mediates the relationship between measurement, analysis, and knowledge management, and customer‐focused outcomes.
P118 Customer and market focus mediates the relationship between measurement, analysis, and knowledge management, and customer‐focused outcomes.
P119 Workforce focus mediates the relationship between measurement, analysis, and knowledge management, and customer‐focused outcomes.
P120 Process management mediates the relationship between measurement, analysis, and knowledge management, and customer‐focused outcomes.
P121 Measurement, analysis, and knowledge management has a positive influence on financial and market outcomes.
P122 Leadership mediates the relationship between measurement, analysis, and knowledge management, and financial and market outcomes.
P123 Strategic planning mediates the relationship between measurement, analysis, and knowledge management, and financial and market outcomes.
P124 Customer and market focus mediates the relationship between measurement, analysis, and knowledge management, and financial and market outcomes.
45

P125 Workforce focus mediates the relationship between measurement, analysis, and knowledge management, and financial and market outcomes.
P126 Process management mediates the relationship between measurement, analysis, and knowledge management, and financial and market outcomes.
P127 Measurement, analysis, and knowledge management has a positive influence on workforce‐focused outcomes.
P128 Leadership mediates the relationship between measurement, analysis, and knowledge management, and workforce‐focused outcomes.
P129 Strategic planning mediates the relationship between measurement, analysis, and knowledge management, and workforce‐focused outcomes.
P130 Customer and market focus mediates the relationship between measurement, analysis, and knowledge management, and workforce‐focused outcomes.
P131 Workforce focus mediates the relationship between measurement, analysis, and knowledge management, and workforce‐focused outcomes.
P132 Process management mediates the relationship between measurement, analysis, and knowledge management, and workforce‐focused outcomes.
P133 Measurement, analysis, and knowledge management has a positive influence on process effectiveness outcomes.
P134 Leadership mediates the relationship between measurement, analysis, and knowledge management, and process effectiveness outcomes.
P135 Strategic planning mediates the relationship between measurement, analysis, and knowledge management, and process effectiveness outcomes.
P136 Customer and market focus mediates the relationship between measurement, analysis, and knowledge management, and process effectiveness outcomes.
P137 Workforce focus mediates the relationship between measurement, analysis, and knowledge management, and process effectiveness outcomes.
P138 Process management mediates the relationship between measurement, analysis, and knowledge management, and process effectiveness outcomes.
P139 Measurement, analysis, and knowledge management has a positive influence on leadership outcomes.
46
P140 Leadership mediates the relationship between measurement, analysis, and knowledge management, and leadership outcomes.
P141 Strategic planning mediates the relationship between measurement, analysis, and knowledge management, and leadership outcomes.
P142 Customer and market focus mediates the relationship between measurement, analysis, and knowledge management, and leadership outcomes.
P143 Workforce focus mediates the relationship between measurement, analysis, and knowledge management, and leadership outcomes.
P144 Process management mediates the relationship between measurement, analysis, and knowledge management, and leadership outcomes.
Influence of Workforce Focus on the Results
P145 Workforce focus has a positive influence on product and service outcomes.
P146 Leadership mediates the relationship between workforce focus, and product and service outcomes.
P147 Strategic planning mediates the relationship between workforce focus, and product and service outcomes.
P148 Customer and market focus mediates the relationship between workforce focus, and product and service outcomes.
P149 Measurement, analysis, and knowledge management mediates the relationship between workforce focus, and product and service outcomes.
P150 Process management mediates the relationship between workforce focus, and product and service outcomes.
P151 Workforce focus has a positive influence on customer‐focused outcomes.
P152 Leadership mediates the relationship between workforce focus and customer‐focused outcomes.
P153 Strategic planning mediates the relationship between workforce focus and customer‐focused outcomes.
P154 Customer and market focus mediates the relationship between workforce focus and customer‐focused outcomes.
P155 Measurement, analysis, and knowledge management mediates the relationship between workforce focus and customer‐focused outcomes.
47

P156 Process management mediates the relationship between workforce focus and customer‐focused outcomes.
P157 Workforce focus has a positive influence on financial and market outcomes.
P158 Leadership mediates the relationship between workforce focus, and financial and market outcomes.
P159 Strategic planning mediates the relationship between workforce focus, and financial and market outcomes.
P160 Customer and market focus mediates the relationship between workforce focus, and financial and market outcomes.
P161 Measurement, analysis, and knowledge management mediates the relationship between workforce focus, and financial and market outcomes.
P162 Process management mediates the relationship between workforce focus, and financial and market outcomes.
P163 Workforce focus has a positive influence on workforce‐focused outcomes.
P164 Leadership mediates the relationship between workforce focus and workforce‐focused outcomes.
P165 Strategic planning mediates the relationship between workforce focus and workforce‐focused outcomes.
P166 Customer and market focus mediates the relationship between workforce focus and workforce‐focused outcomes.
P167 Measurement, analysis, and knowledge management mediates the relationship between workforce focus and workforce‐focused outcomes.
P168 Process management mediates the relationship between workforce focus and workforce‐focused outcomes.
P169 Workforce focus has a positive influence on process effectiveness outcomes.
P170 Leadership mediates the relationship between workforce focus and process effectiveness outcomes.
P171 Strategic planning mediates the relationship between workforce focus and process effectiveness outcomes.
P172 Customer and market focus mediates the relationship between workforce focus and process effectiveness outcomes.
48

P173 Measurement, analysis, and knowledge management mediates the relationship between workforce focus and process effectiveness outcomes.
P174 Process management mediates the relationship between workforce focus and process effectiveness outcomes.
P175 Workforce focus has a positive influence on leadership outcomes.
P176 Leadership mediates the relationship between workforce focus and leadership outcomes.
P177 Strategic planning mediates the relationship between workforce focus and leadership outcomes.
P178 Customer and market focus mediates the relationship between workforce focus and leadership outcomes.
P179 Measurement, analysis, and knowledge management mediates the relationship between workforce focus and leadership outcomes.
P180 Process management mediates the relationship between workforce focus and leadership outcomes.
Process Management’s Influence on the Results
P181 Process management has a positive influence on product and service outcomes.
P182 Leadership mediates the relationship between process management, and product and service outcomes.
P183 Strategic planning mediates the relationship between process management, and product and service outcomes.
P184 Customer and market focus mediates the relationship between process management, and product and service outcomes.
P185 Measurement, analysis, and knowledge management mediates the relationship between process management, and product and service outcomes.
P186 Workforce focus mediates the relationship between process management, and product and service outcomes.
P187 Process management has a positive influence on customer‐focused outcomes.
P188 Leadership mediates the relationship between process management and customer‐focused outcomes.
49

P189 Strategic planning mediates the relationship between process management and customer‐focused outcomes.
P190 Customer and market focus mediates the relationship between process management and customer‐focused outcomes.
P191 Measurement, analysis, and knowledge management mediates the relationship between process management and customer‐focused outcomes.
P192 Workforce focus mediates the relationship between process management and customer‐focused outcomes.
P193 Process management has a positive influence on financial and market outcomes.
P194 Leadership mediates the relationship between process management, and financial and market outcomes.
P195 Strategic planning mediates the relationship between process management, and financial and market outcomes.
P196 Customer and market focus mediates the relationship between process management, and financial and market outcomes.
P197 Measurement, analysis, and knowledge management mediates the relationship between process management, and financial and market outcomes.
P198 Workforce focus mediates the relationship between process management, and financial and market outcomes.
P199 Process management has a positive influence on workforce‐focused outcomes.
P200 Leadership mediates the relationship between process management and workforce‐focused outcomes.
P201 Strategic planning mediates the relationship between process management and workforce‐focused outcomes.
P202 Customer and market focus mediates the relationship between process management and workforce‐focused outcomes.
P203 Measurement, analysis, and knowledge management mediates the relationship between process management and workforce‐focused outcomes.
P204 Workforce focus mediates the relationship between process management and workforce‐focused outcomes.
P205 Process management has a positive influence on process effectiveness outcomes.
50

P206 Leadership mediates the relationship between process management and process effectiveness outcomes.
P207 Strategic planning mediates the relationship between process management and process effectiveness outcomes.
P208 Customer and market focus mediates the relationship between process management and process effectiveness outcomes.
P209 Measurement, analysis, and knowledge management mediates the relationship between process management and process effectiveness outcomes.
P210 Workforce focus mediates the relationship between process management and process effectiveness outcomes.
P211 Process management has a positive influence on leadership outcomes.
P212 Leadership mediates the relationship between process management and leadership outcomes.
P213 Strategic planning mediates the relationship between process management and leadership outcomes.
P214 Customer and market focus mediates the relationship between process management and leadership outcomes.
P215 Measurement, analysis, and knowledge management mediates the relationship between process management and leadership outcomes.
P216 Workforce focus mediates the relationship between process management and leadership outcomes.
The above propositions are summarized in a tabular form in Table 6. The tabular form
provides a more concise reference to the elaborated results‐related propositions.
51

Table 6: Tabular view of results‐related propositions for MBNQA category level framework
System’s Propositions
Leadership’s Influence on Other System Categories
P217 Leadership has a positive influence on strategic planning.
P218 Customer and market focus mediates the relationship between leadership and strategic planning.
P219 Measurement, analysis, and knowledge management mediates the relationship between leadership and strategic planning.
P220 Workforce focus mediates the relationship between leadership and strategic planning.
P221 Process management mediates the relationship between leadership and strategic planning.
P222 Leadership has a positive influence on customer and market focus.
P223 Strategic planning mediates the relationship between leadership, and customer and market focus.
P224 Measurement, analysis, and knowledge management mediates the relationship between leadership, and customer and market focus.
P225 Workforce focus mediates the relationship between leadership, and customer and market focus.
52
P226 Process management mediates the relationship between leadership, and customer and market focus.
P227 Leadership has a positive influence on measurement, analysis, and knowledge management.
P228 Strategic planning mediates the relationship between leadership, and measurement, analysis, and knowledge management.
P229 Customer and market focus mediates the relationship between leadership, and measurement, analysis, and knowledge management.
P230 Workforce focus mediates the relationship between leadership, and measurement, analysis, and knowledge management.
P231 Process management mediates the relationship between leadership, and measurement, analysis, and knowledge management.
P232 Leadership has a positive influence on workforce focus.
P233 Strategic planning mediates the relationship between leadership and workforce focus.
P234 Customer and market focus mediates the relationship between leadership and workforce focus.
P235 Measurement, analysis, and knowledge management mediates the relationship between leadership and workforce focus.
P236 Process management mediates the relationship between leadership and workforce focus.
P237 Leadership has a positive influence on process management.
P238 Strategic planning mediates the relationship between leadership and process management.
P239 Customer and market focus mediates the relationship between leadership and process management.
P240 Measurement, analysis, and knowledge management mediates the relationship between leadership and process management.
P241 Workforce focus mediates the relationship between leadership and process management.
53

Strategic Planning’s Influence on Other System Categories
P242 Strategic planning has a positive influence on leadership.
P243 Customer and market focus mediates the relationship between strategic planning and leadership.
P244 Measurement, analysis, and knowledge management mediates the relationship between strategic planning and leadership.
P245 Workforce focus mediates the relationship between strategic planning and leadership.
P246 Process management mediates the relationship between strategic planning and leadership.
P247 Strategic planning has a positive influence on customer and market focus.
P248 Strategic planning mediates the relationship between strategic planning, and customer and market focus.
P249 Measurement, analysis, and knowledge management mediates the relationship between strategic planning, and customer and market focus.
P250 Workforce focus mediates the relationship between strategic planning, and customer and market focus.
P251 Process management mediates the relationship between strategic planning, and customer and market focus.
P252 Strategic planning has a positive influence on measurement, analysis, and knowledge management.
P253 Strategic planning mediates the relationship between strategic planning, and measurement, analysis, and knowledge management.
P254 customer and market focus mediates the relationship between strategic planning, and measurement, analysis, and knowledge management.
P255 Workforce focus mediates the relationship between strategic planning, and measurement, analysis, and knowledge management.
P256 Process management mediates the relationship between strategic planning, and measurement, analysis, and knowledge management.
P257 Strategic planning has a positive influence on workforce focus.
54

P258 Strategic planning mediates the relationship between strategic planning and workforce focus.
P259 Customer and market focus mediates the relationship between strategic planning and workforce focus.
P260 Measurement, analysis, and knowledge management mediates the relationship between strategic planning and workforce focus.
P261 Process management mediates the relationship between strategic planning and workforce focus.
P262 Strategic planning has a positive influence on process management.
P263 Strategic planning mediates the relationship between strategic planning and process management.
P264 Customer and market focus mediates the relationship between strategic planning and process management.
P265 Measurement, analysis, and knowledge management mediates the relationship between strategic planning and process management.
P266 Workforce focus mediates the relationship between strategic planning and process management.
Influence of Customer and Market Focus on Other System Categories
P267 Customer and market focus has a positive influence on leadership.
P268 Strategic planning mediates the relationship between customer and market focus, and leadership.
P269 Measurement, analysis, and knowledge management mediates the relationship between customer and market focus, and leadership.
P270 Workforce focus mediates the relationship between customer and market focus, and leadership.
P271 Process management mediates the relationship between customer and market focus, and leadership.
P272 Customer and market focus has a positive influence on strategic planning.
P273 Leadership mediates the relationship between customer and market focus, and strategic planning.
55

P274 Measurement, analysis, and knowledge management mediates the relationship between customer and market focus, and strategic planning.
P275 Workforce focus mediates the relationship between customer and market focus, and strategic planning.
P276 Process management mediates the relationship between customer and market focus, and strategic planning.
P277 Customer and market focus has a positive influence on measurement, analysis, and knowledge management.
P278 Leadership mediates the relationship between customer and market focus, and measurement, analysis, and knowledge management.
P279 Strategic planning mediates the relationship between customer and market focus, and measurement, analysis, and knowledge management.
P280 Workforce focus mediates the relationship between customer and market focus, and measurement, analysis, and knowledge management.
P281 Process management mediates the relationship between customer and market focus, and measurement, analysis, and knowledge management.
P282 Customer and market focus has a positive influence on workforce focus.
P283 Leadership mediates the relationship between customer and market focus, and workforce focus.
P284 Strategic planning mediates the relationship between customer and market focus, and workforce focus.
P285 Measurement, analysis, and knowledge management mediates the relationship between customer and market focus, and workforce focus.
P286 Process management mediates the relationship between customer and market focus, and workforce focus.
P287 Customer and market focus has a positive influence on process management.
P288 Leadership mediates the relationship between customer and market focus, and process management.
P289 Strategic planning mediates the relationship between customer and market focus, and process management.
56

P290 Measurement, analysis, and knowledge management mediates the relationship between customer and market focus, and process management.
P291 Workforce focus mediates the relationship between customer and market focus, and process management.
Influence of Measurement, Analysis, and Knowledge Management on Other System Categories
P292 Measurement, analysis, and knowledge management has a positive influence on leadership.
P293 Strategic planning mediates the relationship between measurement, analysis, and knowledge management, and leadership.
P294 Customer and market focus mediates the relationship between measurement, analysis, and knowledge management, and leadership.
P295 Workforce focus mediates the relationship between measurement, analysis, and knowledge management, and leadership.
P296 Process management mediates the relationship between measurement, analysis, and knowledge management, and leadership.
P297 Measurement, analysis, and knowledge management has a positive influence on strategic planning.
P298 Leadership mediates the relationship between measurement, analysis, and knowledge management, and strategic planning.
P299 Customer and market focus mediates the relationship between measurement, analysis, and knowledge management, and strategic planning.
P300 Workforce focus mediates the relationship between measurement, analysis, and knowledge management, and strategic planning.
P301 Process management mediates the relationship between measurement, analysis, and knowledge management, and strategic planning.
P302 Measurement, analysis, and knowledge management has a positive influence on customer and market focus.
P303 Leadership mediates the relationship between measurement, analysis, and knowledge management, and customer and market focus.
P304 Strategic planning mediates the relationship between measurement, analysis, and knowledge management, and customer and market focus.
57

P305 Workforce focus mediates the relationship between measurement, analysis, and knowledge management, and customer and market focus.
P306 Process management mediates the relationship between measurement, analysis, and knowledge management, and customer and market focus.
P307 Measurement, analysis, and knowledge management has a positive influence on workforce focus.
P308 Leadership mediates the relationship between measurement, analysis, and knowledge management, and workforce focus.
P309 Strategic planning mediates the relationship between measurement, analysis, and knowledge management, and workforce focus.
P310 Customer and market focus mediates the relationship between measurement, analysis, and knowledge management, and workforce focus.
P311 Process management mediates the relationship between measurement, analysis, and knowledge management, and workforce focus.
P312 Measurement, analysis, and knowledge management has a positive influence on process management.
P313 Leadership mediates the relationship between measurement, analysis, and knowledge management, and process management.
P314 Strategic planning mediates the relationship between measurement, analysis, and knowledge management, and process management.
P315 Customer and market focus mediates the relationship between measurement, analysis, and knowledge management, and process management.
P316 Workforce focus mediates the relationship between measurement, analysis, and knowledge management, and process management.
Influence of Workforce Focus on Other System Categories
P317 Workforce focus has a positive influence on leadership.
P318 Strategic planning mediates the relationship between workforce focus and leadership.
P319 Customer and market focus mediates the relationship between workforce focus and leadership.
P320 Measurement, analysis, and knowledge management mediates the relationship between workforce focus and leadership.
58

P321 Process management mediates the relationship between workforce focus and leadership.
P322 Workforce focus has a positive influence on strategic planning.
P323 Leadership mediates the relationship between workforce focus and strategic planning.
P324 Customer and market focus mediates the relationship between workforce focus and strategic planning.
P325 Measurement, analysis, and knowledge management mediates the relationship between workforce focus and strategic planning.
P326 Process management mediates the relationship between workforce focus and strategic planning.
P327 Workforce focus has a positive influence on customer and market focus.
P328 Leadership mediates the relationship between workforce focus and customer and market focus.
P329 Strategic planning mediates the relationship between workforce focus, and customer and market focus.
P330 Measurement, analysis, and knowledge management mediates the relationship between workforce focus, and customer and market focus.
P331 Process management mediates the relationship between workforce focus, and customer and market focus.
P332 Workforce focus has a positive influence on measurement, analysis, and knowledge management.
P333 Leadership mediates the relationship between workforce focus, and measurement, analysis, and knowledge management.
P334 Strategic planning mediates the relationship between workforce focus, and measurement, analysis, and knowledge management.
P335 Customer and market focus mediates the relationship between workforce focus, and measurement, analysis, and knowledge management.
P336 Process management mediates the relationship between workforce focus, and measurement, analysis, and knowledge management.
P337 Workforce focus has a positive influence on process management.
59

P338 Leadership mediates the relationship between workforce focus and process management.
P339 Strategic planning mediates the relationship between workforce focus and process management.
P340 Customer and market focus mediates the relationship between workforce focus and process management.
P341 Measurement, analysis, and knowledge management mediates the relationship between workforce focus and process management.
Influence of Process Management on Other System Categories
P342 Process management has a positive influence on leadership.
P343 Strategic planning mediates the relationship between process management and leadership.
P344 Customer and market focus mediates the relationship between process management and leadership.
P345 Measurement, analysis, and knowledge management mediates the relationship between process management and leadership.
P346 Workforce focus mediates the relationship between process management and leadership.
P347 Process management has a positive influence on strategic planning.
P348 Leadership mediates the relationship between process management and strategic planning.
P349 Customer and market focus mediates the relationship between process management and strategic planning.
P350 Measurement, analysis, and knowledge management mediates the relationship between process management and strategic planning.
P351 Workforce focus mediates the relationship between process management and strategic planning.
P352 Process management has a positive influence on customer and market focus.
P353 Leadership mediates the relationship between process management, and customer and market focus.
60

P354 Strategic planning mediates the relationship between process management, and customer and market focus.
P355 Measurement, analysis, and knowledge management mediates the relationship between process management, and customer and market focus.
P356 Workforce focus mediates the relationship between process management, and customer and market focus.
P357 Process management has a positive influence on measurement, analysis, and knowledge management.
P358 Leadership mediates the relationship between process management, and measurement, analysis, and knowledge management.
P359 Strategic planning mediates the relationship between process management, and measurement, analysis, and knowledge management.
P360 Customer and market focus mediates the relationship between process management, and measurement, analysis, and knowledge management.
P361 Workforce focus mediates the relationship between process management, and measurement, analysis, and knowledge management.
P362 Process management has a positive influence on workforce focus.
P363 Leadership mediates the relationship between process management and workforce focus.
P364 Strategic planning mediates the relationship between process management and workforce focus.
P365 Customer and market focus mediates the relationship between process management and workforce focus.
P366 Measurement, analysis, and knowledge management mediates the relationship between process management and workforce focus.
Table 7 provides a tabular view of System’s propositions for the MBNQA category level
framework.
61

Table 7: Tabular view of system’s propositions for MBNQA category level framework
The MBNQA Framework at the Dimension Level
There are 18 dimension level constructs of the MBNQA framework (Table 2). The
dimension level MBNQA framework is shown in Figure 7. Considering even a single variable
mediation increases the number of propositions dramatically. And since first order mediation
has been considered for the category level framework, no mediatory effect is purported to be
within the scope of this study.
Figure 7: The 2008 MBNQA framework at the dimension level
62

The first twelve dimensions comprise the Baldrige system. These dimensions are
connected to each other with two‐headed arrows and thus form a non‐recursive causal model.
One‐directional arrows connect these dimensions with those of the results category, suggesting
that there exist recursive causal relationships between the Baldrige system dimensions and the
results dimensions. However, the results dimensions are linked to each other in a non‐recursive
fashion. Considering only the direct one‐to‐one relationships, there are 234 propositions for
this framework. These propositions are presented below.
P367 Senior leadership has a positive influence on governance and social responsibilities.
P368 Senior leadership has a positive influence on strategy development.
P369 Senior leadership has a positive influence on strategy deployment.
P370 Senior leadership has a positive influence on customer and market knowledge.
P371 Senior leadership has a positive influence on customer relationships and satisfaction.
P372 Senior leadership has a positive influence on performance analysis, review, and improvement.
P373 Senior leadership has a positive influence on data and knowledge management.
P374 Senior leadership has a positive influence on workforce engagement.
P375 Senior leadership has a positive influence on workforce environment.
P376 Senior leadership has a positive influence on work systems design.
P377 Senior leadership has a positive influence on work process management and improvement.
P378 Senior leadership has a positive influence on product and service outcomes.
P379 Senior leadership has a positive influence on customer‐focused outcomes.
P380 Senior leadership has a positive influence on financial and market outcomes.
P381 Senior leadership has a positive influence on workforce‐focused outcomes.
63

P382 Senior leadership has a positive influence on process effectiveness outcomes.
P383 Senior leadership has a positive influence on leadership outcomes.
P384 Governance and social responsibilities have a positive influence on senior leadership.
P385 Governance and social responsibilities have a positive influence on strategy development.
P386 Governance and social responsibilities have a positive influence on strategy deployment.
P387 Governance and social responsibilities have a positive influence on customer and market knowledge.
P388 Governance and social responsibilities have a positive influence on customer relationships and satisfaction.
P389 Governance and social responsibilities have a positive influence on performance analysis, review, and improvement.
P390 Governance and social responsibilities have a positive influence on data and knowledge management.
P391 Governance and social responsibilities have a positive influence on workforce engagement.
P392 Governance and social responsibilities have a positive influence on workforce environment.
P393 Governance and social responsibilities have a positive influence on work systems design.
P394 Governance and social responsibilities have a positive influence on work process management and improvement.
P395 Governance and social responsibilities have a positive influence on product and service outcomes.
P396 Governance and social responsibilities have a positive influence on customer‐focused outcomes.
P397 Governance and social responsibilities have a positive influence on financial and market outcomes.
P398 Governance and social responsibilities have a positive influence on workforce‐focused outcomes.
64

P399 Governance and social responsibilities have a positive influence on process effectiveness outcomes.
P400 Governance and social responsibilities have a positive influence on leadership outcomes.
P401 Strategy development has a positive influence on senior leadership.
P402 Strategy development has a positive influence on governance and social responsibilities.
P403 Strategy development has a positive influence on strategy deployment.
P404 Strategy development has a positive influence on customer and market knowledge.
P405 Strategy development has a positive influence on customer relationships and satisfaction.
P406 Strategy development has a positive influence on performance analysis, review, and improvement.
P407 Strategy development has a positive influence on data and knowledge management.
P408 Strategy development has a positive influence on workforce engagement.
P409 Strategy development has a positive influence on workforce environment.
P410 Strategy development has a positive influence on work systems design.
P411 Strategy development has a positive influence on work process management and improvement.
P412 Strategy development has a positive influence on product and service outcomes.
P413 Strategy development has a positive influence on customer‐focused outcomes.
P414 Strategy development has a positive influence on financial and market outcomes.
P415 Strategy development has a positive influence on workforce‐focused outcomes.
P416 Strategy development has a positive influence on process effectiveness outcomes.
P417 Strategy development has a positive influence on leadership outcomes.
P418 Strategy deployment has a positive influence on senior leadership.
P419 Strategy deployment has a positive influence on governance and social responsibilities.
P420 Strategy deployment has a positive influence on strategy development.
65

P421 Strategy deployment has a positive influence on customer and market knowledge.
P422 Strategy deployment has a positive influence on customer relationships and satisfaction.
P423 Strategy deployment has a positive influence on performance analysis, review, and improvement.
P424 Strategy deployment has a positive influence on data and knowledge management.
P425 Strategy deployment has a positive influence on workforce engagement.
P426 Strategy deployment has a positive influence on workforce environment.
P427 Strategy deployment has a positive influence on work systems design.
P428 Strategy deployment has a positive influence on work process management and improvement.
P429 Strategy deployment has a positive influence on product and service outcomes.
P430 Strategy deployment has a positive influence on customer‐focused outcomes.
P431 Strategy deployment has a positive influence on financial and market outcomes.
P432 Strategy deployment has a positive influence on workforce‐focused outcomes.
P433 Strategy deployment has a positive influence on process effectiveness outcomes.
P434 Strategy deployment has a positive influence on leadership outcomes.
P435 Customer and market knowledge has a positive influence on senior leadership.
P436 Customer and market knowledge has a positive influence on governance and social responsibilities.
P437 Customer and market knowledge has a positive influence on strategy development.
P438 Customer and market knowledge has a positive influence on strategy deployment.
P439 Customer and market knowledge has a positive influence on customer relationships and satisfaction.
P440 Customer and market knowledge has a positive influence on performance analysis, review, and improvement.
P441 Customer and market knowledge has a positive influence on data and knowledge management.
66

P442 Customer and market knowledge has a positive influence on workforce engagement.
P443 Customer and market knowledge has a positive influence on workforce environment.
P444 Customer and market knowledge has a positive influence on work systems design.
P445 Customer and market knowledge has a positive influence on work process management and improvement.
P446 Customer and market knowledge has a positive influence on product and service outcomes.
P447 Customer and market knowledge has a positive influence on customer‐focused outcomes.
P448 Customer and market knowledge has a positive influence on financial and market outcomes.
P449 Customer and market knowledge has a positive influence on workforce‐focused outcomes.
P450 Customer and market knowledge has a positive influence on process effectiveness outcomes.
P451 Customer and market knowledge has a positive influence on leadership outcomes.
P452 Customer relationships and satisfaction has a positive influence on senior leadership.
P453 Customer relationships and satisfaction has a positive influence on governance and social responsibilities.
P454 Customer relationships and satisfaction has a positive influence on strategy development.
P455 Customer relationships and satisfaction has a positive influence on strategy deployment.
P456 Customer relationships and satisfaction has a positive influence on customer and market knowledge.
P457 Customer relationships and satisfaction has a positive influence on performance analysis, review, and improvement.
P458 Customer relationships and satisfaction has a positive influence on data and knowledge management.
P459 Customer relationships and satisfaction has a positive influence on workforce engagement.
67

P460 Customer relationships and satisfaction has a positive influence on workforce environment.
P461 Customer relationships and satisfaction has a positive influence on work systems design.
P462 Customer relationships and satisfaction has a positive influence on work process management and improvement.
P463 Customer relationships and satisfaction has a positive influence on product and service outcomes.
P464 Customer relationships and satisfaction has a positive influence on customer‐focused outcomes.
P465 Customer relationships and satisfaction has a positive influence on financial and market outcomes.
P466 Customer relationships and satisfaction has a positive influence on workforce‐focused outcomes.
P467 Customer relationships and satisfaction has a positive influence on process effectiveness outcomes.
P468 Customer relationships and satisfaction has a positive influence on leadership outcomes.
P469 Performance analysis, review, and improvement have a positive influence on senior leadership.
P470 Performance analysis, review, and improvement have a positive influence on governance and social responsibilities.
P471 Performance analysis, review, and improvement have a positive influence on strategy development.
P472 Performance analysis, review, and improvement have a positive influence on strategy deployment.
P473 Performance analysis, review, and improvement have a positive influence on customer and market knowledge.
P474 Performance analysis, review, and improvement have a positive influence on customer relationships and satisfaction.
P475 Performance analysis, review, and improvement have a positive influence on data and knowledge management.
68

P476 Performance analysis, review, and improvement have a positive influence on workforce engagement.
P477 Performance analysis, review, and improvement have a positive influence on workforce environment.
P478 Performance analysis, review, and improvement have a positive influence on work systems design.
P479 Performance analysis, review, and improvement have a positive influence on work process management and improvement.
P480 Performance analysis, review, and improvement have a positive influence on product and service outcomes.
P481 Performance analysis, review, and improvement have a positive influence on customer‐focused outcomes.
P482 Performance analysis, review, and improvement have a positive influence on financial and market outcomes.
P483 Performance analysis, review, and improvement have a positive influence on workforce‐focused outcomes.
P484 Performance analysis, review, and improvement have a positive influence on process effectiveness outcomes.
P485 Performance analysis, review, and improvement have a positive influence on leadership outcomes.
P486 Data and knowledge management has a positive influence on senior leadership.
P487 Data and knowledge management has a positive influence on governance and social responsibilities.
P488 Data and knowledge management has a positive influence on strategy development.
P489 Data and knowledge management has a positive influence on strategy deployment.
P490 Data and knowledge management has a positive influence on customer and market knowledge.
P491 Data and knowledge management has a positive influence on customer relationships and satisfaction.
P492 Data and knowledge management has a positive influence on performance analysis, review, and improvement.
69
P493 Data and knowledge management has a positive influence on workforce engagement.
P494 Data and knowledge management has a positive influence on workforce environment.
P495 Data and knowledge management has a positive influence on work systems design.
P496 Data and knowledge management has a positive influence on work process management and improvement.
P497 Data and knowledge management has a positive influence on product and service outcomes.
P498 Data and knowledge management has a positive influence on customer‐focused outcomes.
P499 Data and knowledge management has a positive influence on financial and market outcomes.
P500 Data and knowledge management has a positive influence on workforce‐focused outcomes.
P501 Data and knowledge management has a positive influence on process effectiveness outcomes.
P502 Data and knowledge management has a positive influence on leadership outcomes.
P503 Workforce engagement has a positive influence on senior leadership.
P504 Workforce engagement has a positive influence on governance and social responsibilities.
P505 Workforce engagement has a positive influence on strategy development.
P506 Workforce engagement has a positive influence on strategy deployment.
P507 Workforce engagement has a positive influence on customer and market knowledge.
P508 Workforce engagement has a positive influence on customer relationships and satisfaction.
P509 Workforce engagement has a positive influence on performance analysis, review, and improvement.
P510 Workforce engagement has a positive influence on data and knowledge management.
P511 Workforce engagement has a positive influence on workforce environment.
70

P512 Workforce engagement has a positive influence on work systems design.
P513 Workforce engagement has a positive influence on work process management and improvement.
P514 Workforce engagement has a positive influence on product and service outcomes.
P515 Workforce engagement has a positive influence on customer‐focused outcomes.
P516 Workforce engagement has a positive influence on financial and market outcomes.
P517 Workforce engagement has a positive influence on workforce‐focused outcomes.
P518 Workforce engagement has a positive influence on process effectiveness outcomes.
P519 Workforce engagement has a positive influence on leadership outcomes.
P520 Workforce environment has a positive influence on senior leadership.
P521 Workforce environment has a positive influence on governance and social responsibilities.
P522 Workforce environment has a positive influence on strategy development.
P523 Workforce environment has a positive influence on strategy deployment.
P524 Workforce environment has a positive influence on customer and market knowledge.
P525 Workforce environment has a positive influence on customer relationships and satisfaction.
P526 Workforce environment has a positive influence on performance analysis, review, and improvement.
P527 Workforce environment has a positive influence on data and knowledge management.
P528 Workforce environment has a positive influence on workforce engagement.
P529 Workforce environment has a positive influence on work systems design.
P530 Workforce environment has a positive influence on work process management and improvement.
P531 Workforce environment has a positive influence on product and service outcomes.
P532 Workforce environment has a positive influence on customer‐focused outcomes.
P533 Workforce environment has a positive influence on financial and market outcomes.
71

P534 Workforce environment has a positive influence on workforce‐focused outcomes.
P535 Workforce environment has a positive influence on process effectiveness outcomes.
P536 Workforce environment has a positive influence on leadership outcomes.
P537 Work systems design has a positive influence on senior leadership.
P538 Work systems design has a positive influence on governance and social responsibilities.
P539 Work systems design has a positive influence on strategy development.
P540 Work systems design has a positive influence on strategy deployment.
P541 Work systems design has a positive influence on customer and market knowledge.
P542 Work systems design has a positive influence on customer relationships and satisfaction.
P543 Work systems design has a positive influence on performance analysis, review, and improvement.
P544 Work systems design has a positive influence on data and knowledge management.
P545 Work systems design has a positive influence on workforce engagement.
P546 Work systems design has a positive influence on workforce environment.
P547 Work systems design has a positive influence on work process management and improvement.
P548 Work systems design has a positive influence on product and service outcomes.
P549 Work systems design has a positive influence on customer‐focused outcomes.
P550 Work systems design has a positive influence on financial and market outcomes.
P551 Work systems design has a positive influence on workforce‐focused outcomes.
P552 Work systems design has a positive influence on process effectiveness outcomes.
P553 Work systems design has a positive influence on leadership outcomes.
P554 Work process management and improvement has a positive influence on senior leadership.
P555 Work process management and improvement has a positive influence on governance and social responsibilities.
72

P556 Work process management and improvement has a positive influence on strategy development.
P557 Work process management and improvement has a positive influence on strategy deployment.
P558 Work process management and improvement has a positive influence on customer and market knowledge.
P559 Work process management and improvement has a positive influence on customer relationships and satisfaction.
P560 Work process management and improvement has a positive influence on performance analysis, review, and improvement.
P561 Work process management and improvement has a positive influence on data and knowledge management.
P562 Work process management and improvement has a positive influence on workforce engagement.
P563 Work process management and improvement has a positive influence on workforce environment.
P564 Work process management and improvement has a positive influence on work systems design.
P565 Work process management and improvement has a positive influence on product and service outcomes.
P566 Work process management and improvement has a positive influence on customer‐focused outcomes.
P567 Work process management and improvement has a positive influence on financial and market outcomes.
P568 Work process management and improvement has a positive influence on workforce‐focused outcomes.
P569 Work process management and improvement has a positive influence on process effectiveness outcomes.
P570 Work process management and improvement has a positive influence on leadership outcomes.
P571 Product and service outcomes have a positive influence on customer‐focused outcomes.
73

P572 Product and service outcomes have a positive influence on financial and market outcomes.
P573 Product and service outcomes have a positive influence on workforce‐focused outcomes.
P574 Product and service outcomes have a positive influence on process effectiveness outcomes.
P575 Product and service outcomes have a positive influence on leadership outcomes.
P576 Customer‐focused outcomes have a positive influence on product and service outcomes.
P577 Customer‐focused outcomes have a positive influence on financial and market outcomes.
P578 Customer‐focused outcomes have a positive influence on workforce‐focused outcomes.
P579 Customer‐focused outcomes have a positive influence on process effectiveness outcomes.
P580 Customer‐focused outcomes have a positive influence on leadership outcomes.
P581 Financial and market outcomes have a positive influence on product and service outcomes.
P582 Financial and market outcomes have a positive influence on customer‐focused outcomes.
P583 Financial and market outcomes have a positive influence on workforce‐focused outcomes.
P584 Financial and market outcomes have a positive influence on process effectiveness outcomes.
P585 Financial and market outcomes have a positive influence on leadership outcomes.
P586 Workforce‐focused outcomes have a positive influence on product and service outcomes.
P587 Workforce‐focused outcomes have a positive influence on customer‐focused outcomes.
P588 Workforce‐focused outcomes have a positive influence on financial and market outcomes.
74

P589 Workforce‐focused outcomes have a positive influence on process effectiveness outcomes.
P590 Workforce‐focused outcomes have a positive influence on leadership outcomes.
P591 Process effectiveness outcomes have a positive influence on product and service outcomes.
P592 Process effectiveness outcomes have a positive influence on customer‐focused outcomes.
P593 Process effectiveness outcomes have a positive influence on financial and market outcomes.
P594 Process effectiveness outcomes have a positive influence on workforce‐focused outcomes.
P595 Process effectiveness outcomes have a positive influence on leadership outcomes.
P596 Leadership outcomes have a positive influence on product and service outcomes.
P597 Leadership outcomes have a positive influence on customer‐focused outcomes.
P598 Leadership outcomes have a positive influence on financial and market outcomes.
P599 Leadership outcomes have a positive influence on workforce‐focused outcomes.
P600 Leadership outcomes have a positive influence on process effectiveness outcomes.
Table 8 provides a tabular view of the propositions of the MBNQA dimension level
framework.
75
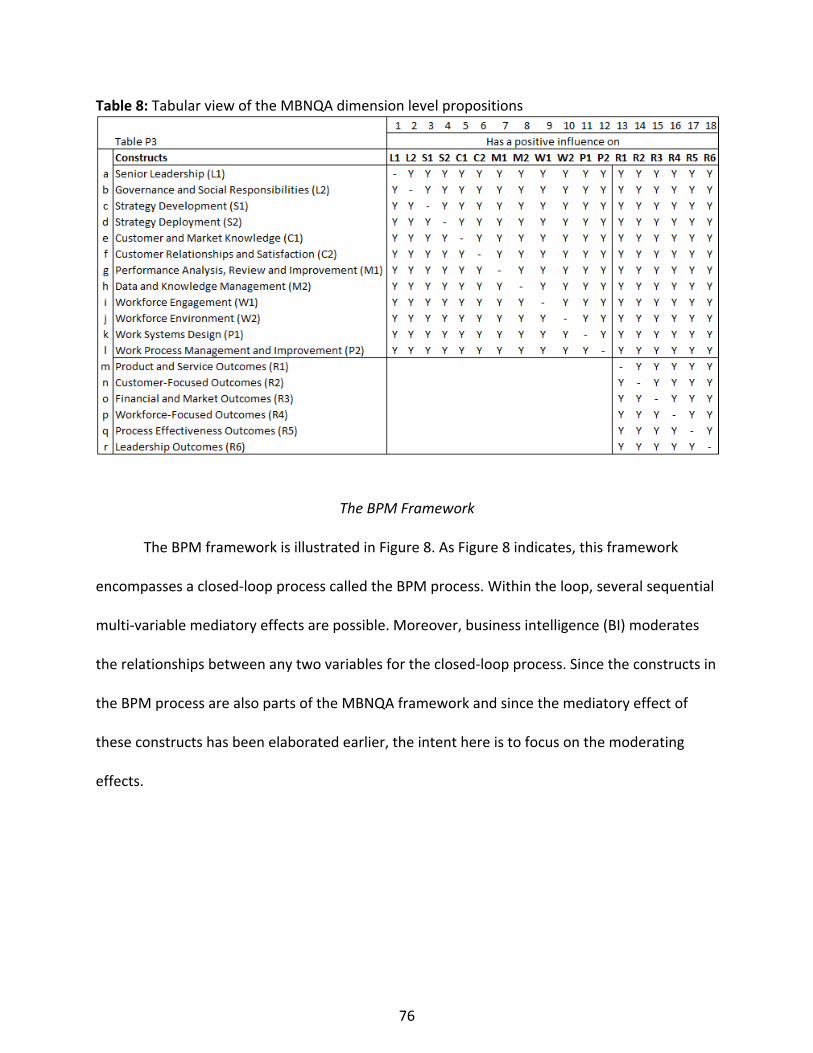
Table 8: Tabular view of the MBNQA dimension level propositions
The BPM Framework
The BPM framework is illustrated in Figure 8. As Figure 8 indicates, this framework
encompasses a closed‐loop process called the BPM process. Within the loop, several sequential
multi‐variable mediatory effects are possible. Moreover, business intelligence (BI) moderates
the relationships between any two variables for the closed‐loop process. Since the constructs in
the BPM process are also parts of the MBNQA framework and since the mediatory effect of
these constructs has been elaborated earlier, the intent here is to focus on the moderating
effects.
76

Figure 8: The proposed BPM framework (repeated)
BI is an enabler of BPM (Eckerson, 2005; Clark et al., 2007). For a successful
implementation of the BPM framework, organizations must integrate BI with BPM because
such integration allows them to compare, manage, and align business performance with the
business strategies, goals, and objectives (Ballard et al., 2005). BI turns available data into
information and puts it into the hands of decision makers. Ballard et al. (2005) posit that, by so
doing, BI helps BPM in two ways. First, strategic business intelligence helps BPM with strategic
issues such as increasing revenues, reducing costs, and introducing new products and services
by providing executives with relevant information. Second, tactical and operational business
intelligence helps BPM improve business execution in two ways: (1) monitoring workflow and
reporting operational results, and (2) monitoring workflow with the objective of improving and
managing the overall operational business process.
77
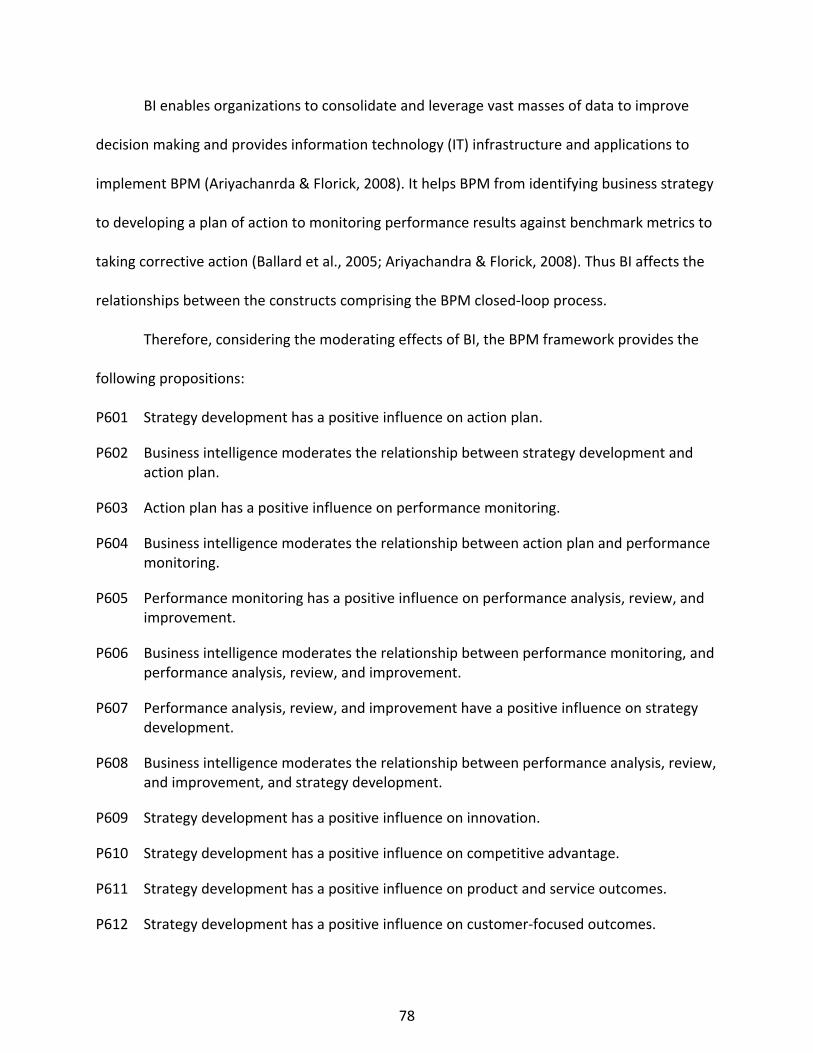
BI enables organizations to consolidate and leverage vast masses of data to improve
decision making and provides information technology (IT) infrastructure and applications to
implement BPM (Ariyachanrda & Florick, 2008). It helps BPM from identifying business strategy
to developing a plan of action to monitoring performance results against benchmark metrics to
taking corrective action (Ballard et al., 2005; Ariyachandra & Florick, 2008). Thus BI affects the
relationships between the constructs comprising the BPM closed‐loop process.
Therefore, considering the moderating effects of BI, the BPM framework provides the
following propositions:
P601 Strategy development has a positive influence on action plan.
P602 Business intelligence moderates the relationship between strategy development and action plan.
P603 Action plan has a positive influence on performance monitoring.
P604 Business intelligence moderates the relationship between action plan and performance monitoring.
P605 Performance monitoring has a positive influence on performance analysis, review, and improvement.
P606 Business intelligence moderates the relationship between performance monitoring, and performance analysis, review, and improvement.
P607 Performance analysis, review, and improvement have a positive influence on strategy development.
P608 Business intelligence moderates the relationship between performance analysis, review, and improvement, and strategy development.
P609 Strategy development has a positive influence on innovation.
P610 Strategy development has a positive influence on competitive advantage.
P611 Strategy development has a positive influence on product and service outcomes.
P612 Strategy development has a positive influence on customer‐focused outcomes.
78

P613 Strategy development has a positive influence on financial and market outcomes.
P614 Strategy development has a positive influence on workforce‐focused outcomes.
P615 Strategy development has a positive influence on process effectiveness outcomes.
P616 Strategy development has a positive influence on leadership outcomes.
P617 Action plan has a positive influence on innovation.
P618 Action plan has a positive influence on competitive advantage.
P619 Strategy development has a positive influence on product and service outcomes.
P620 Strategy development has a positive influence on customer‐focused outcomes.
P621 Strategy development has a positive influence on financial and market outcomes.
P622 Strategy development has a positive influence on workforce‐focused outcomes.
P623 Strategy development has a positive influence on process effectiveness outcomes.
P624 Strategy development has a positive influence on leadership outcomes.
P625 Performance monitoring has a positive influence on innovation.
P626 Performance monitoring has a positive influence on competitive advantage.
P627 Strategy development has a positive influence on product and service outcomes.
P628 Strategy development has a positive influence on customer‐focused outcomes.
P629 Strategy development has a positive influence on financial and market outcomes.
P630 Strategy development has a positive influence on workforce‐focused outcomes.
P631 Strategy development has a positive influence on process effectiveness outcomes.
P632 Strategy development has a positive influence on leadership outcomes.
P633 Performance analysis, review, and improvement have a positive influence on innovation.
P634 Performance analysis, review, and improvement have a positive influence on competitive advantage.
P635 Performance analysis, review, and improvement have a positive influence on product and service outcomes.
79

P636 Performance analysis, review, and improvement have a positive influence on customer‐focused outcomes.
P637 Performance analysis, review, and improvement have a positive influence on financial and market outcomes.
P638 Performance analysis, review, and improvement have a positive influence on workforce‐focused outcomes.
P639 Performance analysis, review, and improvement have a positive influence on process effectiveness outcomes.
P640 Performance analysis, review, and improvement have a positive influence on leadership outcomes.
P641 Innovation has a positive influence on competitive advantage.
P642 Innovation has a positive influence on product and service outcomes.
P643 Innovation has a positive influence on customer‐focused outcomes.
P644 Innovation has a positive influence on financial and market outcomes.
P645 Innovation has a positive influence on workforce‐focused outcomes.
P646 Innovation has a positive influence on process effectiveness outcomes.
P647 Innovation has a positive influence on leadership outcomes.
P648 Competitive advantage has a positive influence on innovation.
P649 Competitive advantage has a positive influence on product and service outcomes.
P650 Competitive advantage has a positive influence on customer‐focused outcomes.
P651 Competitive advantage has a positive influence on financial and market outcomes.
P652 Competitive advantage has a positive influence on workforce‐focused outcomes.
P653 Competitive advantage has a positive influence on process effectiveness outcomes.
P654 Competitive advantage has a positive influence on leadership outcomes.
P655 Product and service outcomes have a positive influence on innovation.
P656 Product and service outcomes have a positive influence on competitive advantage.
P657 Product and service outcomes have a positive influence on customer‐focused outcomes.
80

P658 Product and service outcomes have a positive influence on financial and market outcomes.
P659 Product and service outcomes have a positive influence on workforce‐focused outcomes.
P660 Product and service outcomes have a positive influence on process effectiveness outcomes.
P661 Product and service outcomes have a positive influence on leadership outcomes.
P662 Customer‐focused outcomes have a positive influence on innovation.
P663 Customer‐focused outcomes have a positive influence on competitive advantage.
P664 Customer‐focused outcomes have a positive influence on product and service outcomes.
P665 Customer‐focused outcomes have a positive influence on financial and market outcomes.
P666 Customer‐focused outcomes have a positive influence on workforce‐focused outcomes.
P667 Customer‐focused outcomes have a positive influence on process effectiveness outcomes.
P668 Customer‐focused outcomes have a positive influence on leadership outcomes.
P669 Financial and market outcomes have a positive influence on innovation.
P670 Financial and market outcomes have a positive influence on competitive advantage.
P671 Financial and market outcomes have a positive influence on product and service outcomes.
P672 Financial and market outcomes have a positive influence on customer‐focused outcomes.
P673 Financial and market outcomes have a positive influence on workforce‐focused outcomes.
P674 Financial and market outcomes have a positive influence on process effectiveness outcomes.
P675 Financial and market outcomes have a positive influence on leadership outcomes.
P676 Workforce‐focused outcomes have a positive influence on innovation.
81
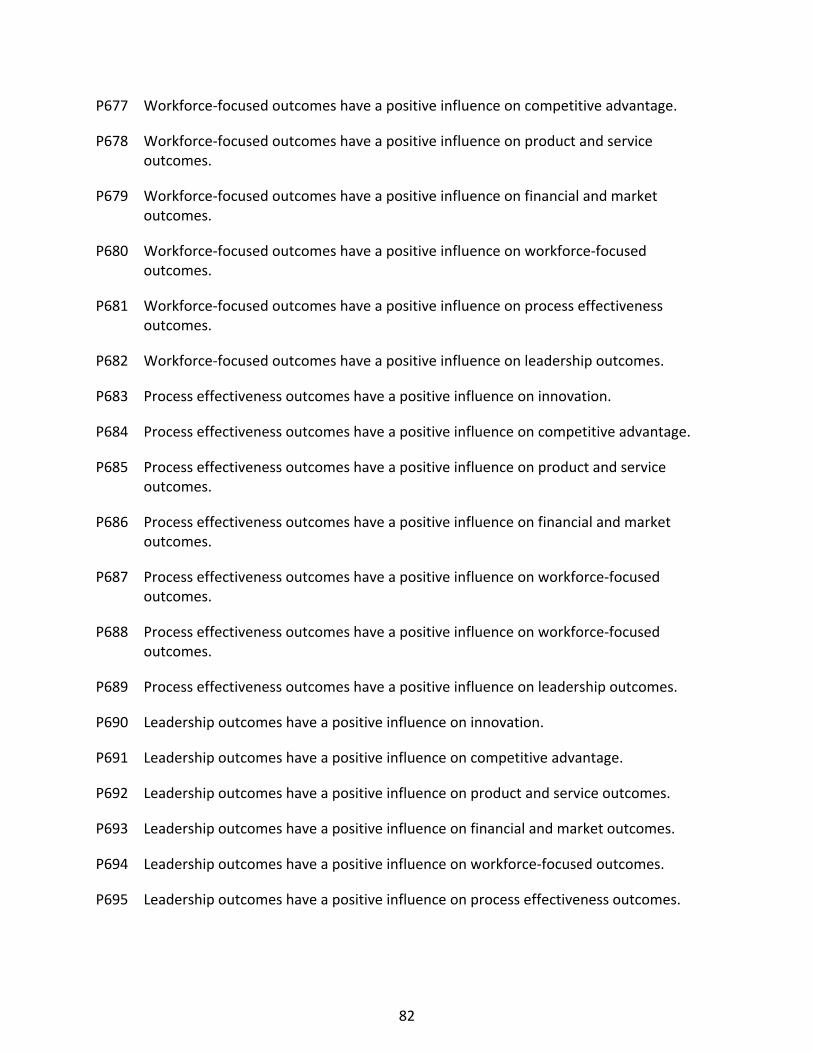
P677 Workforce‐focused outcomes have a positive influence on competitive advantage.
P678 Workforce‐focused outcomes have a positive influence on product and service outcomes.
P679 Workforce‐focused outcomes have a positive influence on financial and market outcomes.
P680 Workforce‐focused outcomes have a positive influence on workforce‐focused outcomes.
P681 Workforce‐focused outcomes have a positive influence on process effectiveness outcomes.
P682 Workforce‐focused outcomes have a positive influence on leadership outcomes.
P683 Process effectiveness outcomes have a positive influence on innovation.
P684 Process effectiveness outcomes have a positive influence on competitive advantage.
P685 Process effectiveness outcomes have a positive influence on product and service outcomes.
P686 Process effectiveness outcomes have a positive influence on financial and market outcomes.
P687 Process effectiveness outcomes have a positive influence on workforce‐focused outcomes.
P688 Process effectiveness outcomes have a positive influence on workforce‐focused outcomes.
P689 Process effectiveness outcomes have a positive influence on leadership outcomes.
P690 Leadership outcomes have a positive influence on innovation.
P691 Leadership outcomes have a positive influence on competitive advantage.
P692 Leadership outcomes have a positive influence on product and service outcomes.
P693 Leadership outcomes have a positive influence on financial and market outcomes.
P694 Leadership outcomes have a positive influence on workforce‐focused outcomes.
P695 Leadership outcomes have a positive influence on process effectiveness outcomes.
82

CHAPTER 3
RESEARCH METHODOLOGY
The research methodology used to test the research models posed in Chapter 2 is
expounded in this chapter. This study uses the traditional latent semantic analysis (LSA) and the
causal latent semantic analysis (cLSA) to validate both the business performance management
(BPM) framework and the Malcolm Baldrige National Quality Award (MBNQA) framework.
LSA is both a theory and a method that extracts the contextual‐usage meaning of words
and obtains approximate estimates of the kinds of meaning similarities among words and text
segments in a large corpus (Landauer et al., 1998). Landauer et al. (1998) posit that “the
similarity estimates derived by LSA are not simple contiguity frequencies, co‐occurrence counts,
or correlations in usage, but depend on powerful mathematical analysis that is capable of
correctly inferring much deeper relations” (p. 260). Chapter 2 presented an overview of LSA. To
illustrate the LSA methodology, a small database of 7 short documents was created. Each step
of the latent semantic analysis is illustrated in Appendix A.
The causal LSA (cLSA) is a modification and thus a derivative of the traditional latent
semantic analysis. In addition to uncovering the latent factors, the cLSA establishes causal
relationships among these factors based on the input and output statements contained in the
factors. The cLSA performs LSA on a corpus comprised of input and output statements obtained
from text passages. The detail discussion and illustration of cLSA is provided in Appendix B.
The LSA methodology delineated in Appendix A can easily be duplicated in other
applications involving text data. This study conducts LSAs of two levels of granularity – a two‐
factor LSA and a ten‐factor LSA – on Corpus 2. These LSAs are used to find two‐factor and ten‐
83

factor latent semantic structures from the 229 article abstracts published in the International
Journal of Business Performance Management (IJBPM) from 1998 to 2008.
The cLSA methodology illustrated in Appendix B can also be duplicated in other
applications involving textual data that produces input‐output statements. This study uses cLSA
to validate the MBNQA and BPM frameworks. I performed cLSAs on Corpus 1 to uncover latent
factors and establish relationships between them for the MBNQA framework. Similarly, cLSAs
were conducted on Corpus 3 to test the BPM framework.
Corpus 1: MBNQA Input‐Output (XY) Statements
The text passages for this corpus include article abstracts on the Baldrige Award and
program published in practitioner and academic journals from 1987 to 2009. The EBSCOhost
search engine was used to obtain the article abstracts. The keyword search was performed
within four databases including Academic Search Complete, Business Source Complete,
Education Research Complete, and Health Source: Nursing/Academic Edition. These databases
were chosen so as to cover the possible avenues of publications on the Baldrige Award and
program in the business/nonprofit, education, and healthcare criteria. The keywords included
the following terms: Baldrige, “Baldrige Award,” “Baldrige Awards,” “Baldrige program,”
“Baldrige Programs,” “Baldrige Award recipient,” “Baldrige Award recipients,” “Baldrige
recipient,” “Baldrige recipients,” “criteria for excellence”, MBNQA, “Malcolm Baldrige Award,”
“Malcolm Baldrige program,” and “Malcolm Baldrige National Quality Award”. The search with
all publication types (periodical, newspaper, book, primary source document, education report,
health report, academic journal, trade publication, industry profile, country report, conference
paper, and reference book) resulted in 1827 hits. Limiting the search within scholarly (peer
84

reviewed) journals produced 576 hits. Removing the editorials, reviews, announcements, news,
etc. from the list provided 307 usable abstracts.
The 307 usable abstracts were then examined for potential input‐output (i.e., XY)
statements. Not all of these abstracts qualified for XY statements. Let’s consider the following
two abstracts. The sentences that provide XY statements are italicized. While Abstract 1
contains XY statements, Abstract 2 does not.
Abstract 1: US Government organizations are creating value for their citizens and businesses by improving their public service delivery through good websites. Our study examined leadership and IT quality, and their effect on positive delivery outcomes in an e‐government environment. We first developed a theoretically based model using elements of the model developed for the Malcolm Baldrige National Quality Award (MBNQA) and DeLone and McLean's IS Success model. To test this model, we conducted a field survey at a municipal city government. The results supported our hypothesis that the MBNQA leadership triad (leadership, strategic planning, and customer/market focus) had a positive impact on the IT quality triad (information, system, and service quality). We also found that both leadership and IT quality increased the benefits.
Abstract 2: In this study, a Malcolm Baidrige National Quality Award (MBNQA) criteria‐based survey was used to assess the quality status of organizations that employ quality professionals. The objective was to focus on the relationship between leadership (IS), information and analysis, human resource planning, process quality, and customer focus. The result was the development of an MBNQA‐based model that demonstrated the relationship between executive IS and the MBNQA factors.
The examination of the 307 abstracts revealed that only 87 abstracts contained input‐
output statements (see Appendix C for Input‐Output Coding Scheme). These final 87 abstracts
provided 193 input‐output statement pairs. Therefore, this corpus includes 193 input‐output
statements obtained from 87 article abstracts that were published in 51 journals from 1987 to
85
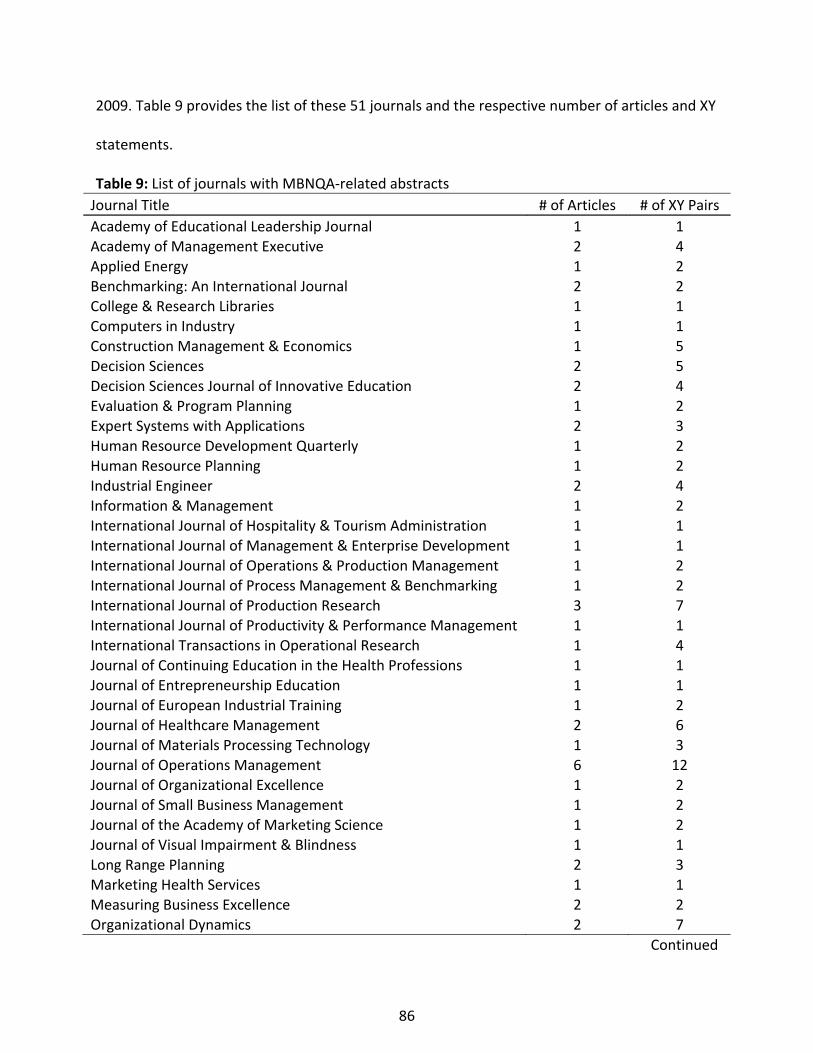
2009. Table 9 provides the list of these 51 journals and the respective number of articles and XY
statements.
Table 9: List of journals with MBNQA‐related abstracts Journal Title # of Articles # of XY Pairs Academy of Educational Leadership Journal 1 1 Academy of Management Executive 2 4 Applied Energy 1 2 Benchmarking: An International Journal 2 2 College & Research Libraries 1 1 Computers in Industry 1 1 Construction Management & Economics 1 5 Decision Sciences 2 5 Decision Sciences Journal of Innovative Education 2 4 Evaluation & Program Planning 1 2 Expert Systems with Applications 2 3 Human Resource Development Quarterly 1 2 Human Resource Planning 1 2 Industrial Engineer 2 4 Information & Management 1 2 International Journal of Hospitality & Tourism Administration 1 1 International Journal of Management & Enterprise Development 1 1 International Journal of Operations & Production Management 1 2 International Journal of Process Management & Benchmarking 1 2 International Journal of Production Research 3 7 International Journal of Productivity & Performance Management 1 1 International Transactions in Operational Research 1 4 Journal of Continuing Education in the Health Professions 1 1 Journal of Entrepreneurship Education 1 1 Journal of European Industrial Training 1 2 Journal of Healthcare Management 2 6 Journal of Materials Processing Technology 1 3 Journal of Operations Management 6 12 Journal of Organizational Excellence 1 2 Journal of Small Business Management 1 2 Journal of the Academy of Marketing Science 1 2 Journal of Visual Impairment & Blindness 1 1 Long Range Planning 2 3 Marketing Health Services 1 1 Measuring Business Excellence 2 2 Organizational Dynamics 2 7
Continued
86

Table 9: Continued Journal Title # of Articles # of XY Pairs Production & Inventory Management Journal 3 3 Production Planning & Control 1 3 Professional Safety 1 2 Public Manager 1 3 Public Performance & Management Review 1 4 Quality & Reliability Engineering International 1 1 Quality Assurance 1 9 Quality Management in Health Care 1 3 Quality Management Journal 3 4 Quality Progress 5 9 SAM Advanced Management Journal 2 14 Sloan Management Review 1 1 Total Quality Management 4 17 Total Quality Management & Business Excellence 5 10 TQM Magazine 4 7 Total 87 193
Corpus 2: IJBPM Abstracts
This corpus consists of all article abstracts from the International Journal of Business
Performance Management (IJBPM) since its inception in 1998. I selected IJBPM because its
objectives are to develop, promote and coordinate the practice of business performance
management. IJBPM examines various perspectives in managing business performance and
provides an interactive platform for academics, professionals and practitioners working in the
areas of performance measurement and management. From 1998 to 2008, IJBPM published
229 articles on business performance management in 10 volumes with 30 issues. The abstracts
of these 229 articles make up Corpus 2 for this study.
Corpus 3: BPM Input‐Output (XY) Statements
This corpus includes full body text data from all articles published in the practitioner
BPM journal entitled the Business Performance Management Magazine since its inception in
87

2003. In addition, some white papers were also considered. The Google Scholar was used to
identify these papers by using key words such as business performance, performance
management, and business performance management. A total of 128 full body articles were
collected. Each of these articles was carefully examined with a view to obtain input‐output
statements contained in them. Using the input‐output coding guidelines presented in Appendix
C and thorough examination of the 128 articles resulted in 622 pairs of input and output
statements, which comprise the BPM Corpus 3.
88
CHAPTER 4
ANALYSES AND RESULTS
In this study, I used the latent semantic analysis (LSA) (see Appendix A) and the causal
latent semantic analysis (cLSA) (see Appendix B) to analyze textual data. The LSA was
performed on Corpus 2 to uncover the latent structures contained in the International Journal
of Business Performance Management (IJBPM) abstracts. The cLSA was conducted on Corpus 1
to reveal latent factors contained in the data and to validate the Malcolm Baldrige National
Quality Award (MBNQA) framework. The cLSA of Corpus 3 was used to validate the proposed
business performance management (BPM) framework.
cLSA of Corpus 1
The corpus comprises of 193 input‐output statement pairs. Combining the input and the
output statements and then removing the duplicates resulted in a corpus of 326 statements
with a dictionary of 743 terms. I used a customized list of stopwords. Stopwords are trivial
English words such as a, an, the, and, etc. My list included several additional words such as
model, framework, paper, study, etc. to the list of stopwords developed by the System for the
Mechanical Analysis and Retrieval of Text (SMART) at Cornell University (Salton & Buckley,
1988). The elimination of stopwords from the dictionary and then the use of Porter term
stemming (Porter, 1980) on the remaining words produced a dictionary of 427 relevant terms.
Therefore, the X matrix obtained from Corpus 1 is a 427 X 326 term‐by‐statement X matrix.
I followed a common method (Frakes & Baeza‐Yates, 1992, p. 373; Salton & Buckley,
1988) to transform and normalize the frequencies of the term‐by‐statement X matrix. The term
frequency tfij was replaced with the product wij = tfij * idfi , where idfi = ( ) 1log2 +inN , N is the
89

number of documents in the collection, tfij is the raw term frequency of term i in document j, ni
is the term frequency of term i in the entire collection of documents, and the inverse document
frequency (IDF) idfi. The product wij = tfij * idfi serves as a metric of rarity of term i in the entire
collection of documents. The cLSAs were performed on the transformed X matrix to validate
two‐factor and seven‐factor MBNQA frameworks.
A Two‐Factor Causal MBNQA Framework
Table 10 provides a summary of the two factors. The first factor deals with assessment
of an organization’s management system. This factor embodies self‐assessment of a system and
a comprehensive assessment of an organization’s performance improvements. The focus is on
providing a systems perspective of self‐assessment and of performance assessment indicators.
The principal performance assessment indicators discussed in this factor include the leadership
performance, business improvement, success of the total quality management (TQM)
implementation, human resource development, and organizational development. The second
factor includes components such as leadership, strategic planning, performance management,
information analysis, business processes, customer and market, etc. Therefore, this factor
describes the Baldrige System.
As discussed in Appendix B (Table B12 and Table B13), the inter‐factor frequency
measures and their percentages were developed for the MBNQA factors. These measures are
presented in Table 11 and Table 12, respectively. Figure 9 portrays the inter‐factor relationships
based on the percentage measures given in Table 12.
90

Table 10: Summary of two factors of the causal MBNQA framework
Factor Factor Label Factor Description High Loading Terms
(Stemmed) High Loading Statements F1 Assessment Assessment of
management's system ‐ leadership performance, process measurement, business improvement, TQM implementation, human resource improvement, results of change, organizational development, etc.
system (2.0053), manag (1.0164), assess (0.8355), perform (0.7839), leadership (0.6994), process (0.6529), measur (0.5664)
Mann and Grigg 2004 X01 (0.7161), Douglas and Fredendall 2004 X02 (0.6667), Douglas and Fredendall 2004 Y01 (0.6667), Wilson and Collier 2000 X02 (0.6667), Wilson and Collier 2000 Y01 (0.6667)
F2 The System Components of management's system ‐ effective leadership, performance management, organizational processes, strategic planning, business customer and market, information analysis, etc.
leadership (2.2498), effect (0.8085), result (0.64), manag (0.536), perform (0.5257), process (0.3842), organiz (0.3456), plan (0.2794), strateg (0.2579), busi (0.2537), custom (0.2231), market (0.2068)
Bell and Elkins 2004 X06 (0.8136), Douglas and Fredendall 2004 X01 (0.8136), Husain et al. 2001 X05 (0.8136), Prybutok et al. 2008 X01 (0.8136), Wilson and Collier 2000 X01 (0.8136),Warwood and Anthony 2003 X04 (0.7707)
91

Table 11: Inter‐factor frequency measures X Factors Y Factors Assessment Baldrige System Y‐index Assessment 58 50 108 Baldrige System 59 54 113 X‐index 117 104 X ‐ Y differential 9 ‐9
Table 12: Inter‐factor percentage measures X Factors Y Factors Assessment Baldrige System Y‐index Assessment 0.26 0.23 0.49 Baldrige System 0.27 0.24 0.51 X‐index 0.53 0.47 X ‐ Y differential 0.04 ‐0.04
Figure 9: Causal semantic net for two‐factor MBNQA framework
The inter‐factor causal relationship coefficients are shown within parentheses. All figures within parentheses are in percent, totaling 100%. The coefficients within the parentheses of each circle indicate the effect of the factors on themselves. In other words, these numbers show the intra‐factor causal relationship.
A Seven‐Factor Causal MBNQA Framework
Table 13 provides a summary of the seven factors. Systems assessment is an umbrella
term that embodies the assessment of a number of systems including an organization’s
management system, measurement system, change management systems, quality
92

management systems such as total quality management system, strategic quality management
system, soft quality system, and cost management system. Leadership triad is comprised of
three category level constructs of the Baldrige framework. These constructs are leadership,
strategic planning, and customer and market focus. Business results refer to organizational
achievements and excellences. The reflection of organizational excellence is exhibited by
improved operational and financial results, improved business strategy, improved
organizational effectiveness, improved business processes, improved organizational
capabilities, and improved organizational performance practices. Management of quality
includes the concepts of the quality management program, quality management process,
quality management implementation, quality management effectiveness, total quality
management, and quality management system. Performance measurement focuses on the
management, improvement, and comprehensive assessment of organizational performance. It
deals with the alignment of performance measures to overall activities. Process improvement
embeds the concepts of business process management, performance, and continuous
improvement. Finally, change and organizational culture includes the creation, enforcement,
and management of change that is compatible with organizational culture.
93
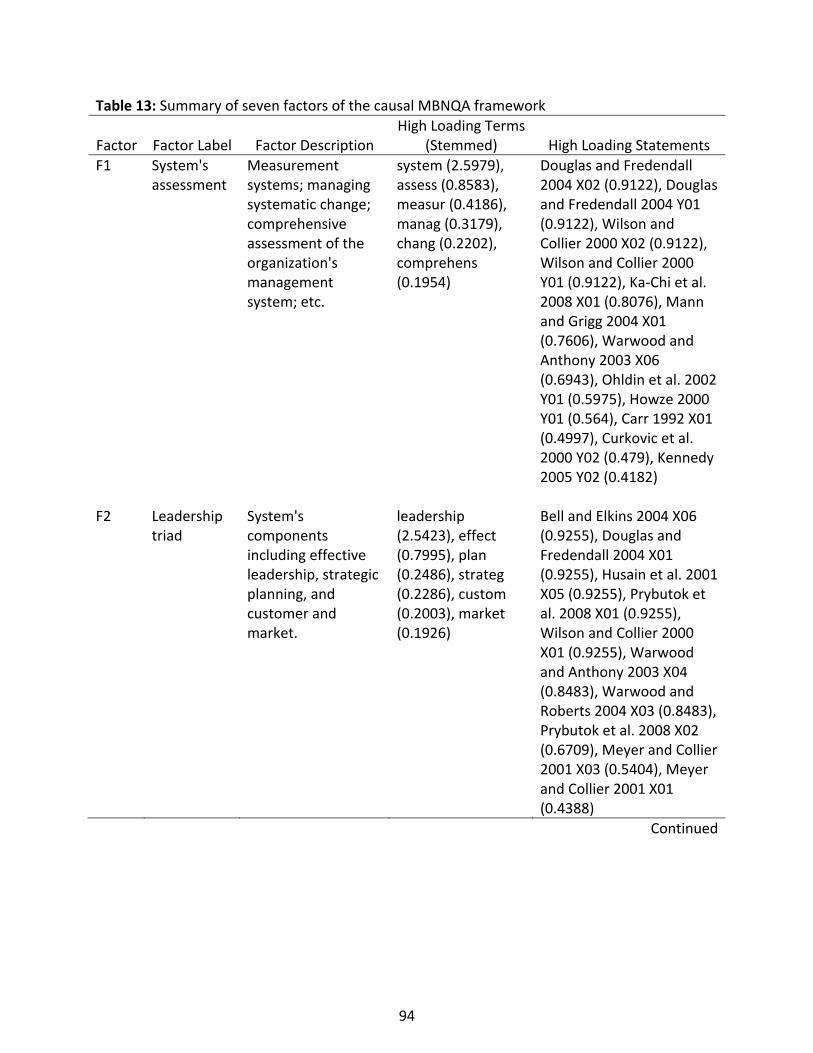
Table 13: Summary of seven factors of the causal MBNQA framework
Factor Factor Label Factor Description High Loading Terms
(Stemmed) High Loading Statements F1 System's
assessment Measurement systems; managing systematic change; comprehensive assessment of the organization's management system; etc.
system (2.5979), assess (0.8583), measur (0.4186), manag (0.3179), chang (0.2202), comprehens (0.1954)
Douglas and Fredendall 2004 X02 (0.9122), Douglas and Fredendall 2004 Y01 (0.9122), Wilson and Collier 2000 X02 (0.9122), Wilson and Collier 2000 Y01 (0.9122), Ka‐Chi et al. 2008 X01 (0.8076), Mann and Grigg 2004 X01 (0.7606), Warwood and Anthony 2003 X06 (0.6943), Ohldin et al. 2002 Y01 (0.5975), Howze 2000 Y01 (0.564), Carr 1992 X01 (0.4997), Curkovic et al. 2000 Y02 (0.479), Kennedy 2005 Y02 (0.4182)
F2 Leadership triad
System's components including effective leadership, strategic planning, and customer and market.
leadership (2.5423), effect (0.7995), plan (0.2486), strateg (0.2286), custom (0.2003), market (0.1926)
Bell and Elkins 2004 X06 (0.9255), Douglas and Fredendall 2004 X01 (0.9255), Husain et al. 2001 X05 (0.9255), Prybutok et al. 2008 X01 (0.9255), Wilson and Collier 2000 X01 (0.9255), Warwood and Anthony 2003 X04 (0.8483), Warwood and Roberts 2004 X03 (0.8483), Prybutok et al. 2008 X02 (0.6709), Meyer and Collier 2001 X03 (0.5404), Meyer and Collier 2001 X01 (0.4388)
Continued
94

Table 13: Continued
Factor Factor Label Factor Description High Loading
Terms (Stemmed) High Loading Statements F3 Business
results Business results and organizational excellence ‐ improved operational and financial results, improved business strategy, improved organizational effectiveness, improved business processes, improved organizational capabilities, etc.
result (2.4313), busi (0.6546), organiz (0.54), excel (0.4259)
Angell and Corbett 2009 Y01 (0.9113), Douglas and Fredendall 2004 Y02 (0.9113), Lee et al. 2003 Y01 (0.9113), Wilson and Collier 2000 Y02 (0.9113), Mann and Grigg 2004 Y01 (0.7881), Brokaw and Mullins 2007 Y03 (0.7401), Dean and Tomovic 2004 Y02 (0.7272), Meyer and Collier 2001 Y01 (0.5598), Bou‐Llusar et al. 2009 Y01 (0.4714), Sila and Ebrahimpur 2003 Y01 (0.4503), Frazier 2008 Y02 (0.4253), Rancour 2005 Y02 (0.391), Mellat‐Parast et al. 2007 Y01 (0.385)
F4 Management of quality
Quality management implementation; quality management program; quality management effectiveness; total quality management; etc.
manag (1.7665), implement (0.9354), tqm (0.8538), total (0.724), success (0.6142)
Ka‐Chi et al. 2008 X03 (0.643), York and Miree 2004 X01 (0.643), Mellat‐Parast et al. 2007 X02 (0.6314), Mellat‐Parast et al. 2007a Y02 (0.6314), Ka‐Chi et al. 2008 X04 (0.615), Kujala and Lillrank 2004 Y01 (0.569), Warwood and Anthony 2003 Y01 (0.5442), Meyer and Collier 2001 X02 (0.5289), Terziovski et al. 1999 X01 (0.498)
Continued
95
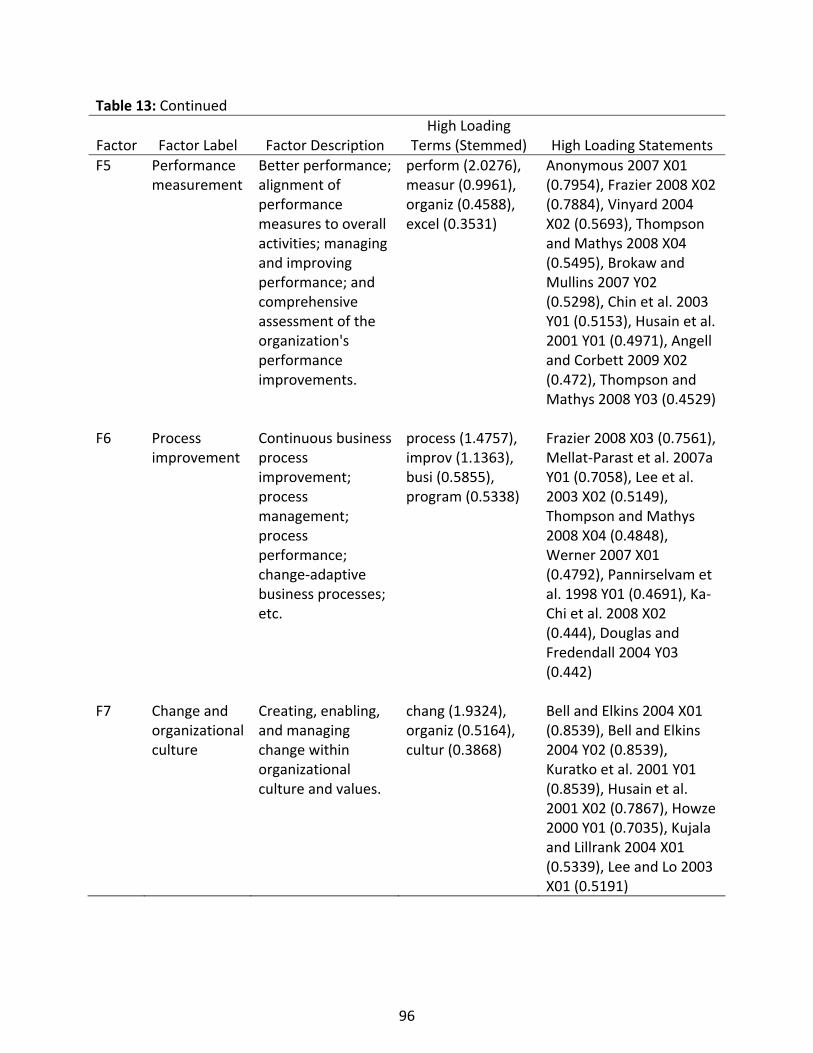
Table 13: Continued
Factor Factor Label Factor Description High Loading
Terms (Stemmed) High Loading Statements F5 Performance
measurement Better performance; alignment of performance measures to overall activities; managing and improving performance; and comprehensive assessment of the organization's performance improvements.
perform (2.0276), measur (0.9961), organiz (0.4588), excel (0.3531)
Anonymous 2007 X01 (0.7954), Frazier 2008 X02 (0.7884), Vinyard 2004 X02 (0.5693), Thompson and Mathys 2008 X04 (0.5495), Brokaw and Mullins 2007 Y02 (0.5298), Chin et al. 2003 Y01 (0.5153), Husain et al. 2001 Y01 (0.4971), Angell and Corbett 2009 X02 (0.472), Thompson and Mathys 2008 Y03 (0.4529)
F6 Process improvement
Continuous business process improvement; process management; process performance; change‐adaptive business processes; etc.
process (1.4757), improv (1.1363), busi (0.5855), program (0.5338)
Frazier 2008 X03 (0.7561), Mellat‐Parast et al. 2007a Y01 (0.7058), Lee et al. 2003 X02 (0.5149), Thompson and Mathys 2008 X04 (0.4848), Werner 2007 X01 (0.4792), Pannirselvam et al. 1998 Y01 (0.4691), Ka‐Chi et al. 2008 X02 (0.444), Douglas and Fredendall 2004 Y03 (0.442)
F7 Change and organizational culture
Creating, enabling, and managing change within organizational culture and values.
chang (1.9324), organiz (0.5164), cultur (0.3868)
Bell and Elkins 2004 X01 (0.8539), Bell and Elkins 2004 Y02 (0.8539), Kuratko et al. 2001 Y01 (0.8539), Husain et al. 2001 X02 (0.7867), Howze 2000 Y01 (0.7035), Kujala and Lillrank 2004 X01 (0.5339), Lee and Lo 2003 X01 (0.5191)
96

The inter‐factor frequency measures and their percentages of the above factors are
presented in Table 14 and Table 15, respectively. Causal semantic net shows the inter‐factor
causal relationships among the factors. Figure 10 portrays the causal semantic net developed
based on the percentage measures given in Table 15.
Table 14: Inter‐factor frequency measures for seven‐factor MBNQA framework
Y Factors System
's assessm
ent
Leadership triad
Busine
ss results
Managem
ent o
f quality
Performance m
easuremen
t
Process im
provem
ent
Change and
organizational culture
Y‐inde
x
System's assessment 2 5 0 2 2 2 0 13 Leadership triad 1 3 0 1 2 3 3 13 Business results 5 3 0 8 4 11 6 37 Management of quality 3 5 2 8 5 9 7 39 Performance measurement 5 3 2 5 9 5 6 35 Process improvement 3 5 2 14 2 11 9 46 Change and organizational culture 3 6 1 3 1 8 5 27 X‐index 22 30 7 41 25 49 36 X ‐ Y differential 9 17 ‐30 2 ‐10 3 9
97
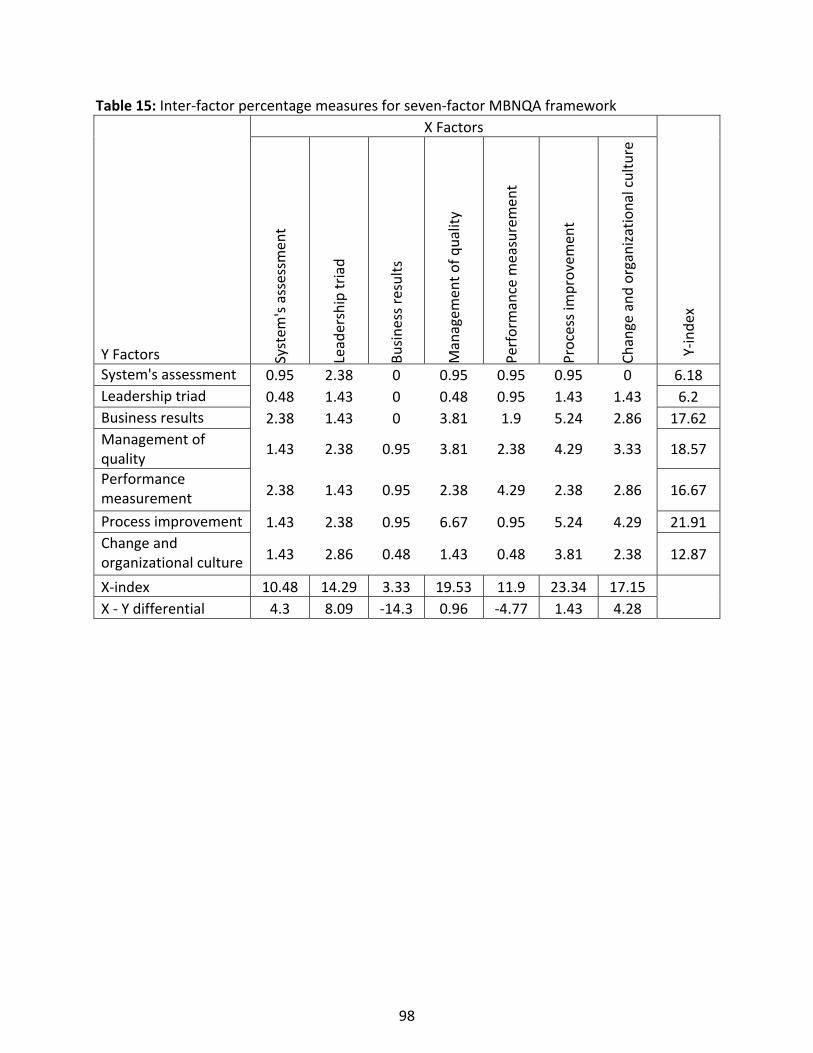
Table 15: Inter‐factor percentage measures for seven‐factor MBNQA framework X Factors
Y Factors System
's assessm
ent
Leadership triad
Busine
ss results
Managem
ent o
f quality
Performance m
easuremen
t
Process im
provem
ent
Change and
organizational culture
Y‐inde
x
System's assessment 0.95 2.38 0 0.95 0.95 0.95 0 6.18 Leadership triad 0.48 1.43 0 0.48 0.95 1.43 1.43 6.2 Business results 2.38 1.43 0 3.81 1.9 5.24 2.86 17.62 Management of quality
1.43 2.38 0.95 3.81 2.38 4.29 3.33 18.57
Performance measurement 2.38 1.43 0.95 2.38 4.29 2.38 2.86 16.67
Process improvement 1.43 2.38 0.95 6.67 0.95 5.24 4.29 21.91 Change and organizational culture 1.43 2.86 0.48 1.43 0.48 3.81 2.38 12.87
X‐index 10.48 14.29 3.33 19.53 11.9 23.34 17.15 X ‐ Y differential 4.3 8.09 ‐14.3 0.96 ‐4.77 1.43 4.28
98

Figure 10: Causal semantic net for seven‐factor MBNQA framework
(2.86 | .48)
(1.43 | 2.38)
7.1 System’s
assessment(.95)
7.2 Leadership
triad(1.43)
7.4 Management of quality(3.81)
7.6 Process
improvement(5.24)
7.5 Performance measurement
(4.29)
7.3 Business results(0)
7.7 Change and organizational
culture(2.38)
(0 | 2.3
8)
(.95 | 2.38)
(.95 | 1.43)
(.48 | 2.38)
(.95 | 1.43)
(1.9 | .95)
(.48 | 4.29)
(4.29 | 6.67)
(2.38 | 3.81)
(.95 | 2
.38)
(.95 | 3
.81)
(0 | 1.43)
(2.38 | .48)
(0 | 1.43)
(3.33 | 1.43)
The inter‐factor causal relationship coefficients are shown within parentheses. All figures within parentheses are in percent, totaling 100%. A double‐headed arrow connecting two factors indicates reciprocal causal relationships between the connected factors. The strengths of the relationships are shown within parentheses positioned in the middle of the arrows. There are two coefficients within the parentheses of each double‐headed arrow. The coefficient closer to a factor indicates the strength of the effect that the distant factor has on the closer factor. For instance, the inter‐factor causal relationship coefficients between Factor 7.1 and Factor 7.2 are shown as (2.38 | .48). The coefficient 2.38 is closer to Factor 7.1 and thus demonstrates the strength of effect that Factor 7.2 has on Factor 7.1. Similarly, the coefficient .48 shows the strength of effect of Factor 7.1 on Factor 7.2. The coefficients within the parentheses of each circle indicate the effect of the factors on themselves. In other words, these numbers show the intra‐factor causal relationship.
99

LSA of Corpus 2
Corpus 2 consists of all article abstracts published in the International Journal of
Business Performance Management since its inception in 1998. Considerable care was taken in
the data collection process in order to ensure the accuracy of the data. Each abstract was
collected individually from the journal’s website and recorded to an Excel worksheet. Multiple
checks were performed to avoid data anomaly. The final corpus included 229 documents (i.e.,
article abstracts) with 3,838 words. In order to create a dictionary of relevant terms, the
dictionary of these 3,838 raw words was subjected to a process of term filtering, term
stemming (Porter, 1980), and communality filtering (Sidorova, Evangelopoulos, Valacich, &
Ramakrishnan, 2008). Term filtering included the removal of numbers, dates, symbols, unique
words, and stopwords from the dictionary. The removal of numbers, dates, and symbols
produced a dictionary of 3,756 words. The elimination of unique words reduced the dictionary
size to 1,888. Unique words are the words that appear in only one document. The justification
for exclusion of these words from the dictionary is that if a word is mentioned in only one
document then it is not part of a semantic pattern. The stopwords such as ‘a’, ‘an’, ‘for’, ‘of’,
‘the’, etc. were then eliminated from the dictionary. The list of stopwords consisted of the
standard 571 common words developed by the System for the Mechanical Analysis and
Retrieval of Text (SMART) at Cornell University (Salton & Buckley, 1988). The dictionary
consisted of 1,457 uncommon words after term filtering. The application of Porter (1980) term
stemming resulted in 1,128 unique stemmed words. An initial LSA performed on the dictionary
of these stemmed words revealed that 33% of the words contributed to only 4% of the total
variance. Therefore, these words were filtered out as a result of communality filtering. Thus,
100
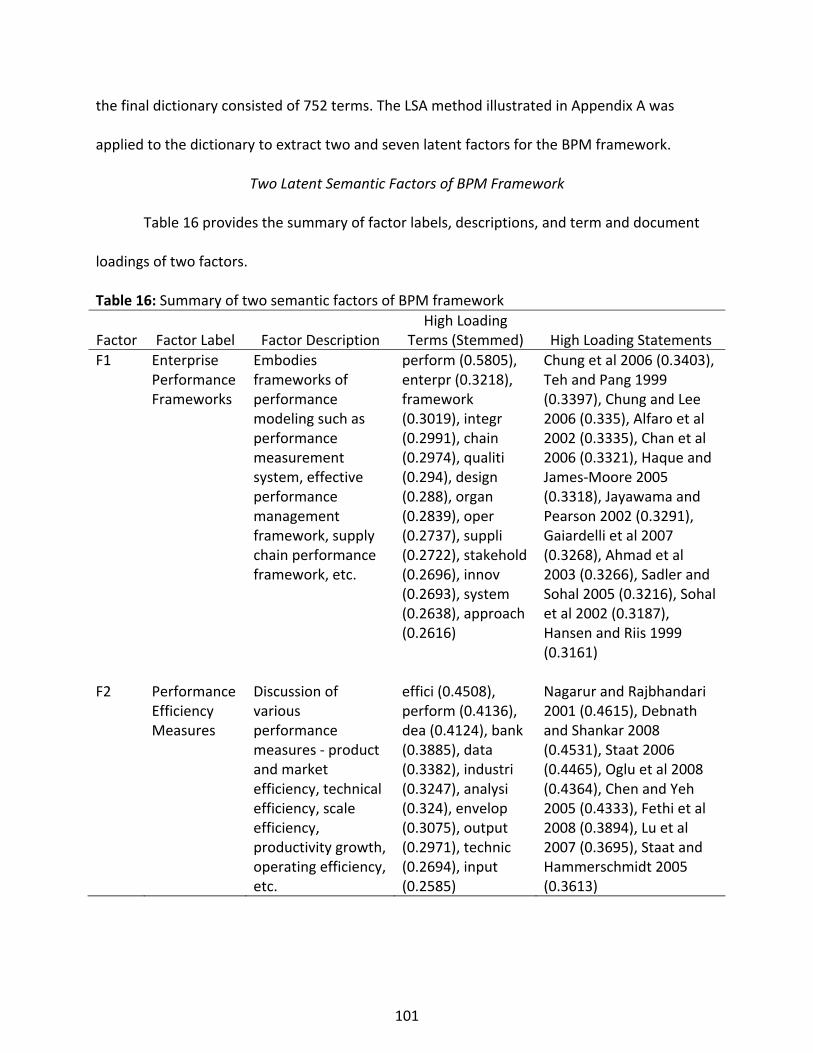
the final dictionary consisted of 752 terms. The LSA method illustrated in Appendix A was
applied to the dictionary to extract two and seven latent factors for the BPM framework.
Two Latent Semantic Factors of BPM Framework
Table 16 provides the summary of factor labels, descriptions, and term and document
loadings of two factors.
Table 16: Summary of two semantic factors of BPM framework
Factor Factor Label Factor Description High Loading
Terms (Stemmed) High Loading Statements F1 Enterprise
Performance Frameworks
Embodies frameworks of performance modeling such as performance measurement system, effective performance management framework, supply chain performance framework, etc.
perform (0.5805), enterpr (0.3218), framework (0.3019), integr (0.2991), chain (0.2974), qualiti (0.294), design (0.288), organ (0.2839), oper (0.2737), suppli (0.2722), stakehold (0.2696), innov (0.2693), system (0.2638), approach (0.2616)
Chung et al 2006 (0.3403), Teh and Pang 1999 (0.3397), Chung and Lee 2006 (0.335), Alfaro et al 2002 (0.3335), Chan et al 2006 (0.3321), Haque and James‐Moore 2005 (0.3318), Jayawama and Pearson 2002 (0.3291), Gaiardelli et al 2007 (0.3268), Ahmad et al 2003 (0.3266), Sadler and Sohal 2005 (0.3216), Sohal et al 2002 (0.3187), Hansen and Riis 1999 (0.3161)
F2 Performance Efficiency Measures
Discussion of various performance measures ‐ product and market efficiency, technical efficiency, scale efficiency, productivity growth, operating efficiency, etc.
effici (0.4508), perform (0.4136), dea (0.4124), bank (0.3885), data (0.3382), industri (0.3247), analysi (0.324), envelop (0.3075), output (0.2971), technic (0.2694), input (0.2585)
Nagarur and Rajbhandari 2001 (0.4615), Debnath and Shankar 2008 (0.4531), Staat 2006 (0.4465), Oglu et al 2008 (0.4364), Chen and Yeh 2005 (0.4333), Fethi et al 2008 (0.3894), Lu et al 2007 (0.3695), Staat and Hammerschmidt 2005 (0.3613)
101

The first factor represents a number of enterprise performance frameworks. These
frameworks include performance measurement systems, e‐business models, supply chain
performance frameworks, quality management systems, and real time monitoring systems that
are implemented across public and private sectors. The second factor delineates a range of
performance efficiency measures including product performance efficiency, market efficiency,
total factor productivity index, technical efficiency, financial efficiency, productivity growth, and
operating efficiency.
Ten Latent Semantic Factors of BPM Framework
Table 17 summarizes the ten semantic factors of the BPM framework. Factor 1 discusses
the design, development, and implementation of various types of performance measurement
systems. Factor 2 represents corporate social responsibility. It highlights the responsibility of an
organization with respect to environment, society, customer, shareholder, and ethical behavior.
Factor 3 characterizes logistics performance and supply chain management. It delineates the
structure of efficient supply chain management and outlines methods and indicators to
measure logistics performances. Factor 4 provides a sketch of the application of data
envelopment analysis (DEA). This elucidates that the data envelopment analysis is an
assessment tool for efficiency analysis such as productivity growth. Factor 5 expounds how
strategic alliance, resource capability, and innovation are interrelated. The identification and
definition of public sector services is discussed in Factor 6. Factor 6 also sheds light on the
performance measurement of public service organizations. Factor 7 provides insights into
cultural differences from two perspectives: (1) differences in practices and performance of
businesses operating in different countries, and (2) differences in organizational cultures
102

between internet and traditional companies operating within the same country. Factor 8
describes several performance ratios that include technical efficiency, product performance,
and reliability of processes. Factor 9 discusses the determinants of joint venture partners, and
delineates various approaches to measure joint venture performance. Finally, Factor 10
embodies the key variables in default risk analysis, provides a global perspective of risk
prediction, and highlights techniques of default risk analysis.
Table 17: Summary of ten semantic factors of BPM framework
Factor Factor Label Factor Description High Loading
Terms (Stemmed) High Loading Statements F1 Design and
implementation of performance
Discussion of design, development, implementation, and types of performance measurement systems
perform (0.4944), design (0.3762), implement (0.3704), facilit (0.3287), scorecard (0.3046), literatur (0.3005), manufactur (0.2985), balanc (0.2867), system (0.2788)
Bourne et al 2003 (0.4655), Bourne et al 2003a (0.4307), Bourne et al. 1999 (0.4045), Cochran et al 2001 (0.39), Ip et al. 1999 (0.3495), Harding et al. 1999 (0.345), Sadler and Sohal 2005 (0.3401), Stone 2000 (0.3199), Lima et al 2008 (0.303), Bititci et al 2001 (0.2959)
F2 Corporate responsibility
Corporate social responsibility in relation to its stakeholders such as environmental responsibility, social responsibility, customer responsibility, and ethics
stakehold (0.5553), corpor (0.5162), social (0.478), respons (0.4042), csr (0.3249), environment (0.2464), custom (0.2172)
Ahmad et al 2003 (0.5676), Colle and Gonella 2003 (0.5164), Stainer and Stainer 2003 (0.4929), Rubinstein 2003 (0.4775), Waddock 2003 (0.4218), Stainer and Grey 2007 (0.421), Hopkins 2003 (0.4182)
Continued
103

Table 17: Continued
Factor Factor Label Factor Description High Loading
Terms (Stemmed) High Loading Statements F3 Logistics and
supply chain Supply chain management and logistics performance; material flow, information flow and financing flow of supply network; integration and coordination in supply chain and logistics
suppli (0.6884), chain (0.6646), logist (0.3173), enterpr (0.243)
Yao 2005 (0.5408), Stone and Love 2007 (0.5267), Wadhwa et al 2006 (0.5237), Sohal et al 2002 (0.4828), Weixin 2006 (0.4399), Mo et al 2006 (0.4207), Chan et al 2006 (0.4104), Zhang et al 2006 (0.3977), Grimaldi and Rafele 2007 (0.3765), Chung and Lee 2006 (0.3432), Choy et al 2006 (0.2829)
F4 Efficiency and data envelopment analysis
Application of data envelopment analysis to evaluate efficiency analysis such as productivity growth
bank (0.4593), effici (0.4399), dea (0.4195), technic (0.3283), envelop (0.3169), index (0.2958), industri (0.2906), data (0.269), scale (0.2671), analysi (0.2661)
Oglu et al 2008 (0.5065), Fethi et al 2008 (0.4639), Debnath and Shankar 2008 (0.4386), Chen and Yeh 2005 (0.435), Nagarur and Rajbhandari 2001 (0.4325), Zhao et al 2008 (0.4285), Staat 2006 (0.4012), Uri 2001 (0.3815), Chen et al 2005 (0.3783), Jacobs and Sena 2008 (0.3641), Adesokan 2008 (0.3356), Lu et al 2007 (0.3148)
F5 Resource capability, alliance and innovation
Explain the relationship between resource capabilities, strategic alliance, and innovation
knowledg (0.3873), allianc (0.3703), innov (0.3677), capabl (0.3649), resourc (0.3136), competit (0.3083), asset (0.2889), strateg (0.2796)
Marr et al 2002 (0.432), Kasmai and Iijima 2002 (0.3996), Kouhy and Vedd 2000 (0.3743), Kasmai and Iijima 1999 (0.3728), Bhat and Kumar 2004 (0.3519), Wei and Malik 2005 (0.3369)
Continued
104

Table 17: Continued
Factor Factor Label Factor Description High Loading
Terms (Stemmed) High Loading Statements F6 Public sector
services Identification and definition of public sector services; performance measurement of public service organizations; etc.
public (0.5672), sector (0.4694), govern (0.4119), custom (0.3106), servic (0.2993), perform (0.2929)
Ghobadian et al 2007 (0.5143), Jackson 2000 (0.4601), Bartlett 2003 (0.4451), Conroy 2001 (0.3914), Sharma and Wanna 2005 (0.3814)
F7 Cultural difference
Differences in practices and performances of businesses operating in different countries; also included is the difference between internet and traditional companies
differ (0.3117), internet (0.3087), cultur (0.2535), signific (0.2474), find (0.236), report (0.2308), survei (0.2093)
Sohail and Al‐Buraey 2005 (0.3117), Marr and Neely 2001 (0.3053), Szwejczewski et al 2003 (0.3016), Terziovski et al 2002 (0.3013), Teo 2003 (0.2995), Udo 1999 (0.2926), Udo 2001 (0.2679), Bennett and James 2000 (0.2658)
F8 Performance ratios
Performance ratios such as technical efficiency, product performance, reliability of processes, etc. are discussed
univers (0.5264), perform (0.3645), ratio (0.3336), internet (0.3162), describ (0.2465), problem (0.2317), reliabl (0.2172)
Pursglove and Simpson 2004 (0.5455), Pursglove and Simpson 2001 (0.5148), Agasisti and Bianco 2006 (0.3539), Carvalho and Laurindo 2003 (0.3029)
F9 Joint venture Factors determining the selection of joint venture partners; approaches to measure joint venture performance; international joint venture; etc.
knowledg (0.316), partner (0.3049), ventur (0.3031), learn (0.2873), perform (0.2706), joint (0.2632), ijv (0.2599), allianc (0.253)
Gray and Ghosh 2003 (0.3954), Lopez‐Navarro and Molina‐Morales 2002 (0.3954), Fong et al 2004 (0.392), Julian 2005 (0.3219), Grimaldi and Rafele 2007 (0.3047), Kueng 2002 (0.2565), Lau et al 2006 (0.2471)
Continued
105

Table 17: Continued
Factor Factor Label Factor Description High Loading
Terms (Stemmed) High Loading Statements F10 Default risk
analysis The key variables in default risk analysis; global perspective of risk prediction; techniques of default risk analysis; etc.
default (0.3292), variabl (0.2803), pm (0.2507), network (0.246), benchmark (0.218), risk (0.2168), environment (0.2159), method (0.2104), analysi (0.2098)
Falavigna 2008a (0.421), Marassi and Pediroda 2008 (0.4072), Falavigna 2008 (0.3983), Chan and Yung 1999 (0.2651), Vallespir et al. 1999a (0.2649), Altunoglu 2004 (0.2593), Certo 2008 (0.2332)
cLSA of Corpus 3
The corpus comprises of 622 XY statement pairs. Combining the input and the output
statements and then removing the duplicates resulted in a corpus of 1004 statements. These
statements produced a dictionary of 939 raw terms. The elimination of stopwords from the
dictionary and then the use of Porter term stemming (Porter, 1980) on the remaining words
produced a dictionary of 671 relevant terms. An initial LSA on this dictionary revealed that 364
(54%) of these terms contributed to only 5% of the variance. Therefore, the communality
filtering (Sidorova et al., 2008) was used to remove these terms from the dictionary. The final
dictionary comprised 307 terms. The X matrix obtained from Corpus 3 is a 307 X 1004 term‐by‐
statement X matrix. I followed a common method (Frakes & Baeza‐Yates, 1992, p. 373; Salton &
Buckley, 1988) to transform and normalize the frequencies of the term‐by‐statement X matrix. I
performed cLSAs on the transformed X matrix to validate two‐factor and ten‐factor BPM
frameworks.
106
A Two‐Factor Causal BPM Framework
The first factor represents the operational view of the BPM artifact. The central theme
of this factor embodies the BPM system and its organizational use. Various salient features of
BPM systems are the key focus of this factor. BPM systems consolidate data from across the
enterprise into a centralized data warehouse. They include analytics capabilities to turn the raw
data into information that managers use in their decision‐making process. BPM software can
automate data entry and reporting, and helps companies do business modeling. There is a
variety of BPM implementations. Companies can implement their do‐it‐all BPM systems in‐
house or can build an integrated BPM system by cobbling together products from several
vendors. They can even deploy BPM systems on Excel and integrate BPM solutions with
groupware, presentation, and web collaboration tools. The second factor represents the
organizational view of BPM. It discusses how BPM helps organizations improve performance,
become high performing organizations, foster strong leadership, and achieve better results.
Table 18 provides the summary of the two‐factor BPM framework. The inter‐factor frequency
measures and their percentages of the above factors are presented in Table 19 and Table 20,
respectively. Causal semantic net shows the inter‐factor causal relationships among these
factors. Figure 11 portrays the causal semantic net developed based on the percentage
measures given in Table 20.
107

Table 18: Summary of two factors of the causal BPM framework
Factor Factor Label Factor Description High Loading
Terms (Stemmed) High Loading Statements F1 Operational
view: the BPM artifact
What BPM is and what you do with it; Various facts regarding BPM; BPM implementation, benefits, solutions, data, reporting.
bpm (2.4317), compani (1.5509), manag (1.3914), system (1.3741), data (1.3641), busi (1.1865), softwar (0.988), perform (0.9269), solution (0.8941), prov (0.6838), integr (0.6684), inform (0.6218)
The Editors 2007f X04 (0.6008), Hartlen 2004 X01 (0.5449), Kopcke 2003 X01 (0.5449), Ginsberg 2004 X02 (0.5285), Pritchard 2008 X01 (0.5285), Cokins 2004 Y06 (0.515), The Editors 2006g X01 (0.5054), Menninger & Raden 2005 X14 (0.5037), Weismantel 2007 X06 (0.5017), The Editors 2007i X01 (0.4749), Cokins 2004 Y03 (0.4729), Jorgensen 2007 X06 (0.459), Norton & Seewald 2007 X06 (0.4499)
F2 Organizational View of BPM
How BPM improves organizational performance; High performance organization; Strong leadership; Better results.
organ (2.4004), perform (1.3969), manag (1.0852), busi (1.0258), process (1.0041), improv (0.8406), decision (0.8049), result (0.7385)
Buytendijk 2006 Y20 (0.5868), Labovitz 2004 X01 (0.5553), Saksena 2007 Y14 (0.5553), Simms 2004 X02 (0.5342), Smith 2004 X01 (0.5129), Buytendijk 2006 X03 (0.4834), Buytendijk 2006 Y07 (0.4546)
108
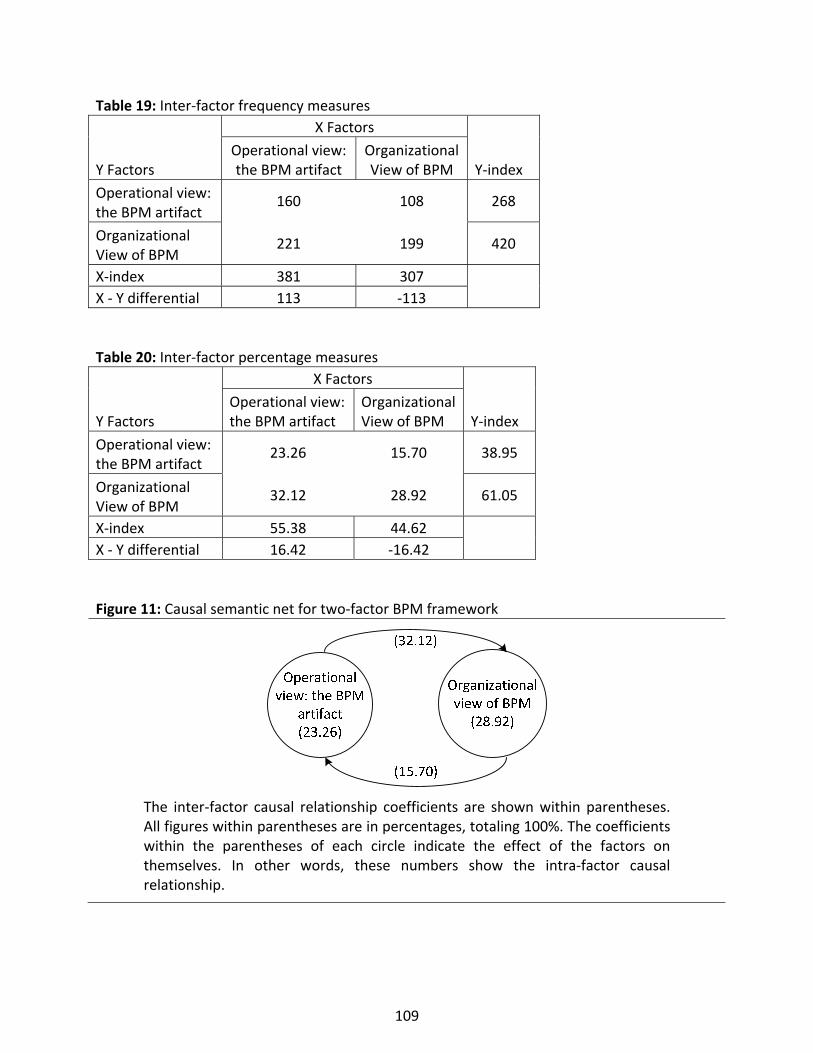
Table 19: Inter‐factor frequency measures X Factors
Y Factors Operational view: the BPM artifact
Organizational View of BPM Y‐index
Operational view: the BPM artifact
160 108 268
Organizational View of BPM
221 199 420
X‐index 381 307 X ‐ Y differential 113 ‐113
Table 20: Inter‐factor percentage measures X Factors
Y Factors Operational view: the BPM artifact
Organizational View of BPM Y‐index
Operational view: the BPM artifact
23.26 15.70 38.95
Organizational View of BPM
32.12 28.92 61.05
X‐index 55.38 44.62 X ‐ Y differential 16.42 ‐16.42
Figure 11: Causal semantic net for two‐factor BPM framework
The inter‐factor causal relationship coefficients are shown within parentheses. All figures within parentheses are in percentages, totaling 100%. The coefficients within the parentheses of each circle indicate the effect of the factors on themselves. In other words, these numbers show the intra‐factor causal relationship.
109
A Ten‐Factor Causal BPM Framework
Table 21 summarizes the ten‐factor causal latent semantics of the BPM framework.
Factor 1 encompasses different types of BPM solutions including integrated BPM solutions,
managed BPM solutions, Excel‐based BPM solutions, and Do‐it‐all BPM system. Factor 2
discusses performance management initiatives, management of overall organizational
performance, and the unified performance management framework. Factor 3 describes an
overarching concept of an enterprise that includes leadership, mission and vision,
organizational alignment, and strategic objectives. In other words, organization provides the
strategic view of an enterprise. Factor 4 represents the operational view of an enterprise, and
includes attributes such as customers, employees, goals, and decisions. Factor 5 encompasses
different types of business processes including planning, reporting, accounting, budgeting, and
forecasting. Factor 6 focuses on collection, centralization, and management of data from
different sources. Factor 7 highlights critical attributes of information including reliability,
accuracy, timeliness, stability, and contextual usage. Factor 8 discusses the outcomes of BPM
that include better results, better decisions, strategic growth, understanding of risks and
uncertainties, and better executive strategies. Factor 9 embodies performance improvement
indicators. Performance improvements are reflected in terms of improved processes, agility,
productivity, satisfaction, efficiency, decision, collaboration, and viability. Lastly, Factor 10
discusses the role of BPM solutions in planning, budgeting, cost reduction, and project
management.
110

Table 21: Summary of ten factors of the causal BPM framework
Factor Factor Label Factor Description High Loading
Terms (Stemmed) High Loading Statements F1 BPM Software
Solutions Integrated BPM solutions; Managed BPM solutions; Excel‐based BPM solutions; Do‐it‐all BPM.
bpm (2.984), system (1.519), solution (1.1661), softwar (0.9542)
Cokins 2004 Y06 (0.7237), Ginsberg 2004 X02 (0.7139), Pritchard 2008 X01 (0.7139), Baltaxe & Van Decker 2003 Y05 (0.5409), Benchimol 2006 X03 (0.5387), Simms 2004 X03 (0.5379), Ginsberg 2004 X06 (0.531)
F2 Performance Management
Performance management initiatives; Management of overall performance; Unified performance management framework.
perform (2.2405), busi (2.0614), manag (1.8645), model (0.8795)
Kopcke 2003 X05 (0.8503), Hartlen 2004 X01 (0.6118), Kopcke 2003 X01 (0.6118), Kadaba & Singh 2005 X04 (0.6113), Creelman 2007 X01 (0.6097), McKeon 2007 Y05 (0.5082), Smith 2004 Y07 (0.4869)
F3 Organization The organization; Points of interest include leadership, mission statement, organizational alignment, strategic objectives, etc.
organ (3.2347), align (0.6267), process (0.6191)
Labovitz 2004 X01 (0.8521), Saksena 2007 Y14 (0.8521), Smith 2004 X01 (0.6409), Buytendijk 2006 Y20 (0.6309), Buytendijk 2006 Y07 (0.583)
F4 Company The company; Company attributes include customers, employees, goals, decisions, etc.
compani (3.3546) organiz (0.9119)
Blamante 2003 X12 (0.8767), Linder 2003 Y4 (0.8767), Menninger & Raden 2005 Y1 (0.8767), Blamante 2003 X13 (0.587)
Continued
111

Table 21: Continued
Factor Factor Label Factor Description High Loading
Terms (Stemmed) High Loading Statements F5 Business
Processes Different types of business processes including planning, reporting, accounting, etc.
process (2.152), plan (1.1316), report (0.9319), budget (0.7423)
Sorensen 2005 X01 (0.6151), Kopcke 2003 X02 (0.4975), Morini 2005 Y05 (0.4628)
F6 Data Data management and data sources; Collection of the right data; Centralization of data from different sources.
data (3.121), sourc (0.677)
Cokins 2004 X02 (0.8624), Creelman 2007 X03 (0.8624), Iervolino & Thomas 2006 X02 (0.7425)
F7 Information Information reliability, accuracy, timeliness, stability; Garnering information in a timely and contextual manner.
inform (2.5512), provid (0.7999), decision (0.797)
Bichut 2005 Y03 (0.7275), Hotsmann 2007 X02 (0.7021), Cokins 2004 Y01 (0.6066), Sorensen 2005 Y02 (0.6063), Kichuk & Wooledge 2006 X06 (0.5969)
F8 Better Results ‐ Better Decisions
Outcomes of BPM; Better results, better decisions, and strategic growth; Understanding of risks and uncertainties; Better executive strategies.
result (1.865), better (1.827), decision (1.659), strateg (0.588)
Baltaxe & Van Decker 2003 Y02 (0.8791), Creelman 2007 Y05 (0.6965), Simms 2004 Y03 (0.6351), Schroeck 2006 Y08 (0.5817)
Continued
112

Table 21: Continued
Factor Factor Label Factor Description High Loading
Terms (Stemmed) High Loading Statements F9
Performance Improvement
Performance improvement indicators; Improved processes, agility, productivity, satisfaction, and efficiency; Improved decision, collaboration and viability.
improv (2.5032), perform (1.0611), model (0.836)
Smith 2008 Y09 (0.7389), Buytendijk 2006a Y01 (0.6501), Ginsberg 2004 Y07 (0.5527)
F10 BPM for Planning
BPM Solutions and their role in planning, budgeting, cost reduction; Project management; Web‐based budgeting and planning; Use of strategy plans and dashboards.
plan (1.235), manag (0.978), budget (0.961), system (0.9271), cost (0.8223), implement (0.8002), project (0.706)
Scherpenseel 2005 Y01 (0.4883), Scherpenseel 2005 Y05 (0.4416), Schiff 2003 Y06 (0.3795), Smith 2008 X11 (0.3715), Kamlet 2007 X04 (0.367), Van Decker 2006 X02 (0.3632)
The inter‐factor frequency measures and their percentages of the above factors are
presented in Table 22 and Table 23, respectively.
113

Table 22: Inter‐factor frequency measures
Y Factors BPM Softw
are
Solutio
ns
Performance
Managem
ent
Organization
Company
Busine
ss Processes
Data
Inform
ation
Better Results ‐
Better Decisions
Performance
Improvem
ent
BPM fo
r Planning
Y‐inde
x
BPM Software Solutions 7 4 3 4 12 9 2 1 0 5 47
Performance Management 12 14 6 14 13 8 10 1 6 6 90
Organization 16 20 25 8 16 7 7 0 4 11 114 Company 10 12 5 15 20 3 5 1 3 4 78 Business Processes 14 5 0 4 11 3 1 1 0 4 43
Data 7 1 1 10 3 6 3 1 2 3 37 Information 14 2 1 2 5 13 5 0 4 4 50 Better Results ‐ Better Decisions 16 21 8 7 16 13 6 6 8 13 114
Performance Improvement 17 12 4 15 11 7 3 5 6 10 90
BPM for Planning 11 6 5 3 7 7 1 1 0 7 48 X‐index 124 97 58 82 114 76 43 17 33 67 X ‐ Y differential 77 7 ‐56 4 71 39 ‐7 ‐97 ‐57 19
114

Table 23: Inter‐factor percentage measures X Factors
Y Factors BPM Softw
are
Solutio
ns
Performance
Managem
ent
Organization
Company
Busine
ss Processes
Data
Inform
ation
Better Results ‐
Better Decisions
Performance
Improvem
ent
BPM fo
r Planning
Y‐inde
x
BPM Software Solutions
0.98 0.56 0.42 0.56 1.69 1.27 0.28 0.14 0 0.7 6.6
Performance Management
1.69 1.97 0.84 1.97 1.83 1.13 1.41 0.14 0.84 0.84 12.66
Organization 2.25 2.81 3.52 1.13 2.25 0.98 0.98 0 0.56 1.55 16.03 Company 1.41 1.69 0.7 2.11 2.81 0.42 0.7 0.14 0.42 0.56 10.96 Business Processes
1.97 0.7 0 0.56 1.55 0.42 0.14 0.14 0 0.56 6.04
Data 0.98 0.14 0.14 1.41 0.42 0.84 0.42 0.14 0.28 0.42 5.19 Information 1.97 0.28 0.14 0.28 0.7 1.83 0.7 0 0.56 0.56 7.02 Better Results ‐ Better Decisions
2.25 2.95 1.13 0.98 2.25 1.83 0.84 0.84 1.13 1.83 16.03
Performance Improvement
2.39 1.69 0.56 2.11 1.55 0.98 0.42 0.7 0.84 1.41 12.65
BPM for Planning
1.55 0.84 0.7 0.42 0.98 0.98 0.14 0.14 0 0.98 6.73
X‐index 17.44 13.63 8.15 11.53 16.03 10.68 6.03 2.38 4.63 9.41 X ‐ Y differential 10.84 0.97 ‐7.88 0.57 9.99 5.49 ‐0.99 ‐13.7 ‐8.02 2.68
Causal semantic net shows the inter‐factor causal relationships among the factors. For a
ten‐factor cLSA, the causal semantic net portrays 100 causal relationships. As Table 22 and
Table 23 indicate, some of these relationships have little or no causal support. Causal supports
are given by the cell frequencies in Table 22. These supports can also be shown as percentages
of the total support. Table 23 shows the percentage of supports. The relationships that have
little support can be eliminated based on some criteria. One such criterion to determine the
cutoff point may be to use the average expected percentage of support. For a ten‐factor cLSA,
115

we expect, on average, a percentage support of 1% to fall in each cell in Table 23. Therefore,
any relationship with less than the average expected percentage of support can be removed.
Yet another method can utilize the relative strength of the percentage of support in relation to
the highest percentage of support. Table 23 indicates that the highest percentage of support is
3.52% for the factor, organization, leading to the same factor. The cutoff support can then be
established as a percentage of the highest support. For instance, any relation that has a support
percentage of less than 50% relative to the highest support percentage can be eliminated. In
this study, we use the second method. A cutoff point of 50% of the highest support percentage
is used to determine the insignificant relationships that can be removed from the causal
semantic net. Table 24 shows the percentage of supports that are deemed significant. A causal
semantic net drawn based on Table 24 is portrayed in Figure 12.
116

Table 24: Significant percentage supports X Factors
Y Factors BPM Softw
are
Solutio
ns
Performance
Managem
ent
Organization
Company
Busine
ss Processes
Data
Inform
ation
Better Results ‐
Better Decisions
Performance
Improvem
ent
BPM fo
r Planning
Y‐inde
x
BPM Software Solutions 0
Performance Management 1.97 1.97 1.83 5.77
Organization 2.25 2.81 3.52 2.25 10.83Company 2.11 2.81 4.92 Business Processes 1.97 1.97
Data 0 Information 1.97 1.83 3.8 Better Results ‐ Better Decisions 2.25 2.95 2.25 1.83 1.83 11.11
Performance Improvement 2.39 2.11 4.5
BPM for Planning 0
X‐index 10.83 7.73 3.52 6.19 9.14 3.66 0 0 0 1.83 X ‐ Y differential 10.83 1.96 ‐7.31 1.27 7.17 3.66 ‐3.8 ‐11.1 ‐4.5 1.83
117

Figure 12: Causal semantic net for ten‐factor BPM framework
10.2Performance Management
(1.97)
10.1BPM Software
10.4Company(2.11)
10.5Business Processes
(1.83)10.9
Performance Improvement
10.7Information
10.3Organization
(3.52)
10.8Better Results Better Decisions
10.6Data
(2.25)
(2.11)
(2.95)
(2.25)
(1.97)
(1.83)
(1.97)
(1.97)
(2.25)
(1.83)
10.10BPM for Planning
(2.25)
(2.81)
(2.39)
(2.81)
(1.83)
The inter‐factor causal relationship coefficients are shown within parentheses. All figures within parentheses are in percent. The coefficients within the parentheses of some circles indicate the effect of the factors on themselves. Therefore, they show the intra‐factor causal relationships.
118

CHAPTER 5
DISCUSSION, IMPLICATIONS, and FUTURE DIRECTION
Discussion
First, this study used a two‐factor causal latent semantic analysis (cLSA) methodology to
examine the Malcolm Baldrige National Quality Award (MBNQA) framework. The identification
of two‐factors using cLSA suggest that two mega constructs within the MBNQA framework are
the Baldrige system and Baldrige assessment. The factor assessment embodies various
performance assessments including assessment of leadership performance, process
performance, human resource performance, etc. These performances are indicators of
respective organizational results. The second factor system delineates the elements that are
central to the Baldrige system. These integral components of the Baldrige systems include
strategic planning, leadership, process, performance management, customer, and market. The
findings also suggest that the factors have substantial influence on each other. There is a
positive correlation between the two concepts. A well managed system leads to better
assessment of the result indicators; and better assessment of the result indicators yields an
improved Baldrige system. I also found that there exist intra‐factor relationships for both
factors. This suggests that these factors represent broader concepts that are comprised of sub‐
concepts.
Second, the seven‐factor cLSA of the MBNQA framework suggests that the model has
not yet been explored in its entirety. However, past research examined several critical
components of the MBNQA framework, including the system’s assessment, leadership triad,
business results, performance measurement, and process improvement. Except for business
119

results (Figure 10), these factors demonstrate intra‐factor relationship. This suggests that these
categorical factors are comprised of sub‐factors, each of which influences the other. Another
important finding is shown in Table 15. The X‐Y differential indicates whether a factor is a net
giver (i.e., cause) or a net receiver (i.e., effect). As Table 15 indicates, the leadership triad
emerged as the most influential factor while business results appeared to the net receiver. This
is consistent with the theoretical foundation of the MBNQA framework. However, the empirical
evidence suggests that the MBNQA framework has been seriously understudied by researchers.
Figure 13 shows the empirical evidence of the MBNQA framework.
Figure 13: Empirical evidence of the MBNQA framework
System’s assessment
Leadership triad
Process improvement
Performance measurement
Business results
Third, the two‐factor latent semantic analysis (LSA) of the business performance
management (BPM) framework revealed that the BPM researchers investigated different types
of BPM frameworks and what performance efficiencies these frameworks brought about in the
120
organizations. This stream of research suggests that researchers are interested in analyzing
what efficiency measures are achieved by the implementation of BPM infrastructures. This also
implies that the primary focus of this stream is not to examine what constitutes or should
constitute a BPM implementation but rather to highlight the benefit measures of various
existing BPM frameworks.
Fourth, the results of the ten‐factor LSA are somewhat consistent with those of the two‐
factor LSA. The second factor of the two‐factor LSA – performance efficiency measures – broke
down into several individual measures such as performance ratios, corporate responsibility
measures, public sector services, logistics and supply chain performance, and the role of data
envelopment analysis in efficiency. In addition, several other factors emerged. These include
the factors determining joint venture, default risk analysis, and resource capability, alliance and
innovation.
Fifth, the two‐factor cLSA of the BPM framework revealed that there are two views of
the BPM infrastructure – the operational view: the BPM artifact and the organizational view of
BPM. As Figure 11 indicates, there is a strong positive causal support between these two views
of BPM. Both factors also have a high level of intra‐factor causal supports. This suggests that
these factors provide a bird’s eye view of the BPM framework and can further be decomposed
into more specific causal sub‐factors.
Sixth, the ten‐factor cLSA of the BPM framework provides a more elaborate account of
the BPM constructs as perceived by practitioners. These ten factors represent a refined break‐
down of the two mega‐constructs uncovered by the two‐factor cLSA of the BPM framework.
Consistent with the results of the two‐factor cLSA, these factors can be combined to provide
121
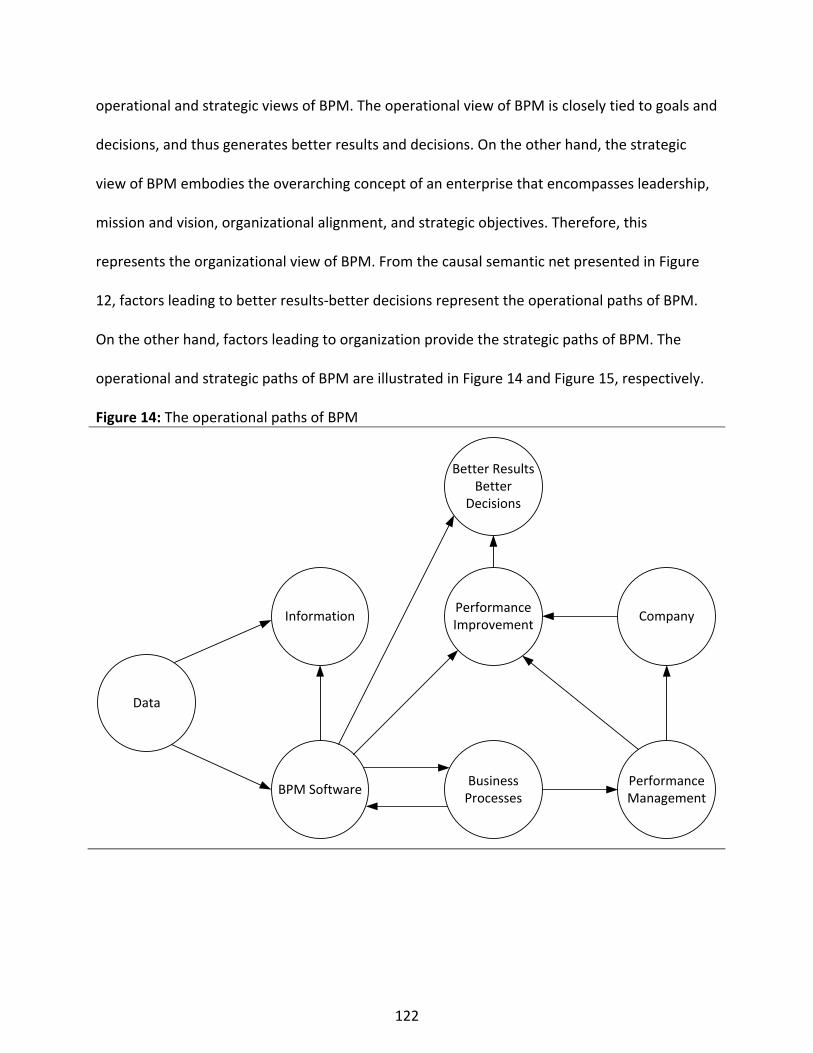
operational and strategic views of BPM. The operational view of BPM is closely tied to goals and
decisions, and thus generates better results and decisions. On the other hand, the strategic
view of BPM embodies the overarching concept of an enterprise that encompasses leadership,
mission and vision, organizational alignment, and strategic objectives. Therefore, this
represents the organizational view of BPM. From the causal semantic net presented in Figure
12, factors leading to better results‐better decisions represent the operational paths of BPM.
On the other hand, factors leading to organization provide the strategic paths of BPM. The
operational and strategic paths of BPM are illustrated in Figure 14 and Figure 15, respectively.
Figure 14: The operational paths of BPM
Data
Information
BPM SoftwareBusiness Processes
Company
Performance Management
Performance Improvement
Better Results Better
Decisions
122

Figure 15: The strategic paths of BPM
Data
Information
BPM Software
Business Processes
Organization
Performance Management
Implications
There are several theoretical and practical implications of this study. First, in this study, I
developed a variant of the traditional latent semantic analysis (LSA) that enables us to test
causal models using textual data. This study is the first that has attempted to develop the
causal latent semantic analysis (cLSA) that analyzes input‐output statements to establish causal
relationships between the factors derived from the analysis. Second, this study is also the first
attempt to validate the 2008 MBNQA framework using text data that included article abstracts
published in both academic and practitioner journals on the Baldrige Award and program. The
managerial implication is that managers should understand that the Baldrige system and the
Baldrige results are intertwined and that each is both a cause and an effect of the other. The
academic implication of this study is that it provides academicians with a new approach to test
causal models based on quantitative analysis of the textual data. Third, the key to ever‐
increasing competitive advantage is to continuously improve the fit between a dynamic and
123

changing business environment and organizational strategy, and doing so requires
responsiveness and flexible strategies (Porter, 1980). Business performance management
(BPM) framework developed in this study provides a structure for enhancing responsiveness
and flexibility because it embodies the process of managing an organization’s strategy. Since
the BPM process embodies a closed‐loop process with the objective of continuously adjusting
business strategies, it helps organizations to enhance their agility. Therefore, with the
implementation of the BPM framework, organizations can quickly adapt to changes. I posit that
the proposed BPM framework will help managers create an agile organization that is capable of
developing and increasing competitive advantage. Fourth, the BPM framework developed in
this paper is a generic performance management model that can be implemented across
industries, boundaries, and cultures. It can provide organizations with more common language
to bridge sector‐specific gaps. Last but not least, this study integrates the BPM and MBNQA
frameworks into a new model called the BPM‐MBNQA framework such that the BPM
framework serves as the start‐up model for the MBNQA framework. The BPM framework is a
subset of the MBNQA framework, and the former paves the way for the latter. Organizations
can initially deploy the BPM framework and gradually move to the adoption of the MBNQA
framework.
Future Direction
Future works can extend this study in a number of ways. First, the MBNQA framework
can be validated at both the category and the item levels using more comprehensive collection
of data. Particularly, the MBNQA winners can be interviewed as to their perception and
experience of implementing the MBNQA framework in their organizations. The interview data
124

can then be used to validate the model. Second, the BPM framework can further be tested with
a more comprehensive collection of BPM‐related textual data. Third, this study developed a
methodology (cLSA) to validate causal models such as the MBNQA and BPM frameworks.
Future works can refine the method, especially, with regard to how to reduce the inter‐factor
causal relationships. Lastly, this study developed an input‐output (XY) coding scheme. This
scheme is not comprehensive. Therefore, future studies can refine and extend this coding
scheme.
125

APPENDIX A
ILLUSTRATION OF LATENT SEMANTIC ANALYSIS (LSA) METHOD
126

Illustration of Latent Semantic Analysis (LSA) Method The corpus consists of a collection of seven select article titles published in volume 10
issues 2/3 and 4 of the International Journal of Business Performance Management (IJBPM) in 2008. Table A1 presents the list of these article titles and their reference to IJBPM.
Table A1: Titles of seven select articles published in IJBPM in 2008
Data Cleaning The data were subjected to a data cleaning process, in which (1) the hyphens in key‐
variables in R2 and in 1980‐200 in P2 were removed and a space was used to separate the words, and (2) the colons in P1 and p2 were removed. Note that the data cleaning process may vary from corpus to corpus and based on the LSA automation algorithm. In this illustration, I consider the use of a space to separate the words. Therefore, the above data cleaning method is deemed appropriate. Table A2 presents the corpus after the cleaning process.
Table A2: The corpus after the data cleaning process
Dictionary of Relevant Terms
The initial dictionary comprises of 70 words, of which 40 words appear only in one document. The elimination of these unique words reduces the dictionary size to 30 words. I then remove the stopwords such as ‘a’, ‘an’, ‘for’, ‘of’, ‘the’, etc. from the dictionary. The list of stopwords consists of the standard 571 common words developed by the System for the Mechanical Analysis and Retrieval of Text (SMART) at Cornell University (Salton & Buckley, 1988). The removal of stopwords from the dictionary reduces its size to 15 words. The
127
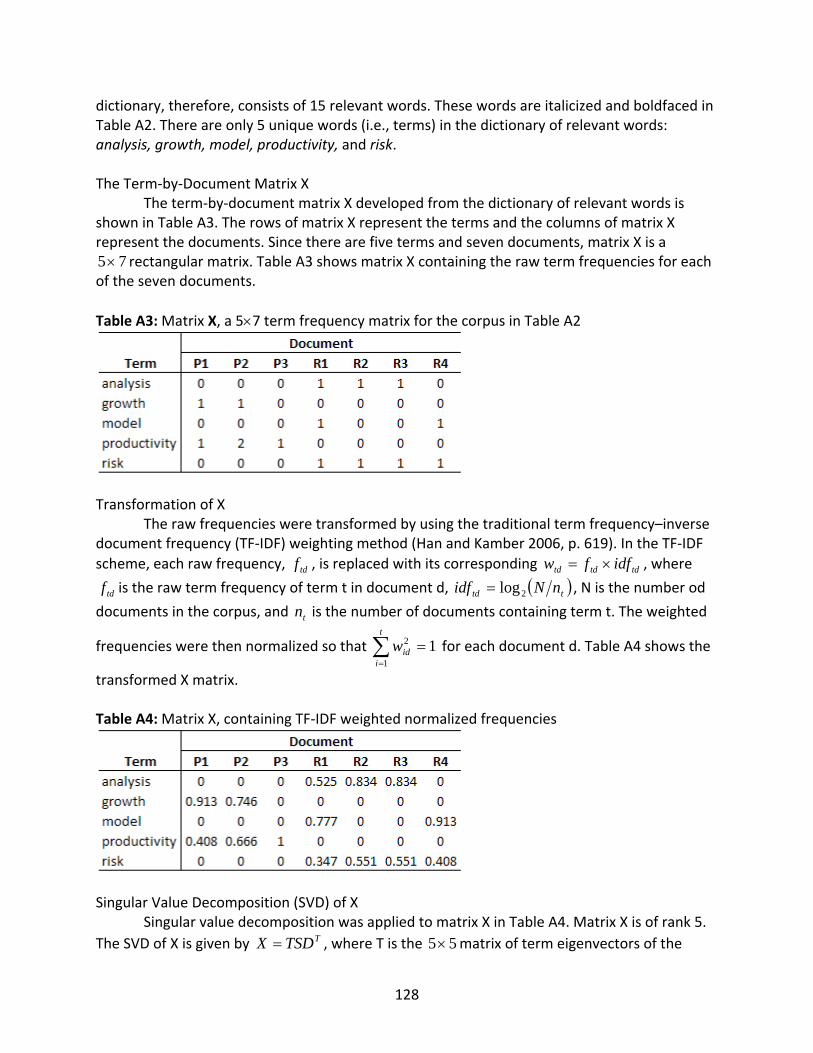
dictionary, therefore, consists of 15 relevant words. These words are italicized and boldfaced in Table A2. There are only 5 unique words (i.e., terms) in the dictionary of relevant words: analysis, growth, model, productivity, and risk. The Term‐by‐Document Matrix X
The term‐by‐document matrix X developed from the dictionary of relevant words is shown in Table A3. The rows of matrix X represent the terms and the columns of matrix X represent the documents. Since there are five terms and seven documents, matrix X is a
rectangular matrix. Table A3 shows matrix X containing the raw term frequencies for each of the seven documents.
75×
Table A3: Matrix X, a 5×7 term frequency matrix for the corpus in Table A2
Transformation of X
The raw frequencies were transformed by using the traditional term frequency–inverse document frequency (TF‐IDF) weighting method (Han and Kamber 2006, p. 619). In the TF‐IDF scheme, each raw frequency, , is replaced with its corresponding tdf tdtdtd idffw ×= , where
is the raw term frequency of term t in document d, tdf ( )ttd nNidf 2log= , N is the number od
documents in the corpus, and is the number of documents containing term t. The weighted
frequencies were then normalized so that for each document d. Table A4 shows the
transformed X matrix.
tn
11
2 =∑=
t
iidw
Table A4: Matrix X, containing TF‐IDF weighted normalized frequencies
Singular Value Decomposition (SVD) of X
Singular value decomposition was applied to matrix X in Table A4. Matrix X is of rank 5. The SVD of X is given by , where T is the TTSDX = 55× matrix of term eigenvectors of the
128

square symmetric matrix TXXY = , Y is the 55× matrix of term covariances, D is the 75× matrix of document eigenvectors of the square symmetric matrix XXZ T= , Z is the
matrix of document covariances, and S is the 77× 55× diagonal matrix of singular values (i.e., the square roots of eigenvalues of both Y and Z). The SVD of X was performed using an online SVD calculator available at http://www.bluebit.gr/matrix‐calculator/ and is shown in Figure A1. Figure A1: The SVD of X
Reduction of Factors
The rank‐k reduced model is the best possible least‐squares‐fit to X. In this illustration, we selected k based on the Kaiser‐Guttman rule, which suggests that we keep the factors whose eigenvalues are greater than
DSTX ˆˆˆˆ = T
λ . The diagonal matrix S contains the singular
values si = {1.678, 1.542, 1.067, 0.790, and 0.209}. The corresponding eigenvalues are iλ = =
{1.295, 1.242, 1.033, 0.889, and 0.457}. Therefore,
2is
λ = 1.40 and the Kaiser‐Guttman rule
suggests keeping the first two principal factors. The reduced model with k = 2 is shown in Figure A2.
TDSTX ˆˆˆˆ =
Figure A2: The SVD of the reduced model
Rotation of Factors
The term and document loadings are given by and , respectively. Rotations of factors can then be performed to simplify the factor structure and factor interpretations (Sidorova et al. 2008; Thurstone 1947). Here we used varimax rotation for both term loadings and document loading to maintain the same factor space. Varimax rotation simplifies the interpretation of factors because, after varimax rotation, each term and/or document tends to be associated with one or a small number of factors, and vice versa (Kaiser 1958). To obtain the varimax rotated factor matrices and , matrices and were multiplied by their corresponding orthogonal varimax transformation matrices and . The matrices and were obtained from MINITAB 15 by using and , respectively.
STLTˆˆ=
*TL *L
SDLDˆˆ=
TL
TL
D D
ML
TM
D
D
TM DM L
129

The term loadings before and after varimax rotation are shown in Table A5. Table A6 shows the document loadings before and after varimax rotation.
Table A5: Term loadings before and after varimax rotation
Table A6: Document loadings before and after varimax rotation
Interpretation of Factors As Table A5 and Table A6 indicate, Factor F1 appears to be highly related to the terms {analysis, model, and risk}, and loads strongly on documents R1, R2, R3, and R4. Factor F2 appears to be primarily related to the terms {growth, and productivity}, and loads strongly on documents P1, P2, and P3. Reading the corresponding titles from Table A1, it is plausible to infer that factor F1 is about analysis of risk models and factor F2 is about growth and productivity.
130

APPENDIX B
ILLUSTRATION OF CAUSAL LATENT SEMANTIC ANALYSIS (cLSA) METHOD
131
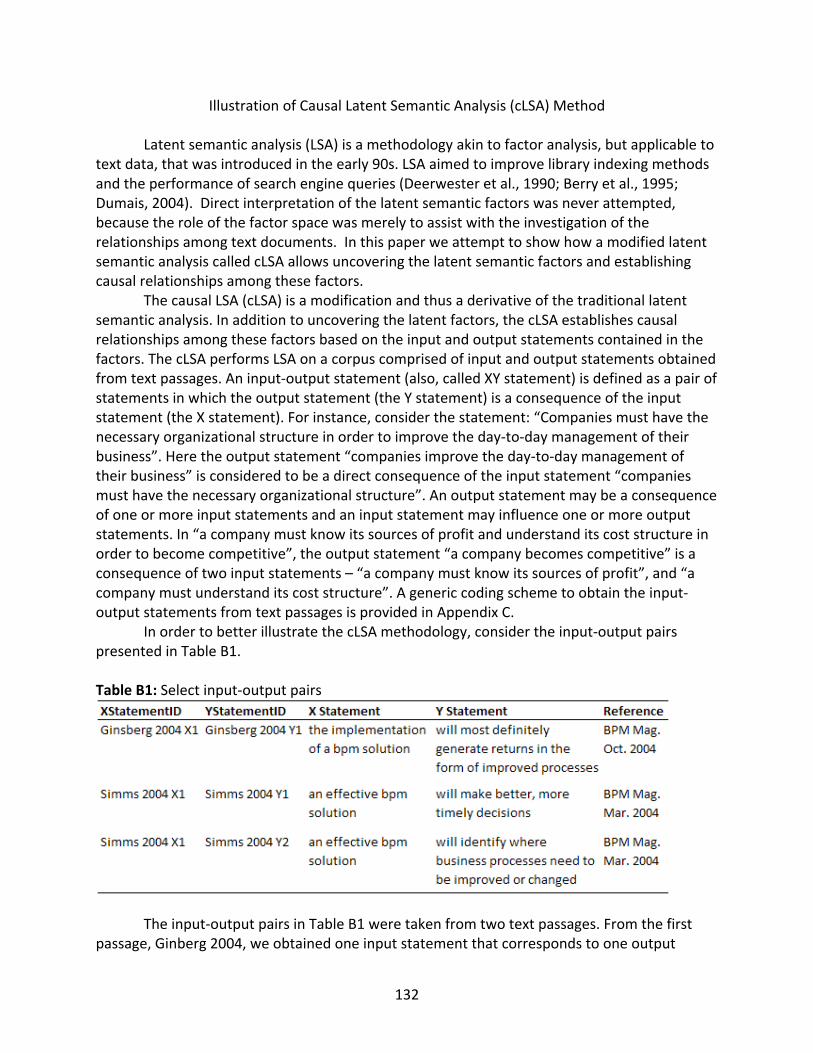
Illustration of Causal Latent Semantic Analysis (cLSA) Method Latent semantic analysis (LSA) is a methodology akin to factor analysis, but applicable to
text data, that was introduced in the early 90s. LSA aimed to improve library indexing methods and the performance of search engine queries (Deerwester et al., 1990; Berry et al., 1995; Dumais, 2004). Direct interpretation of the latent semantic factors was never attempted, because the role of the factor space was merely to assist with the investigation of the relationships among text documents. In this paper we attempt to show how a modified latent semantic analysis called cLSA allows uncovering the latent semantic factors and establishing causal relationships among these factors.
The causal LSA (cLSA) is a modification and thus a derivative of the traditional latent semantic analysis. In addition to uncovering the latent factors, the cLSA establishes causal relationships among these factors based on the input and output statements contained in the factors. The cLSA performs LSA on a corpus comprised of input and output statements obtained from text passages. An input‐output statement (also, called XY statement) is defined as a pair of statements in which the output statement (the Y statement) is a consequence of the input statement (the X statement). For instance, consider the statement: “Companies must have the necessary organizational structure in order to improve the day‐to‐day management of their business”. Here the output statement “companies improve the day‐to‐day management of their business” is considered to be a direct consequence of the input statement “companies must have the necessary organizational structure”. An output statement may be a consequence of one or more input statements and an input statement may influence one or more output statements. In “a company must know its sources of profit and understand its cost structure in order to become competitive”, the output statement “a company becomes competitive” is a consequence of two input statements – “a company must know its sources of profit”, and “a company must understand its cost structure”. A generic coding scheme to obtain the input‐output statements from text passages is provided in Appendix C.
In order to better illustrate the cLSA methodology, consider the input‐output pairs presented in Table B1.
Table B1: Select input‐output pairs
The input‐output pairs in Table B1 were taken from two text passages. From the first passage, Ginberg 2004, we obtained one input statement that corresponds to one output
132

statement. However, from the second passage, Simms 2004, we have had one input statement that corresponds to two output statements. In this example, we use these three input‐output pairs to develop our corpus for the cLSA.
However, before we detail the steps of cLSA, let’s assume that a knowledgeable researcher is asked to identify the potential factors and their relationships from this set of input‐output statements. It is likely that the researcher will recognize and identify three factors – BPM solution/implementation, business processes, and timely decision – and conclude the relationships between the factors as shown in Figure B1.
Figure B1: Relationships between BPM solution, business processes, and timely decisions
BPM solution
Business processes
Timely decisions
The corpus for cLSA consists of the input and output statements obtained from text passages. These text passages may include article abstracts, customer comments, discussion sections of articles, or simply text documents. The input and output statements are referred to as the X and Y statements, respectively. Each XY statement pair is assigned an XStatementID and an YStatementID in order to track the correspondence between the statements. If an X statement corresponds to more than one Y statement, then the X statement is given only one XStatementID and the corresponding Y statements are given separate YStatementIDs. Similarly, if an Y statement corresponds to more than one X statement, then the Y statement is given only one YStatementID and the corresponding X statements are given separate XStatementIDs. For instance, in Table B1, the X statement an effective bpm solution with an XStatementID Simms 2004 X1 has two corresponding Y statements – will make better, more timely decisions with an YStatementID Simms 2004 Y1, and will identify where business processes need to be improved or changed with an YStatementID Simms 2004 Y2. Assigning statement IDs in such a manner helps not only to track the XY correspondence but also to eliminate duplicate use of statements in the corpus.
To develop the corpus, first, the X statements are combined with the Y statements. Then the duplicate X and/or Y statements are removed. Finally, the unique statements are sorted by StatementID to form the corpus for LSA. The combined statements from Table B1 are shown in Table B2. Table B3 presents the final corpus.
133

Table B2: Combined X and Y statements
Table B3: Final corpus
It is now possible to perform LSA on the corpus to extract the latent semantic structure. For stepwise illustration of LSA, refer to Sidorova et al. (2008) and Appendix A. The corpus consists of a collection of five statements with 30 words. Due to the small size of the corpus, we used the removal of stopwords and term stemming as the only term filtering techniques. Note that for large corpuses, other term filtering techniques such as the elimination of unique words (i.e., the words that appear in only one statement) and communality filtering can be applied. The removal of stopwords such as the, an, is, are, etc. and the Porter term stemming (Porter 1980) produced a dictionary of 9 relevant terms. Table B4 shows matrix X containing the term frequencies. Matrix X with the term frequency–inverse document frequency (TF‐IDF) weighted normalized frequencies is presented in Table B5.
Table B4: Matrix X, containing term frequencies
134

Table B5: Matrix X, containing TF‐IDF weighted normalized frequencies
Singular value decomposition (SVD) was applied to matrix X in Table B5. Keeping the
first three principal components, the SVD of matrix X, , produced a matrix TDSTX ˆˆˆˆ = 39× T of
term eigenvectors of the square symmetric matrix TXX , a 35× matrix of statement
eigenvectors of the square symmetric matrix
DXX T , and a 33× diagonal matrix of singular
values. The term and statement loadings were obtained by and , respectively. Rotations of factors were then performed to simplify the factor structure and factor interpretations (Sidorova et al. 2008). I used varimax rotation for both term loadings and statement loading to maintain the same factor space. The term loadings before and after varimax rotation are shown in Table B6. Table B7 shows the statement loadings before and after varimax rotation.
SSTT
ˆ=L SLDˆ= D
Table B6: Term loadings before and after varimax rotation
135

Table B7: Statement loadings before and after varimax rotation
As Table B6 and Table B7 indicate, Factor F1 appears to be highly related to the terms {bpm, solution, effective, and implementation}, and loads strongly on statements {Ginsberg 2004 X1, and Simms 2004 X1}. Factor F2 appears to be primarily related to the terms {business, processes, and returns}, and loads strongly on statements {Ginsberg 2004 Y1 and Simms 2004 Y2}. The terms and statements loading highly on Factor F3 are {decision and timely} and {Simms 2004 Y1}, respectively. Examination of the statements loading in the factors Table B3 reveals that these factors are what the knowledgeable researcher dubbed them earlier.
In cLSA, the X statements and their factor associations from statement loadings matrix (Table B7) are tallied with the corresponding Y statements and their factor associations to determine inter‐factor statement frequencies. The factor associations of a statement are determined by the factor loadings of the statement. If a statement has a factor loading of more than zero in a factor, then the statement is said to have an association with that factor. This will yield an matrix F of inter‐factor statement frequencies, where f denotes the number of factors. The cell frequencies of a factor with relation to others provide support for that factor leading to those other factors. In this example, we considered a three‐factor LSA. Therefore, we will obtain a matrix F of inter‐factor statement frequencies. The process of obtaining an inter‐factor statement frequency matrix is described in the following.
ff ×
3×3
Step 1: The statement loadings (Table B7) are separated into X statement loadings and Y statement loadings. The separated X and Y statement loadings for Table B7 are provided in Table B8 and Table B9, respectively. Table B8: X statement loadings
Table B9: Y statement loadings
136

Step 2: Each X statement is taken at a time and its factor associations are noted. These factor associations are called the X factor associations or the independent factor associations. For instance, the first X statement Ginsberg 2004 X1 is associated with Factor F1. Therefore, for this statement, Factor F1 acts as an independent factor.
Step 3: The corresponding Y statement(s) of the X statement in Step 2 are determined based on the XY statement pairs (Table B1). For instance, Table B1 indicates that the corresponding Y statement(s) of Ginsberg 2004 X1 is Ginsberg 2004 Y1.
Step 4: The factor associations of each Y statement in Step 3 are noted. These factor associations are called the Y factor associations or the dependent factor associations. The Y statement Ginsberg 2004 Y1 is associated with Factor F2. Therefore, for this statement, Factor F2 is a dependent factor.
Step 5: Each X factor association is tallied with all of its corresponding Y factor associations. A tally of an X factor association with a Y factor association provides an entry to the cell of the matrix F located at the intersection of the X factor and the Y factor. A cell entry of 1 indicates that there is one support for the X factor leading to the Y factor. For Ginsberg 2004 X1 ‐ Ginsberg 2004 Y1 pair, the X factor is Factor F1 (Step 2) and the corresponding Y factor is Factor F2 (Step 4). By using X factors as the column headers and the Y factors as the row headers, this indicates that there will be a cell entry of 1 at the intersection column 1 and row 2. Figure B2 shows the schematic view of the inter‐factor association of the Ginsberg 2004 X1 ‐ Ginsberg 2004 Y1 pair. Table B10 presents the corresponding cell entry into matrix F.
ff ×
Figure B2: Inter‐factor associations
Ginsberg 2004 X1 Associations
F1
Ginsberg 2004 Y1 Associations
F2
Support
1
137

Table B10: Inter‐factor matrix F
Step 6: Steps 2 thru 5 are repeated until all X statements (Table B8) are exhausted.
Figure B3 provides the schematic view of the inter‐factor associations of the Simms 2004 X1. The corresponding Y statements of Simms 2004 X1 are Simms 2004 Y1 and Simms 2004 Y2.
Figure B3: Inter‐factor associations
1
138

Table B11: Final inter‐factor matrix F
The cell frequencies of matrix F are of critical importance. They provide the strength of association between the independent factors and the dependent factors. The percentages that the cell frequencies account for can be used to compare two or more relationships among the factors. Various statistics can be developed using matrix F. Two of these statistics are the X‐index and the Y‐index. An X‐index relates to an X factor and is the sum of the cell frequencies of the column that the factor represents. On the other hand, a Y‐index relates to a Y factor and is the sum of the cell frequencies of the row that the factor represents. For example, the X‐index for F1 as an independent factor is 3; the X‐index for F2 as an independent factor is 0; and the X‐index for F3 as an independent factor is 0. On the contrary, the Y‐index for F1 as a dependent factor is 0; the Y‐index for F2 as a dependent factor is 2; and the Y‐index for F3 as a dependent factor is 1. Yet another statistic is the X – Y differential. These statistics are shown in Table B12.
Table B12: X‐index, Y‐index, and X – Y differential
While the X‐index of a factor represents the overall impact of the factor as an independent factor, the Y‐index shows the overall effect on the factor as a dependent factor. The X – Y differential can be used to decide whether a factor is a net independent or dependent factor. Table B12 indicates that F1 is a net independent factor, and both F2 and F3 are net dependent factors. These statistics along with cell frequencies can be expressed as percentages for better comparison purposes. Table B13 presents these percentages.
139

Table B13: Matrix F – percentage measures
Based on the percentage measures in Table B13, the inter‐factor relationships and their strength of associations are portrayed in Figure B4.
Figure B4: Inter‐factor relationships and their strength of association
BPM solution
Business processes
Timely decisions
(0.67)
140

APPENDIX C
INPUT‐OUTPUT STATEMENT (XY STATEMENT) CODING SCHEME
141

Table C1: Input‐output statement (XY statement) coding scheme Raw Statements Input‐Output Statements In order to (verb) Y, X Or, X in order to (verb) Y Companies must have the necessary organizational structure in order to improve the day‐to‐day management of their business
Input: X Output: Subject of X (verb) Y Input: companies must have the necessary organizational structure Output: companies improve the day‐to‐day management of their business
By (verb particle) X, Y By refocusing customer strategy, retooling measurement mechanics, and taking steps to realign the organization around customers, companies can retain and grow existing customers
Input: Subject of Y (verb) X Output: Y Inputs: (1) companies refocus customer strategy, (2) companies retool measurement mechanics, (3) companies take steps to realign the organization around customers Output: companies can retain and grow existing customers
When X then Y When an organization take a methodical approach to performance management, it becomes high‐performance organization
Input: X Output: Y Input: an organization take a methodical approach to performance management Output: an organization becomes high‐performance organization
X (yields/ provides/ results in/ causes/ allows/ enables/ achieves/ guides/ ensures /brings /etc.) Y Plans that are developed in a more collaborative environment yield more commitment from the people who have to bring them to fruition
Input: X Output: Y Input: plans are developed in a more collaborative environment Output: plans yield more commitment from the people who have to bring them to fruition
If X, then Y If companies do not provide exceptional customer service, customers will not renew their contracts
Input: X Output: Y Input: companies do not provide exceptional customer service Output: customers will not renew their contracts
For X to (verb) Y, X (be) to (verb) Z For BPM to provide the benefits that make it worth the investment, it has to focus on the right data
Input: X (be) to (verb) Z Output: X (verb) Y Input: BPM has to focus on the right data Output: BPM provides the benefits that make it worth the investment
Continued
142

Table C1: Continued X because Y Companies add OLAP technology to their BPM solution because they need to extract transaction information from all parts of their IT infrastructure
Input: X Output: Y Input: companies add OLAP technology to their BPM solution Output: companies need to extract transaction information from all parts of their IT infrastructure
To (do) Y, (need) X To integrate the data from the acquisition's IT systems into its BPM reporting framework, Logistics USA layers OLAP software on top of the acquired organization's disparate data sources
Input: X Output: Y Input: Logistics USA layers OLAP software on top of the acquired organization's disparate data sources Output: Logistics USA integrates the data from the acquisition's IT systems into its BPM reporting framework
Y requires X Or X is required for Y Establishing and sustaining a complexity management program requires dedicated resources and the involvement of the organization's top management
Input: X Output: Y Input: dedicated resources and the involvement of the organization's top management Output: establishing and sustaining a complexity management program
X so as to Y Maintenance should be managed better so as to cultivate a sense of ownership in the operators
Input: X Output: Y Input: maintenance should be managed better Output: cultivate a sense of ownership in the operators
Because of X, Y Because of the wide acclaim received by the Malcolm Baldrige Award, it has served as a model for national quality awards by many countries throughout the world
Input: X Output: Y Input: the wide acclaim received by the Malcolm Baldrige Award Output: it has served as a model for national quality awards by many countries throughout the world
X is associated to/likely to create/etc. Y Firms with higher amounts of intangible assets are more likely to create shareholder value
Input: X Output: Y Input: firms with higher amounts of intangible assets Output: create shareholder value
Continued
143

Table C1: Continued Z uses X to improve/cause/enhance/etc. Yfaculty members have used the Criteria for Performance Excellence and the underlying concepts of the MBNQA to enhance the learning experiences of their students
Input: X Output: Y Input: the Criteria for Performance Excellence and the underlying concepts of the MBNQA Output: the learning experiences of students
By means of X, Y By means of concrete exercises and experiences, Dale's Cone of Experience is employed to better leverage the student's ability to understand the abstract concepts
Input: X Output: Y Input: concrete exercises and experiences Output: Dale's Cone of Experience is employed to better leverage the student's ability to understand the abstract concepts
Y through X OR Through X, Y The West has created competitiveness through fostering a culture of entrepreneurship
Input: X Output: Y Input: fostering a culture of entrepreneurship Output: the West has created competitiveness
144

REFERENCES
Ambastha, A., & Momaya, K. (2004). Competitiveness of firms: Review of theory, frameworks, and models. Singapore Management Review, 26(1), 45–61.
Ariyachandra, T. R., & Florick, M. N. (2008). Critical success factors in business performance
management – Striving for success. Information Systems Management, 25(3), 113‐120. Ballard, C., White, C., McDonald, S., Myllymaki, J., McDowell, S., Goerlich, O., & Neroda, A.
(2005). Business performance management meets business intelligence, accessed August 1, 2007, available online at http://www.redbooks.ibm.com/redbooks/pdfs/sg246340.pdf.
Bell, R., & Keys, B. (1998). A conversation with Curt W. Reimann on the background and future
of the Baldrige Award. Organizational Dynamics, 26(4), 51–61. Bemowski, K. (1996). Baldrige Award celebrates its 10th birthday with a new look. Quality
Progress, 29(10), 49–54. Bemowski, K., & Stratton, B. (1995). How do people use the Baldrige Award criteria? Quality
Progress, 28(5), 43–47. Berry, M. W. (1992). Large scale singular value computations. International Journal of
Supercomputer Applications, 6, 13–49. Berry, M., Dumais, S., and O’Brien, G. (1995). Using linear algebra for intelligent information
retrieval. SIAM Review, 37(4), 573–595. Black, J. S., Mendenhall, M., & Oddou, G. (1991). Toward a comprehensive model of
international adjustment: An integration of multiple theoretical perspectives. Academy of Management Review, 16(2), 291–317.
Buchanan, L., & O’Connell, A. (2006). A brief history of decision making. Harvard Business
Review, 84(1), 32–42. Business Performance Management Magazine [BPMM]. (September 2005). BPM consulting
guide 2005, accessed August 1, 2007, available online at http://bpmmag.net/images/archive/magazine_issues_2005_september_2005consultingguide.pdf.
Byrne, B.M. (1998). Structural equation modeling with LISREL, PRELIS, and SIMPLIS: Basic
concepts, applications, and programming. New Jersey: Lawrence Erlbaum Associates.
145

Clark, Jr., T. D., Jones, M. C., & Amstrong, C. P. (2007). The dynamic structure of management support systems: Theory development, research focus, and direction. MIS Quarterly, 31(2), 1–37.
Cokins, G. (2007). Performance management: Creating economic value. Industrial
Management, 49(2), 14–20. Deerwester, S., Dumais, S., Furnas, G., Landauer, T., & Harshman, R. (1990). Indexing by latent
semantic analysis. Journal of the American Society for Information Science, 41(6), 391–407.
Dow, D., Samson, D., & Ford, S. (1999). Exploding the myth: Do all quality management
practices contribute to superior quality performance? Production and Operations Management, 8(1), 1–27.
Dumais, S. (2004). Latent semantic analysis. Annual Review of Information Science and
Technology, 38, 189–230. Eckerson, W. (March 2004). Best practices in business performance management: Business and
technical strategies. TDWI The Data Warehousing Institute Report Series, 1–31. Eckerson, W.W. (2005). Performance dashboards: Measuring, monitoring, and managing your
business. Hoboken, NJ: John Wiley & Sons. Efron, M. (2005). Eigenvalue‐based model selection during latent semantic indexing. Journal of
the American Society for Information Science and Technology, 56(9), 969–988. Ettorre, B. (1996). Is the Baldrige still meaningful? Management Review, 85(3), 28–31. Evans, J. R. (1997). Critical linkages in the Baldrige Award criteria: Research models and
educational challenges. Quality Management Journal, 5(1), 13–30. Evans, J. R., & Jack, E. P. (2003). Validating key results linkages in the Baldrige performance
excellence model. Quality Management Journal, 10(2), 7–24. Flynn, B. B., & Saladin, B. (2001). Further evidence on the validity of the theoretical models
underlying the Baldrige criteria. Journal of Operations Management, 19, 617–652. Frakes, W. B. & Baeza‐Yates, R. (1992). Information retrieval: Data structures and algorithms.
Englewood Cliffs, New Jersey: Prentice‐Hall. Garvin, D.A. (1991). How the Baldrige Award really works. Harvard Business Review, 69(6), 80–
93.
146

Gradig, R. M., & Harris, J. K. (1994). The Baldrige Award: A quest for excellence. Review of Business, 15(3), 20–24.
Han, J., & Kamber, M. (2006). Data mining: Concepts and techniques (2nd ed.). Morgan
Kaufmann Publishers. Handfield, R. B., & Ghosh, S. (1995). An empirical test of linkages between the Baldrige criteria
and financial performance. Proceedings of Decision Sciences Institute Annual Meetings. Boston, Massachusetts, 1713–1715.
Hossain, M. M., & Prybutok, V. R. (2008). Integration of the business performance management
framework and the Malcolm Baldrige National Quality Award framework to address enhanced competitiveness. Proceedings of the Decision Sciences Institute. Baltimore, Maryland, 3461–3466.
Kaiser, H.F. (1958). The varimax criterion for analytic rotation in factor analysis. Psychometrika,
23, 187–200. Khilji, S. E., Mroczkowski, T., & Bernstein, B. (2006). From invention to innovation: Toward
developing an integrated innovation model for biotech firms. Journal of Product Innovation Management, 23(6), 528–540.
Kochan, A. (1992). Baldrige Award as a quality model. Quality, 31(2), 17–20. Landauer, T. K. (2002). On the computational basis of learning and cognition: Arguments from
LSA. In N. Ross, (Ed.), The psychology of learning and motivation, 41, 43–84. Landauer, T., Foltz, P., & Laham, D. (1998). Introduction to latent semantic analysis. Discourse
Processes, 25, 259–284. Landauer, T., Laham, D., & Derr, M. (2004). From paragraph to graph: Latent semantic analysis
for information visualization. Proceedings of the National Academy of Sciences of the United States of America (PNAS), 101(Suppl 1), 5214–5219.
Meyer, S. M., & Collier, D. A. (2001). An empirical test of the causal relationships in the Baldrige
health care pilot criteria. Journal of Operations Management, 19, 403–425. Moss, L. T., & Atre, S. (2003). Business intelligence roadmap: The complete project lifecycle for
decision‐support applications. Boston: Addison Wesley. National Institute for Standards and Technology [NIST]. (1993). Malcolm Baldrige National
Quality Award: 1993 award criteria. Gaithersburg, MD: National Institute of Standards And Technology.
147
NIST. (1997). Malcolm Baldrige National Quality Award: 1997 award criteria. Gaithersburg, MD: National Institute of Standards And Technology.
NIST. (2000). Baldrige criteria for performance excellence. Gaithersburg, MD: National Institute
of Standards And Technology. NIST. (2007). 2007 criteria for performance excellence, accessed August 10, 2007, available
online at http://www.quality.nist.gov/PDF_files/2007_Business_Nonprofit_Criteria.pdf. NIST. (2008). 2008 criteria for performance excellence, accessed May 15, 2008, available online
at http://www.baldrige.nist.gov/PDF_files/2008_Business_Nonprofit_Criteria.pdf. Ord, T., Martins, E., Thakur, S., Mane, K., & Börner, K. (2005). Trends in animal behaviour
research (1968-2002): Ethoinformatics and the mining of library databases. Animal Behaviour, 69, 1399–1413.
Pannirselvam, G. P., & Ferguson, L. A. (2001). A study of the relationships between the Baldrige
categories. International Journal of Quality and Reliability Management, 18(1), 14–34. Pannirselvam, G. P., Siferd, S. P., & Ruch, W.A. (1998). Validation of the Arizona Governor’s
Quality Award: A test of the Baldrige criteria. Journal of Operations Management, 16(6), 529–-550.
Porter, M. (1980). An algorithm for suffix stripping. Program, 14(3), 130–137. Prajogo, D. I. (2005). The comparative analysis of TQM practices and quality performance
between manufacturing and service organizations. International Journal of Service Industry Management, 16(3), 217–228.
Pritchard, A. (2008). The new BPM: Enterprise performance management, accessed April 5,
2008, available online at http://bpmmag.net/mag/new_bpm_enterprise_performance_management_/.
Prybutok, V. R., & Spink, A. (1999). Transformation of a healthcare information system: A self-
assessment survey. IEEE Transactions on Engineering Management, 46(3), 299–310. Prybutok, V. R., Zhang, X., & Ryan, S. D. (2008). Evaluating leadership, IT quality, and net
benefits in an e-government environment. Information & Management, 45(3), 143–152. Rogers, E. M. (2003). Diffusion of innovations (5th ed.). New York: Free Press. Salton, G., & Buckley, C. (1988). Term-weighting approaches in automatic text retrieval.
Information Processing & Management, 24(5), 513–523.
148

Samson, D., & Terziovski, M. (1999). The relationship between total quality management practices and operational performance. Journal of Operations Management, 17(4), 393–409.
Sidorova, A., Evangelopoulos, N., Valacich, J., & Ramakrishnan, T. (2008). Uncovering the
intellectual core of the information systems discipline. MIS Quarterly, 32(3), 467–482. Thurstone, L. L. (1947). Multiple factor analysis. Chicago, IL: University of Chicago Press. TYBEA (2001). Malcolm Baldrige National Quality Award: Ten years of business excellence for
America, accessed August 1, 2007, available online at http://www.nist.gov/public_affairs/baldrdist.pdf.
Verloop, J. (2006). The Shell way to innovate. International Journal of Technology Management,
34(3/4), 243–259. Wilson, D. D., & Collier, D. A. (2000). An empirical investigation of the Malcolm Baldrige
National Quality Award causal model. Decision Sciences, 31(2), 361–390. Winn, B. A., & Cameron, K. S. (1998). Organizational quality: An examination of the Malcolm
Baldrige National Quality Award framework. Research in Higher Education, 39(5), 491–512.
149