Embed Size (px)
Citation preview

PEER-REVIEWED ARTICLE bioresources.com
Xu et al. (2020). “Pyrolysis kinetics Pinus sylvestris,” BioResources 15(3), 5577-5592. 5577
Investigating the Pyrolysis Kinetics of Pinus sylvestris Using Thermogravimetric Analysis
Langui Xu,a Jiawei Zhou,a Jiong Ni,a Yanru Li,b Yan Long,c and Ruyi Huang a,c,d,*
Thermogravimetric analyses of Pinus sylvestris from Xinxiang were performed to investigate its kinetic characteristics, which could provide information for industrial applications. Thermal degradation experiments were conducted at various heating rates of 10 °C/min, 20 °C/min, and 60 °C/min using a thermogravimetric analysis-differential scanning calorimetry (TG-DSC) analyzer with an inert environment. The peak pyrolysis temperatures of the three major components (hemicellulose, cellulose, and lignin) were predicted by the Kissinger-Kai method, and activation energy values (Eα) were calculated. The Eα of Pinus sylvestris was also estimated by two model-free methods. The decomposition reactions of hemicellulose, cellulose, and lignin at different temperatures were the main reason for fluctuations in Eα. The time for heat transfer was less sufficient at a high heating rate compared with that at a low heating rate, which caused the temperature gradients in the samples. Therefore, the temperature of maximum exothermic peaks was higher than the maximum pyrolysis temperature. This kinetic study could be useful for providing guidance for optimizing the biomass pyrolysis process.
Keywords: Pinus sylvestris; Pyrolysis; Thermogravimetry; Activation energy
Contact information: a: School of Mechanical Engineering, North China University of Water Resources
and Electric Power, Zhengzhou 450011, China; b: College of Architecture and Urban-Rural Planning,
Sichuan Agricultural University, Chengdu 611830, China; c: Biogas Institute of Ministry of Agriculture,
Risk Assessment Lab of the Quality Safety of Biomass Fermentation Products (Chengdu), Ministry of
Agriculture and Rural Affairs, Chengdu 610041 China; d: Rural Energy Office of Sichuan
Province, Chengdu, 610041 China; *Corresponding author: [email protected]
INTRODUCTION
The world’s energy demand continues to grow with economic development and
population growth, although energy efficiency is on the rise. The consumption of fossil
fuels induces global climate change, and sources of fossil fuel energy are dwindling (Huang
et al. 2019). Renewable energy has been beneficial for solving the energy shortage of
countries. Biomass energy, which can be converted into solid, liquid, and gaseous fuels, is
a unique renewable energy and renewable carbon source (Nurek et al. 2019). Biomass
energy, such as that derived from agricultural and forestry residues, is abundant and
considered to be the fourth largest energy resource (Cai et al. 2019; Rodríguez-Jiménez et
al. 2019). Biomass fuels can be roughly divided into three categories: wood and forestry
processing residues, herbs, and agricultural processing residues. With its high forest
coverage, China is considered an agricultural country. Thus, the annual production of
agricultural and forest residues is vast. Agricultural and forest residues are collectively
referred to as lignocellulosic biomass and are effective in generating heat and power via
thermochemical processes (Ding et al. 2016). Forest biomass contains fewer harmful

PEER-REVIEWED ARTICLE bioresources.com
Xu et al. (2020). “Pyrolysis kinetics Pinus sylvestris,” BioResources 15(3), 5577-5592. 5578
elements, and there is little slagging and exhaust emission after combustion, which is the
main superior quality of bioenergy (Wu et al. 2019; Ding et al. 2020). Pinus sylvestris,
which can release more heat than other wood, is a typical and flammable plant with a large
amount of turpentine. This plant burns completely and is environmentally friendly. Due to
its physical properties, Pinus sylvestris is one of the most popular biomass energy sources.
Characterization of biomass determines its fuel potential. The best energy input
utilization can be obtained by studying the thermal characteristics and fundamental
chemistry of biomass. Pyrolysis processes are the first step in gasification and combustion,
which is the thermal conversion reaction in which biomass transforms into chars, gases,
and liquids of oxygenated organic compounds (Wang et al. 2017). Many researchers have
studied the biomass pyrolysis characteristics of Lentinus edodes (Zou et al. 2019), cattle
manure (Zhang et al. 2019), incense sticks (Wen et al. 2019), sorghum straw (Dhyani et al.
2017), coffee ground residues (Fermoso and Mašek 2018), corn stalk (Cai et al. 2018), and
so on. However, the properties of biomass can vary in different environments and climates.
The northern part of Xinxiang, Henan Province of China, with its rich forest
resources, is located in the hilly land of the Taihang Mountains. Pinus sylvestris is planted
in large areas. This paper studied the thermochemical processes of Pinus sylvestris from
Xinxiang. The results could provide guidance for optimizing equipment. The
Pinus sylvestris samples were subjected to thermogravimetric analysis with different
heating rates (10 °C/min, 20 °C/min, and 60 °C/min) to determine its characteristics. The
nonisothermal kinetic methods of Kissenger-Akahira-Sunose (KAS) and Flynn-Wall-
Ozawa (FWO) were used to determine pyrolysis kinetics to preferentially describe the
thermal decomposition process. These methods were efficient in calculating activation
energy values (Eα) because there was no reaction model assumption (Vyazovkin et al. 2011;
Shi et al. 2017). Using experimental data, the peak pyrolysis temperatures of the three
major components (hemicellulose, cellulose, and lignin) were predicted by the Kissinger-
Kai method, and Eα values were also calculated in this paper.
EXPERIMENTAL
Materials Pinus sylvestris used in this study was sampled from the countryside of Xinxiang,
China. The samples were dried at ambient atmosphere for 3 d to remove their moisture,
and then they were crushed and sieved through an 80-mesh screen to obtain a uniform size,
which could lower temperature gradient within particles. The samples were then placed in
plastic bags to prevent moisture absorption.
Methods Proximate and ultimate analyses
An automatic proximate analyzer (5E-MAC/GIII; Changsha Kaiyuan Instruments
Co., Ltd., Changsha, China) was used to perform proximate analysis to determine volatile
matter (VM), moisture (M), and ash (A) contents. Fixed carbon (FC) was determined by
the equation: FC = 100 - (M + A + VM). An ultimate analyzer with a Vario EL cube
(Elementar, Langenselbold, Germany) was used to estimate the contents of hydrogen (H),
carbon (C), sulfur (S), nitrogen (N), and oxygen (O calculated by difference). All results
are presented in Table 1.

PEER-REVIEWED ARTICLE bioresources.com
Xu et al. (2020). “Pyrolysis kinetics Pinus sylvestris,” BioResources 15(3), 5577-5592. 5579
Table 1. Proximate and Ultimate Analyses of Pinus sylvestris
Ultimate Analysis (wt%)
Proximate Analysis (wt%)
Cad 50.81 Mad 8.0
Had 6.45 Vad 80.86
Oad 42.52 Aad 0.665
Nad 0.23 FCad 11.275
Sad 0
ad, air-dried basis; Oad (%) = 100% - Cad - Had - Nad - Sad
Pyrolysis tests
Thermogravimetric (TG) analysis was performed with a TG analyzer (SDT Q600;
TA Instruments, New Castle, DE, USA) in N2 atmosphere. Samples with weights lower
than 8 mg were placed in alumina crucibles and then heated from room temperature to
900 °C at heating rates of 10 °C/min, 20 °C/min, and 60 °C/min under a nitrogen gas flow
rate at 100.0 mL/min. Each experiment was repeated twice to ensure repeatability.
Mathematical Model Development The TG supplied a quality atmosphere and an alterable heating rate, which reduced
the effect of thermal gradients and heat transport during pyrogenic decomposition of small
samples (Jiang et al. 2015). A mathematical model was developed to analyze the TGA-
differential scanning calorimetry (DSC) data. The rate of material decomposition with the
iso-conversional method is given as Eq. 1,
(1)
where á is the conversion rate, which is defined in Eq. 2,
−
−=
mm
mma t
0
0 (2)
where m0 is the initial mass (mg), mt is the actual mass (mg) at t moment, and m is the
final residual mass (mg).
The reaction model is represented by f(á), which is a function of the conversion rate
as shown in Eq. 3,
( ) ( )naaf −= 1 (3)
where n is the reaction order and k is the constant of the reaction rate, which is dependent
on the temperature expressed by the Arrhenius equation, which is shown in Eq. 4,
( )RTEAk a /exp −= (4)
where Eα is activation energy value (kJ/mol), T is absolute pyrolysis temperature (K), R is
the universal gas constant (8.31 J/(K·mol)), and A is the pre-exponential factor (s-1).
Introducing the heating rate, â (K/min), shown in Eq. 5,
(5)
and combining Eq. 1 and Eq. 4 with Eq. 5 results in Eq. 6 below:

PEER-REVIEWED ARTICLE bioresources.com
Xu et al. (2020). “Pyrolysis kinetics Pinus sylvestris,” BioResources 15(3), 5577-5592. 5580
( )( ) ( )RTEaAdT
daa
n/exp1/ −= (6)
Equation 6 was integrated after rearrangement with the conversion rate from zero,
so the total conversion can be given as follows in Eq. 7,
( )( )
( )( ) ( )xpRAEdx
x
x
R
AEdt
RT
EA
a
daag a
X
aT
T
aa
n
/
expexp
120 0
=−
=
−=
−=
(7)
where RTEx a /= , ( )xp is the temperature integral without the analytical solution and
g(a) is the conversion quantity from the start of the experiment to the moment t. The
methods used to evaluate kinetic parameters from TGA data are based on Eqs. 6 and 7.
Kinetic Analysis The kinetic parameters of nonisothermal thermal experiments were estimated to
optimize the process of biomass thermal degradation. The KAS and FWO methods were
used to calculate kinetic and thermodynamic parameters of the samples without model
assumption.
KAS method
The KAS method, which is expanded from Kissinger (1957) and Akahira and
Sunose (1971), is a model-free method that is expressed as follows in Eq. 8:
( ) RT
E
aRg
AE
T
aa −
= lnln
2
(8)
For a given conversion rate, the line of ln (β/T2) against 1/T was plotted, and the Eá
could be calculated by the slope expression Ea /R. If g(α) could be determined, the pre-
exponential factor A (s-1) was also calculated by the intercept from Eq. 8.
FWO method
The FWO method derived from the Doyle approximation is another model-free
model that is often used to estimate kinetic parameters. The FWO method can be expressed
as shown in Eq. 9,
( ) RT
E
aRg
AE aa 0516.1335.5lnln −−= (9)
where g(α) is expressed as in Eq. 7. Because ln[(AE)/(Rg(α))] did not relate to β, the Eá
was determined using the slope expression (-1.0516 Ea / R). There was no assumption
concerning the reaction mechanism for the Ea calculation. The pre-exponential factor A
could be obtained from the intercept expression ln[(AE)/(Rg(α))] when g(α) was
determined.
Kissinger-Kai method
The Kissinger-Kai method, based on the Kissinger method (Kissinger 1956), was
developed by Li et al. (2014). Hemicellulose, cellulose, and lignin are the main components
of lignocellulosic biomass, and each component should decompose at different peak
temperatures. The corresponding activation energies can be computed when peak values

PEER-REVIEWED ARTICLE bioresources.com
Xu et al. (2020). “Pyrolysis kinetics Pinus sylvestris,” BioResources 15(3), 5577-5592. 5581
are presented. The absolute second derivative of TG (|DDTG|) can determine the peak
locations corresponding to the main components, as shown in Eq. 10,
01 2
2
== =
N
i
ti
i
t
dT
mdf
dT
dT
dmd
DDTG (10)
where 0
0
m
mf i
i = is the initial mass fraction of every part i, and 11
= =
N
i if . When one
component reached the maximum decomposition rate at the peak temperature,
max/ →dTdai at piTT = , its second derivative (|DDTG|) would decrease rapidly to a
local minimum (Channiwala and Parikh 2002). The peak temperature of main components
(Tp,i ) could be confirmed by the minimum value if there were no other major peaks nearby.
Then, Eα was confirmed by the Kissinger method for different peaks, as shown in Eq. 11,
ip
a
aipRT
E
E
AR
T ,
2
,
lnln −
=
(11)
where p,i denotes the peak temperature (°C) of different components, and Eα can be
calculated by the slope expressions, ln[ /(𝑇𝑝,𝑖2 )] against (1/Tp,i ).
RESULTS AND DISCUSSION
Physicochemical Properties of Pinus sylvestris Moisture content of the samples reached 8.0% as shown in the proximate analysis
results in Table 1. The samples were considered quality fuels because moisture content was
less than 10%, which would be suitable for combustion (Font et al. 2005). Volatile matter
increased to 80.1%, and ash content decreased to 0.665%. Because of low ash content,
Pinus sylvestris samples were not easy to slag when burned (Chen et al. 2019). The samples
contained no sulfur and little nitrogen, which caused few emissions of toxic gases during
pyrolysis and combustion. High heating values (HHV, MJ/kg) of the samples, which is the
total energy released when subjected to combustion, can be calculated with Eq. 12
(Nhuchhen and Abdul Salam 2012),
Ash
FC
VM
Ash
FC
VMHHV 0234.09584.12135.0288.19 +−−= (12)
where VM is volatile matter (%) and FC is fixed carbon (%), and the HHV of
Pinus sylvestris was calculated as 18.16 MJ/kg.
Influence of Heating Rate on TG and DTG Analyses Thermogravimetry ((D)TG) analyses were used to study thermal conversion of the
samples. Weight of residual mass of the samples varied with pyrolysis temperature. Water
evaporation, hemicellulose, cellulose, and lignin gradually decomposed with the increase
in temperature. Total biomass decomposition could be considered as the superposition of

PEER-REVIEWED ARTICLE bioresources.com
Xu et al. (2020). “Pyrolysis kinetics Pinus sylvestris,” BioResources 15(3), 5577-5592. 5582
these main components (Ahmad et al. 2017). The TG experiment was conducted at heating
rates of 10 °C/min, 20 °C/min, and 60 °C/min from ambient temperature to 900 °C at a N2
flow rate of 100 mL/min. Figure 1 shows the effect of heating rate on Pinus sylvestris mass
loss rate. With the increase in heating rate (β), TG and DTG curves moved to higher
temperature regions. However, the thermal decomposition trend was not affected. The
temperature transformation showed the thermal hysteresis. Therefore, with the increase in
heating rate, atmosphere temperature in the TG analyzer increased during the time interval
when heat transferred to the sample center.. As the heating rate decreased, the mass losses
increased as the reaction became more sufficient. Similar conclusions were also reported
in other studies (Ding et al. 2016; Ahmad et al. 2017).
(a) (b)
Fig. 1. TG (a) and DTG (b) curves of Pinus sylvestris as a function of temperature in a N2 atmosphere
Fig. 2. TG/DTG curves of Pinus sylvestris at a heating rate of 10 °C/min
The three-main components of lignocellulosic biomass have different structure.
Hemicellulose has an amorphous structure with little strength which is easy to pyrolyze at
low temperatures. Cellulose is crystalline and has strong resistance to hydrolysis with a
high pyrolysis temperature range. Lignin is heavily interconnected, filling the three-
100 200 300 400 500 600 700 800 900 10000
0.2
0.4
0.6
0.8
1
Mass F
racti
on
(m
/m0)
Temperature (oC)
10 oC·min-1
20 oC·min-1
60 oC·min-1
200 300 400 500 600-10
-8
-6
-4
-2
0
(dm
/dm
0)/
dT
·10
-3
Temperature (oC)
10 oC·min-1
20 oC·min-1
60 oC·min-1
PEER-REVIEWED ARTICLE bioresources.com
Xu et al. (2020). “Pyrolysis kinetics Pinus sylvestris,” BioResources 15(3), 5577-5592. 5583
dimensional space of biomass with a wide pyrolysis temperature range. Therefore, there
were four different mass loss stages in Fig. 2. For the heating rate of 10 °C/min, the
moisture was free water in the sample (surface moisture and inherent moisture) that
evaporated from room temperature to 105 °C in the first stage, and the total mass loss
was approximately 5%. At the second stage, mass loss was mainly because hemicellulose
decomposed. Total mass loss was approximately 48% from 105 °C to 330 °C. At the third
stage, a maximum mass loss occurred because cellulose decomposed, and total mass loss
reached 76% between 320 °C and 397 °C. The total mass loss percent could reach
approximately 84% from 397 °C to 900 °C, which was attributed to lignin degradation
(Lahijani et al. 2019). There was a rapid decrease in mass loss rate until 397 °C. Then,
there was a slow decrease in mass loss rate, and mass change was small after 550 °C.
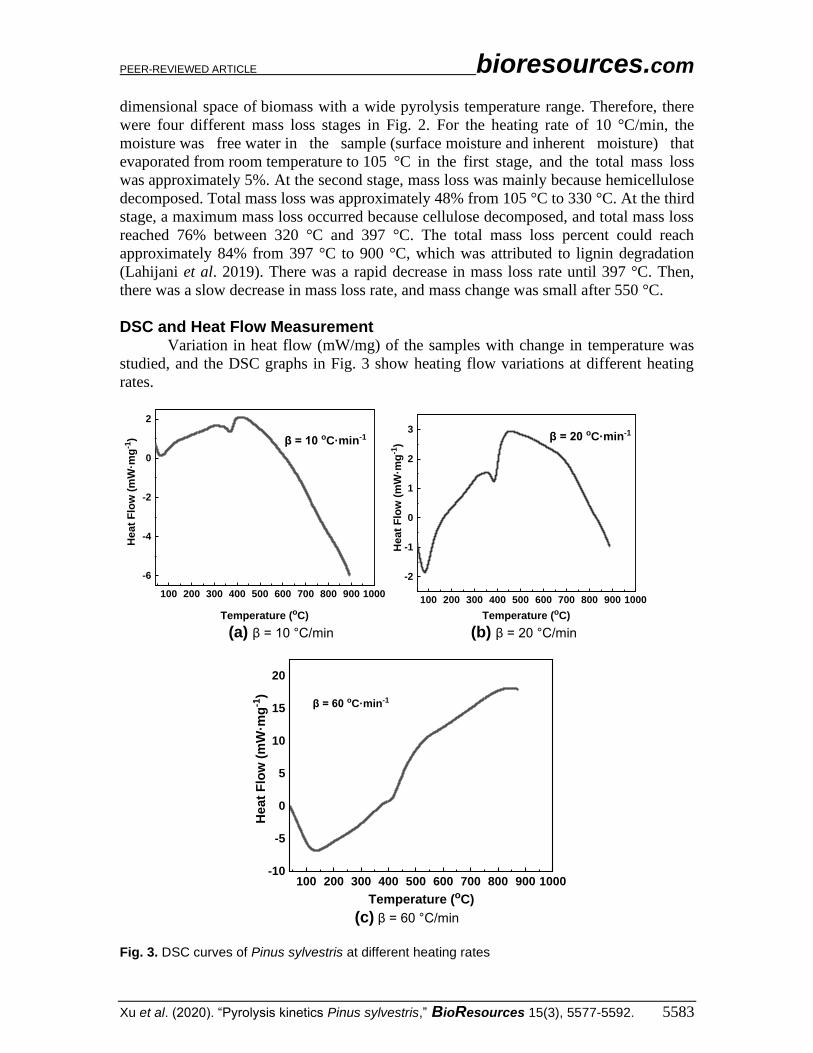
DSC and Heat Flow Measurement
Variation in heat flow (mW/mg) of the samples with change in temperature was
studied, and the DSC graphs in Fig. 3 show heating flow variations at different heating
rates.
(a) β = 10 °C/min (b) β = 20 °C/min
(c) β = 60 °C/min
Fig. 3. DSC curves of Pinus sylvestris at different heating rates
100 200 300 400 500 600 700 800 900 1000
-6
-4
-2
0
2
He
at
Flo
w (
mW
·mg
-1)
Temperature (oC)
β = 10 oC·min-1
100 200 300 400 500 600 700 800 900 1000
-2
-1
0
1
2
3
Heat
Flo
w (
mW
·mg
-1)
Temperature (oC)
β = 20 oC·min-1
100 200 300 400 500 600 700 800 900 1000-10
-5
0
5
10
15
20
Heat
Flo
w (
mW
·mg
-1)
Temperature (oC)
β = 60 oC·min-1

PEER-REVIEWED ARTICLE bioresources.com
Xu et al. (2020). “Pyrolysis kinetics Pinus sylvestris,” BioResources 15(3), 5577-5592. 5584
The heat flow had a nonlinear nature, as shown in Fig. 3. The endothermic peak in
all heating rates was approximately 100 °C because moisture was removed from the
samples. Exothermic reactions began during pyrolysis. A rapid increase in heat flux was
observed as temperature increased from 200 °C to 400 °C. At approximately 400 °C, a
second endothermic peak appeared in each of the three heating rates because the crystal
water was separated. At this point, pyrolysis was still an exothermic reaction. Maximum
heat flow increased with the increase in heating rate, which could reach 405 °C, 455 °C,
and 830 °C with heating rates of 10 °C/min, 20 °C/min, and 60 °C/min, respectively.
Maximum heat flow was obtained at a higher temperature than the max pyrolysis
temperature in DTG, which was 364 °C at 10 °C/min, 378 °C at 20 °C/min, and 399 °C at
60 °C/min, as shown in Fig. 2. This result indicated that the hysteresis effect existed
between inner and outer parts of the sample, which hindered the release of heat flow
(Huang et al. 2018).
After heat flux temperatures reached a maximum, heat flow decreased because the
reaction became weak, as shown in Fig. 2. The heat flow decreased with the decrease in
mass change until completion of the reaction.
KINETIC PARAMETERS ANALYSES
Activation Energies of Hemicellulose, Cellulose, and Lignin The order of thermal degradation of the three main substances from easiest to most
difficult was hemicellulose > cellulose > lignin (Grønli et al. 2002). Hemicellulose
pyrolysis should be located in the shoulder region of the DTG curve, and cellulose
pyrolysis was responsible for the maximum mass loss rate. Then, there was a rapid decline
and a long tail, which corresponded to lignin decomposition.
Fig. 4. K-S plots at different heating rates

PEER-REVIEWED ARTICLE bioresources.com
Xu et al. (2020). “Pyrolysis kinetics Pinus sylvestris,” BioResources 15(3), 5577-5592. 5585
With the Kissinger-Kai method, three peak temperatures were established with
the second derivative of TG curves, which corresponded to hemicellulose, cellulose, and
lignin at different heating rates. With the peak temperature of each component, ( )2
,/ln ipT
was plotted and fit against ipT ,/1 as shown in Fig. 4. Additionally, Eα could be obtained
with Eq. 11, which was 156.5 kJ/mol for hemicellulose, 193.8 kJ/mol for cellulose, and
159.7 kJ/mol for lignin. Table 2 shows the comparison between the calculated results and
the values reported in the literature (Branca et al. 2005; Zhang et al. 2014). Hemicellulose
and lignin started to decompose at almost the same time. The decomposition temperature
range of lignin was from beginning to end of decomposition, but the maximum
decomposition rate occurred in the higher temperature region. The decomposition
temperature range of cellulose was narrow, and decomposition rate was high (Chen et al.
2018).
Table 2. Calculation Results of Kinetic Parameters for Hemicellulose, Cellulose, and Lignin
Component Activation Energy Value (Eα) (kJ/mol)
Kissinger-Kai Method
Branca et al. (2005) Zhang et al. (2014)
Hemicellulose 156.53 147.00 179.85
Cellulose 193.84 193.00 240.23
Lignin 159.74 181.00 165.61
The results are generally consistent with the existing models (Branca et al. 2005;
Zhang et al. 2014), indicating that the mathematical assumptions used in the Kissinger-Kai
method are feasible. The pyrolysis reaction of lignocellulosic biomass is usually three-
component parallel reaction. Therefore, pyrolysis temperature range and peak temperatures
of the three components of different lignocellulosic biomass are basically the same, and
the total activation energy of lignocellulosic biomass will be different due to the different
content of each component. The calculation results and calculation methods can be
extended to lignocellulosic biomass with different chemical compositions.
Fig. 5. Estimation of peak locations of hemicellulose, cellulose, and lignin

PEER-REVIEWED ARTICLE bioresources.com
Xu et al. (2020). “Pyrolysis kinetics Pinus sylvestris,” BioResources 15(3), 5577-5592. 5586
With the Kissinger-Kai method, peak temperatures of different components are
shown in Fig. 5. The pyrolysis temperature range of different components with a heating
rate of 10 °C could be estimated as follows: from 225 °C to 325 °C for hemicellulose and
from 325 °C to 375 °C for cellulose, while lignin was pyrolyzed during the whole
decomposition process from 250 °C to 500 °C, which agrees with Ding et al. (2019).
Activation Energies of Pinus sylvestris
The TG records were used to calculate Pinus sylvestris chemical reaction kinetic
parameters with KAS and FWO methods, as described earlier. Table 3 shows the reaction
temperatures of different heating rates as well as the conversion rate.
Table 3. Reaction Temperature of Different Heating Rates and Conversion Rate
Conversion Rate
Reaction Temperature (°C)
10 °C/min 20 °C/min 60 °C/min
0.1 259 255 260
0.2 299 307 322
0.3 321 331 347
0.4 338 349 366
0.5 352 364 382
0.6 364 376 395
0.7 376 388 407
0.8 474 452 439
There was little or no correlation when conversion values were below 0.1 and above
0.8 (Müsellim et al. 2018). Therefore, the conversion value was chosen between 0.1 and
0.8 for the three heating rates (10 °C/min, 20 °C/min, and 60 °C/min). Using Eq. 8 and Eq.
9, ( )2/ln T was plotted and fitted against (1/T) with the KAS method, and ln was
plotted and fitted against (1/T) with the FWO method, as shown in Figs. 6 and 7,
respectively.
Fig. 6. KAS plots for different conversion rates

PEER-REVIEWED ARTICLE bioresources.com
Xu et al. (2020). “Pyrolysis kinetics Pinus sylvestris,” BioResources 15(3), 5577-5592. 5587
Fig. 7. FWO plots for different conversion rates
The straight-line slopes (Eá/R from KAS and 1.052 Eá/R from FWO) were used to
calculate Eα at different conversion rates (Damartzis et al. 2011; Arenas et al. 2019). The
mean values of Eá were 206.29 kJ/mol and 205.85 kJ/mol with the KAS and FWO methods,
respectively, as shown in Table 4. The difference in Eα calculated by KAS and FWO
models was less than 2% deviation. The difference approximation of the two methods
resulted in the deviation.
Table 4. Calculation Results of Kinetic Parameters and Correlation Factors (R2) for Different Conversion Values by KAS and FWO Models
Conversion Rate
KAS FWO
Eá (kJ/mol) R2 Eá (kJ/mol) R2
0.1 222.26 0.94 221.85 0.91
0.2 209.61 0.99 208.37 0.99
0.3 201.24 0.99 200.80 0.99
0.4 197.86 0.99 197.87 0.99
0.5 193.30 0.99 193.78 0.99
0.6 194.03 0.99 194.67 0.99
0.7 201.43 0.99 201.89 0.99
0.8 230.58 0.94 227.55 0.93 Mean value 206.29 205.85
Overall, fluctuation in Eα with the increase in conversion rate showed that complex
chemical reactions took place in the pyrolysis of Pinus sylvestris. The Eα represents the
minimum energy required for a chemical reaction. As Eα increased, the reaction rate
decreased, and it became more difficult for the reaction to occur. After water evaporation,
the pyrolysis process products of Pinus sylvestris were mainly composed of hemicellulose,
cellulose, and lignin. According to the difference in thermal stability for these three
components, the distribution of Eα was divided into three stages: the hemicellulose

PEER-REVIEWED ARTICLE bioresources.com
Xu et al. (2020). “Pyrolysis kinetics Pinus sylvestris,” BioResources 15(3), 5577-5592. 5588
pyrolysis stage when 0.1 < α < 0.3, the cellulose pyrolysis stage when 0.3 < α< 0.7, and
the lignin pyrolysis stage when 0.7 < α < 0.8.
In the first stage of 0.1 < α< 0.3, Eα ranged from 222.3 kJ/mol to 201.2 kJ/mol. The
Eα started at a higher value and then decreased. This stage mainly included degradation of
hemicellulose. Di Blasi and Lanzetta (1997) demonstrated that there are two stages of
hemicellulose pyrolysis. The first stage is the break of the branch chain at low temperature,
which results in volatile products and intermediate products. The degree of polymerization
is decreased. Then, main chains of intermediate products undergo depolymerization
reactions to produce various small molecular compounds, such as acetone, formic acid, and
propanal, while the temperature increases. Therefore, Eα required for the initial reaction
was high, while Eα required for the pyrolysis reaction was low after formation of
intermediate products.
The second stage was 0.3 < α< 0.7, and Eα ranged from 197.9 to 194.0 kJ/mol. The
Eα value slowly decreased. This stage mainly included degradation of cellulose. Bradbury
et al. (1979) noted that cellulose pyrolysis first produces active cellulose as an intermediate
product, with a reduced degree of polymerization and molecular chain length. The active
cellulose began to degrade with the increase in temperature. However, as degree of
polymerization decreased, thermal degradation became more likely to occur; thus, Eα
decreased compared with the initial stage.
The third stage was when 0.7 < α < 0.8, and Eα ranged from 201.4 kJ/mol to 230.6
kJ/mol. The Eα increased rapidly, and this stage had a higher Eα. This stage mainly included
degradation of lignin because lignin was mainly composed of three phenylpropane
structures, which were closely bound together. The thermal degradation was more difficult,
and the required activation energy was high. When the conversion rate reached 0.8, Eα
rapidly increased, which might have been because coke content of the solid pyrolysis
product on the lignin surface increased. Reactivity of carbon was low, but with the increase
in temperature, thermal degradation mainly depended on the diffusion reaction zone
diffusion rate. With the decrease in degradable substances (volatiles), reaction rate
decreased sharply, which resulted in the rapid increase in Eα (Chen et al. 2013; Ma et al.
2015).
CONCLUSIONS
1. The thermogravimetric–differential scanning calorimetry (TG-DSC) curves confirmed
that the degradation peak shifted towards a higher region without damaging the
decomposition behavior with increasing heating rate. The peak pyrolysis temperatures
of the three major components (hemicellulose, cellulose, and lignin) were predicted by
the Kissinger-Kai method, and Eα values were calculated to be 156.5, 193.8, and 159.7
kJ/mol, respectively.
2. The Eα values of Pinus sylvestris were estimated by two model-free methods at
different conversion rates, which were from 193.3 kJ/mol to 222.3 kJ/mol by the KAS
method and from 193.8 to 227.6 kJ/mol by the FWO method. The variation in Ea
showed that there were multistep kinetics during the degradation process. The
decomposition reaction of hemicellulose, cellulose, and lignin at different temperatures
was the main reason for fluctuation in activation energy.
PEER-REVIEWED ARTICLE bioresources.com
Xu et al. (2020). “Pyrolysis kinetics Pinus sylvestris,” BioResources 15(3), 5577-5592. 5589
3. At higher heating rates, there was not sufficient time for heat transfer compared to the
amount of time at lower heating rates. Therefore, there were temperature gradients in
the samples, and maximum exothermic peaks switched to a temperature higher than the
maximum pyrolysis temperature (DTG).
ACKNOWLEDGMENTS
This project was supported by the National Natural Science Foundation of China
(Grant No. 51805166), Key R & D Plan of Sichuan Science and Technology Program
(Grant No. 2020YFN0016), and the China Postdoctoral Science Foundation (Grant
No. 2019TQ0084), which are all gratefully acknowledged.
REFERENCES CITED Ahmad, M. S., Mehmood, M. A., Al-Ayed, O. S., Ye, G., Luo, H., Ibrahim, M., Rashid,
U., Nehdi, I. A., and Qadir, G. (2017). “Kinetic analyses and pyrolytic behavior of
para grass (Urochloa mutica) for its bioenergy potential,” Bioresource Technol. 224,
708-713. DOI: 10.1016/j.biortech.2016.10.090
Akahira, T., and Sunose, T. (1971). “Joint convention of four electrical institutes,” Res.
Rep. Chiba Inst. Technol. 16, 22-31.
Arenas, C. N., Navarro, M. N., and Martínez, J. D. (2019). “Pyrolysis kinetics of biomass
wastes using isoconversional methods and the distributed activation energy model,”
Bioresource Technol. 288, Article ID 121485. DOI: 10.1016/j.biortech.2019.121485
Bradbury, A. G. W., Sakai, Y., and Shafizadeh, F. (1979). “A kinetic model for pyrolysis
of cellulose,” J. Appl. Polym. Sci. 23(11), 3271-3280. DOI:
10.1002/app.1979.070231112
Branca, C., Albano, A., and Di Blasi, C. (2005). “Critical evaluation of global
mechanisms of wood devolatilization,” Thermochim. Acta 429(2), 133-141. DOI:
10.1016/j.tca.2005.02.030
Cai, H., Liu, J., Xie, W., Kuo, J., Buyukada, M., and Evrendilek, F. (2019). “Pyrolytic
kinetics, reaction mechanisms and products of waste tea via TG-FTIR and Py-
GC/MS,” Energy Convers. Manage. 184, 436-447. DOI:
10.1016/j.enconman.2019.01.031
Cai, J., Xu, D., Dong, Z., Yu, X., Yang, Y., Banks, S. W., and Bridgwater, A. V. (2018).
“Processing thermogravimetric analysis data for isoconversional kinetic analysis of
lignocellulosic biomass pyrolysis: Case study of corn stalk,” Renew. Sust. Energ. Rev.
82, 2705-2715. DOI: 10.1016/j.rser.2017.09.113
Channiwala, S. A., and Parikh, P. P. (2002). “A unified correlation for estimating HHV of
solid, liquid and gaseous fuels,” Fuel 81(8), 1051-1063. DOI: 10.1016/S0016-
2361(01)00131-4
Chen, D., Gao, A., Cen, K., Zhang, J., Cao, X., and Ma, Z. (2018). “Investigation of
biomass torrefaction based on three major components: Hemicellulose, cellulose, and
lignin,” Energy Convers. Manage. 169, 228-237. DOI:
10.1016/j.enconman.2018.05.063
Chen, D., Zheng, Y., and Zhu, X. (2013). “In-depth investigation on the pyrolysis
kinetics of raw biomass. Part I: Kinetic analysis for the drying and devolatilization

PEER-REVIEWED ARTICLE bioresources.com
Xu et al. (2020). “Pyrolysis kinetics Pinus sylvestris,” BioResources 15(3), 5577-5592. 5590
stages,” Bioresource Technol. 131, 40-46. DOI: 10.1016/j.biortech.2012.12.136
Chen, J., He, Y., Liu, J., Liu, C., Xie, W., Kuo, J., Zhang, X., Li, S., Liang, J., Sun, S., et
al. (2019). “The mixture of sewage sludge and biomass waste as solid biofuels:
Process characteristic and environmental implication,” Renew. Energ. 139, 707-717.
DOI: 10.1016/j.renene.2019.01.119
Damartzis, T., Vamvuka, D., Sfakiotakis, S., and Zabaniotou, A. (2011). “Thermal
degradation studies and kinetic modeling of cardoon (Cynara cardunculus) pyrolysis
using thermogravimetric analysis (TGA),” Bioresource Technol. 102(10), 6230-6238.
DOI: 10.1016/j.biortech.2011.02.060
Dhyani, V., Kumar, J., and Bhaskar, T. (2017). “Thermal decomposition kinetics of
sorghum straw via thermogravimetric analysis,” Bioresource Technol. 245, 1122-
1129. DOI: 10.1016/j.biortech.2017.08.189
Di Blasi, C., and Lanzetta, M. (1997). “Intrinsic kinetics of isothermal xylan degradation
in inert atmosphere,” J. Anal. Appl. Pyrol. 40-41, 287-303. DOI: 10.1016/s0165-
2370(97)00028-4
Ding, Y., Ezekoye, O. A., Lu, S., and Wang, C. (2016). “Thermal degradation of beech
wood with thermogravimetry/Fourier transform infrared analysis,” Energy Convers.
Manage. 120, 370-377. DOI: 10.1016/j.enconman.2016.05.007
Ding, Y., Wang, C., Chaos, M., Chen, R., and Lu, S. (2016). “Estimation of beech
pyrolysis kinetic parameters by shuffled complex evolution,” Bioresource Technol.
200, 658-665. DOI: 10.1016/j.biortech.2015.10.082
Ding, Y., Zhang, Y., Zhang, J., Zhu, R., Ren, Z., Guo and H. (2019). “Kinetic parameters
estimation of pinus sylvestris pyrolysis by Kissinger-Kai method coupled with
Particle Swarm Optimization and global sensitivity analysis,” Bioresour. Technol.
293. DOI: 10.1016/j.biortech.2019.122079
Ding, Y., kazui, F., Ofodike a., E., Lu, S., Wang, C. and Li, C. (2020). “Experimental and
numerical simulation of multi-component combustion of typical charring material,”
Combustion and Flame 211, 417-429. DOI:10.1016/j.combustflame.2019.10.016
Fermoso, J., and Mašek, O. (2018). “Thermochemical decomposition of coffee ground
residues by TG-MS: A kinetic study,” J. Anal. Appl. Pyrol. 130, 358-367. DOI:
10.1016/j.jaap.2017.12.007
Font, R., Fullana, A., and Conesa, J. (2005). “Kinetic models for the pyrolysis and
combustion of two types of sewage sludge,” J. Anal. Appl. Pyrol. 74(1-2), 429-438.
DOI: 10.1016/j.jaap.2004.10.009
Grønli, M. G., Várhegyi, G., and Di Blasi, C. (2002). “Thermogravimetric analysis and
devolatilization kinetics of wood,” Ind. Eng. Chem. Res. 41(17), 4201-4208. DOI:
10.1021/ie0201157
Huang, J., Liu, J., Chen, J., Xie, W., Kuo, J., Lu, X., Chang, K., Wen, S., Sun, G., Cai,
H., et al. (2018). “Combustion behaviors of spent mushroom substrate using TG-MS
and TG/FTIR: Thermal conversion, kinetic, thermodynamic and emission analyses,”
Bioresource Technol. 266, 389-397. DOI: 10.1016/j.biortech.2018.06.106
Huang, J., Zhang, J., Liu, J., Xie, W., Kuo, J., Chang, K., Buyukada, M., Evrendilek, F.,
and Sun, S. (2019). “Thermal conversion behaviors and products of spent mushroom
substrate in CO2 and N2 atmospheres: Kinetic, thermodynamic, TG and Py-GC/MS
analyses,” J. Anal. Appl. Pyrol. 139, 177-186. DOI: 10.1016/j.jaap.2019.02.002
Jiang, L., Xiao, H. H., He, J. J., Sun, Q., Gong, L., and Sun, J. H. (2015). “Application of
genetic algorithm to pyrolysis of typical polymers,” Fuel Process. Technol. 138, 48-
55. DOI: 10.1016/j.fuproc.2015.001

PEER-REVIEWED ARTICLE bioresources.com
Xu et al. (2020). “Pyrolysis kinetics Pinus sylvestris,” BioResources 15(3), 5577-5592. 5591
Kissinger, H. E. (1956). “Variation of peak temperature with heating rate in differential
thermal analysis,” J. Res. Natl. Bur. Stand. 57(4), 217-221.
Kissinger, H. E. (1957). “Reaction kinetics in differential thermal analysis,” Anal. Chem.
29(11), 1702-1706. DOI: 10.1021/ac60131a045
Lahijani, P., Mohammadi, M., and Mohamed, A. R. (2019). “Investigation of synergism
and kinetic analysis during CO2 co-gasification of scrap tire char and agro-wastes,”
Renew. Energ. 142, 147-157. DOI: 10.1016/j.renene.2019.04.113
Li, K. Y., Huang, X., Fleischmann, C., Rein, G., and Ji, J. (2014). “Pyrolysis of medium-
density fiberboard: Optimized search for kinetics scheme and parameters via a
genetic algorithm driven by Kissinger’s method,” Energ. Fuel. 28(9), 6130-6139.
DOI: 10.1021/ef501380c
Ma, Z., Chen, D., Gu, J., Bao, B., and Zhang, Q. (2015). “Determination of pyrolysis
characteristics and kinetics of palm kernel shell using TGA-FTIR and model-free
integral methods,” Energy Convers. Manage. 89, 251-259. DOI:
10.1016/j.enconman.2014.09.074
Müsellim, E., Tahir, M. H., Ahmad, M. S., and Ceylan, S. (2018). “Thermokinetic and
TG/DSC-FTIR study of pea waste biomass pyrolysis,” Appl. Therm. Eng. 137, 54-61.
DOI: 10.1016/j.applthermaleng.2018.03.050
Nhuchhen, D. R., and Abdul Salam, P. (2012). “Estimation of higher heating value of
biomass from proximate analysis: A new approach,” Fuel 99, 55-63. DOI:
10.1016/j.fuel.2012.04.015
Nurek, T., Gendek, A., and Roman, K. (2019). “Forest residues as a renewable source of
energy: Elemental composition and physical properties,” BioResources 14(1), 6-20.
DOI: 10.15376/biores.14.1.6-20
Rodríguez-Jiménez, S., Duarte-Aranda, S., and Canché-Escamilla, G. (2019). “Chemical
composition and thermal properties of tropical wood from the Yucatán dry forests,”
BioResources 14(2), 2651-2666. DOI: 10.15376/biores.14.2.2651-2666
Shi, S., Zhou, X., Chen, W., Wang, X., Nguyen, T., and Chen, M. (2017). “Thermal and
kinetic behaviors of fallen leaves and waste tires using thermogravimetric analysis,”
BioResources 12(3), 4707-4721. DOI: 10.15376/biores.12.3.4707-4721
Vyazovkin, S., Burnham, A. K., Criado, J. M., Pérez-Maqueda, L. A., Popescu, C., and
Sbirrazzuoli, N. (2011). “ICTAC kinetics committee recommendations for
performing kinetic computations on thermal analysis data,” Thermochim. Acta 520(1-
2), 1-19. DOI: 10.1016/j.tca.2011.03.034
Wang, S., Dai, G., Yang, H., and Luo, Z. (2017). “Lignocellulosic biomass pyrolysis
mechanism: A state-of-the-art review,” Prog. Energ. Combust. Sci. 62, 33-86. DOI:
10.1016/j.pecs.2017.05.004
Wen, S., Yan, Y., Liu, J., Buyukada, M., and Evrendilek, F. (2019). “Pyrolysis
performance, kinetic, thermodynamic, product and joint optimization analyses of
incense sticks in N2 and CO2 atmospheres,” Renew. Energ. 141, 814-827. DOI:
10.1016/j.renene.2019.04.040
Wu, Z., Zhang, B., Hu, Q., Hao, W., Ma, C., Li, Y., and Yang, B. (2019). “Products
distribution and kinetic analysis on gaseous products during fast pyrolysis of two
kinds of biomass pellet,” Fuel 249, 8-14. DOI: 10.1016/j.fuel.2019.03.100
Zhang, J., Chen, T., Wu, J., and Wu, J. (2014). “A novel Gaussian-DAEM-reaction model
for the pyrolysis of cellulose, hemicellulose and lignin,” RSC Adv. 4(34), 17513-
17520. DOI: 10.1039/c4ra01445f

PEER-REVIEWED ARTICLE bioresources.com
Xu et al. (2020). “Pyrolysis kinetics Pinus sylvestris,” BioResources 15(3), 5577-5592. 5592
Zhang, J., Liu, J., Evrendilek, F., Zhang, X., and Buyukada, M. (2019). “TG-FTIR and
Py-GC/MS analyses of pyrolysis behaviors and products of cattle manure in CO2 and
N2 atmospheres: Kinetic, thermodynamic and machine-learning models,” Energy
Convers. Manage. 195, 346-359. DOI: 10.1016/j.enconman.2019.05.019
Zou, H., Evrendilek, F., Liu, J., and Buyukada, M. (2019). “Combustion behaviors of
pileus and stipe parts of Lentinus edodes using thermogravimetric-mass spectrometry
and Fourier transform infrared spectroscopy analyses: Thermal conversion, kinetic,
thermodynamic, gas emission and optimization analyses,” Bioresource Technol. 288,
121481. DOI: 10.1016/j.biortech.2019.121481
Article submitted: December 12, 2019; Peer review completed: May 16, 2020; Revised
version received and accepted: May 25, 2020; Published: May 29, 2020.
DOI: 10.15376/biores.15.3.5577-5592


![Pine - Wikipedia · Pine - Wikipedia 6/20/2017 2:11:22 PM] Pinus sylvestris prepared for transport, Hungary Pine cone Tongue and groove solid pine](https://img.pdfslide.us/doc/110x75/5d62849d88c99309088b4588/pine-pine-wikipedia-6202017-21122-pm-pinus-sylvestris-prepared-for.jpg)


![Artificial Regeneration of Pinus Sylvestris var. Mongolica ......mongolica [1], afforestation techniques, growth characteristics and ecological functions of Pinus sylvestris var. mongolica,](https://img.pdfslide.us/doc/110x75/60e65d5182ddcc0ef10d2146/artificial-regeneration-of-pinus-sylvestris-var-mongolica-mongolica-1.jpg)