Embed Size (px)
Citation preview
Investigating the pore-scale mechanisms of microbial enhanced oil recovery
Ryan T. Armstrong and Dorthe Wildenschild
School of Chemical, Biological and Environmental Engineering, Oregon State University, 103
Gleeson Hall, Corvallis, OR 97331-2702
Corresponding Author: Dorthe Wildenschild
phone: 541.737.8050
fax: 541.737.4600
email: [email protected]
Abstract
Microbial Enhanced Oil Recovery (MEOR) is a process where microorganisms are used for
tertiary oil recovery. Numerous mechanisms have been proposed in the literature through which
microorganisms facilitate the mobilization of residual oil. Herein, we focus on the MEOR
mechanisms of interfacial tension reduction (via biosurfactant) and bioclogging in water-wet
micromodels, using Shewanella oneidensis (MR-1) that causes bioclogging and Bacillus
mojavensis (JF-2) that produces biosurfactant and causes bioclogging. Micromodels were
flooded with an assortment of flooding solutions ranging from metabolically active bacteria to
nutrient limited bacteria to dead inactive biomass to asses the effectiveness of the proposed
MEOR mechanisms of bioclogging and biosurfactant production. Results indicate tertiary
flooding of the micromodel system with biomass and biosurfactant was optimal for oil recovery
due to the combined effects of bioclogging of the pore-space and interfacial tension reduction.
However, biosurfactant was able to recover oil in some cases dependent on wettability. Biomass
without biosurfactant that clogged the pore-space also successfully produced additional oil
recovery. When analyzing residual oil blob morphology, MEOR resulted in oil blob size and
radius of curvature distributions similar to those obtained by an abiotic capillary desaturation
test, where flooding rate was increased post secondary recovery. Furthermore, for the capillary
number calculated during MEOR flooding with bioclogging and biosurfactant, lower residual
oil saturation was measured than for the corresponding capillary number under abiotic
conditions. These results suggest that bioclogging and biosurfactant MEOR is a potentially
effective approach for pore morphology modification and thus flow alteration in porous media
that can have a significant effect on oil recovery beyond that predicted by capillary number.
Keywords: microbial enhanced oil recovery, biosurfactant, bioclogging, micromodel, water
flooding, multiphase flow, interfacial curvature
1. Introduction
Microbial enhanced oil recovery (MEOR) is a tertiary recovery process where bacteria and their
metabolic by-products are utilized for oil mobilization in a reservoir. Metabolic byproducts
consist of the assortment of compounds produced through microbial metabolic pathways, for
example, one such metabolic by-product is biosurfactant. In principle, MEOR is a
straightforward concept where increased recovery occurs through inoculation of a reservoir with
microorganisms to clog pores and redirect flow, or for mobilization of oil as a result of reduced
interfacial tension. But to this point, oil production at the field-scale with MEOR has been
inconsistent at best (Hitzman, 1988, 1983; Lazar, 1991). However, results from numerous lab-
scale experiments with an assortment of microbial species and a wide range of porous material
suggest that MEOR can be an effective tertiary oil recovery method (Bordoloi et al. 2007; Bryant
et al. 1998; Crescente et al. 2008; Soudmand-asli et al. 2007; Suther et al. 2009). One reason for
the discrepancy between field-scale and lab-scale results is a lack of understanding of the
fundamental mechanisms at the pore-scale through which bacteria impact fluid dynamics, rock
surface properties, and interfaces between immiscible phases.
Numerous proposed MEOR mechanisms are presented in the literature (for an in-depth review of
each mechanism and the microbial species involved we refer to Youssef et al. 2009):
Interfacial tension reduction: Microorganisms can facilitate the mobilization of oil through the
production of amphiphilic compounds, termed biosurfactants, which reduce the interfacial
tension (IFT) between immiscible phases.
Wettability change: Microorganisms can colonize reservoir rock and form biofilm that has
wetting properties significantly different than the existing reservoir rock, thus, a reservoir’s
wettability can change to a more water-wet or more oil-wet condition depending on the nature of
the biofilm.
Bioclogging: The formation of biomass can clog preferential flow paths and increase a
reservoir’s sweep efficiency by diverting flow to alternate paths.
Biogenic gas generation: Biologically generated methane or carbon dioxide can increase pore
pressure and/or dissolve into the oil phase, thus reducing viscosity and swelling the oil.
Hydrocarbon degradation: microorganisms can utilize crude oil as a carbon source and
effectively reduce or, in some cases, increase oil viscosity.
When analyzing a successful lab-scale MEOR experiment it is often difficult to accredit
additional oil recovery to a single MEOR mechanism since these mechanisms do not occur
independently and many studies use non-transparent 3D cores that occlude direct visualization of
the processes taking place. Using x-ray microtomography, Armstrong and Wildenschild (2012)
found that MEOR in 3D glass bead cores recovered similar amounts of oil regardless of the
MEOR flooding solution used (i.e. biosurfactant or biosurfactant and bacterium). However, the
extent of bioclogging could not be visualized with x-ray microtomography, and thus, oil
recovery could not be accredited to a single MEOR mechanism. To address this issue, in this
study, we utilize a stereo microscope to study MEOR in a 2D silicon etched micromodel system.
Two microorganisms are used; Bacillus mojavensis (JF-2) which is a gram-positive,
biosurfactant producing, biofilm forming, facultative aerobe isolated from oil reservoir brine in
Oklahoma, and Shewanella oneidensis (MR-1) which is a gram-negative, biofilm forming,
facultative aerobe isolated from Lake Odeida in New York. The MEOR mechanisms of biogenic
gas generation and hydrocarbon degradation are not considered since the organisms used are not
methanogens nor are they known hydrocarbon degraders. The MEOR mechanisms investigated
(i.e. IFT reduction, wettability change, and bioclogging) are evaluated in terms of additional oil
recovered, residual oil blob size, and interfacial curvature which are parameters essential for
understanding the mobilization of capillary trapped oil.
Mobilization of residual oil in porous media has been studied since the early 1980s and it is well
understood that residual oil exists as disconnected globules in the subsurface. These globules
remain trapped until a force sufficient enough to move them through an adjacent pore neck is
applied (Wardlaw and McKellar 1985). In this situation, the ratio between viscous forces that
promote flow and capillary forces that resist flow becomes important and is characterized by a
unitless ratio, called the capillary number:
Nca = vµ/σ
Where, v is the velocity of the advancing phase, µ is the viscosity of the advancing phase, and σ
is the interfacial tension between the immiscible phases. As capillary number increases, capillary
forces become less dominant and the likelihood of oil mobilization increases (Gray et al. 2008).
Under abiotic conditions where capillary number is increased by increasing flood velocity,
solitary ganglia; undergo mobilization, remain trapped, or break-up into multiple daughter
ganglion (Wardlaw and McKellar 1985). As stated by Melrose and Brander (1974), "the critical
condition for ganglion mobilization is that the pressure drop from one end of an oil blob to the
other, in the direction of flow, must exceed the maximum of the capillary pressure difference
between the menisci at the upstream and downstream ends of the oil blob". Once the critical
condition is achieved individual ganglion are either mobilized or broken up into multiple smaller
daughter ganglion (Wardlaw and McKellar 1985). However, it remains an open question whether
similar mobilization processes occur during MEOR.
Oil blob size distributions in porous media have been widely investigated in the literature (Al-
Raoush et al. 2005a, 2005b; Karpyn et al. 2010). Mayer and Miller (1992) proposed to fit non-
aqueous phase liquid (NAPL) blob size distributions to the Van Genuchten function:
F(d) = 1 – [1+(d)m
](1/m)-1
Where, d is blob size, F(d) the mass percentage of blobs that are smaller than d, and and m are
fitting parameters. In general, increases with decreasing mean blob size and m is larger for
more uniformly distributed blobs. Thus, a convenient quantitative comparison of blob size
distributions between different oil recovery experiments is possible using this approach.
Wettability is a major factor controlling multi-phase flow, and thus oil production (Al-Raoush
2009; Armstrong and Wildenschild 2011; Graue et al. 1999; Karpyn et al. 2010; Morrow and
Mason 2001; Tweheyo et al. 1999) and may unfavorably affect the success of a given MEOR
operation. To quantify porous media wettability, macro-scale indices (obtained with techniques
such as the Carter, USBM, or Amott methods) are used regularly. However, these measurements
lack the capability to characterize wettability change during MEOR treatment, and only provide
macro-scale information. To understand micro-scale temporal and spatial changes in wettability
we calculate interfacial radius of curvature using level set methods (Cheng et al. 2007; Liu et al.
2011; Sethian 1996). When applying this approach, curvature from the perspective of the oil
phase is positive for a concave interface (i.e. water-wet surface) and negative for a convex
interface (i.e. oil-wet surface). Consequently, lateral shifts in the radius of curvature distribution
(i.e. from positive to negative or vice versa) are indicative of wettability change.
The MEOR mechanisms of bioclogging, interfacial tension reduction, and wettability alteration
have been studied by Afrapoli et al. (2010), Bredholt et al. (1998), Crescente et al. (2008, 2006),
and Kowalewski, et al. (2006). In these studies, the emulsification ability of Rhodococcous sp.
(094) was activated or deactivated depending on the carbon source used for growth and two
variants were defined: cells of Surfactant-Producing Bacteria (SPB) and cells of Non-Surfactant-
Producing Bacteria (NSPB). This approach is one of the first reported attempts at decoupling the
MEOR mechanisms of bioclogging and biosurfactant production and results from these efforts
demonstrate that wettability change with Rhodococcous sp. (094) is dependent on which variant
is used (Afrapoli et al. 2010). However, the MEOR mechanisms were not completely decoupled,
because in the micromodel studies reported by Crescente et al. (2006) the NSPB eventually
became SPB due to the presence of dodecane in the micromodel system and experiments with
either variant gave the same end results (i.e. microbial accumulation of organism at the oil/water
interface and utilization of dodecane as a carbon source with marginal oil recovery of ~9%).
The objective of the present study was to investigate the proposed MEOR mechanisms by
treating micromodel systems with different wetabilities with an assortment of different MEOR
flooding solutions ranging from metabolically compromised (i.e. inactive) bacteria to active
bacteria to biosurfactant only and by comparing these results to abiotic recovery. Through these
efforts the following questions are addressed:
1. To what extent is oil recovery dependent on the activity of the microbial community?
Can dead inactive biomass recover the same amount of oil as actively growing
bacteria?
2. Can metabolic by-products (such as, a biosurfactant) recover oil or is bacterial cell
mass required for recovery?
3. Conversely, can bacterial cell mass recover oil via clogging or is a biosurfactant
required?
4. Can wetability affect the success of a given MEOR mechanism?
5. Does oil blob mobilization with MEOR proceed in a manner similar to abiotic
recovery?
To address the first question, micromodels were flooded with the following treatments: bacterial
cells suspended in fresh growth media, bacterial cells suspended in spent growth media, and
bacterial cells metabolically compromised through iodine and ampicillin treatment. To address
the second question, a flooding solution of spent growth media with the bacterial mass removed
and a flooding solution with bacterial biomass suspended in a nutrient free salt solution were
used. The third question was investigated by using Shewanella oneidensis (MR-1) which is not
known to produce a biosurfactant. Results addressing the first three questions are presented in
Section 3.1.The fourth question is addressed by testing MEOR in micromodels with different
contact angles (see Section 3.2). Lastly, the fifth question is investigated by comparing oil blob
morphology (i.e. blob size and radius of interfacial curvature) measured after MEOR, to oil blob
morphologies after aboitic recovery throughout a range of capillary numbers (see Section 3.3).
With these experiments we intend to expound the optimal MEOR treatment option for our
micromodel system and highlight reasons for success and/or failure
2. Materials and Methods
2.1 Bacterial Strains and Growth Conditions
Bacillus mojavensis (JF-2, ATCC 39307) and Shewanella oneidensis (MR-1, ATCC 700550)
were used. Both organisms were grown in a brine-based growth media called Media E at room
temperature under aerobic conditions (Table 1). However, MR-1 was grown with 60% less NaCl
than reported for Media E.
2.2 Flooding and MEOR Solutions
Media E was used for water flooding and the oil phase was Soltrol 220 which is a mixture of
C13 and C17 hydrocarbons. In total, 6 flooding solutions were tested. For MEOR with JF-2, 5
different flooding solutions were used: (1) bacteria / fresh media, (2) bacteria / spent media, (3)
compromised bacteria / fresh media, (4) compromised bacteria / salt solution, and (5)
biosurfactant. The last flooding solution (6) was MR-1 with spent media.
Flooding solution (1) was generated by growing JF-2 overnight in batch culture and then
centrifuging the bacterial culture at 9,000 rpm for 10 minutes followed by resuspension of JF-2
in new growth media. Flooding solution (2) was generated by growing JF-2 overnight in batch
culture without resuspension in new media. For flooding solution (3) a JF-2 culture grown
overnight was subjected to 20 mg/L KI for 2 hours followed by centrifugation and resuspension
in fresh growth media with 2 mg/L ampicillin. Flooding solution (4) was prepared the same way
as flooding solution (3), however, JF-2 was resuspended in a nutrient free 25 g/L NaCl solution
(which is the same NaCl concentration as Media E). The biosurfactant flooding solution (5) was
prepared by separating JF-2 biomass from spent cultures (i.e. after exponential growth). To
separate the produced biosurfactant from the bacterial cells, microbial cultures of JF-2 were
centrifuged at 9,000 rpm for 10 minutes followed by filtration of the supernatant through a 0.22
µm pore diameter membrane. The IFT of the resulting biosurfactant solution matched the IFT
achieved with flooding solution (2). Flooding solution (6) was prepared by growing MR-1
overnight in Media E (with 60% less NaCl) without resuspension in new media.
2.3 Micromodel
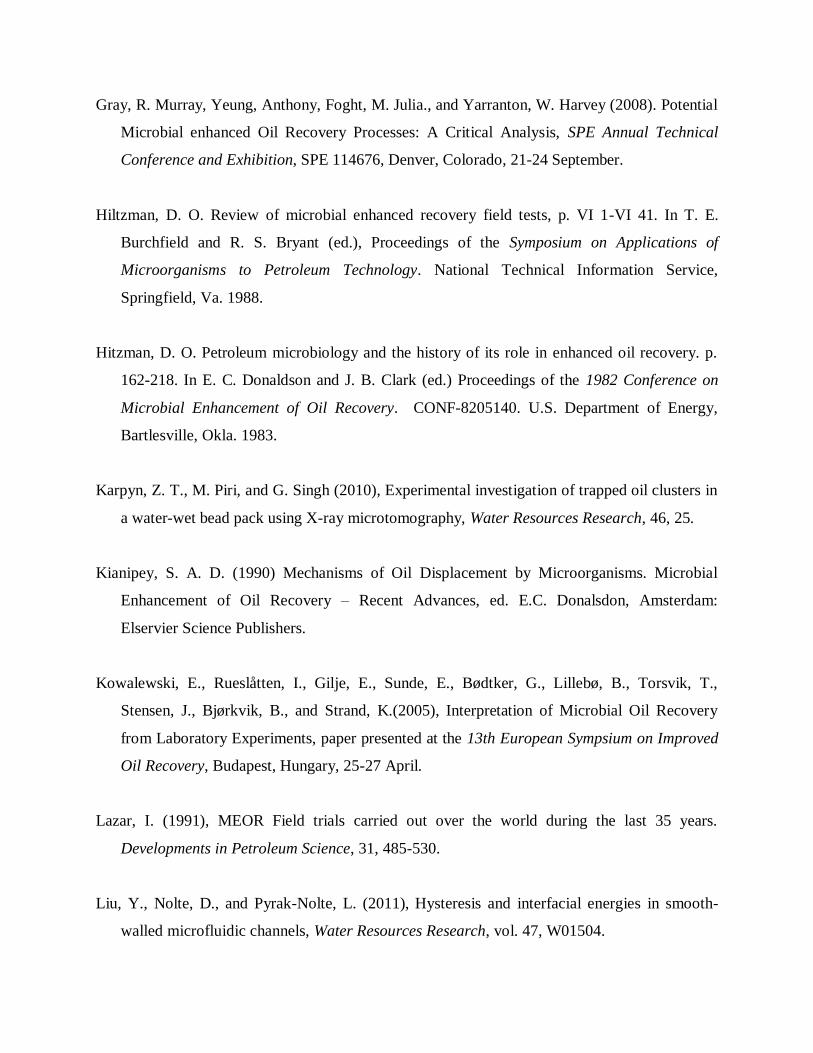
A pattern modeled after a 3D glass bead pack (35% 0.6 mm diameter, 35% 0.8 mm diameter,
and 30% 1.0-1.4 mm diameter, Figure 1) was photo-etched into a silicon wafer to a depth of 50
microns. To create hydrophilic flow channels, the manufacturer treated the silicon surface in an
O2 plasma at 100 mtorr and 100 W of forward power in a parallel plate RIE (reactive-ion
etching) system. Micromodels with 2 different oil/water contact angles were created: 19o
and
38o
. Contact angle was measured by submerging a treated silicon wafer in Soltrol 220 and then
placing a water droplet on the surface. The resulting contact angle is reported as the angle
passing through the water phase.
2.4 Flooding Procedure
Water flooding was performed under fixed flux conditions at Nca = 7.9x10⁻⁷
, which is
representative of many reservoirs under water flood (Willhite and Green, 1998). The micromodel
was initially saturated with Media E followed by saturation with Soltrol 220 at Nca > 10-3
to
reach residual water saturation, which is visually confirmed. To simulate secondary recovery, the
oil-saturated micromodel was then flooded with Media E until oil recovery ceased and residual
oil remained as disconnected phase.
2.5 MEOR
After water flooding, 1 of the 6 MEOR flooding solutions mentioned above was used. MEOR
was conducted at the same flow rate as water flooding (Nca = 7.9x10⁻⁷
) and the test was
terminated once no additional oil was recovered. Prior to each experiment the micromodel and
tubing was sterilized with 100% ethanol followed by a 3x rinse with sterile growth media.
A standard curve relating bacterial cell mass (as dry weight) to optical absorbance of a
bacterial solution at 600 nm was generated. Optical absorbance measurements were then used to
calculate the biomass concentration in each MEOR flooding solution.
2.6 Abiotic Recovery
A capillary desaturation curve was produced for both the 19o
and 38o
micromodels by
increasing the flow rate logarithmically from an initial Nca = 7.9x10⁻⁷
until no oil was produced
from the micromodel. With each 10 fold flow rate increase, equilibrium was reached by allowing
3 pore volumes of the flooding phase to pass through the micromodel. Once equilibrium was
reached, residual oil saturation was measured and the flow rate was increased further.
2.7 Light Microscopy
A stereo microscope equipped with a 3.3 megapixel digital camera and automated image
capture software was used. All published images were acquired with a 0.8x objective, 1.0x
camera mount, and 0.5x zoom setting, resulting in images with an 8.3 m/pixel resolution.
Microscope images were written into TIFF file format with a 2048 x 1536 pixel window.
UV dye was added to the oil phase to provide the necessary contrast for image segmentation.
The UV dye was excited with a standard UV bulb emitting light between 400 and 500 nm, which
caused fluorescence around 550 nm. Microscope images were used to calculate original oil in
place, residual oil saturation, additional oil recovery, residual oil blob size, and interfacial radius
of curvature.
Original Oil in Place (OOIP) = Volume of oil initially saturating the micromodel
Residual Oil Saturation (Sor) (%) = (Xi / OOIP) x 100
Where Xi = OOIP – Volume of oil collected after initial water flooding
After MEOR Xi = OOIP – Volume of oil collected during MEOR
Additional Oil Recovery over OOIP (AOR) (%) = (Microbial recovered oil / Oil in column
after water flood) x 100
Blob Volume (Vblobi) = ∑blob
i [pixels]
Radius of Curvature (R) = 1/curvature (1/Κ)
2.8 Image Segmentation and Analysis
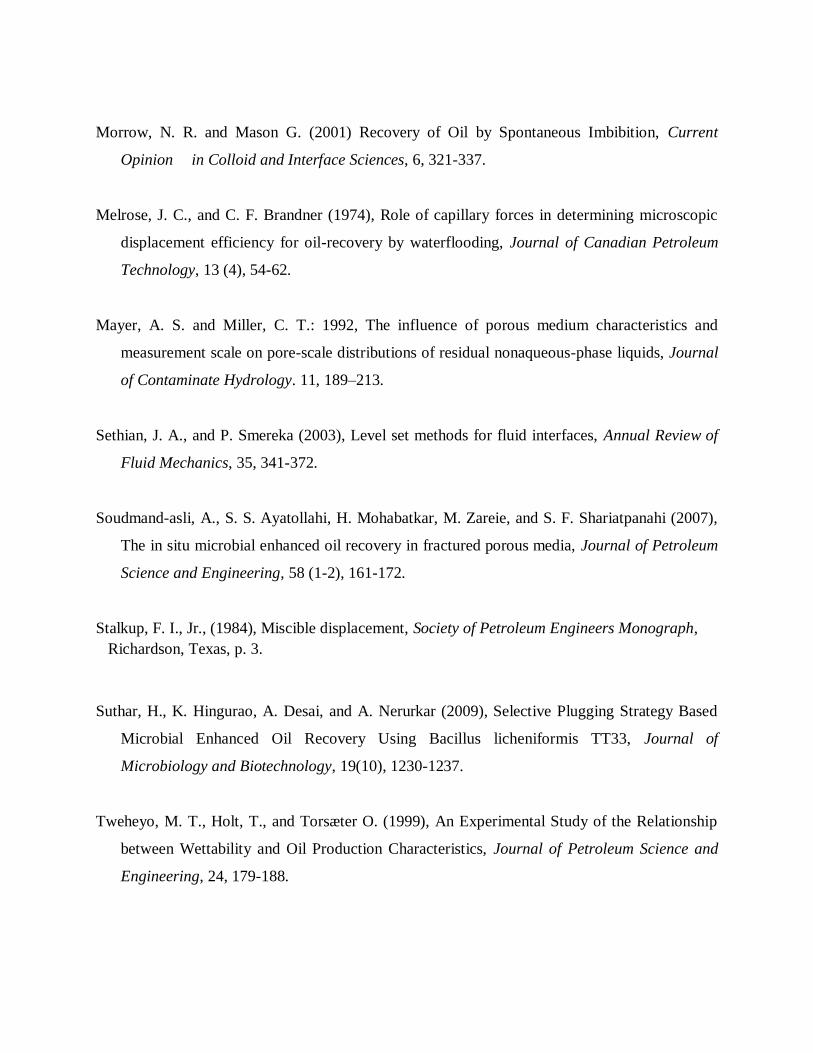
Colored 16-bit images were acquired; filtering out the red and blue channels of the colored
image enhanced the signal produced by the oil phase UV tracer (Figure 2). The resulting gray-
scale image was median filtered (2x kernel, Figure 2b) and a threshold was used to delineate the
oil phase (Figure 2c). Since the physical pore volume of the micromodel is known only the oil
phase volume, as calculated from the microscope images, was needed to calculate oil saturation.
Interfacial curvature was calculated from the stereo microscope images using level set
methods (Sethian 1996; Cheng et al. 2007; Liu et al. 2011) where the curvature (Κ) of each level
set is easily obtained from the divergence of the unit vector normal to a front.
Κ = · [ φ/| φ|] = [φxx φy2 – 2 φx φy φxy + φyy φx
2] / [φx
2 + φy
2]3/2
To implement this method, a segmented binary image is used and the edge of each blob (i.e.
the interface) is defined as a front. After applying a Gaussian blur function to the image, the
resulting image can be defined as the level set function φ. If the location of each interfacial pixel
is registered prior to blurring, the interfacial curvature at each registered point (i.e. pixel) can be
calculated. This allows us to calculate the distribution of curvatures for the entire residual oil
blob population in a microscope image.
The curvature algorithm was tested by overlaying circles of known radii onto a 2D pattern of
a glass bead pack (Figure 1). Radius of curvature for each circle (where radius of curvature is
the inverse of curvature) was calculated and compared to the known value. The largest percent
error encountered was 5.0% while most errors were less than 2%. Cheng et al. (2007) found that
the error generated with this method was mainly due to radius size, resulting in larger error for
smaller radius of curvature.
Individual oil blob size was calculated by finding connected components in the binary
residual oil image using a neighborhood pixel connectivity of 8. Each connected object was
classified as an oil blob and volumes are reported as the number of pixels representing a given
blob.
Interfacial tension was measured using a du Noüy ring tensiometer. And viscosity was
measured using a falling sphere viscometer.
3. Results and Discussion
3.1 Effect of Microbial Treatment Option on AOR
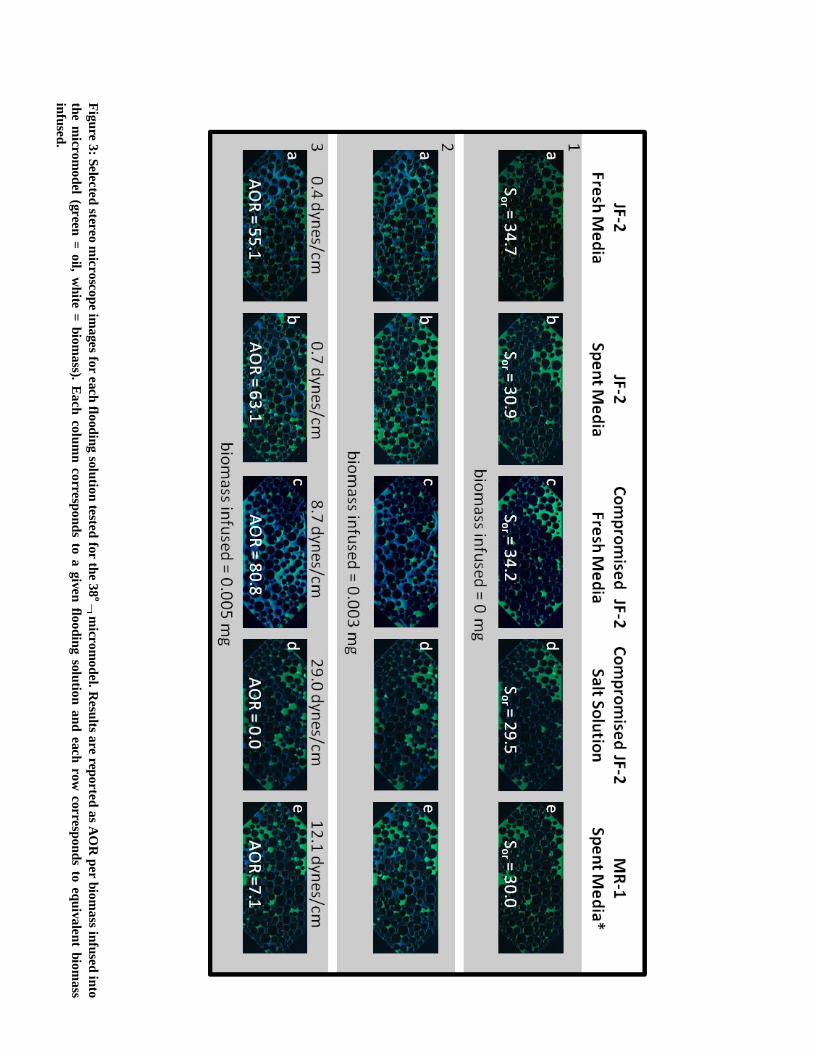
Results reported as AOR per biomass infused into the micromodel for the MR-1 flooding
solution and 4 of the 5 JF-2 flooding solutions are presented in Figure 3 (results are for the 38o
micromodel, since this is the most comprehensive dataset and results for the biosurfactant
flooding solution are excluded, since no biomass was infused with this treatment). Bacteria
suspended in fresh media and bacteria suspended in spent media recover approximately the same
quantity of oil. Compromised bacteria suspended in fresh media gave the best oil recovery, yet
not surprisingly, compromised bacteria suspended in the salt solution recovered no oil. The IFT
between Media E and Soltrol was measured at 24.5 dynes/cm which was the IFT during water
flooding; however, the IFT between the salt solution and Soltrol was slightly larger (29.0
dynes/cm). The IFT results reported in Figure 3 are for IFT during MEOR and correspond to the
IFT between a given flooding solution and Soltrol 220. In the case of the compromised bacteria
suspended in new media some metabolic activity definitely occurred, because surface tension
(i.e. air/flooding solution) was reduced from 54.3 dynes/cm to 40.1 dynes/cm during treatment,
resulting in a final IFT between Soltrol and the flooding solution of 8.7 dynes/cm. This suggests
that some biosurfactant production was occurring, and thus, metabolic activity was present.
However, IFT reduction was not as drastic as treatment with bacteria suspended in fresh media
or bacteria suspended in spent media which resulted in final IFT values of 0.4 and 0.7 dynes/cm,
respectively. The MR-1 treatment without biosurfactant production and marginal IFT reduction
resulted in 7.1% additional oil recovery (a reduction in IFT from 24.5 to 12.1 dynes/cm was
observed and is likely caused by the production of metabolic by-products and not the production
of a biosurfactant). Furthermore, biosurfactant treatment with a minimum IFT of 1.2 dynes/cm
recovered no oil (this is later explained by the capillary desaturation curve). These results
demonstrate the significance of bioclogging with JF-2 since the highest AOR values reported
were obtained for bioclogging with minimal IFT reduction. Conflicting results are obtained for
bioclogging with MR-1, since only marginal recovery was measured; however, micromodel
images show that less MR-1 biomass clogged the micomodel pore-space than JF-2 biomass
(compare Figure 3, columns b and e).
Although the same quantity of biomass was infused during MEOR for each flooding solution the
amount of biomass visually clogging the micromodel during treatment varied significantly.
Compromised bacteria suspended in the salt solution were the least effective at bioclogging and
resulted in no oil recovery (Figure 3, column d). MR-1 biomass was very sparse, which was the
second least efficient oil recovery approach in terms of AOR. Bacteria suspended in fresh media
did not start clogging the micromodel until after 24 hours which is well beyond the batch growth
cycle of JF-2 and essentially makes this treatment option equivalent to treatment with bacteria in
spent media. Both JF-2 treatment options (i.e. fresh media and spent media) gave similar AOR
results and the extent of bioclogging with either treatment was visually similar (Figure 3,
column a and b). In addition to the significance of bioclogging for oil recovery, these results
demonstrate that potentially “stressed” JF-2 cultures suspended in spent media or treated with KI
and suspended in growth media with ampicillin appear to more effectively clog the micromodels
(Figure 3, column b and c). Batch culture studies with JF-2 have shown that bacterial
coagulation (visual observation) does occur after stationary phase growth which could lead to
more effective clogging of the micromodel system. However, at this point, it is not possible to
suggest any potential stress induced bioclogging mechanisms, without a thorough metabolic
analysis of the microbial community.
3.2 Effect of Wettability on AOR
To investigate the effect of wettability on oil recovery using MEOR, three different treatment
options (i.e. biosurfactant, JF-2 in spent media, and MR-1 in spent media) were tested in both the
19o
and 38o
micromodels. Results for Sor and AOR for each treatment option and each
micromodel are presented in Figure 4. Independent of contact angle, simultaneous bioclogging
and biosurfactant treatment with JF-2 was the most effective MEOR treatment. The average Sor
for biosurfactant treatment with the 19o
micromodel is considerably larger than the average Sor
for MR-1 and JF-2 treatments. However, this does not detract from the AOR results since MR-1
and JF-2 treatments initially started with a lower Sor than biosurfactant treatment and still
achieved a greater AOR. The measured IFT between the biosurfactant solution and Soltrol 220
during the 19o
micromodel experiment was 0.4 dynes/cm while the measured IFT between the
biosurfactant solution and Soltrol 220 during the 38o
micromodel test was 1.2 dynes/cm. This
difference in IFT between the two biosurfactant treatments may have resulted in some disparity
between the AOR values obtained in the 19o
and 38o
micromodel experiments; however, the
difference in AOR is most likely a result of wettability (which is later explained via
consideration of the capillary desaturation curve data). For all treatment options, AOR was
highest in the 19o
micromodel while lower AOR values were obtained for the 38o
micromodel, indicating that for these micromodel systems, MEOR is most effective for highly
water-wet conditions.
To further investigate the significance of wettability, a capillary desaturation curve under abiotic
conditions was established for both micromodels (Figure 5). The capillary desaturation curves
show that an order of magnitude higher capillary number is needed in the 38o
micromodel to
achieve the same recovery as the 19o
micromodel, which explains why oil recovery with
biosurfactant treatment was successful in the 19o
micromodel, but did not occur in the 38o
micromodel. Overall, these results demonstrate that as contact angle increases, a significantly
larger capillary number is needed for oil recovery in the micromodel system and that using
MEOR (i.e. with bioclogging and biosurfactant) a 2-3 order of magnitude increase in capillary
number is possible. For example, with JF-2 treatment in the 19o
micromodel, initially flooded
at Nca = 7.9x10⁻⁷
, final oil saturation was ~5% which corresponds to a capillary number of 10-4
on the capillary desaturation curve, thus MEOR-facilitated oil recovery can be explained by a 3
order of magnitude increase in capillary number. This 3 order of magnitude reduction in
capillary number exceeds the 2 order of magnitude reduction, which is a requirement for
significant oil recovery as stated by Gray et al. 2008, in reference to work reported by Stalkup,
1984 and Willhite and Green, 1998.
3.3 Biotic vs. Abiotic Recovery
The following analysis was only carried out for the 19o
micromodel data since this dataset
provided recovery results for both the biosurfactant and JF-2 treatments. Because MEOR was
performed under fixed flux conditions, capillary number can be calculated by taking into account
changes in IFT, viscosity, and porosity (which ultimately affects pore velocity). Biomass formed
by JF-2 was dense enough to provide sufficient contrast for image segmentation of the biophase;
thus, porosity change could be calculated from the collected images. Porosity values from an
upper and lower image threshold were used for calculating average pore velocity. The horizontal
error bars for JF-2 in Figure 6 represent these lower and upper bounds. The porosity calculation
assumed that biomass spanned the entire 50 µm micromodel depth and that no micro-porosity
existed in the biomass (thus, biomass was considered impermeable). Viscosity was measured
using a falling sphere viscometer and results indicate a viscosity of 1.2 cP for the JF-2 flooding
solution in spent media. MR-1 biofilm was not dense enough to facilitate such analysis and is
excluded from these calculations.
In the 19o
micromodel residual oil saturation after biosurfactant treatment (carried out at Nca =
7.9x10⁻⁷
) corresponded to the oil saturation obtained for the equivalent capillary number during
the abiotic test; thus, recovery in the case of biosurfactant treatment was uniquely explained by
IFT reduction (Figure 6). For JF-2 treatment, oil recovery was not entirely explained by
capillary number since lower residual oil saturation was obtained at a capillary number below
that used in the abiotic test. We conclude that the additional AOR obtained with JF-2, which
could not be explained by capillary number change, was caused by the re-direction of
preferential flow paths due to biofilm formation. After water flooding, microscope images
(Figure 7) show that residual oil saturation is heterogeneous and that large oil globules exist in
regions disconnected from the preferential flow path that appears to proceed along the middle
region of the micromodel. Final images of bioclogged micromodels display disproportionate
bioaccumulation near the inlet and central preferential flow path of the micromodel (Figure 7).
This should essentially redirect flow to outer regions of the micromodel that were not efficiently
swept during water flooding. Accumulation of biomass in the pore-space of the preferential flow
path is reasonable since advective transport of biomass should be greatest in this region. This
proposition is supported by the modeling results reported by Schulenburg et al. (2009) where
biofilm accumulation increased both the heterogeneity and magnitude of the velocity field and
accumulation increased in the preferential flow paths. Our results suggest that biomass can be
effective in altering pore morphology, and thus flow field, in porous media, a process that can
increase oil recovery beyond what is predicted by capillary number increase alone.
Pore morphology change due to bioclogging could explain the AOR obtained with JF-2, and also
explains why an apparently sparse MR-1 biofilm still recovered oil. However, results that
contrast these findings were reported by Soudmand-asli et al. (2007) who studied MEOR in
fractured porous media. Etched glass micromodels with a fractured network were used with both
a biosurfactant-producing bacterium and an exopolymeric-producing bacterium. Results
suggested that plugging of the matrix-fractures by exopolymeric substances inhibited oil
recovery, resulting in the biosurfactant-producing bacterium outperforming the exopolymeric-
producing bacterium. The results presented herein, in comparison to the findings of Soudmand-
asli et al. (2007) suggest that the connectivity of fractures versus pores, and thus, pore
morphology, could be a major controlling factor as to the effectiveness of bioclogging.
To further explore the differences between biotic and abiotic recovery, blob size distributions
(BSD) were calculated and curve-fitted to the van Genuchten (1980) function (Figure 8 and 9
and the fitting parameters are reported in Table 2). MEOR treatment increased β and m
indicating that mean blob size decreased and became more uniform than the initial BSD after
primary recovery at Nca = 7.9x10⁻⁷
. Furthermore, the BSD after MEOR is similar to the BSD
obtained abiotically by increasing the capillary number (Figure 8 and 9). For instance, when
bioclogging occurs the resulting BSD (Figure 8) is very similar to that obtained with flooding at
Nca = 10-4
to 10-5
(Figure 9). In support of the BSD data, stereo microscope images show that
after primary recovery, residual oil existed as large ganglia that spanned multiple pores (Figure
7a, left and right). After biosurfactant flooding (Figure 7b, left) large ganglia still existed, and
after bioclogging (Figure 7b, right) only oil blobs residing within single pores remained.
Similar quantitative observations of reduced oil blob size during MEOR treatment have been
reported by Armstrong and Wildenschild 2011. However, a comparison between the size
distribution of residual blobs resulting from MEOR and those resulting from abiotic recovery has
not been reported. Results indicate that, as with abiotic recovery, MEOR mobilizes the large
residual oil ganglia. The mobilized ganglion are then either recovered from the micromodel or
broken up into smaller multiple oil ganglia that are more uniform in size than residual oil
globules after water flooding.
Microbial treatment in the 19o
micromodel shifted the radius or curvature distribution (RCD)
to smaller and more uniform radii (Figure 10) than the initial RCD after primary recovery at Nca
= 7.9x10⁻⁷
(Figure 11). The largest RCD shift occurred when bioclogging and biosurfactant
production occurred simultaneously (i.e. with JF-2, Figure 10). Again, biosurfactant flooding
and bioclogging appear to have a similar effect on the RCD as increasing the capillary number
under abiotic conditions where the RCD shifts to smaller and more uniform values. No negative
radii of curvature were measured during the abiotic or biotic experiments indicating that
micromodel wettability remained mostly water-wet during microbial treatment. Researchers have
reported that MEOR treatment can change the wettability of porous media using macro-scale
indices, such as, the Amott, USBM, or Carter method (Donaldson et al. 1969; Amott 1959).
After MEOR treatment with JF-2 the Amott wettability increased from -0.27 to -0.10 in initially
oil-wet cores (Kianipey et al. 1989) and the USBM wettability method in water-wet cores
showed that JF-2 shifted the wettability significantly in the positive direction toward a more
water-wet condition up to a maximum of 0.99 (Donaldson et al. 1969). These results support our
findings, since the curvature distributions prior to and after MEOR treatment are positive,
indicating water-wet curvatures.
3.4 Summary
The utilization of bacteria for enhanced oil recovery was ultimately explained by capillary
number effects, where changes in viscosity, pore velocity, and interfacial tension were mutually
affected. Results indicate that abiotic and biotic oil recovery proceeded in an analogous manner
according to the AOR, BSD, and RCD data. However, for combined bioclogging and
biosurfactant, capillary number could not fully explain recovery and it is assumed that a change
in pore morphology, due to bioclogging, was responsible for the additional recovery. Additional
oil recovery was optimal when both bioclogging and biosurfactant production occurred
simultaneously; however, this finding is contingent on pore morphology and it is expected that in
different porous networks the effectiveness of a given MEOR mechanism or combination
thereof, may differ. To address the questions posed in the introduction; our results indicate that a
metabolically stressed JF-2 culture is ideal for bioclogging and subsequent oil recovery and that
dead inactive biomass cannot recover oil. For example, flooding with compromised bacteria
suspended in a salt solution recovered no oil. Results further indicate that biosurfactant without
biomass can recover oil, but recovery is dependent on wettability. Conversely, active bacterial
biomass can recover oil, but the addition of a biosurfactant will improve recovery. The presented
results explain the importance of bioclogging for oil recovery in a simple micromodel system;
however, at the field-scale other complications will ultimately arise and the deleterious effects of
clogging need further investigation at that scale.
4. Conclusions
AOR was optimal when bioclogging and biosurfactant production occurred
simultaneously.
JF-2 cultures under stress caused by nutrient limitation and/or environmental conditions
were more efficient at bioclogging than bacterial populations under ideal growth
conditions.
MEOR was most effective under highly water-wet conditions.
JF-2 treatment in the 19o
micromodel recovered the same amount of oil as its abiotic
equivalent recovered at a capillary number of ~10-4
indicating that MEOR can replace
water flooding at high flow rates.
The change in BSD and RCD that occurred between water flooding and post MEOR in
the 19o
micromodel resembles that which occurred under abiotic conditions as a result
of brine flooding with increasing flow rate.
During MEOR, large ganglia were broken up into smaller daughter ganglion that either
became mobilized or trapped in single pores.
Ganglia that spanned multiple pores still existed after biosurfactant treatment, but not
after biosurfactant and bioclogging treatment.
Biotic and abiotic oil mobilization proceeded in a similar manner (blob morphology and
distributions changed analogously).
The effectiveness of a given MEOR mechanisms is likely dependent on pore morphology,
in particular the connectivity beyond the clogged flowpaths.
Acronyms
Additional Oil Recovered (AOR), Blob Size Distribution (BSD), Interfacial Tension (IFT),
Microbial Enhanced Oil Recovery (MEOR), Non-Aqueous Phase Liquid (NAPL), Non-
Surfactant Producing Bacteria (NSPB), Original Oil In Place (OOIP), Radius of Curvature
Distribution (RCD), Surfactant Producing Bacteria (SPB), and U.S. Bureau of Mines (USBM)
method.
Acknowledgements
Acknowledgment is made to the donors of the American Chemical Society Petroleum Research
Fund for support (or partial support) of this research (grant number 48505-AC9). Also, we thank
Kendra Brown for designing the micromodels in CAD and for development of the microscope
UV tracer method used in the presented experiments and Birdie Ciccarelli for help in the
laboratory.
References
Afrapoli, M., Alipour, S.,and Torsaeter, O. (2010). Effect of Wettability on Interfacial Tension
on Microbial Improved Oil Recovery with Rhodococuss sp 094, SPE 129707, presented at
the SPE Improved Oil Recovery Symposium held in Tulsa, Oklahoma, 24-28 April.
Al-Raoush, R. I. (2009), Impact of Wettability on Pore-Scale Characteristics of Residual
Nonaqueous Phase Liquids, Environmental Science & Technology, 43(13), 4796-4801.
Al-Raoush, R. I., and C. S. Willson (2005a), A pore-scale investigation of a multiphase porous
media system, Journal of Contaminant Hydrology, 77(1-2), 67-89.
Al-Raoush, R. I., and C. S. Willson (2005b), Extraction of physically realistic pore network
properties from three-dimensional synchrotron X-ray microtomography images of
unconsolidated porous media systems, Journal of Hydrology, 300(1-4), 44-64.
Amott, E. (1959), Observations Relating to the Wettability of Porous Rock, Trans., AIME, 216,
127-20.
Armstrong, R. T. and Wildenschild, D. (2012), Microbial enhanced oil recovery in fractional-wet
systems: a pore-scale investigation, Transport in Porous Media, vol. 92, issue 3, pp 819-
835..
Bordoloi, N. K., and B. K. Konwar (2008), Microbial surfactant-enhanced mineral oil recovery
under laboratory conditions, Colloids and Surfaces B-Biointerfaces, 63(1), 73-82.
Bredholt, H., K. Josefsen, A. Vatland, P. Bruheim, and K. Eimhjellen (1998), Emulsification of
crude oil by an alkane-oxidizing Rhodococcus species isolated from seawater, Canadian
Journal of Microbiology, 44(4), 330-340.
Bryant, R. S.; Burchfield, T. E.; Dennis, D. M.; and D. O. Hitzman. (1990), Microbial Enhanced
Waterflooding: Mink Unit project. SPE Reservoir Engineering, 5, 9-13
Cheng, J. T., L. J. Pyrak-Nolte, D. D. Nolte, and N. J. Giordano (2004), Linking pressure and
saturation through interfacial areas in porous media, Geophysical Research Letters, 31(8), 4.
Crescente, C., Torsaeter, O., Hultmann, L., Stroem, A., Rasmussen, K., and Kowalewski, E.
(2006), An experimental study of driving mechanisms in MIOR processes by using
Rhodococcus sp. 094. SPE paper 100033, presented at the International Symposium on
Improved Oil Recovery, Tulsa, Oklahoma, 22-26 April.
Crescente, C., Rekdal, A., Abriz, A., and Torsaeter, O. (2008) A pore level study of MIOR
displacement mechanisms in glass micromodels using Rhodococcus, sp. 094, SPE 110134,
presented at the SPE symposium on Improved Oil Recovery, Tulsa, Oklahoma, 20-23 April.
Donaldson, E. C., Thomas, R. D., and Lorenz, P. B. (1969) Wettability Determination and its
Effect on Recovery Efficiency. Society of Petroleum Engineers Journal, 13-20 March.
Graue, A., Bognø, T., Moe, R.W., Baldwin, B.A., Spinler, E.A., Maloney, D., Tobola,
D.P.(1999), Impacts of wettability on capillary pressure and relative permeability. SCA9907,
International Symposium of the Society of Core Analysts, Golden, Colorado, 1-4 August.
Gray, R. Murray, Yeung, Anthony, Foght, M. Julia., and Yarranton, W. Harvey (2008). Potential
Microbial enhanced Oil Recovery Processes: A Critical Analysis, SPE Annual Technical
Conference and Exhibition, SPE 114676, Denver, Colorado, 21-24 September.
Hiltzman, D. O. Review of microbial enhanced recovery field tests, p. VI 1-VI 41. In T. E.
Burchfield and R. S. Bryant (ed.), Proceedings of the Symposium on Applications of
Microorganisms to Petroleum Technology. National Technical Information Service,
Springfield, Va. 1988.
Hitzman, D. O. Petroleum microbiology and the history of its role in enhanced oil recovery. p.
162-218. In E. C. Donaldson and J. B. Clark (ed.) Proceedings of the 1982 Conference on
Microbial Enhancement of Oil Recovery. CONF-8205140. U.S. Department of Energy,
Bartlesville, Okla. 1983.
Karpyn, Z. T., M. Piri, and G. Singh (2010), Experimental investigation of trapped oil clusters in
a water-wet bead pack using X-ray microtomography, Water Resources Research, 46, 25.
Kianipey, S. A. D. (1990) Mechanisms of Oil Displacement by Microorganisms. Microbial
Enhancement of Oil Recovery – Recent Advances, ed. E.C. Donalsdon, Amsterdam:
Elservier Science Publishers.
Kowalewski, E., Rueslåtten, I., Gilje, E., Sunde, E., Bødtker, G., Lillebø, B., Torsvik, T.,
Stensen, J., Bjørkvik, B., and Strand, K.(2005), Interpretation of Microbial Oil Recovery
from Laboratory Experiments, paper presented at the 13th European Sympsium on Improved
Oil Recovery, Budapest, Hungary, 25-27 April.
Lazar, I. (1991), MEOR Field trials carried out over the world during the last 35 years.
Developments in Petroleum Science, 31, 485-530.
Liu, Y., Nolte, D., and Pyrak-Nolte, L. (2011), Hysteresis and interfacial energies in smooth-
walled microfluidic channels, Water Resources Research, vol. 47, W01504.
Morrow, N. R. and Mason G. (2001) Recovery of Oil by Spontaneous Imbibition, Current
Opinion in Colloid and Interface Sciences, 6, 321-337.
Melrose, J. C., and C. F. Brandner (1974), Role of capillary forces in determining microscopic
displacement efficiency for oil-recovery by waterflooding, Journal of Canadian Petroleum
Technology, 13 (4), 54-62.
Mayer, A. S. and Miller, C. T.: 1992, The influence of porous medium characteristics and
measurement scale on pore-scale distributions of residual nonaqueous-phase liquids, Journal
of Contaminate Hydrology. 11, 189–213.
Sethian, J. A., and P. Smereka (2003), Level set methods for fluid interfaces, Annual Review of
Fluid Mechanics, 35, 341-372.
Soudmand-asli, A., S. S. Ayatollahi, H. Mohabatkar, M. Zareie, and S. F. Shariatpanahi (2007),
The in situ microbial enhanced oil recovery in fractured porous media, Journal of Petroleum
Science and Engineering, 58 (1-2), 161-172.
Stalkup, F. I., Jr., (1984), Miscible displacement, Society of Petroleum Engineers Monograph,
Richardson, Texas, p. 3.
Suthar, H., K. Hingurao, A. Desai, and A. Nerurkar (2009), Selective Plugging Strategy Based
Microbial Enhanced Oil Recovery Using Bacillus licheniformis TT33, Journal of
Microbiology and Biotechnology, 19(10), 1230-1237.
Tweheyo, M. T., Holt, T., and Torsæter O. (1999), An Experimental Study of the Relationship
between Wettability and Oil Production Characteristics, Journal of Petroleum Science and
Engineering, 24, 179-188.
van Genuchten M. Th.(1980), A Closed-form Equation for Predicting the Hydraulic
Conductivity of Unsaturated Soils. Soil Sci. Soc. Am. J. 44:892-898.
von der Schulenburg, D. A. G., T. R. R. Pintelon, C. Picioreanu, M. C. M. Van Loosdrecht, and
M. L. Johns (2009), Three-Dimensional Simulations of Biofilm Growth in Porous Media,
Aiche Journal, 55(2), 494-504.
Wardlaw, N. C., and M. McKellar (1985), Oil blob populations and mobilization of trapped oil
in unconsolidated packs, Canadian Journal of Chemical Engineering, 63(4), 525-532.
Willhite, G. P. and Green, D. W. (1998), Enhanced Oil Recovery, Society of Petroleum
Engineers Textbook Series, Vol. 6, SPE, Richardson, TX.
Youssef, N., M. S. Elshahed, and M. J. McInerney (2009), Microbial Processes in Oil Fields:
Culprits, Problems, and Opportunities, Advances in Applied Microbiology, Vol 66, edited,
pp. 141-251, Elsevier Academic Press Inc, San Diego.
Figure 1: Micromodel pattern (black = flow channels).
Figure 2: Image segmentation. (a) 16-bit RBG colored image (green = oil), (b) median filtered 16-bit gray
scale image, (c) binary image, (d) red, green, and blue channel histograms for image (a).
Fig
ure 3
: Sele
cte
d ster
eo m
icrosc
op
e images fo
r each
flood
ing
solu
tion
teste
d fo
r the 3
8o
micr
om
od
el. R
esu
lts are rep
orte
d a
s AO
R p
er b
iom
ass in
fuse
d in
to
the m
icrom
od
el (g
ree
n =
oil, w
hite
= b
iom
ass). E
ach
co
lum
n c
orre
spo
nd
s to a
giv
en
floo
din
g so
lutio
n a
nd
each
row
corre
spon
ds to
eq
uiv
ale
nt b
iom
ass
infu
sed
.
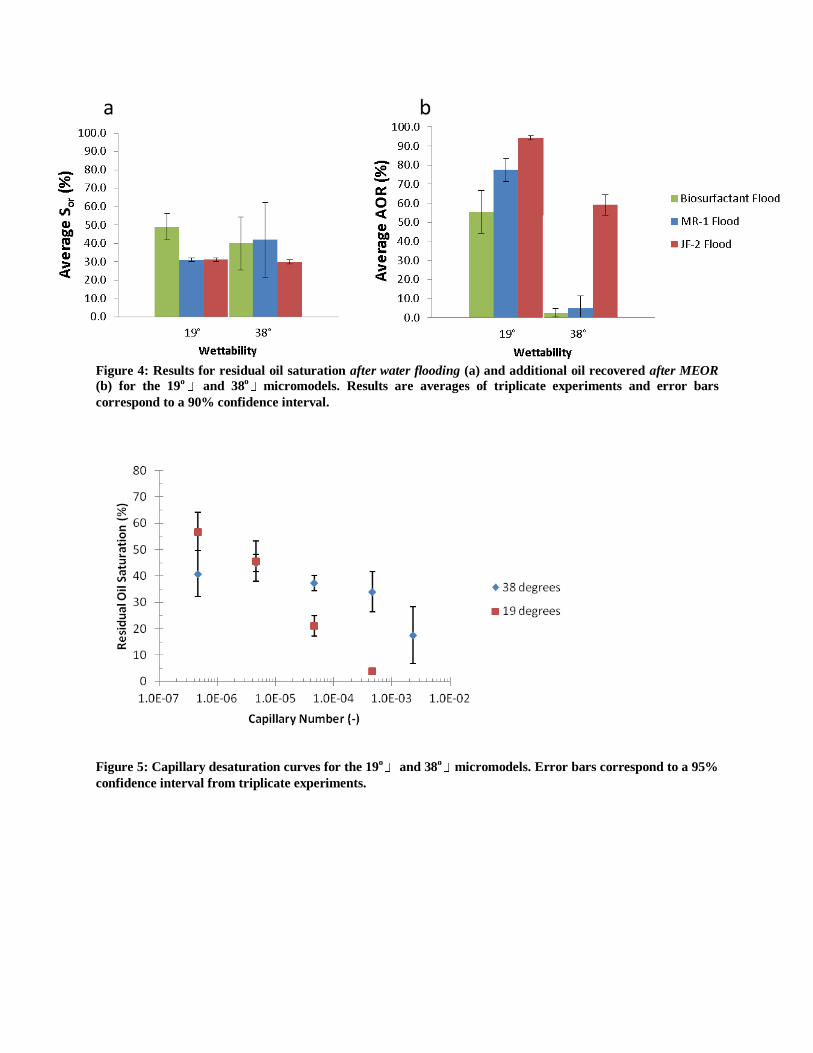
Figure 4: Results for residual oil saturation after water flooding (a) and additional oil recovered after MEOR
(b) for the 19o
and 38o
micromodels. Results are averages of triplicate experiments and error bars
correspond to a 90% confidence interval.
Figure 5: Capillary desaturation curves for the 19
o and 38
omicromodels. Error bars correspond to a 95%
confidence interval from triplicate experiments.
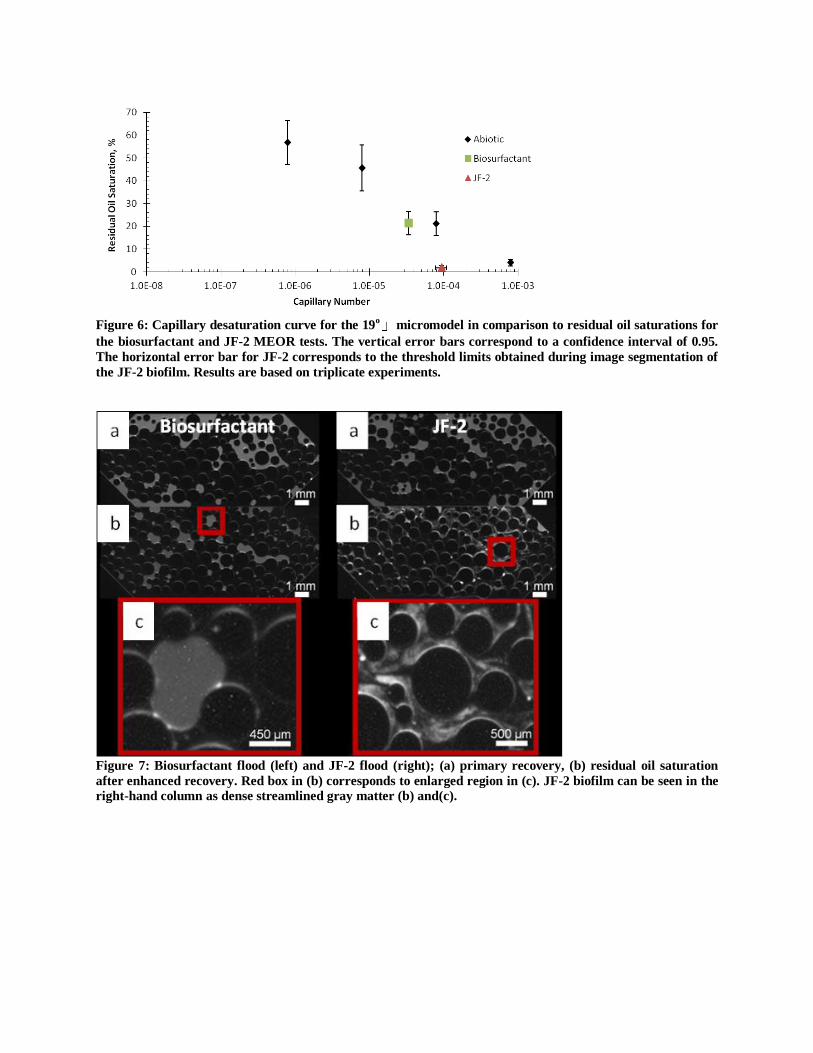
Figure 6: Capillary desaturation curve for the 19
o micromodel in comparison to residual oil saturations for
the biosurfactant and JF-2 MEOR tests. The vertical error bars correspond to a confidence interval of 0.95.
The horizontal error bar for JF-2 corresponds to the threshold limits obtained during image segmentation of
the JF-2 biofilm. Results are based on triplicate experiments.
Figure 7: Biosurfactant flood (left) and JF-2 flood (right); (a) primary recovery, (b) residual oil saturation
after enhanced recovery. Red box in (b) corresponds to enlarged region in (c). JF-2 biofilm can be seen in the
right-hand column as dense streamlined gray matter (b) and(c).
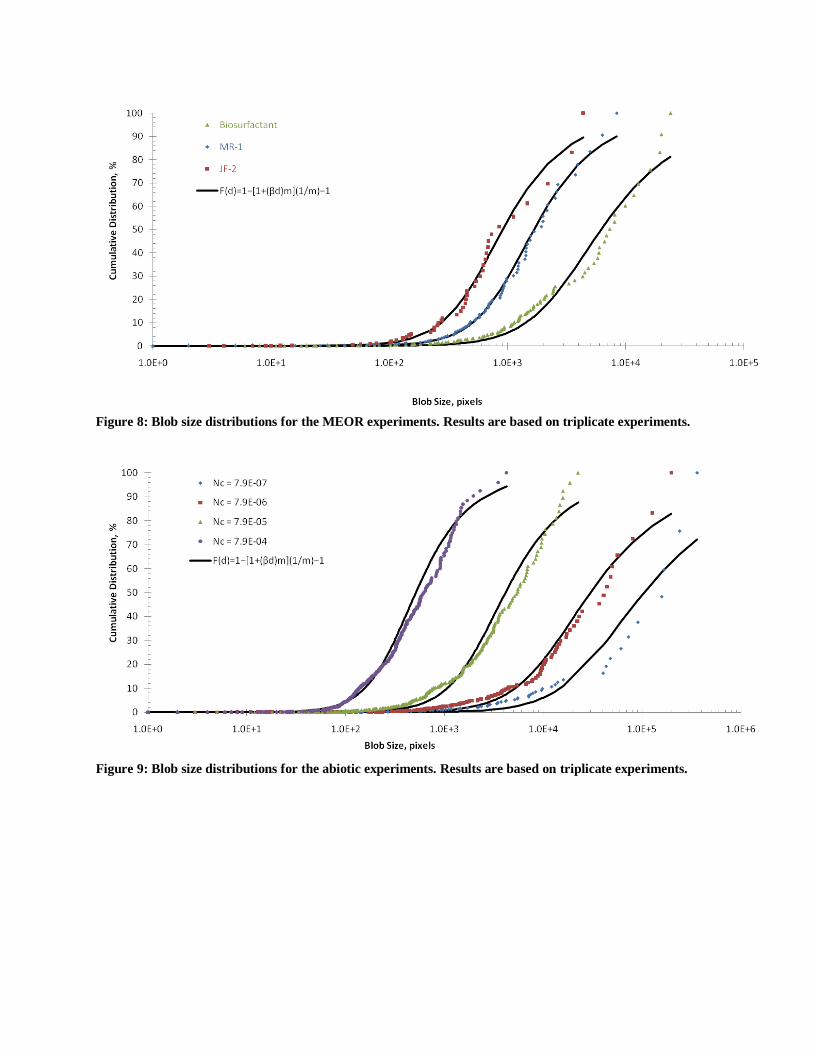
Figure 8: Blob size distributions for the MEOR experiments. Results are based on triplicate experiments.
Figure 9: Blob size distributions for the abiotic experiments. Results are based on triplicate experiments.
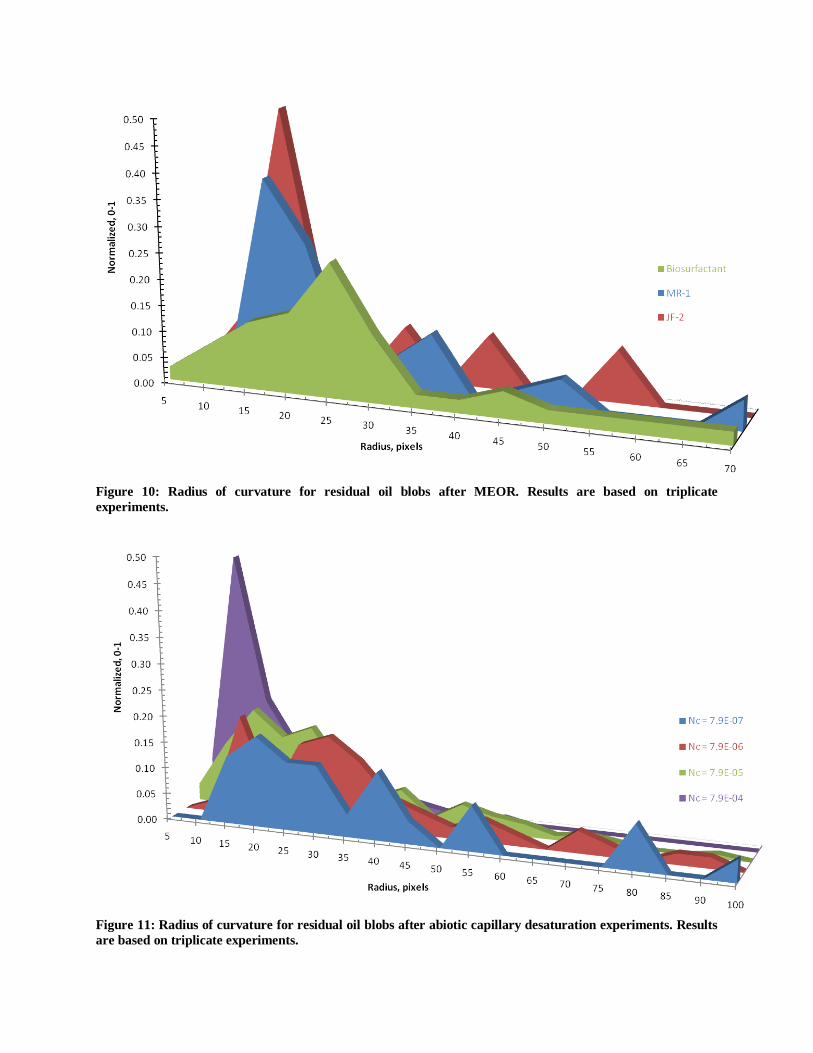
Figure 10: Radius of curvature for residual oil blobs after MEOR. Results are based on triplicate
experiments.
Figure 11: Radius of curvature for residual oil blobs after abiotic capillary desaturation experiments. Results
are based on triplicate experiments.
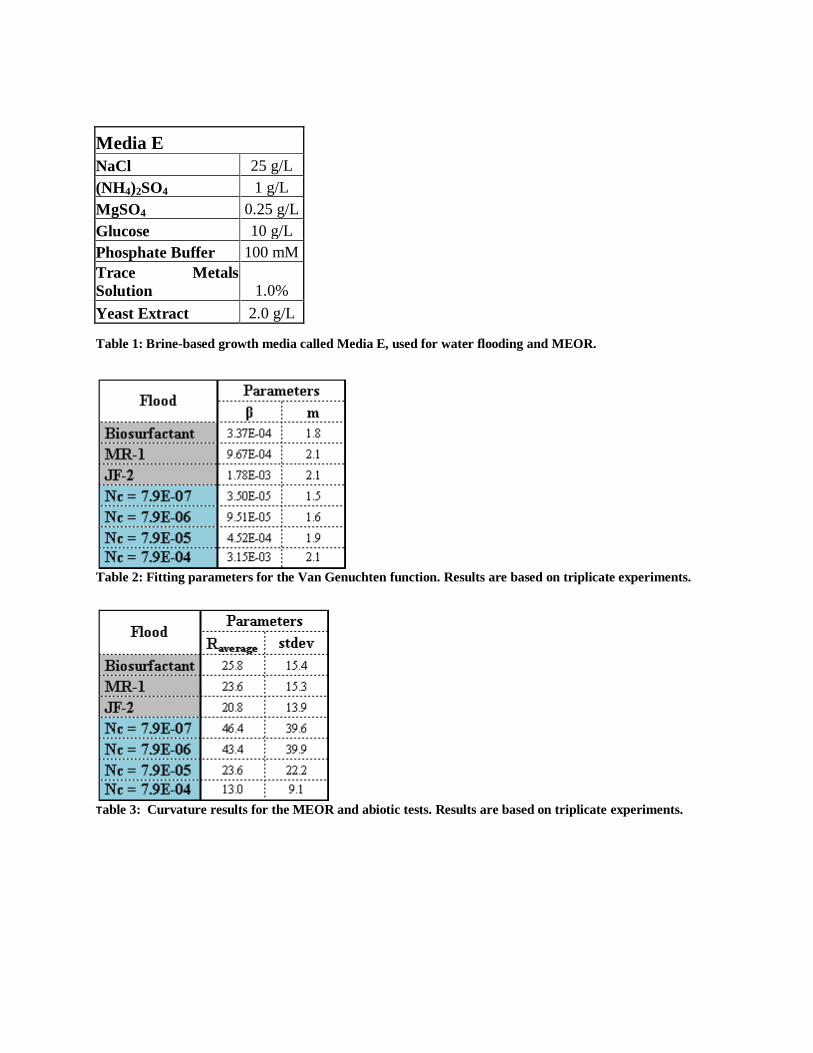
Media E
NaCl 25 g/L
(NH4)2SO4 1 g/L
MgSO4 0.25 g/L
Glucose 10 g/L
Phosphate Buffer 100 mM
Trace Metals
Solution 1.0%
Yeast Extract 2.0 g/L
Table 1: Brine-based growth media called Media E, used for water flooding and MEOR.
Table 2: Fitting parameters for the Van Genuchten function. Results are based on triplicate experiments.
Table 3: Curvature results for the MEOR and abiotic tests. Results are based on triplicate experiments.