Embed Size (px)
Citation preview
P-12 Education
Investigating the Pathway to Proficiency
from Birth through 3rd Grade
Claudia J. Coulton, PhD | Robert L. Fischer, PhD | Seok-Joo Kim, PhD
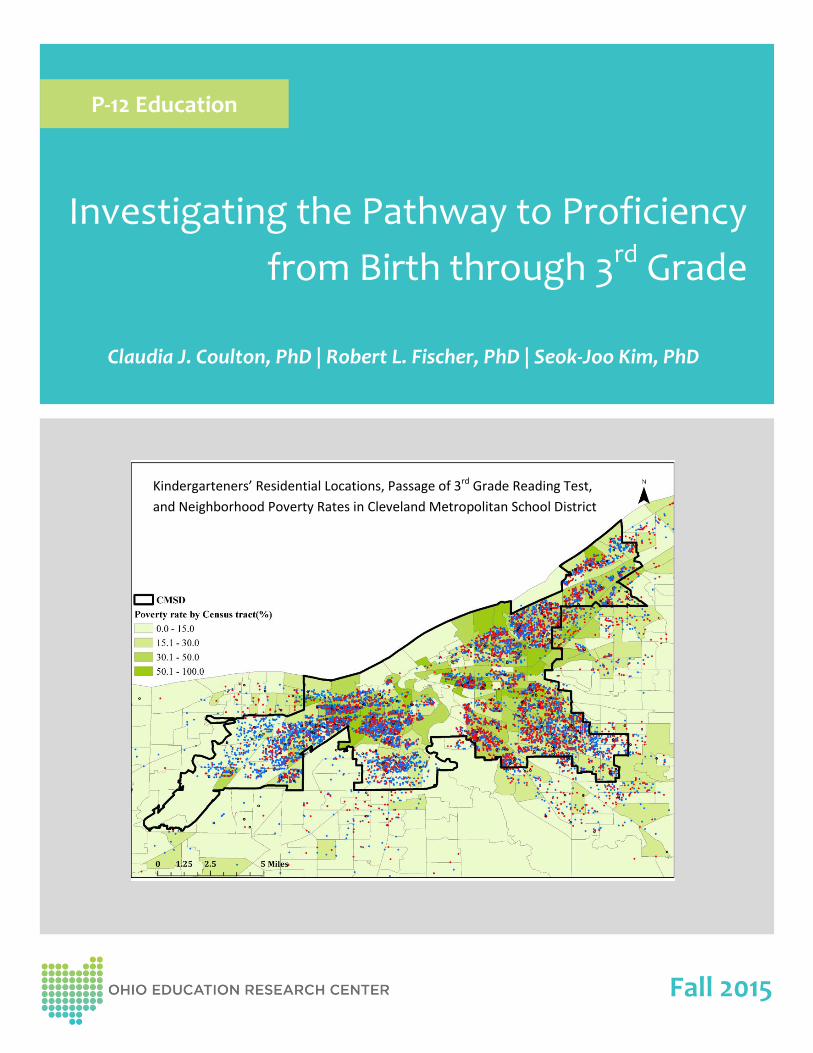
Kindergarteners’ Residential Locations, Passage of 3rd Grade Reading Test,
and Neighborhood Poverty Rates in Cleveland Metropolitan School District
Fall 2015

Ohio Education Research Center | Investigating the Pathway to Proficiency from Birth through 3rd Grade ii

Ohio Education Research Center | Investigating the Pathway to Proficiency from Birth through 3rd Grade iii
The Ohio Education Research Center (OERC) is a collaboration of seven universities and four research organizations that conduct education and workforce research, provide access to research data, and seek to share research findings with policymakers and practitioners. The OERC provides access to research data through the Ohio Longitudinal Data Archive. The OLDA creates linkages between longitudinal workforce and educational records to measure the experiences of individuals from childhood through the workforce. The OERC is headquartered at The Ohio State University and is coordinated by the John Glenn College of Public Affairs. The MISSION of the OERC is to develop and implement a statewide, preschool-through-workforce research agenda addressing critical issues of education practice and policy. The OERC identifies and shares successful practices, responds to the needs of Ohio’s educators and policymakers, and signals emerging trends. The OERC communicates its findings broadly, through multiple platforms and networks, producing materials, products and tools to improve educational practice, policy and outcomes. The VISION of the OERC is to be the source for cutting edge knowledge and resources regarding education and training for Ohio’s educators, policymakers and community leaders creating a dynamic cycle of research and practice where the needs of practitioners drive the research agenda and high-quality research has a rapid impact upon practice in the field.
www.oerc.osu.edu | [email protected] | (855) 231-7753
Ohio Education Research Center | Investigating the Pathway to Proficiency from Birth through 3rd Grade i
© Ohio Education Research Center 2015
This study was funded by Ohio’s Race to the Top project and supported by the Ohio Education Research Center. The Center for Human Resource Research at the Ohio State University (chrr.ohio-state.edu) provided state-level education data (from Education Management Information System) to this project. Ms. Nina Lalich and Ms. Tsui Chan, working for the CHILD system at Center on Urban Poverty and Community Development, assisted in data preparation. Mr. Youngmin Cho, a graduate assistant, assisted in literature review and descriptive analysis. The Ohio Education Research Center would like to thank the following individuals who helped make this research possible:
Project Team Claudia J. Coulton, Ph.D., Co-principal Investigator Robert L. Fischer, Ph.D., Co-principal Investigator Seok-Joo Kim, Ph.D., Senior Research Associate Elizabeth R. Anthony, Ph.D., Senior Research Associate Questions regarding this report should be directed to Dr. Claudia Coulton. Dr. Claudia Coulton Professor Case Western Reserve University (216) 368-2304 [email protected]
ACKOWLEDGEMENTS
Ohio Education Research Center | Investigating the Pathway to Proficiency from Birth through 3rd Grade 1
TABLE OF CONTENTS
Executive Summary ......................................................................................................................................................................... 1
Introduction and Background .................................................................................................................................................. 3
Introduction ............................................................................................................................................................................................... 3
Background ................................................................................................................................................................................................ 3
Method .................................................................................................................................................................................................... 7
Design and Sampling ........................................................................................................................................................................ 7
Data Management: IDS Approach ........................................................................................................................................... 9
ChildHood Integrated Longitudinal Data (CHILD) System: County-Level Individual Data ........ 9
Education Management Information System (EMIS): State-Level Individual Data .......................... 9
Northeast Ohio Community and Neighborhood Data for Organizing (NEO CANDO) and
American Community Survey (ACS): Neighborhood-Level Data ................................................................. 9
Measures .................................................................................................................................................................................................. 12
Dependent Variables ............................................................................................................................................................. 12
Independent Variables .......................................................................................................................................................... 12
Analytical Model ................................................................................................................................................................................. 16
Findings ................................................................................................................................................................................................ 18
Kindergarten Readiness Assessment-Literacy (KRA-L) ......................................................................................... 18
Overview ........................................................................................................................................................................................ 18
Child Characteristics ............................................................................................................................................................. 18
Home Visiting Services ........................................................................................................................................................ 19
Early Childhood Services ................................................................................................................................................... 19
Mobility and Neighborhood .............................................................................................................................................. 19
3rd Grade Reading Proficiency Test ................................................................................................................................. 26
Overview ........................................................................................................................................................................................ 26
Child Characteristics ............................................................................................................................................................. 26
Family Characteristics .......................................................................................................................................................... 26
Home Visiting Services ........................................................................................................................................................ 27
Early Childhood Services ................................................................................................................................................... 27
School Experiences ................................................................................................................................................................ 27
Ohio Education Research Center | Investigating the Pathway to Proficiency from Birth through 3rd Grade 2
Mobility and Neighborhood .............................................................................................................................................. 27
Conclusions ............................................................................................................................................................................. 33
Limitations and Future Study ..................................................................................................................................................... 35
References ................................................................................................................................................................................ 37
FIGURES
Figure 1. Conceptual Model ..................................................................................................................................................... 6
Figure 2. Cohort Design ............................................................................................................................................................. 8
Figure 3. The CHILD System ................................................................................................................................................. 10
Figure 4. Integrated Data System (IDS) Approach ................................................................................................. 11
TABLES
Table 1. List of Variables ........................................................................................................................................................ 15
Table 2. Hierarchical Linear Model (HLM) and Hierarchical Generalized Linear Model (HGLM)
............................................................................................................................................................................................. 17
Table 3. Descriptive Statistics for KRA-L: Individual and Bivariate Level ............................................... 21
Table 4. Hierarchical Linear Model (HLM) for KRA-L ........................................................................................... 23
Table 5. Descriptive Statistics for 3rd Grade Reading Test Model: Individual and Bivariate
Level .................................................................................................................................................................................. 28
Table 6. Hierarchical Generalized Linear Model (HGLM) for 3rd Grade Reading Test ................. 30
MAPS
Map 1. Kindergarteners' Residential Locations, KRA-L Band, and Neighborhood Poverty Rates
in Cleveland Metropolitan School District, OH ...................................................................................... 24
Map 2. Mean KRA-L by Census Tract and Neighborhood Poverty Rates in Cleveland
Metropolitan School District, OH ..................................................................................................................... 24
Map 3. Kindergarteners' Residential Locations, Passage of 3rd Grade Reading Test, and
Neighborhood Poverty Rates in Cleveland Metropolitan School District, OH .................. 31
Map 4. Passage Rates of 3rd Grade Reading Test by Census Tract and Neighborhood
Poverty Rates in Cleveland Metropolitan School District, OH .................................................... 32
Ohio Education Research Center | Investigating the Pathway to Proficiency from Birth through 3rd Grade 1
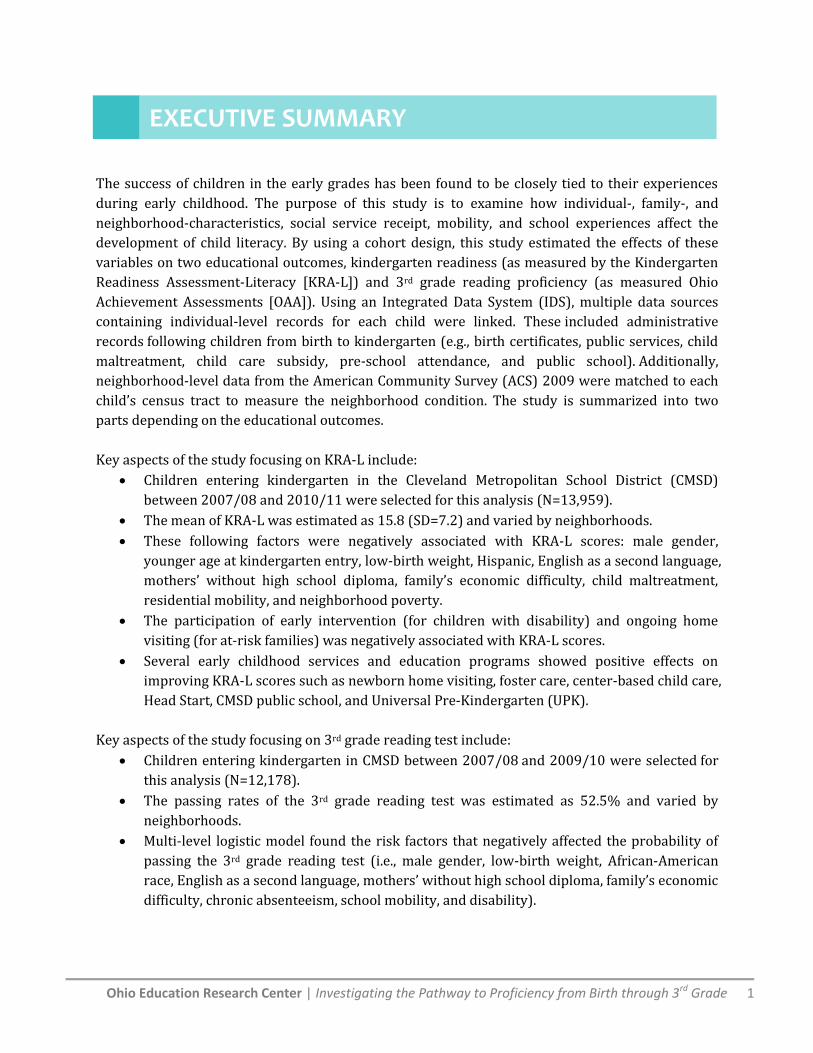
The success of children in the early grades has been found to be closely tied to their experiences
during early childhood. The purpose of this study is to examine how individual-, family-, and
neighborhood-characteristics, social service receipt, mobility, and school experiences affect the
development of child literacy. By using a cohort design, this study estimated the effects of these
variables on two educational outcomes, kindergarten readiness (as measured by the Kindergarten
Readiness Assessment-Literacy [KRA-L]) and 3rd grade reading proficiency (as measured Ohio
Achievement Assessments [OAA]). Using an Integrated Data System (IDS), multiple data sources
containing individual-level records for each child were linked. These included administrative
records following children from birth to kindergarten (e.g., birth certificates, public services, child
maltreatment, child care subsidy, pre-school attendance, and public school). Additionally,
neighborhood-level data from the American Community Survey (ACS) 2009 were matched to each
child’s census tract to measure the neighborhood condition. The study is summarized into two
parts depending on the educational outcomes.
Key aspects of the study focusing on KRA-L include:
Children entering kindergarten in the Cleveland Metropolitan School District (CMSD)
between 2007/08 and 2010/11 were selected for this analysis (N=13,959).
The mean of KRA-L was estimated as 15.8 (SD=7.2) and varied by neighborhoods.
These following factors were negatively associated with KRA-L scores: male gender,
younger age at kindergarten entry, low-birth weight, Hispanic, English as a second language,
mothers’ without high school diploma, family’s economic difficulty, child maltreatment,
residential mobility, and neighborhood poverty.
The participation of early intervention (for children with disability) and ongoing home
visiting (for at-risk families) was negatively associated with KRA-L scores.
Several early childhood services and education programs showed positive effects on
improving KRA-L scores such as newborn home visiting, foster care, center-based child care,
Head Start, CMSD public school, and Universal Pre-Kindergarten (UPK).
Key aspects of the study focusing on 3rd grade reading test include:
Children entering kindergarten in CMSD between 2007/08 and 2009/10 were selected for
this analysis (N=12,178).
The passing rates of the 3rd grade reading test was estimated as 52.5% and varied by
neighborhoods.
Multi-level logistic model found the risk factors that negatively affected the probability of
passing the 3rd grade reading test (i.e., male gender, low-birth weight, African-American
race, English as a second language, mothers’ without high school diploma, family’s economic
difficulty, chronic absenteeism, school mobility, and disability).
EXECUTIVE SUMMARY
Ohio Education Research Center | Investigating the Pathway to Proficiency from Birth through 3rd Grade 2
The participations of early childhood care services and programs contributed to increasing
the possibility of passing 3rd grade reading test (i.e., newborn home visiting, CMSD public
school, and UPK).
This study showed the positive association between pre-school (or UPK) enrollment and child
literacy development in a large population of public school children. The findings affirmed
promising early learning programs designed to improve kindergarten readiness. By drawing an IDS
data, the project demonstrated that IDS is a powerful tool for researchers answering longitudinal
research questions that include birth and early childhood experiences in the effort to understand
early literacy.
Ohio Education Research Center | Investigating the Pathway to Proficiency from Birth through 3rd Grade 3
Introduction The purpose of this study was to explore relationships among individual, family, and neighborhood
characteristics, social service receipt, mobility, kindergarten readiness and 3rd grade reading
achievement. This study was designed to address pressing developmental and educational research
questions concerning kindergarten readiness and 3rd grade reading achievement by drawing upon
shared data between Local Education Agencies (LEAs) and a broad range of agencies that serve
young children. Specifically, this project linked student records data from K-3rd grade with early
childhood experiences as reflected in administrative records from child care, early education, and
social service providers, along with measures of conditions in the child’s neighborhood. The data
were analyzed to examine how early childhood risk factors and programs affect school readiness
and student progress in grades
1 to 3. The results of this work
are particularly timely with
respect to informing state-
level interests concerning
school readiness (both its
antecedents and its
consequences) and 3rd grade
reading achievement.
This study had several specific
aims: 1) To assess the
practicality of linking early
childhood and K-3 student records and potential usefulness of the resulting information to local
schools; 2) To determine how individual, family, social services, and environmental risk factors in
early childhood interact with participation in early childhood education programs to influence
kindergarten readiness; 3) To estimate the effects of early childhood risk factors and experiences
and kindergarten readiness on student progress over grades 1 to 3; and 4) To identify child-level
indices, including kindergarten readiness, that in their combination accurately predict reading
proficiency in third grade.
Background
Early exposure to environmental hazards, stressful circumstances, and less than optimal early
learning environments negatively affects early cognitive and socio-emotional development.
According to Evans, Gonnella, Marcynyszyn, Gentile, and Salpeckar (2005) chaos in the home
mediated the relationship between poverty and three social emotional outcomes in children
INTRODUCTION AND BACKGROUND
This project linked student records data from K-3rd
grade with early childhood experiences as reflected in
administrative records from child care, early
education, and social service providers, along with
measures of conditions in the child’s neighborhood.
Ohio Education Research Center | Investigating the Pathway to Proficiency from Birth through 3rd Grade 4
including learned helplessness, psychological distress, and self-regulation. Indicators of household
chaos, such as a lack of routine and having the television generally on have also been associated
with deficits in receptive vocabulary and attention, an inability to delay gratification and increased
aggression (Martin, Razza, & Brooks-Gunn, 2012). Low-income children and children growing up in
poor neighborhoods experience these adverse environmental conditions at higher rates than
children from more affluent circumstances (Evans, 2004; Hart & Risley, 1995). In a 2004 review of
the literature, Evans (2004) highlighted the inequitable distribution of detrimental psychosocial
and physical factors in the environments of children living in poverty. For example, violence, family
instability, pollution, and poor housing quality are just a few of the risk factors more likely to be
experienced among children living in poor families.
Risk factors exert a cumulative effect. In a longitudinal study of 171 high-risk children, children
with more risk factors in early childhood demonstrated more externalizing behavior problems in
adolescence than children with fewer early childhood risks (Appleyard, Egeland, van Dulmen, &
Sroufe, 2005). In addition, risk factors experienced in early childhood continued to influence
behavior in adolescence even after controlling for middle childhood risks (Appleyard et al., 2005).
In a 17-year longitudinal analysis of neighborhood context on the likelihood of graduating from
high school, Wodtke, Harding, and Elwert (2011) concluded that the more time spent in
disadvantaged neighborhoods, the less likely a child is to
graduate from high school (Wodtke, Harding, & Elwert, 2011). In
their study, prolonged exposure to the most disadvantaged
neighborhoods was associated with a 20 percent reduction in
the probability of graduating from high school for black children
(Wodtke et al., 2011). Even though the connection between early
childhood exposure to risk and success in school is well
documented (Hopson & Lee, 2011; Mistry, Benner, Biesanz,
Clark, & Howes, 2010; Sektnan, McClelland, Acock, & Morrison,
2010), school personnel have little direct information about the
cumulative risk profile of their own students as they enter
kindergarten and advance through the primary grades.
Particularly for schools that have large numbers of
disadvantaged students, this type of information could be useful
in educational planning for children coming into kindergarten
and in engaging the community in early childhood programing.
It is increasingly recognized that longitudinal data is a key
ingredient for improving educational effectiveness (West, 2012).
Ohio is a leader in designing integrated student record systems
to track children from kindergarten through college and career.
However, the first five years of a child’s life, ones known to be
vitally important for educational success, are currently invisible to these data systems. The
incorporation of records from early childhood is particularly challenging for a number of reasons.
Early childhood education occurs in many settings, such as public pre-schools, Head Start centers,
Understanding the
Relationship between
early childhood
experiences, kindergarten
readiness and students’
academic progress
through the 3rd grade is
vital information as
schools in Ohio work
toward achieving the
“third grade reading
guarantee.”
Ohio Education Research Center | Investigating the Pathway to Proficiency from Birth through 3rd Grade 5
private and non-profit pre-schools, and child care centers and there is great variation in record
keeping formats and requirements (Hernandez, 2012). Additionally, social service and health
records, which are arguably a source of vital information about early stressors and environmental
exposures, are also contained in disparate systems at the present time. Finally, data on family
financial hardships in the early years are also important in understanding cumulative risk, but such
information is not available in student record systems.
Understanding the relationship between early childhood experiences, kindergarten readiness and
students’ academic progress through the 3rd grade is vital information as schools in Ohio work
toward achieving the “third grade reading guarantee.” Children who are not proficient readers in
third grade and have grown up in poverty experience the highest rates of school drop-out
(Hernandez, 2011), so it is a pressing concern to provide educational experiences for children who
are at risk of not reaching this milestone before they enter kindergarten. However, it is likely that
quite a few children with multiple family and environmental risk factors are also missing out on
high quality early learning programs. This study demonstrates how linked early childhood data and
primary school data can aid communities in addressing barriers to achieving the third grade
guarantee for all children even before they enter kindergarten.
Finally, considerable evidence suggests that it is possible to identify children at kindergarten and
first grade who are unlikely to be proficient readers by third grade. For instance, third-grade
reading failure is highly associated with poor performance at kindergarten on such indices as
phonological awareness, alphabet knowledge, and language ability. Using Ohio-specific educational
data, such as entering kindergarten readiness scores coupled with ongoing reading-assessment
data, it is possible to identify profiles of children who are most likely to exhibit reading failure at
third grade. Such data are highly influential to addressing the ‘third-grade guarantee’ by providing
schools with guidance on how to identify children most vulnerable for failing to achieve reading
proficiency by third grade.
This study used a unique Integrated Data System (IDS) built for Cuyahoga County to construct a
longitudinal study of children using administrative data (Fischer, Lalich, & Coulton, 2008). The
study addressed the following research question:
How do early childhood services predict kindergarten readiness and 3rd grade reading
achievement after controlling for characteristics of the child and, family, residential and
school mobility, and neighborhood conditions?
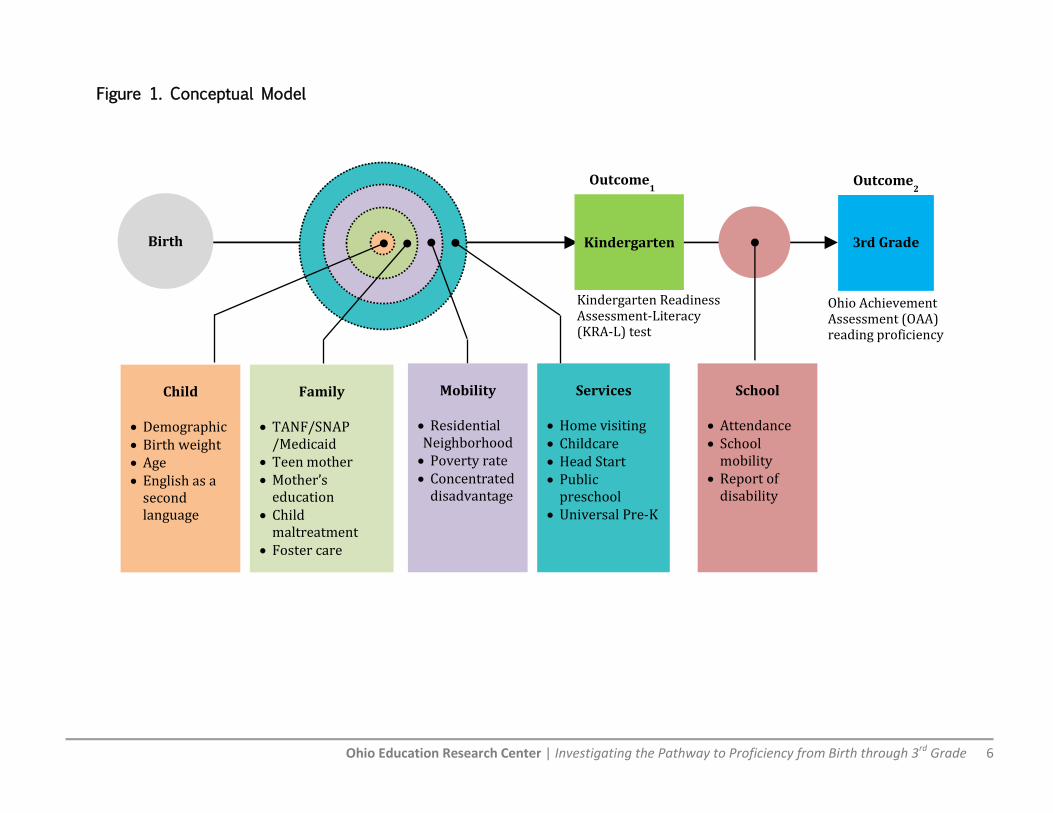
This study’s conceptual model was based on an ecological perspective and was longitudinal in
scope (See Figure 1). As such, kindergarten readiness and 3rd grade reading proficiency were a
function of child, family, and neighborhood characteristics as well as social service receipt. In
addition, 3rd grade reading proficiency was also hypothesized to be affected by the child’s school
mobility and attendance, controlling for any disabilities identified by the school.
Ohio Education Research Center | Investigating the Pathway to Proficiency from Birth through 3rd Grade 6
Outcome2
Kindergarten Readiness Assessment-Literacy (KRA-L) test
Ohio Achievement Assessment (OAA) reading proficiency
Outcome1
3rd Grade Birth Kindergarten
Child
Demographic Birth weight Age English as a
second language
Family
TANF/SNAP
/Medicaid Teen mother Mother’s
education Child
maltreatment Foster care
Services
Home visiting Childcare Head Start Public
preschool Universal Pre-K
School
Attendance School
mobility Report of
disability
Mobility
Residential Neighborhood Poverty rate Concentrated
disadvantage
Figure 1. Conceptual Model
Ohio Education Research Center | Investigating the Pathway to Proficiency from Birth through 3rd Grade 7
Design and Sampling
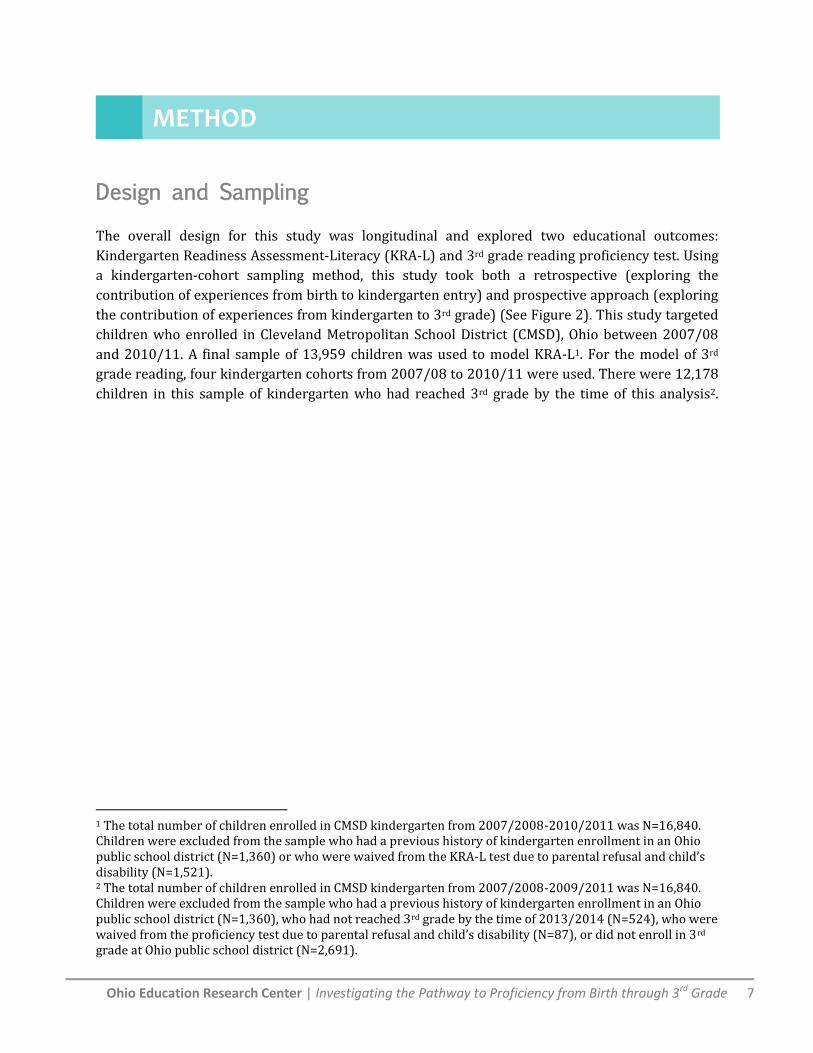
The overall design for this study was longitudinal and explored two educational outcomes:
Kindergarten Readiness Assessment-Literacy (KRA-L) and 3rd grade reading proficiency test. Using
a kindergarten-cohort sampling method, this study took both a retrospective (exploring the
contribution of experiences from birth to kindergarten entry) and prospective approach (exploring
the contribution of experiences from kindergarten to 3rd grade) (See Figure 2). This study targeted
children who enrolled in Cleveland Metropolitan School District (CMSD), Ohio between 2007/08
and 2010/11. A final sample of 13,959 children was used to model KRA-L1. For the model of 3rd
grade reading, four kindergarten cohorts from 2007/08 to 2010/11 were used. There were 12,178
children in this sample of kindergarten who had reached 3rd grade by the time of this analysis2.
1 The total number of children enrolled in CMSD kindergarten from 2007/2008-2010/2011 was N=16,840. Children were excluded from the sample who had a previous history of kindergarten enrollment in an Ohio public school district (N=1,360) or who were waived from the KRA-L test due to parental refusal and child’s disability (N=1,521). 2 The total number of children enrolled in CMSD kindergarten from 2007/2008-2009/2011 was N=16,840. Children were excluded from the sample who had a previous history of kindergarten enrollment in an Ohio public school district (N=1,360), who had not reached 3rd grade by the time of 2013/2014 (N=524), who were waived from the proficiency test due to parental refusal and child’s disability (N=87), or did not enroll in 3rd grade at Ohio public school district (N=2,691).
METHOD
Ohio Education Research Center | Investigating the Pathway to Proficiency from Birth through 3rd Grade 8
Cohort 1
(N=3,989)
B
3rd
3rd
3rd
2001 2002 2003 2004 2005 2006 2007 2008 2009 2010 2011 2012 Year
Retrospective
B
Prospective
Cohort 2
(N=3,929)
Cohort 3
(N=3,956)
Cohort 4*
(N=3,606)
Note: First enrollment of kindergarten in Cleveland Metropolitan School District (N=15,480) *495 children are still at 1st or 2nd grade in 2014/2015 school year.
K
B
B
K
K
Birth Kindergarten 3rd
grade
3rd
2013
Figure 2. Cohort Design
K

Ohio Education Research Center | Investigating the Pathway to Proficiency from Birth through 3rd Grade 9
Data Management: IDS Approach
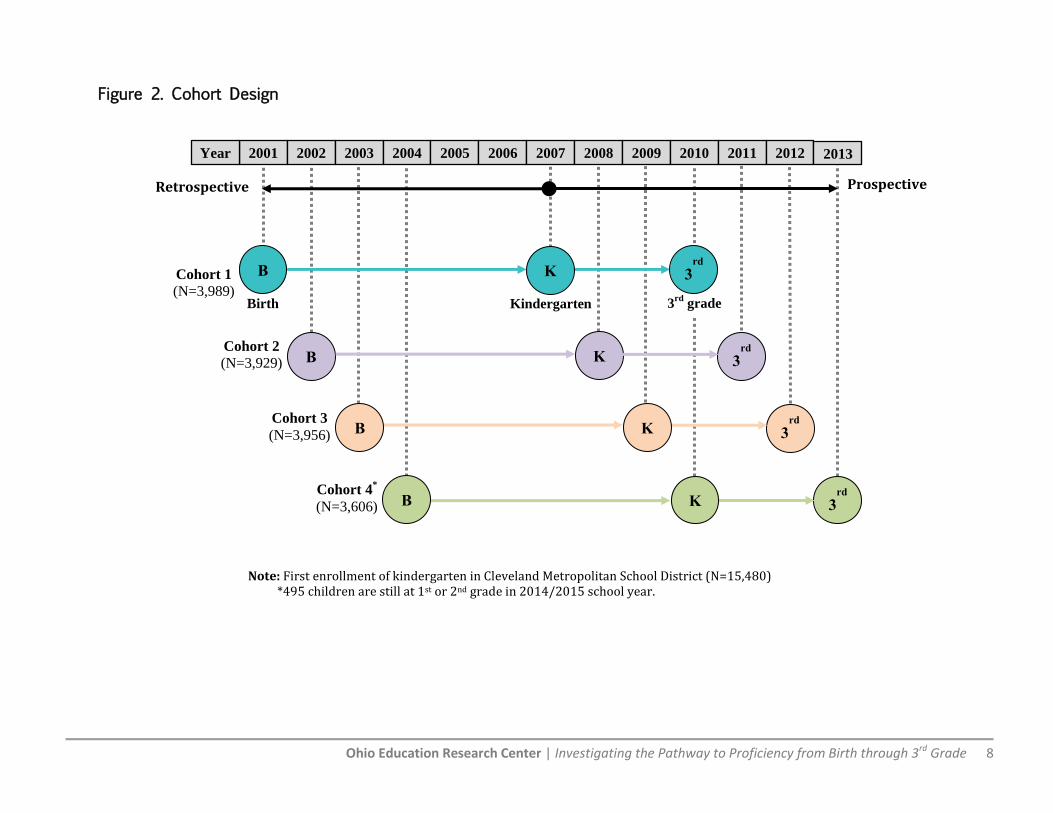
This study primarily linked three data sources containing various records of children from birth to
3rd grade (See Figure 3 & 4).
ChildHood Integrated Longitudinal Data (CHILD) System: County-Level Individual
Data
The CHILD system includes administrative and service records from Cleveland and Cuyahoga
County beginning with the 1992 Cuyahoga County birth cohort. The CHILD system uses
probabilistic matching techniques to link individual level records across time and systems. In 2013,
the CHILD system contained records for over 400,000 children (See Figure 3).
Education Management Information System (EMIS): State-Level Individual Data
The EMIS contains statewide data on primary and secondary education, including demographic
information, attendance, course information, financial data, and test results (education.ohio.gov).
By using State Student Identifiers (SSIDs), records from the CHILD system were matched to records
from the EMIS. For example, by linking the CHILD and EMIS systems, we can produce a complete
record for a child who attended CMSD kindergarten, but transferred to a school in another district
by 3rd grade.
Northeast Ohio Community and Neighborhood Data for Organizing (NEO CANDO)
and American Community Survey (ACS): Neighborhood-Level Data
The NEO CANDO is a publicly accessible social and economic data system for the entire 17 county
Northeast Ohio region as well as for specific neighborhoods within the region (neocando.case.edu).
In this study, the monthly addresses retrieved from the CHILD system were geocoded using 2000
Census tracts. The census tracts at the time of first enrollment in kindergarten and 3rd grade were
linked to the data from NEO CANDO. Neighborhood poverty rates were estimated using Census
tracts from ACS 2009 5-year estimates.
Ohio Education Research Center | Investigating the Pathway to Proficiency from Birth through 3rd Grade 10
ID6
ID5 ID4
ID3
ID2 ID1
Abuse/neglect reports* Foster care*
Home visiting* Child care* Universal pre-kindergarten* Special needs child care Early childhood mental health
Attendance* KRA-L* Proficiency test* Disability* Graduation test
Medicaid* SNAP* TANF*
Infant mortality Elevated Blood Lead
Teen births* Mother’s education* Birth weight*
Public Assist
Public School
ChildHood Integrated Longitudinal Data
(CHILD) System
*Data for this project
Figure 3. The CHILD System
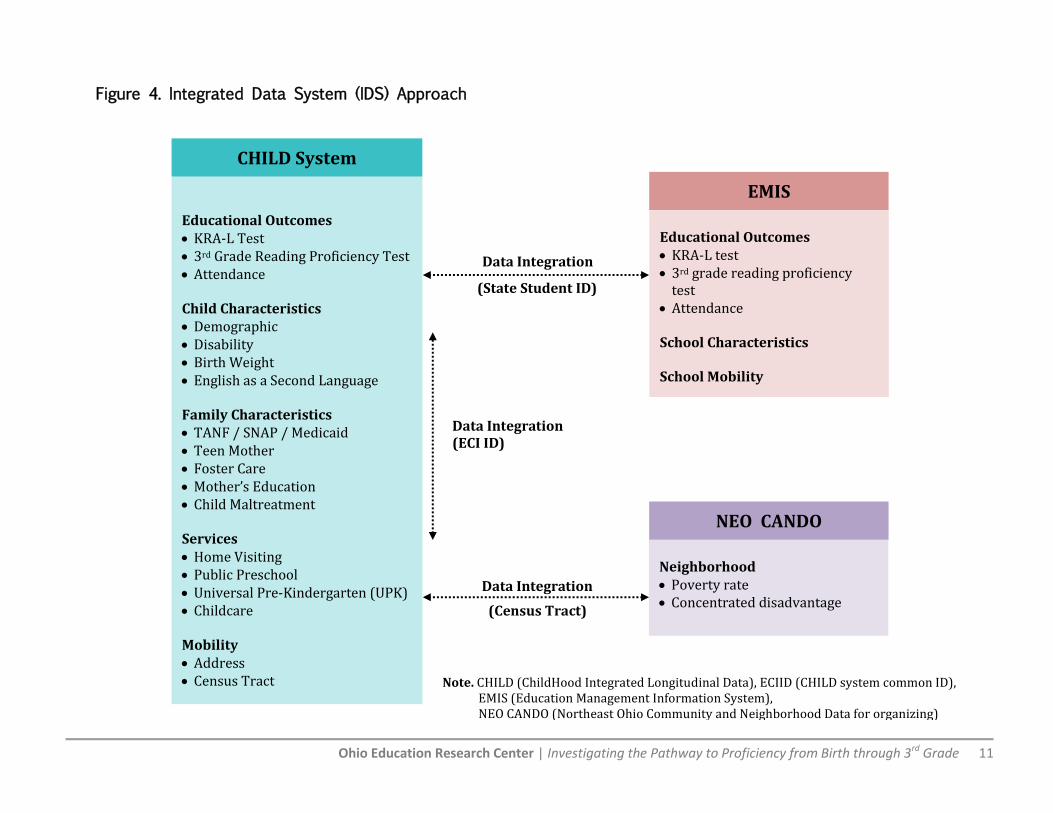
Ohio Education Research Center | Investigating the Pathway to Proficiency from Birth through 3rd Grade 11
Neighborhood Poverty rate Concentrated disadvantage
Educational Outcomes KRA-L Test 3rd Grade Reading Proficiency Test Attendance Child Characteristics Demographic Disability Birth Weight English as a Second Language Family Characteristics TANF / SNAP / Medicaid Teen Mother Foster Care Mother’s Education Child Maltreatment Services Home Visiting Public Preschool Universal Pre-Kindergarten (UPK) Childcare Mobility Address Census Tract
EMIS
Educational Outcomes KRA-L test 3rd grade reading proficiency
test Attendance School Characteristics School Mobility
NEO CANDO
Data Integration
(State Student ID)
Data Integration
(Census Tract)
Data Integration (ECI ID)
Note. CHILD (ChildHood Integrated Longitudinal Data), ECIID (CHILD system common ID), EMIS (Education Management Information System), NEO CANDO (Northeast Ohio Community and Neighborhood Data for organizing)
Figure 4. Integrated Data System (IDS) Approach
CHILD System
Ohio Education Research Center | Investigating the Pathway to Proficiency from Birth through 3rd Grade 12
Measures
The variables in this study were divided into two categories: (1) educational outcomes as
dependent variables, and (2) a set of independent variables. The educational outcomes included the
KRA-L score and the likelihood of passing the Ohio Achievement Assessments (OAA) 3rd grade
reading proficiency test (See Table 1).
Dependent Variables
KRA-L. The KRA-L assessment, which was developed by the Ohio Department of Education (ODE),
is a brief tool to help teachers identify early reading skills. Ohio law states that the KRA-L must be
administered no sooner than four weeks prior to the start of school, but not later than October 1
(education.ohio.gov). School administrators must report individual student composite scores for
KRA-L via the EMIS and maintain individual score sheets with the child's records. This assessment
not only evaluates skill areas important to becoming a successful reader but also helps teachers
plan for lessons that encourage reading (education.ohio.gov). KRA-L scores range from 0-29 and
are divided into three bands: Band 1 (0-13: Assess broadly for intense instruction), Band 2 (14-23:
Access for targeted instruction), and Band 3 (24-29: Assess for enriched instruction)
(education.ohio.gov).
OAA 3rd grade reading proficiency test. As a part of OAA, the 3rd grade reading proficiency test is
administrated in the fall (October of the school year) (education.ohio.gov). Children who do not
pass the test in the fall (i.e., score below 400) need to take the test again the following spring. The
student’s highest score is selected and these score is calculated as pass or fail. In this study, if a
student repeated the 3rd grade and therefore had multiple OAA scores, we selected the highest
score from their first year of 3rd grade.
Independent Variables
Using an ecological perspective, independent variables were divided into multiple blocks.
Child’s characteristics. Child characteristics were primarily obtained from school records (i.e.,
CMSD & EMIS) and birth certificates. Child age was calculated at the first kindergarten entry and 3rd
grade enrollment. Based on the racial/ethnic distribution of the sample, race/ethnicity was divided
into three categories: African-Americans, Hispanics, and Whites/others. Gender and English as a
second language came from the school records and were dichotomized. Birth weights were
obtained from the birth certificates.
Family characteristics. Family characteristics were mainly collected from birth certificates and
records maintained by the Cuyahoga County Division of Child and Family Services (DCFS).
Indicators of economic difficulty, child maltreatment, and foster care were measured at two time
points: (1) between birth and kindergarten, and (2) between birth and 3rd grade. To measure the
length of time spent living in conditions of economic difficulty, the total numbers of months a child
Ohio Education Research Center | Investigating the Pathway to Proficiency from Birth through 3rd Grade 13
lived in a family receiving Supplemental Nutrition Assistance Program (SNAP) benefits and/or
Temporary Assistance for Needy Families (TANF) were summed3.
Home visiting services: Birth to Age 3. Three types of publicly-funded home visiting services were
explored. Early intervention involves screening and services for children from birth to age three
with identified special needs (federally-funded under Part C of the Individuals with Disabilities Act
of 2004). Ongoing home visiting is designed to provide parents with child development knowledge
and parenting support, early detection of developmental delays and health issues, prevent child
abuse and neglect, and increase children’s school readiness. This state-funded program is available
to first time parents who have a child less than six months of age or who are expecting their first
child and living below 200% of the Federal Poverty Line (FPL). The program has been expanded to
families with older children using county funding. The newborn home visit is a single in-home visit
by a registered nurse to first time and teen mothers under 200% of the FPL. The visit is voluntary
and includes an assessment of the mother’s physical and mental health, a physical assessment of
the infant, the provision of general information regarding infant health and development and
expectations during the postpartum period, a general assessment of the family’s overall capacity
and needs to care for their infant, and, if appropriate, referral to additional services.
Early childhood services: Age 3 to Kindergarten4. CMSD and Cuyahoga County offer several types of
early childhood educational services. This study includes family child care, center-based child care,
Head Start, CMSD public preschool, and Universal Pre-K (UPK). Family child care is a home-based
service where a caregiver provides child care in his or her home. Private center-based child care is
care provided outside the family home by an individual who is not the child’s primary caregiver.
Head Start is a federal program that provides comprehensive early childhood education in
conjunction with nutrition, health, social services, mental health and disabilities, and parent
involvement for children and families. CMSD preschool seeks to create a stimulating, child centered
environment with developmentally appropriate teaching strategies in a center-based setting. UPK
is high quality early care and education that can be provided in public preschools, Head Start
programs, community child care centers, and family child care homes. We explored receipt of these
services from age three to kindergarten entry.
School experience: Kindergarten to 3rd grade. Overall attendance rates in kindergarten were
calculated as the percent of enrolled days that the child was in school. This variable was coded as
one if the child was present for 89% more of the enrolled days. Disability status was determined
from school records in kindergarten through 3rd grade. Lastly, whether a child attended the same
school for kindergarten and 3rd grade was noted.
Residential mobility: Birth to 3rd grade. The CHILD system contains monthly addresses of children
beginning at birth. To measure the frequency of housing mobility, the number of changes in
3 If the sample received SNAP and TANF together within the same month, it was regarded as one month. 4 We did not include early childhood educational service receipt before age three because mother’s employment was an eligibility requirement. Because of the pattern of receiving these services, these services were dichotomized by six months usage.
Ohio Education Research Center | Investigating the Pathway to Proficiency from Birth through 3rd Grade 14
monthly addresses between birth and kindergarten and between birth and 3rd grade were
calculated.
Neighborhood characteristic: Kindergarten and 3rd grade. Neighborhood (Census tract)-level
poverty rates were measured at kindergarten and 3rd grade entry. The neighborhood-level poverty
rates were originally obtained from American Community Survey 2009 5-year estimates
(www.census.gov).
Ohio Education Research Center | Investigating the Pathway to Proficiency from Birth through 3rd Grade 15
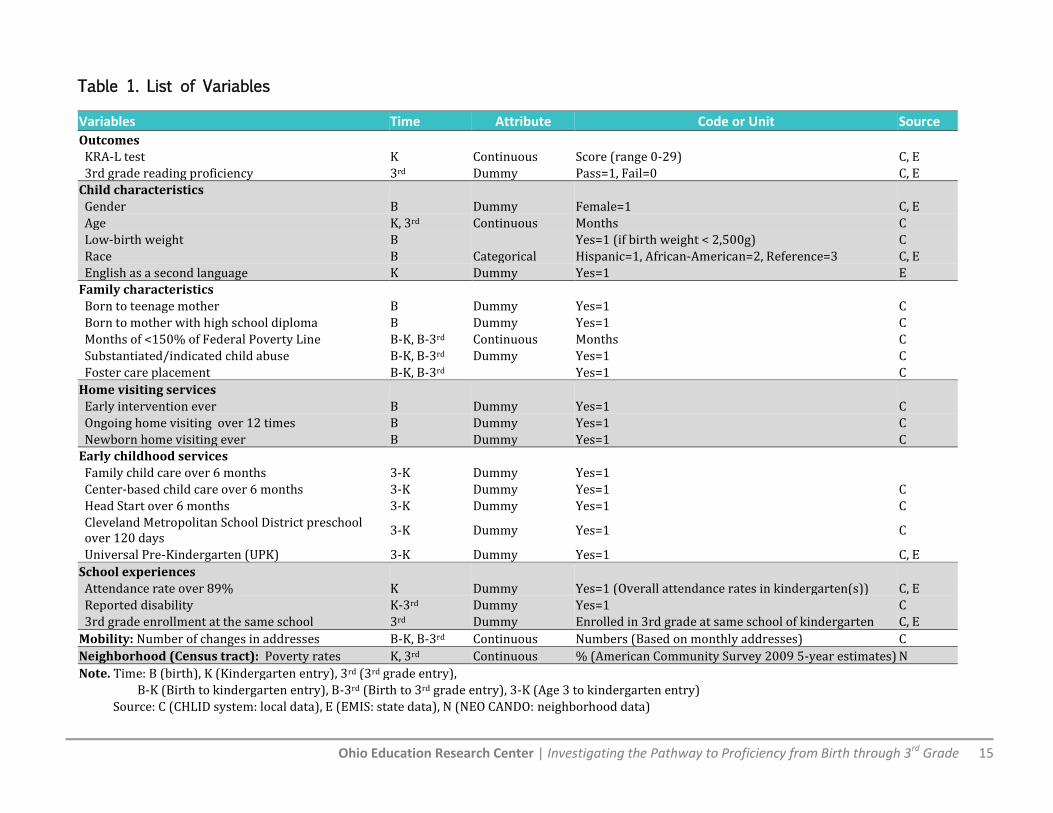
Table 1. List of Variables
Variables Time Attribute Code or Unit Source
Outcomes KRA-L test K Continuous Score (range 0-29) C, E
3rd grade reading proficiency 3rd Dummy Pass=1, Fail=0 C, E
Child characteristics
Gender B Dummy Female=1 C, E
Age K, 3rd Continuous Months C
Low-birth weight B
Yes=1 (if birth weight < 2,500g) C
Race B Categorical Hispanic=1, African-American=2, Reference=3 C, E
English as a second language K Dummy Yes=1 E
Family characteristics
Born to teenage mother B Dummy Yes=1 C
Born to mother with high school diploma B Dummy Yes=1 C
Months of <150% of Federal Poverty Line B-K, B-3rd Continuous Months C
Substantiated/indicated child abuse B-K, B-3rd Dummy Yes=1 C
Foster care placement B-K, B-3rd
Yes=1 C
Home visiting services
Early intervention ever B Dummy Yes=1 C
Ongoing home visiting over 12 times B Dummy Yes=1 C
Newborn home visiting ever B Dummy Yes=1 C
Early childhood services
Family child care over 6 months 3-K Dummy Yes=1
Center-based child care over 6 months 3-K Dummy Yes=1 C
Head Start over 6 months 3-K Dummy Yes=1 C Cleveland Metropolitan School District preschool over 120 days
3-K Dummy Yes=1 C
Universal Pre-Kindergarten (UPK) 3-K Dummy Yes=1 C, E
School experiences
Attendance rate over 89% K Dummy Yes=1 (Overall attendance rates in kindergarten(s)) C, E
Reported disability K-3rd Dummy Yes=1 C
3rd grade enrollment at the same school 3rd Dummy Enrolled in 3rd grade at same school of kindergarten C, E
Mobility: Number of changes in addresses B-K, B-3rd Continuous Numbers (Based on monthly addresses) C
Neighborhood (Census tract): Poverty rates K, 3rd Continuous % (American Community Survey 2009 5-year estimates) N
Note. Time: B (birth), K (Kindergarten entry), 3rd (3rd grade entry),
B-K (Birth to kindergarten entry), B-3rd (Birth to 3rd grade entry), 3-K (Age 3 to kindergarten entry)
Source: C (CHLID system: local data), E (EMIS: state data), N (NEO CANDO: neighborhood data)
Ohio Education Research Center | Investigating the Pathway to Proficiency from Birth through 3rd Grade 16
Analytical Model
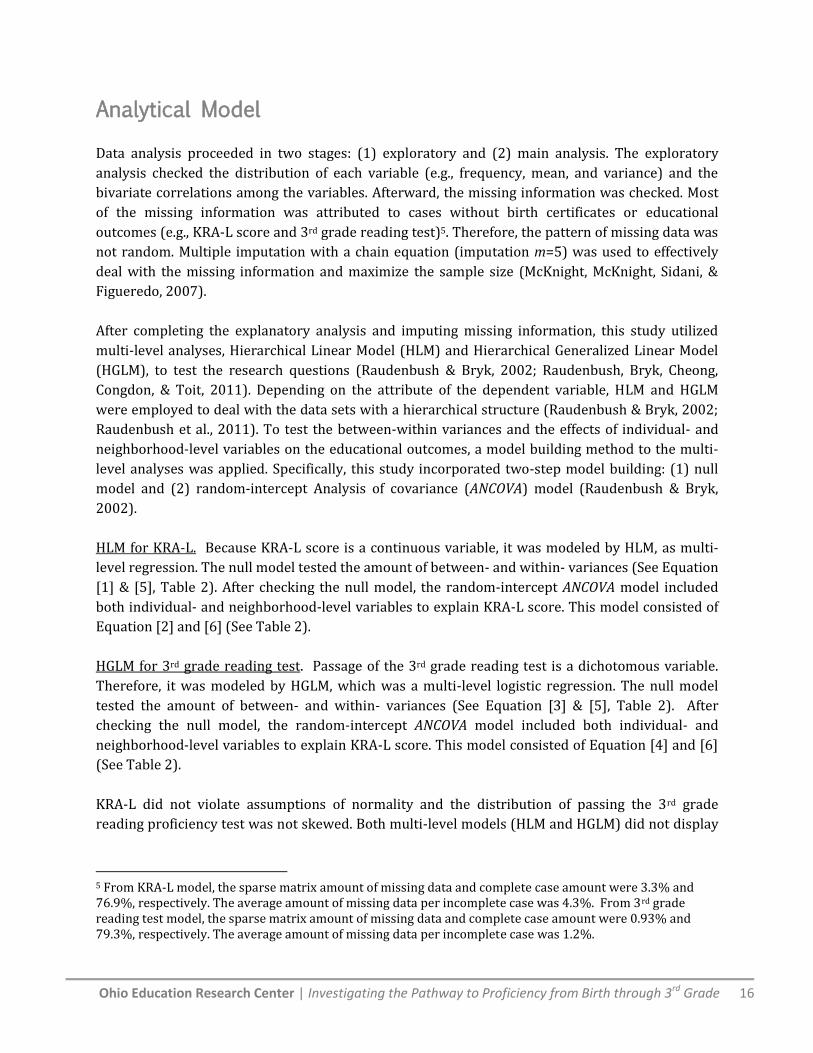
Data analysis proceeded in two stages: (1) exploratory and (2) main analysis. The exploratory
analysis checked the distribution of each variable (e.g., frequency, mean, and variance) and the
bivariate correlations among the variables. Afterward, the missing information was checked. Most
of the missing information was attributed to cases without birth certificates or educational
outcomes (e.g., KRA-L score and 3rd grade reading test)5. Therefore, the pattern of missing data was
not random. Multiple imputation with a chain equation (imputation m=5) was used to effectively
deal with the missing information and maximize the sample size (McKnight, McKnight, Sidani, &
Figueredo, 2007).
After completing the explanatory analysis and imputing missing information, this study utilized
multi-level analyses, Hierarchical Linear Model (HLM) and Hierarchical Generalized Linear Model
(HGLM), to test the research questions (Raudenbush & Bryk, 2002; Raudenbush, Bryk, Cheong,
Congdon, & Toit, 2011). Depending on the attribute of the dependent variable, HLM and HGLM
were employed to deal with the data sets with a hierarchical structure (Raudenbush & Bryk, 2002;
Raudenbush et al., 2011). To test the between-within variances and the effects of individual- and
neighborhood-level variables on the educational outcomes, a model building method to the multi-
level analyses was applied. Specifically, this study incorporated two-step model building: (1) null
model and (2) random-intercept Analysis of covariance (ANCOVA) model (Raudenbush & Bryk,
2002).
HLM for KRA-L. Because KRA-L score is a continuous variable, it was modeled by HLM, as multi-
level regression. The null model tested the amount of between- and within- variances (See Equation
[1] & [5], Table 2). After checking the null model, the random-intercept ANCOVA model included
both individual- and neighborhood-level variables to explain KRA-L score. This model consisted of
Equation [2] and [6] (See Table 2).
HGLM for 3rd grade reading test. Passage of the 3rd grade reading test is a dichotomous variable.
Therefore, it was modeled by HGLM, which was a multi-level logistic regression. The null model
tested the amount of between- and within- variances (See Equation [3] & [5], Table 2). After
checking the null model, the random-intercept ANCOVA model included both individual- and
neighborhood-level variables to explain KRA-L score. This model consisted of Equation [4] and [6]
(See Table 2).
KRA-L did not violate assumptions of normality and the distribution of passing the 3rd grade
reading proficiency test was not skewed. Both multi-level models (HLM and HGLM) did not display
5 From KRA-L model, the sparse matrix amount of missing data and complete case amount were 3.3% and 76.9%, respectively. The average amount of missing data per incomplete case was 4.3%. From 3rd grade reading test model, the sparse matrix amount of missing data and complete case amount were 0.93% and 79.3%, respectively. The average amount of missing data per incomplete case was 1.2%.
Ohio Education Research Center | Investigating the Pathway to Proficiency from Birth through 3rd Grade 17
multi-collinearity. This study used Statistical Analysis System (SAS) 9.2 for data management,
STATA 12.0 for statistical analysis, and ArgGIS 10.0 for geocoding and mapping.
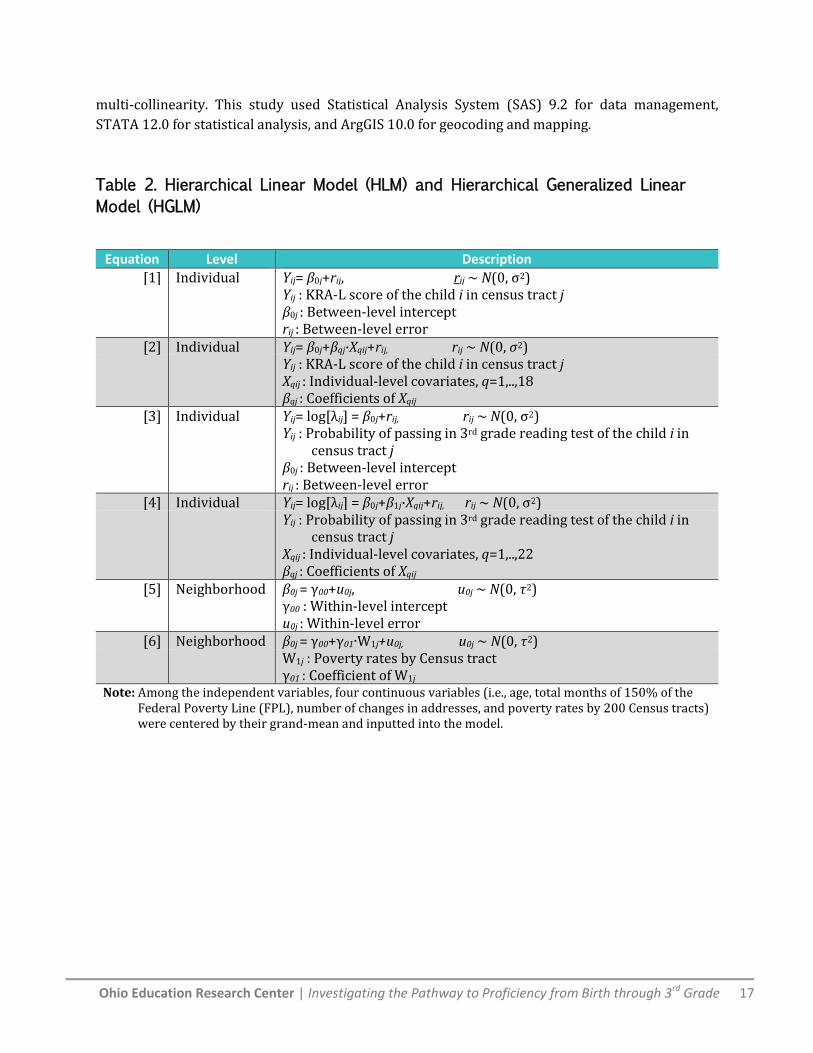
Table 2. Hierarchical Linear Model (HLM) and Hierarchical Generalized Linear
Model (HGLM)
Equation Level Description
[1] Individual Yij= β0j+rij, rij ~ N(0, σ2) Yij : KRA-L score of the child i in census tract j
β0j : Between-level intercept rij : Between-level error
[2] Individual Yij= β0j+βqj∙Xqij+rij, rij ~ N(0, σ2) Yij : KRA-L score of the child i in census tract j
Xqij : Individual-level covariates, q=1,..,18 βqj : Coefficients of Xqij
[3] Individual Yij= log[λij] = β0j+rij, rij ~ N(0, σ2) Yij : Probability of passing in 3rd grade reading test of the child i in
census tract j β0j : Between-level intercept rij : Between-level error
[4] Individual Yij= log[λij] = β0j+β1j∙Xqij+rij, rij ~ N(0, σ2) Yij : Probability of passing in 3rd grade reading test of the child i in
census tract j Xqij : Individual-level covariates, q=1,..,22 βqj : Coefficients of Xqij
[5] Neighborhood β0j = γ00+u0j, u0j ~ N(0, τ2) γ00 : Within-level intercept
u0j : Within-level error [6] Neighborhood β0j = γ00+γ01∙W1j+u0j, u0j ~ N(0, τ2)
W1j : Poverty rates by Census tract γ01 : Coefficient of W1j
Note: Among the independent variables, four continuous variables (i.e., age, total months of 150% of the Federal Poverty Line (FPL), number of changes in addresses, and poverty rates by 200 Census tracts) were centered by their grand-mean and inputted into the model.
Ohio Education Research Center | Investigating the Pathway to Proficiency from Birth through 3rd Grade 18
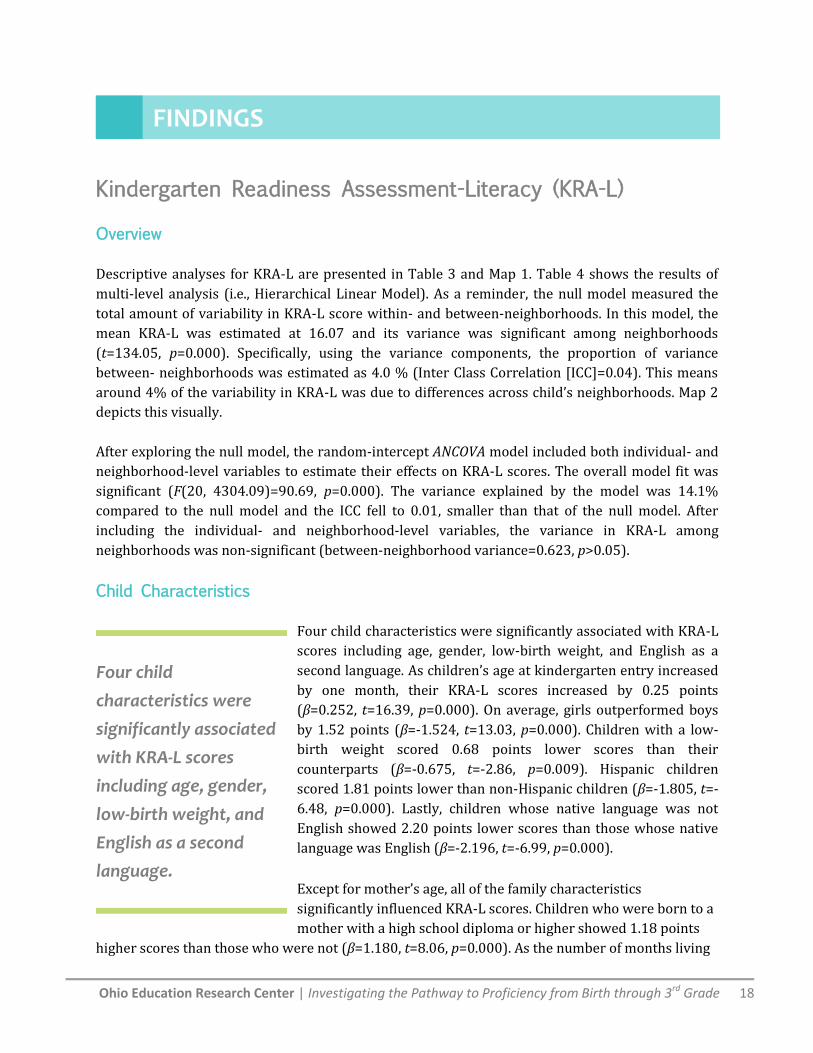
Kindergarten Readiness Assessment-Literacy (KRA-L)
Overview
Descriptive analyses for KRA-L are presented in Table 3 and Map 1. Table 4 shows the results of
multi-level analysis (i.e., Hierarchical Linear Model). As a reminder, the null model measured the
total amount of variability in KRA-L score within- and between-neighborhoods. In this model, the
mean KRA-L was estimated at 16.07 and its variance was significant among neighborhoods
(t=134.05, p=0.000). Specifically, using the variance components, the proportion of variance
between- neighborhoods was estimated as 4.0 % (Inter Class Correlation [ICC]=0.04). This means
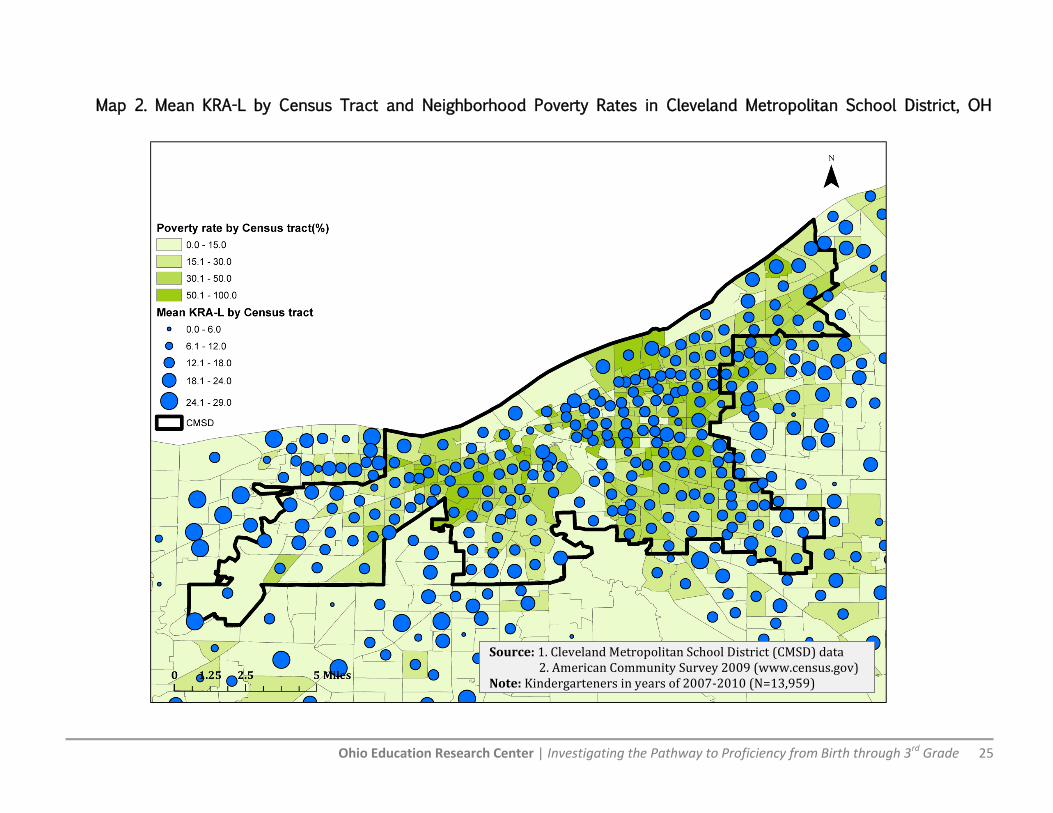
around 4% of the variability in KRA-L was due to differences across child’s neighborhoods. Map 2
depicts this visually.
After exploring the null model, the random-intercept ANCOVA model included both individual- and
neighborhood-level variables to estimate their effects on KRA-L scores. The overall model fit was
significant (F(20, 4304.09)=90.69, p=0.000). The variance explained by the model was 14.1%
compared to the null model and the ICC fell to 0.01, smaller than that of the null model. After
including the individual- and neighborhood-level variables, the variance in KRA-L among
neighborhoods was non-significant (between-neighborhood variance=0.623, p>0.05).
Child Characteristics
Four child characteristics were significantly associated with KRA-L
scores including age, gender, low-birth weight, and English as a
second language. As children’s age at kindergarten entry increased
by one month, their KRA-L scores increased by 0.25 points
(β=0.252, t=16.39, p=0.000). On average, girls outperformed boys
by 1.52 points (β=-1.524, t=13.03, p=0.000). Children with a low-
birth weight scored 0.68 points lower scores than their
counterparts (β=-0.675, t=-2.86, p=0.009). Hispanic children
scored 1.81 points lower than non-Hispanic children (β=-1.805, t=-
6.48, p=0.000). Lastly, children whose native language was not
English showed 2.20 points lower scores than those whose native
language was English (β=-2.196, t=-6.99, p=0.000).
Except for mother’s age, all of the family characteristics
significantly influenced KRA-L scores. Children who were born to a
mother with a high school diploma or higher showed 1.18 points
higher scores than those who were not (β=1.180, t=8.06, p=0.000). As the number of months living
FINDINGS
Four child
characteristics were
significantly associated
with KRA-L scores
including age, gender,
low-birth weight, and
English as a second
language.
Ohio Education Research Center | Investigating the Pathway to Proficiency from Birth through 3rd Grade 19
under 150% of the FBL increased by ten months, children’s KRA-L score decreased by 0.24 points
(β=-0.024, t=-7.55, p=0.000). Children who had ever experienced substantiated or indicated child
maltreatment showed 0.65 points lower scores than those who had not (β=-0.648, t=-3.38,
p=0.001). However, children who had ever been placed in foster care showed 0.84 points higher
scores then those who had not, after controlling for child maltreatment and other risk factors
(β=0.842, t=2.81, p=0.005).
Home Visiting Services
All of the home visiting services were significantly associated with KRA-L scores. Children who had
ever received early intervention showed 2.89 points lower scores than those who had not (β=-
2.890, t=-13.72, p=0.000). The negative association between early intervention receipt and KRA-L is
expected because the home visiting program is for children with disabilities and developmental
problems. Children who received at least 12 ongoing home visits scored 0.31 points lower scores on
KRA-L than those who had not (β=-0.310, t=-2.04, p=0.042) 6. Children who received newborn home
visit showed 0.90 points higher scores than those who had not (β=0.898, t=6.16, p=0.000).
Early Childhood Services
Except for family child care, all of the early childhood services were positively associated with KRA-
L scores. Children who attended center-based childcare for more than 6 months showed 1.56 points
higher scores than those who did not (β=1.563, t=10.35, p=0.000).
Children who participated in Head Start for at least 6 months had 1.23 points higher scores than
those who did not (β=1.233, t=4.6, p=0.000). Lastly, attending CMSD preschool for more than 120
days or UPK for more than 6 months was associated with a 2.97 point increase in KRA-L (β=2.971,
t=18.77, p=0.000).
Mobility and Neighborhood
The association between residential mobility and KRA-L was tested by measuring the child’s
monthly addresses from birth to kindergarten. Every change of child’s address was associated with
a 0.13 point decrease in KRA-L score (β=-0.131, t=-4.80, p=0.000). Finally, the neighborhood-level
6 This program primarily serves high risk families.
Except for family child care, all of the early childhood
services were positively associated with KRA-L scores.
Ohio Education Research Center | Investigating the Pathway to Proficiency from Birth through 3rd Grade 20
poverty rates were negatively associated with KRA-L scores (β=-0.019, t=-4.16, p=0.000; See Table
4 & Map 2).
Ohio Education Research Center | Investigating the Pathway to Proficiency from Birth through 3rd Grade 21
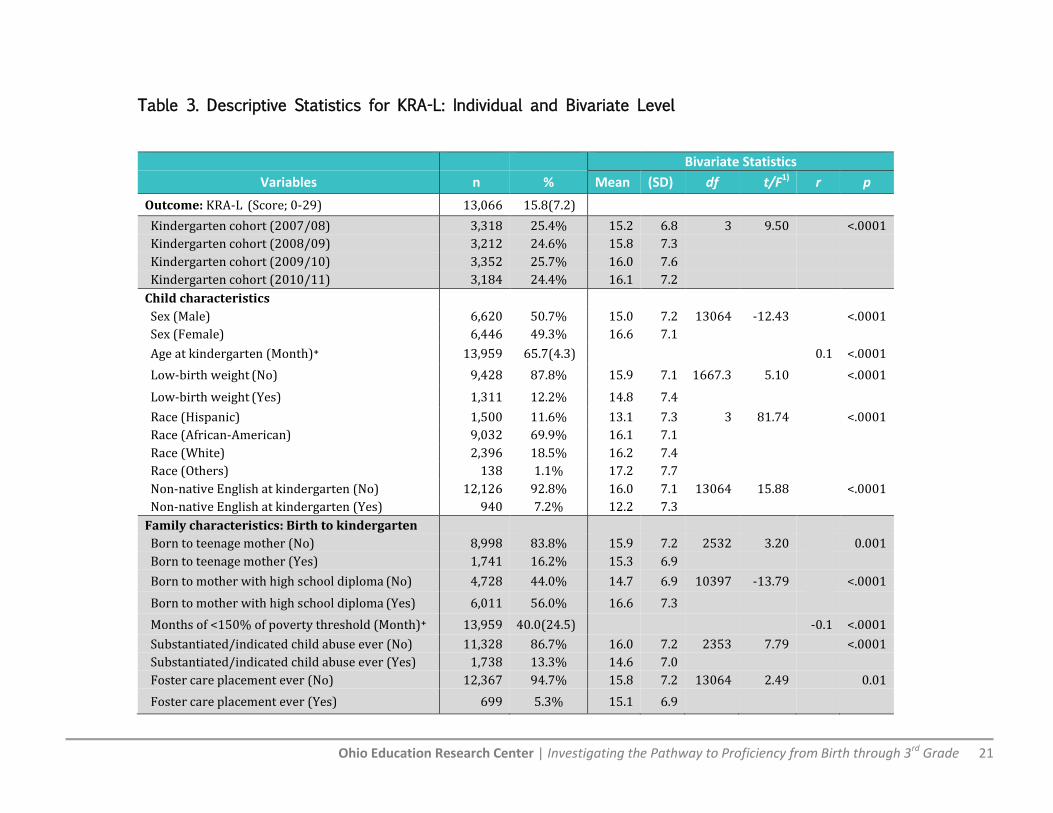
Table 3. Descriptive Statistics for KRA-L: Individual and Bivariate Level
Bivariate Statistics
Variables n % Mean (SD) df t/F1) r p
Outcome: KRA-L (Score; 0-29) 13,066 15.8(7.2)
Kindergarten cohort (2007/08) 3,318 25.4% 15.2 6.8 3 9.50
<.0001
Kindergarten cohort (2008/09) 3,212 24.6% 15.8 7.3
Kindergarten cohort (2009/10) 3,352 25.7% 16.0 7.6
Kindergarten cohort (2010/11) 3,184 24.4% 16.1 7.2
Child characteristics
Sex (Male) 6,620 50.7% 15.0 7.2 13064 -12.43
<.0001
Sex (Female) 6,446 49.3% 16.6 7.1
Age at kindergarten (Month)+ 13,959 65.7(4.3)
0.1 <.0001
Low-birth weight (No) 9,428 87.8% 15.9 7.1 1667.3 5.10
<.0001
Low-birth weight (Yes) 1,311 12.2% 14.8 7.4
Race (Hispanic) 1,500 11.6% 13.1 7.3 3 81.74
<.0001
Race (African-American) 9,032 69.9% 16.1 7.1
Race (White) 2,396 18.5% 16.2 7.4
Race (Others) 138 1.1% 17.2 7.7
Non-native English at kindergarten (No) 12,126 92.8% 16.0 7.1 13064 15.88
<.0001
Non-native English at kindergarten (Yes) 940 7.2% 12.2 7.3
Family characteristics: Birth to kindergarten
Born to teenage mother (No) 8,998 83.8% 15.9 7.2 2532 3.20
0.001
Born to teenage mother (Yes) 1,741 16.2% 15.3 6.9
Born to mother with high school diploma (No) 4,728 44.0% 14.7 6.9 10397 -13.79
<.0001
Born to mother with high school diploma (Yes) 6,011 56.0% 16.6 7.3
Months of <150% of poverty threshold (Month)+ 13,959 40.0(24.5)
-0.1 <.0001
Substantiated/indicated child abuse ever (No) 11,328 86.7% 16.0 7.2 2353 7.79
<.0001
Substantiated/indicated child abuse ever (Yes) 1,738 13.3% 14.6 7.0
Foster care placement ever (No) 12,367 94.7% 15.8 7.2 13064 2.49
0.01
Foster care placement ever (Yes) 699 5.3% 15.1 6.9
Ohio Education Research Center | Investigating the Pathway to Proficiency from Birth through 3rd Grade 22
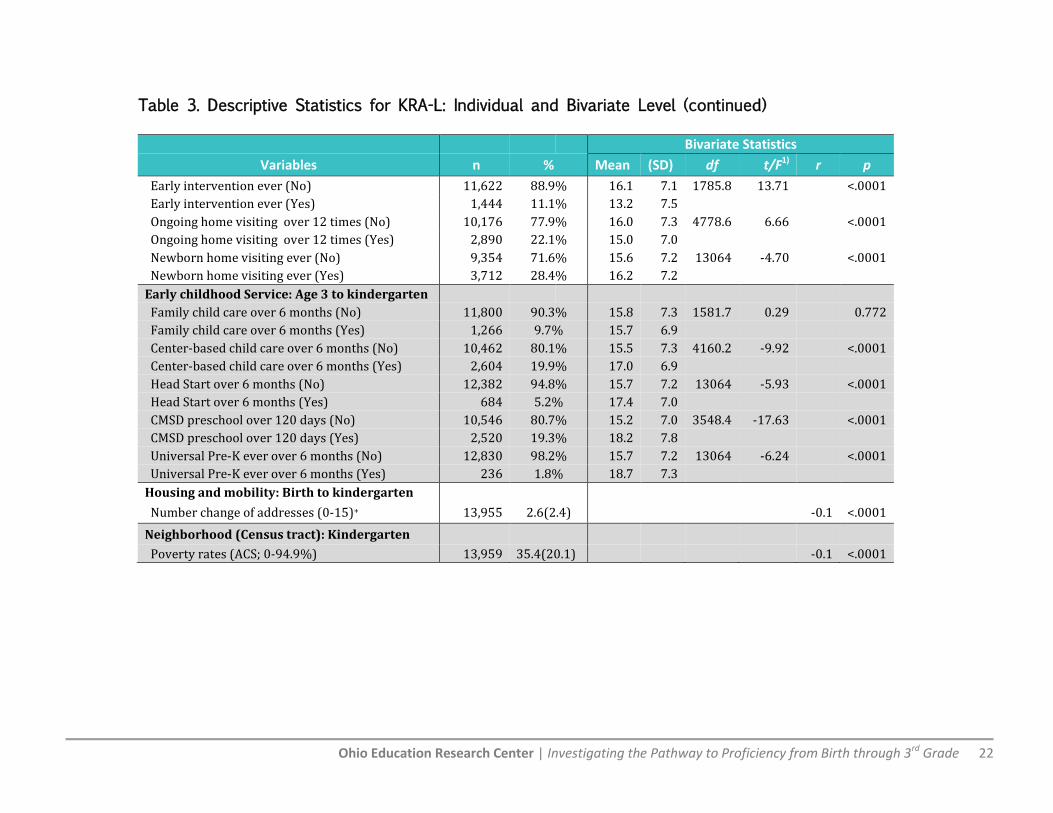
Table 3. Descriptive Statistics for KRA-L: Individual and Bivariate Level (continued)
Bivariate Statistics
Variables n % Mean (SD) df t/F1) r p
Early intervention ever (No) 11,622 88.9% 16.1 7.1 1785.8 13.71
<.0001
Early intervention ever (Yes) 1,444 11.1% 13.2 7.5
Ongoing home visiting over 12 times (No) 10,176 77.9% 16.0 7.3 4778.6 6.66
<.0001
Ongoing home visiting over 12 times (Yes) 2,890 22.1% 15.0 7.0
Newborn home visiting ever (No) 9,354 71.6% 15.6 7.2 13064 -4.70
<.0001
Newborn home visiting ever (Yes) 3,712 28.4% 16.2 7.2
Early childhood Service: Age 3 to kindergarten
Family child care over 6 months (No) 11,800 90.3% 15.8 7.3 1581.7 0.29
0.772
Family child care over 6 months (Yes) 1,266 9.7% 15.7 6.9
Center-based child care over 6 months (No) 10,462 80.1% 15.5 7.3 4160.2 -9.92
<.0001
Center-based child care over 6 months (Yes) 2,604 19.9% 17.0 6.9
Head Start over 6 months (No) 12,382 94.8% 15.7 7.2 13064 -5.93
<.0001
Head Start over 6 months (Yes) 684 5.2% 17.4 7.0
CMSD preschool over 120 days (No) 10,546 80.7% 15.2 7.0 3548.4 -17.63
<.0001
CMSD preschool over 120 days (Yes) 2,520 19.3% 18.2 7.8
Universal Pre-K ever over 6 months (No) 12,830 98.2% 15.7 7.2 13064 -6.24
<.0001
Universal Pre-K ever over 6 months (Yes) 236 1.8% 18.7 7.3
Housing and mobility: Birth to kindergarten
Number change of addresses (0-15)+ 13,955 2.6(2.4) -0.1 <.0001
Neighborhood (Census tract): Kindergarten
Poverty rates (ACS; 0-94.9%) 13,959 35.4(20.1) -0.1 <.0001
Ohio Education Research Center | Investigating the Pathway to Proficiency from Birth through 3rd Grade 23
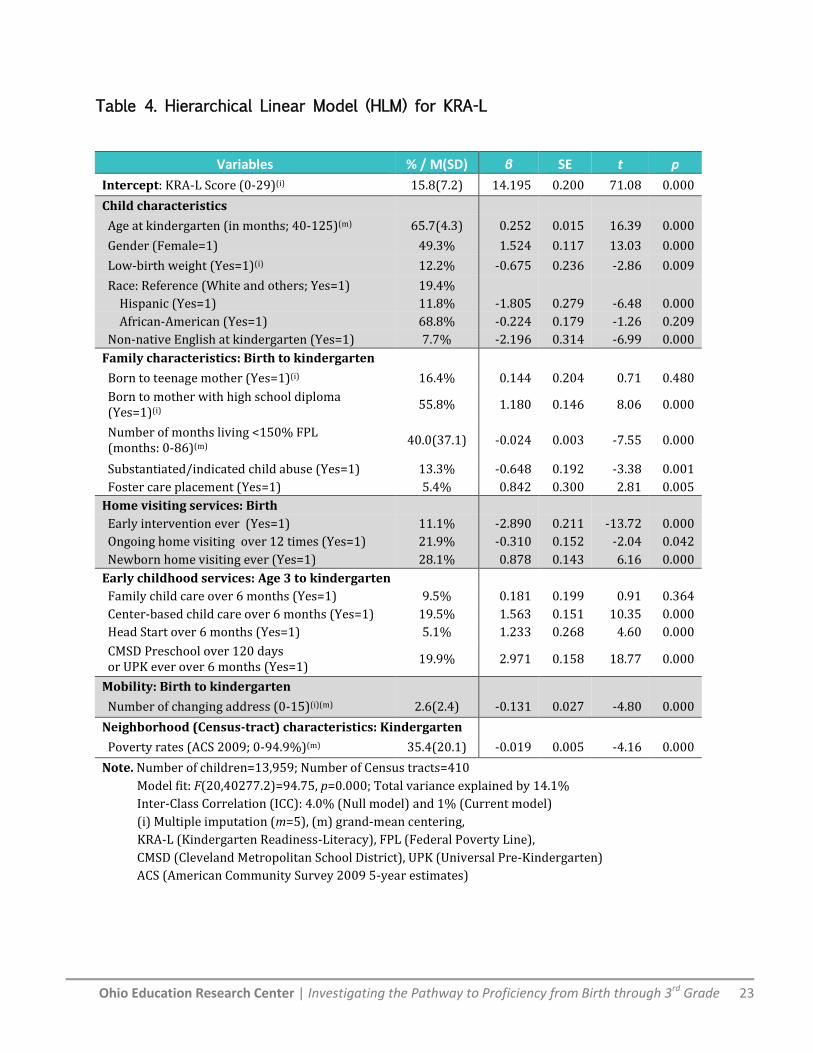
Table 4. Hierarchical Linear Model (HLM) for KRA-L
Variables % / M(SD) β SE t p
Intercept: KRA-L Score (0-29)(i) 15.8(7.2) 14.195 0.200 71.08 0.000
Child characteristics
Age at kindergarten (in months; 40-125)(m) 65.7(4.3) 0.252 0.015 16.39 0.000
Gender (Female=1) 49.3% 1.524 0.117 13.03 0.000
Low-birth weight (Yes=1)(i) 12.2% -0.675 0.236 -2.86 0.009
Race: Reference (White and others; Yes=1) 19.4%
Hispanic (Yes=1) 11.8% -1.805 0.279 -6.48 0.000
African-American (Yes=1) 68.8% -0.224 0.179 -1.26 0.209
Non-native English at kindergarten (Yes=1) 7.7% -2.196 0.314 -6.99 0.000
Family characteristics: Birth to kindergarten
Born to teenage mother (Yes=1)(i) 16.4% 0.144 0.204 0.71 0.480
Born to mother with high school diploma (Yes=1)(i)
55.8% 1.180 0.146 8.06 0.000
Number of months living <150% FPL (months: 0-86)(m)
40.0(37.1) -0.024 0.003 -7.55 0.000
Substantiated/indicated child abuse (Yes=1) 13.3% -0.648 0.192 -3.38 0.001
Foster care placement (Yes=1) 5.4% 0.842 0.300 2.81 0.005
Home visiting services: Birth
Early intervention ever (Yes=1) 11.1% -2.890 0.211 -13.72 0.000
Ongoing home visiting over 12 times (Yes=1) 21.9% -0.310 0.152 -2.04 0.042
Newborn home visiting ever (Yes=1) 28.1% 0.878 0.143 6.16 0.000
Early childhood services: Age 3 to kindergarten
Family child care over 6 months (Yes=1) 9.5% 0.181 0.199 0.91 0.364
Center-based child care over 6 months (Yes=1) 19.5% 1.563 0.151 10.35 0.000
Head Start over 6 months (Yes=1) 5.1% 1.233 0.268 4.60 0.000
CMSD Preschool over 120 days or UPK ever over 6 months (Yes=1)
19.9% 2.971 0.158 18.77 0.000
Mobility: Birth to kindergarten
Number of changing address (0-15)(i)(m) 2.6(2.4) -0.131 0.027 -4.80 0.000
Neighborhood (Census-tract) characteristics: Kindergarten
Poverty rates (ACS 2009; 0-94.9%)(m) 35.4(20.1) -0.019 0.005 -4.16 0.000
Note. Number of children=13,959; Number of Census tracts=410
Model fit: F(20,40277.2)=94.75, p=0.000; Total variance explained by 14.1%
Inter-Class Correlation (ICC): 4.0% (Null model) and 1% (Current model)
(i) Multiple imputation (m=5), (m) grand-mean centering,
KRA-L (Kindergarten Readiness-Literacy), FPL (Federal Poverty Line),
CMSD (Cleveland Metropolitan School District), UPK (Universal Pre-Kindergarten)
ACS (American Community Survey 2009 5-year estimates)
Ohio Education Research Center | Investigating the Pathway to Proficiency from Birth through 3rd Grade 24
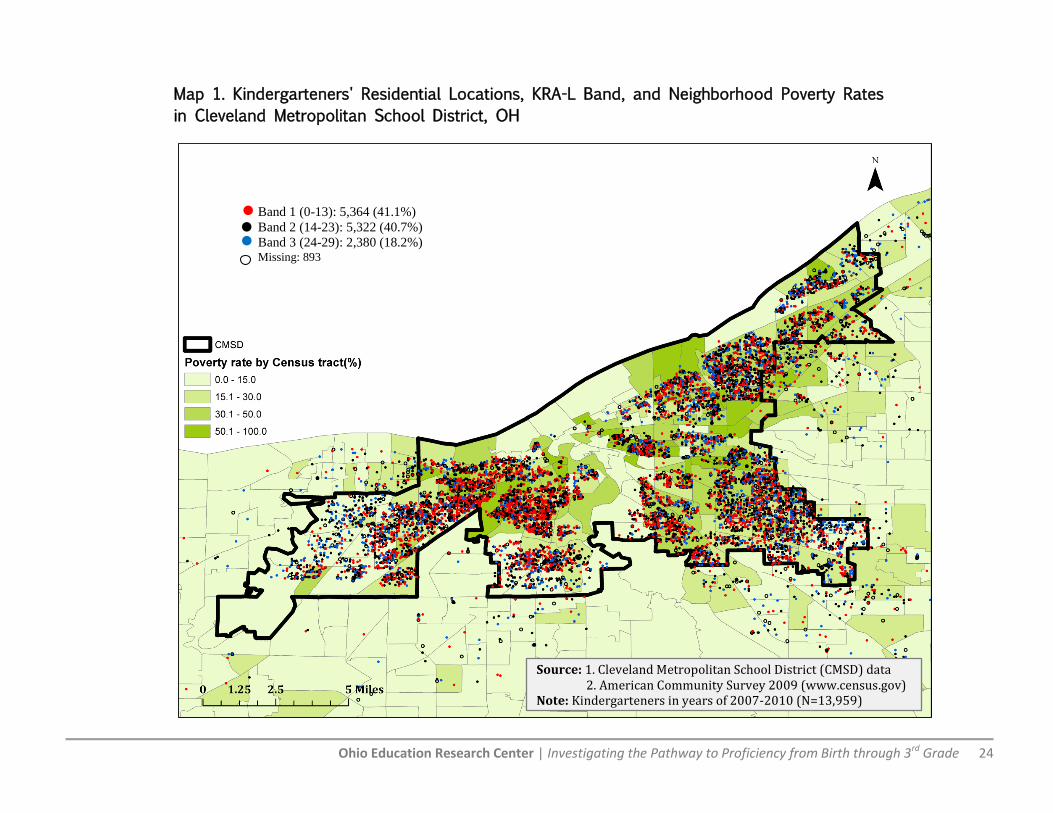
Map 1. Kindergarteners' Residential Locations, KRA-L Band, and Neighborhood Poverty Rates
in Cleveland Metropolitan School District, OH
Band 1 (0-13): 5,364 (41.1%)
Band 2 (14-23): 5,322 (40.7%)
Band 3 (24-29): 2,380 (18.2%) Missing: 893
Source: 1. Cleveland Metropolitan School District (CMSD) data 2. American Community Survey 2009 (www.census.gov) Note: Kindergarteners in years of 2007-2010 (N=13,959)
Ohio Education Research Center | Investigating the Pathway to Proficiency from Birth through 3rd Grade 25
Map 2. Mean KRA-L by Census Tract and Neighborhood Poverty Rates in Cleveland Metropolitan School District, OH
Source: 1. Cleveland Metropolitan School District (CMSD) data 2. American Community Survey 2009 (www.census.gov) Note: Kindergarteners in years of 2007-2010 (N=13,959)
Ohio Education Research Center | Investigating the Pathway to Proficiency from Birth through 3rd Grade 26
3rd Grade Reading Proficiency Test
Overview
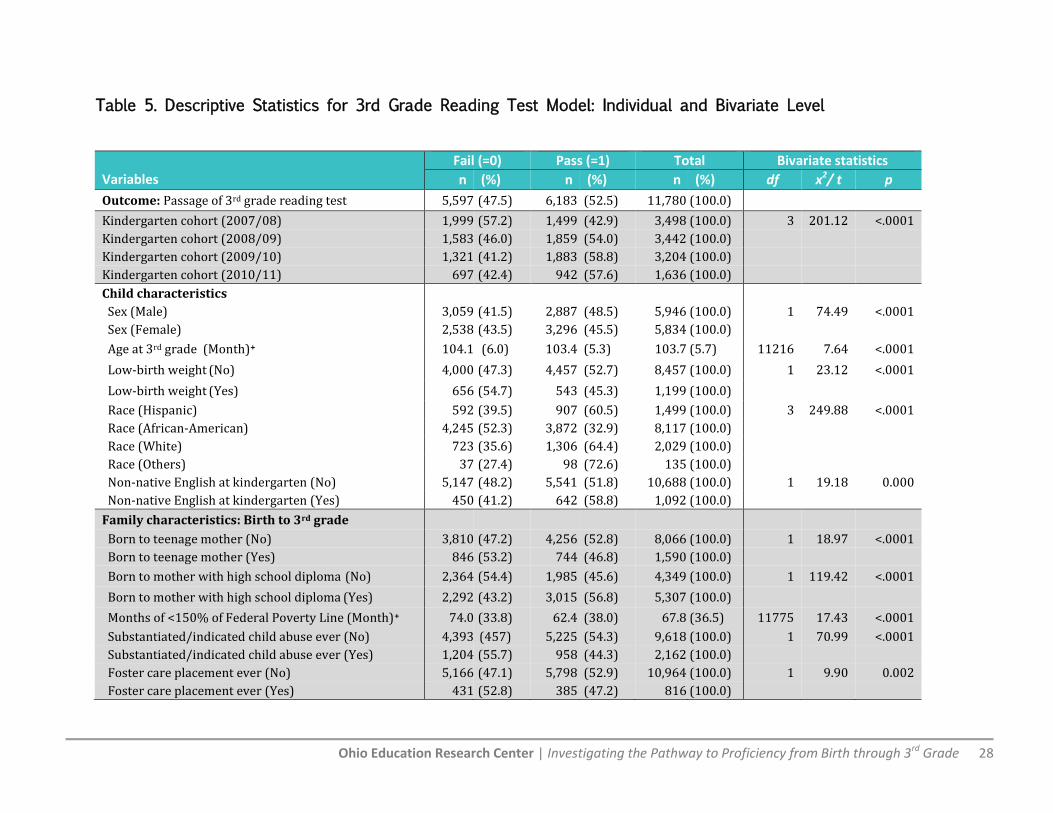
The descriptive statistics for variables in 3rd grade reading model are presented Table 5 and Map 3.
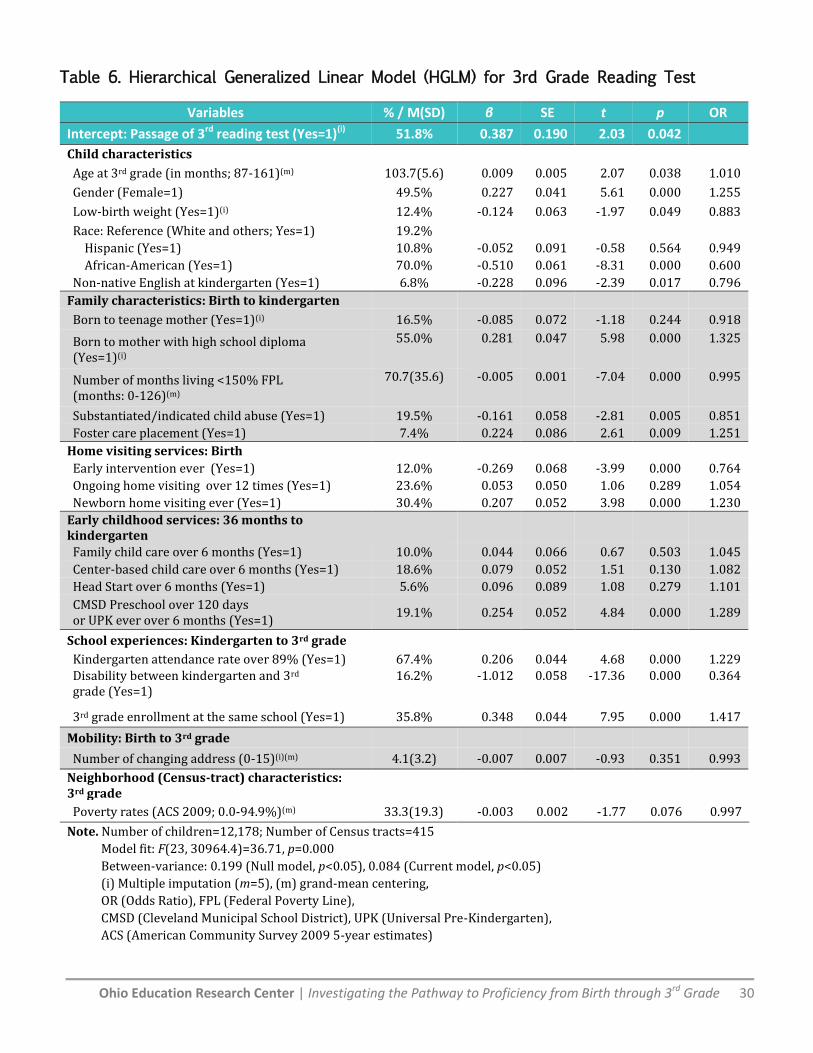
Multi-level logistical analyses (i.e., HGLM) are shown in Table 6. The null model evaluated the total
amount of variability in the likelihood of passing the 3rd grade reading test within- and between-
neighborhoods. There was significant variability in the likelihood of passing the 3rd grade reading
test among neighborhoods (Between-neighborhood variance=0.199, p<0.05). Map 4 shows
neighborhood differences in passage rates. After exploring the null model, the random-intercept
ANCOVA model included both individual- and neighborhood-level variables to explain the variance
in the possibility of passing the 3rd grade reading test. Even after including the individual- and
neighborhood-level variables, there was significant variance in the possibility of passing the 3rd
grade reading test among neighborhoods (Between-neighborhood variance=0.084, p<0.05). The
overall model fit was significant (F(23, 30964.4)=36.71, p=0.000).
Child Characteristics
There was a significant difference in the likelihood of passing the 3rd grade reading test by age,
gender, low-birth weight, and English as a second language. As children’s age in the 3rd grade
increased by one month, their possibility of passing the test increased by 1.01 % (exp(0.009)=1.010,
t=2.07, p=0.038). The possibility of passing the test among girls was 1.26 times higher than boys
(exp(0.227)=1.255, t=5.61, p=0.000). Children with a low-birth weight were 11.7% less likely to
pass the test than their counterparts (exp(-0.124)=0.883, t=-1.97, p=0.049). African-American
children were 40.0% less likely to pass the test than other ethnic groups (exp(-0.512)=0.600, t=-
8.31, p=0.000). Children whose native language was not English showed a 20.4% lower possibility
of passing the test than those whose native language was English (exp(-0.256)=0.796, t=-2.39,
p=0.017).
Family Characteristics
Among the family characteristics, mother’s educational
level and economic difficulty were associated with the
possibility of passing the 3rd grade reading test. Children
who were born to a mother with a high school diploma or
more were 1.33 times more likely to pass the test than
those who were not (exp(0.281)=1.325, t=5.98, p=0.000).
The number of months living under 150% of the FPL was
negatively associated with the possibility of passing the
test (exp(-0.005)=0.995, t=-5.98, p=0.000). For example, if
a child lived under 150% FPL for 36 months, his/her
Among the family
characteristics, mother’s
educational level and economic
difficulty were associated with
the possibility of passing the 3rd
grade reading test.
Ohio Education Research Center | Investigating the Pathway to Proficiency from Birth through 3rd Grade 27
possibility of passing the test was 16.5% lower than a child who did not (exp(-0.005X36
months)=0.835).
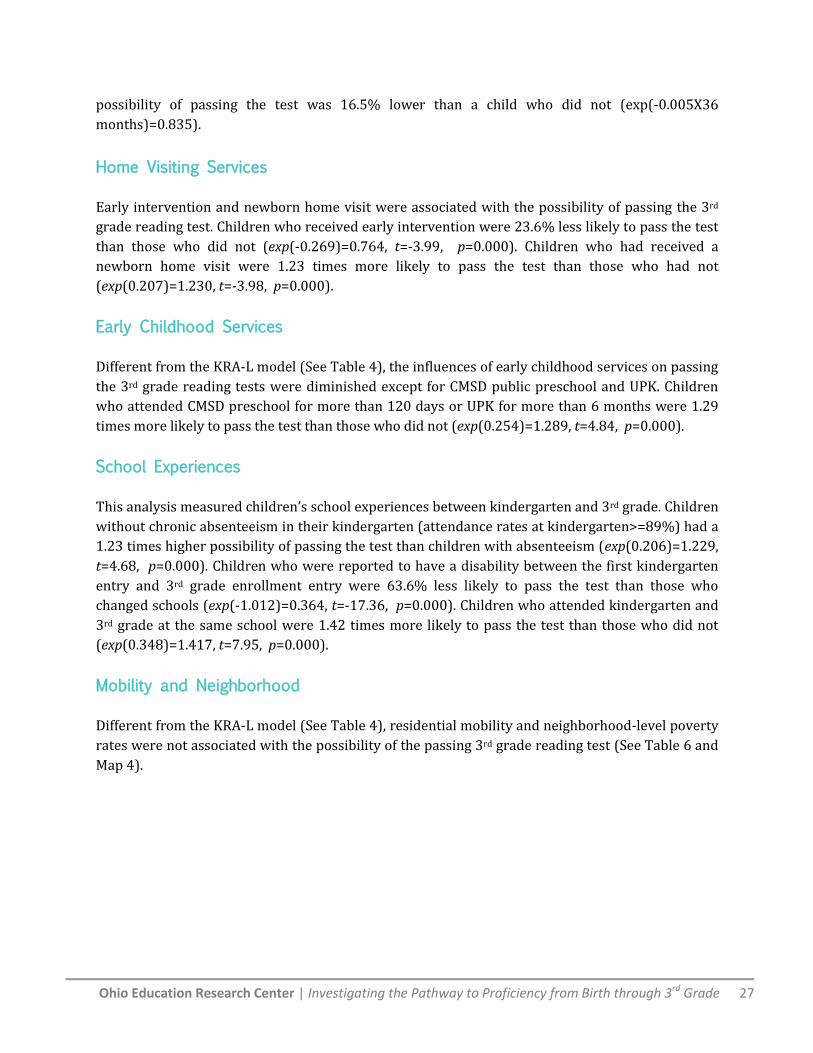
Home Visiting Services
Early intervention and newborn home visit were associated with the possibility of passing the 3rd
grade reading test. Children who received early intervention were 23.6% less likely to pass the test
than those who did not (exp(-0.269)=0.764, t=-3.99, p=0.000). Children who had received a
newborn home visit were 1.23 times more likely to pass the test than those who had not
(exp(0.207)=1.230, t=-3.98, p=0.000).
Early Childhood Services
Different from the KRA-L model (See Table 4), the influences of early childhood services on passing
the 3rd grade reading tests were diminished except for CMSD public preschool and UPK. Children
who attended CMSD preschool for more than 120 days or UPK for more than 6 months were 1.29
times more likely to pass the test than those who did not (exp(0.254)=1.289, t=4.84, p=0.000).
School Experiences
This analysis measured children’s school experiences between kindergarten and 3rd grade. Children
without chronic absenteeism in their kindergarten (attendance rates at kindergarten>=89%) had a
1.23 times higher possibility of passing the test than children with absenteeism (exp(0.206)=1.229,
t=4.68, p=0.000). Children who were reported to have a disability between the first kindergarten
entry and 3rd grade enrollment entry were 63.6% less likely to pass the test than those who
changed schools (exp(-1.012)=0.364, t=-17.36, p=0.000). Children who attended kindergarten and
3rd grade at the same school were 1.42 times more likely to pass the test than those who did not
(exp(0.348)=1.417, t=7.95, p=0.000).
Mobility and Neighborhood
Different from the KRA-L model (See Table 4), residential mobility and neighborhood-level poverty
rates were not associated with the possibility of the passing 3rd grade reading test (See Table 6 and
Map 4).
Ohio Education Research Center | Investigating the Pathway to Proficiency from Birth through 3rd Grade 28
Table 5. Descriptive Statistics for 3rd Grade Reading Test Model: Individual and Bivariate Level
Variables
Fail (=0) Pass (=1) Total Bivariate statistics
n (%) n (%) n (%) df x2/ t p
Outcome: Passage of 3rd grade reading test 5,597 (47.5) 6,183 (52.5) 11,780 (100.0)
Kindergarten cohort (2007/08) 1,999 (57.2) 1,499 (42.9) 3,498 (100.0) 3 201.12 <.0001
Kindergarten cohort (2008/09) 1,583 (46.0) 1,859 (54.0) 3,442 (100.0)
Kindergarten cohort (2009/10) 1,321 (41.2) 1,883 (58.8) 3,204 (100.0)
Kindergarten cohort (2010/11) 697 (42.4) 942 (57.6) 1,636 (100.0)
Child characteristics
Sex (Male) 3,059 (41.5) 2,887 (48.5) 5,946 (100.0) 1 74.49 <.0001
Sex (Female) 2,538 (43.5) 3,296 (45.5) 5,834 (100.0)
Age at 3rd grade (Month)+ 104.1 (6.0) 103.4 (5.3) 103.7 (5.7) 11216 7.64 <.0001
Low-birth weight (No) 4,000 (47.3) 4,457 (52.7) 8,457 (100.0) 1 23.12 <.0001
Low-birth weight (Yes) 656 (54.7) 543 (45.3) 1,199 (100.0)
Race (Hispanic) 592 (39.5) 907 (60.5) 1,499 (100.0) 3 249.88 <.0001
Race (African-American) 4,245 (52.3) 3,872 (32.9) 8,117 (100.0)
Race (White) 723 (35.6) 1,306 (64.4) 2,029 (100.0)
Race (Others) 37 (27.4) 98 (72.6) 135 (100.0)
Non-native English at kindergarten (No) 5,147 (48.2) 5,541 (51.8) 10,688 (100.0) 1 19.18 0.000
Non-native English at kindergarten (Yes) 450 (41.2) 642 (58.8) 1,092 (100.0)
Family characteristics: Birth to 3rd grade
Born to teenage mother (No) 3,810 (47.2) 4,256 (52.8) 8,066 (100.0) 1 18.97 <.0001
Born to teenage mother (Yes) 846 (53.2) 744 (46.8) 1,590 (100.0)
Born to mother with high school diploma (No) 2,364 (54.4) 1,985 (45.6) 4,349 (100.0) 1 119.42 <.0001
Born to mother with high school diploma (Yes) 2,292 (43.2) 3,015 (56.8) 5,307 (100.0)
Months of <150% of Federal Poverty Line (Month)+ 74.0 (33.8) 62.4 (38.0) 67.8 (36.5) 11775 17.43 <.0001
Substantiated/indicated child abuse ever (No) 4,393 (457) 5,225 (54.3) 9,618 (100.0) 1 70.99 <.0001
Substantiated/indicated child abuse ever (Yes) 1,204 (55.7) 958 (44.3) 2,162 (100.0)
Foster care placement ever (No) 5,166 (47.1) 5,798 (52.9) 10,964 (100.0) 1 9.90 0.002
Foster care placement ever (Yes) 431 (52.8) 385 (47.2) 816 (100.0)
Ohio Education Research Center | Investigating the Pathway to Proficiency from Birth through 3rd Grade 29
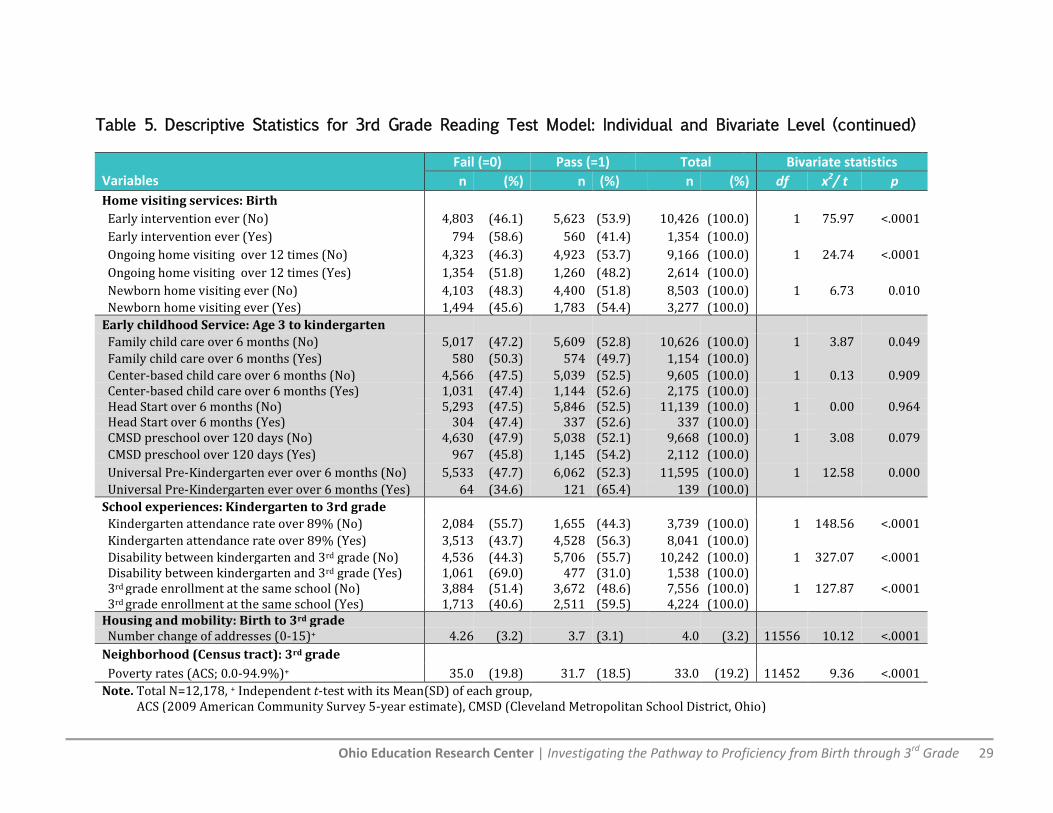
Table 5. Descriptive Statistics for 3rd Grade Reading Test Model: Individual and Bivariate Level (continued)
Variables
Fail (=0) Pass (=1) Total Bivariate statistics
n (%) n (%) n (%) df x2/ t p
Home visiting services: Birth
Early intervention ever (No) 4,803 (46.1) 5,623 (53.9) 10,426 (100.0) 1 75.97 <.0001
Early intervention ever (Yes) 794 (58.6) 560 (41.4) 1,354 (100.0)
Ongoing home visiting over 12 times (No) 4,323 (46.3) 4,923 (53.7) 9,166 (100.0) 1 24.74 <.0001
Ongoing home visiting over 12 times (Yes) 1,354 (51.8) 1,260 (48.2) 2,614 (100.0)
Newborn home visiting ever (No) 4,103 (48.3) 4,400 (51.8) 8,503 (100.0) 1 6.73 0.010
Newborn home visiting ever (Yes) 1,494 (45.6) 1,783 (54.4) 3,277 (100.0)
Early childhood Service: Age 3 to kindergarten
Family child care over 6 months (No) 5,017 (47.2) 5,609 (52.8) 10,626 (100.0) 1 3.87 0.049
Family child care over 6 months (Yes) 580 (50.3) 574 (49.7) 1,154 (100.0)
Center-based child care over 6 months (No) 4,566 (47.5) 5,039 (52.5) 9,605 (100.0) 1 0.13 0.909 Center-based child care over 6 months (Yes) 1,031 (47.4) 1,144 (52.6) 2,175 (100.0)
Head Start over 6 months (No) 5,293 (47.5) 5,846 (52.5) 11,139 (100.0) 1 0.00 0.964 Head Start over 6 months (Yes) 304 (47.4) 337 (52.6) 337 (100.0)
CMSD preschool over 120 days (No) 4,630 (47.9) 5,038 (52.1) 9,668 (100.0) 1 3.08 0.079
CMSD preschool over 120 days (Yes) 967 (45.8) 1,145 (54.2) 2,112 (100.0)
Universal Pre-Kindergarten ever over 6 months (No) 5,533 (47.7) 6,062 (52.3) 11,595 (100.0) 1 12.58 0.000
Universal Pre-Kindergarten ever over 6 months (Yes) 64 (34.6) 121 (65.4) 139 (100.0)
School experiences: Kindergarten to 3rd grade
Kindergarten attendance rate over 89% (No) 2,084 (55.7) 1,655 (44.3) 3,739 (100.0) 1 148.56 <.0001
Kindergarten attendance rate over 89% (Yes) 3,513 (43.7) 4,528 (56.3) 8,041 (100.0)
Disability between kindergarten and 3rd grade (No) 4,536 (44.3) 5,706 (55.7) 10,242 (100.0) 1 327.07 <.0001 Disability between kindergarten and 3rd grade (Yes) 1,061 (69.0) 477 (31.0) 1,538 (100.0)
3rd grade enrollment at the same school (No) 3,884 (51.4) 3,672 (48.6) 7,556 (100.0) 1 127.87 <.0001 3rd grade enrollment at the same school (Yes) 1,713 (40.6) 2,511 (59.5) 4,224 (100.0) Housing and mobility: Birth to 3rd grade
Number change of addresses (0-15)+ 4.26 (3.2) 3.7 (3.1) 4.0 (3.2) 11556 10.12 <.0001
Neighborhood (Census tract): 3rd grade
Poverty rates (ACS; 0.0-94.9%)+ 35.0 (19.8) 31.7 (18.5) 33.0 (19.2) 11452 9.36 <.0001
Note. Total N=12,178, + Independent t-test with its Mean(SD) of each group, ACS (2009 American Community Survey 5-year estimate), CMSD (Cleveland Metropolitan School District, Ohio)
Ohio Education Research Center | Investigating the Pathway to Proficiency from Birth through 3rd Grade 30
Table 6. Hierarchical Generalized Linear Model (HGLM) for 3rd Grade Reading Test
Variables % / M(SD) β SE t p OR
Intercept: Passage of 3rd reading test (Yes=1)(i) 51.8% 0.387 0.190 2.03 0.042
Child characteristics
Age at 3rd grade (in months; 87-161)(m) 103.7(5.6) 0.009 0.005 2.07 0.038 1.010
Gender (Female=1) 49.5% 0.227 0.041 5.61 0.000 1.255
Low-birth weight (Yes=1)(i) 12.4% -0.124 0.063 -1.97 0.049 0.883
Race: Reference (White and others; Yes=1) 19.2%
Hispanic (Yes=1) 10.8% -0.052 0.091 -0.58 0.564 0.949
African-American (Yes=1) 70.0% -0.510 0.061 -8.31 0.000 0.600
Non-native English at kindergarten (Yes=1) 6.8% -0.228 0.096 -2.39 0.017 0.796
Family characteristics: Birth to kindergarten
Born to teenage mother (Yes=1)(i) 16.5% -0.085 0.072 -1.18 0.244 0.918
Born to mother with high school diploma (Yes=1)(i)
55.0% 0.281 0.047 5.98 0.000 1.325
Number of months living <150% FPL (months: 0-126)(m)
70.7(35.6) -0.005 0.001 -7.04 0.000 0.995
Substantiated/indicated child abuse (Yes=1) 19.5% -0.161 0.058 -2.81 0.005 0.851
Foster care placement (Yes=1) 7.4% 0.224 0.086 2.61 0.009 1.251
Home visiting services: Birth
Early intervention ever (Yes=1) 12.0% -0.269 0.068 -3.99 0.000 0.764
Ongoing home visiting over 12 times (Yes=1) 23.6% 0.053 0.050 1.06 0.289 1.054
Newborn home visiting ever (Yes=1) 30.4% 0.207 0.052 3.98 0.000 1.230
Early childhood services: 36 months to kindergarten
Family child care over 6 months (Yes=1) 10.0% 0.044 0.066 0.67 0.503 1.045
Center-based child care over 6 months (Yes=1) 18.6% 0.079 0.052 1.51 0.130 1.082
Head Start over 6 months (Yes=1) 5.6% 0.096 0.089 1.08 0.279 1.101
CMSD Preschool over 120 days or UPK ever over 6 months (Yes=1)
19.1% 0.254 0.052 4.84 0.000 1.289
School experiences: Kindergarten to 3rd grade
Kindergarten attendance rate over 89% (Yes=1) 67.4% 0.206 0.044 4.68 0.000 1.229 Disability between kindergarten and 3rd grade (Yes=1)
16.2% -1.012 0.058 -17.36 0.000 0.364
3rd grade enrollment at the same school (Yes=1) 35.8% 0.348 0.044 7.95 0.000 1.417
Mobility: Birth to 3rd grade
Number of changing address (0-15)(i)(m) 4.1(3.2) -0.007 0.007 -0.93 0.351 0.993
Neighborhood (Census-tract) characteristics: 3rd grade
Poverty rates (ACS 2009; 0.0-94.9%)(m) 33.3(19.3) -0.003 0.002 -1.77 0.076 0.997
Note. Number of children=12,178; Number of Census tracts=415
Model fit: F(23, 30964.4)=36.71, p=0.000
Between-variance: 0.199 (Null model, p<0.05), 0.084 (Current model, p<0.05)
(i) Multiple imputation (m=5), (m) grand-mean centering,
OR (Odds Ratio), FPL (Federal Poverty Line),
CMSD (Cleveland Municipal School District), UPK (Universal Pre-Kindergarten),
ACS (American Community Survey 2009 5-year estimates)
Ohio Education Research Center | Investigating the Pathway to Proficiency from Birth through 3rd Grade 31
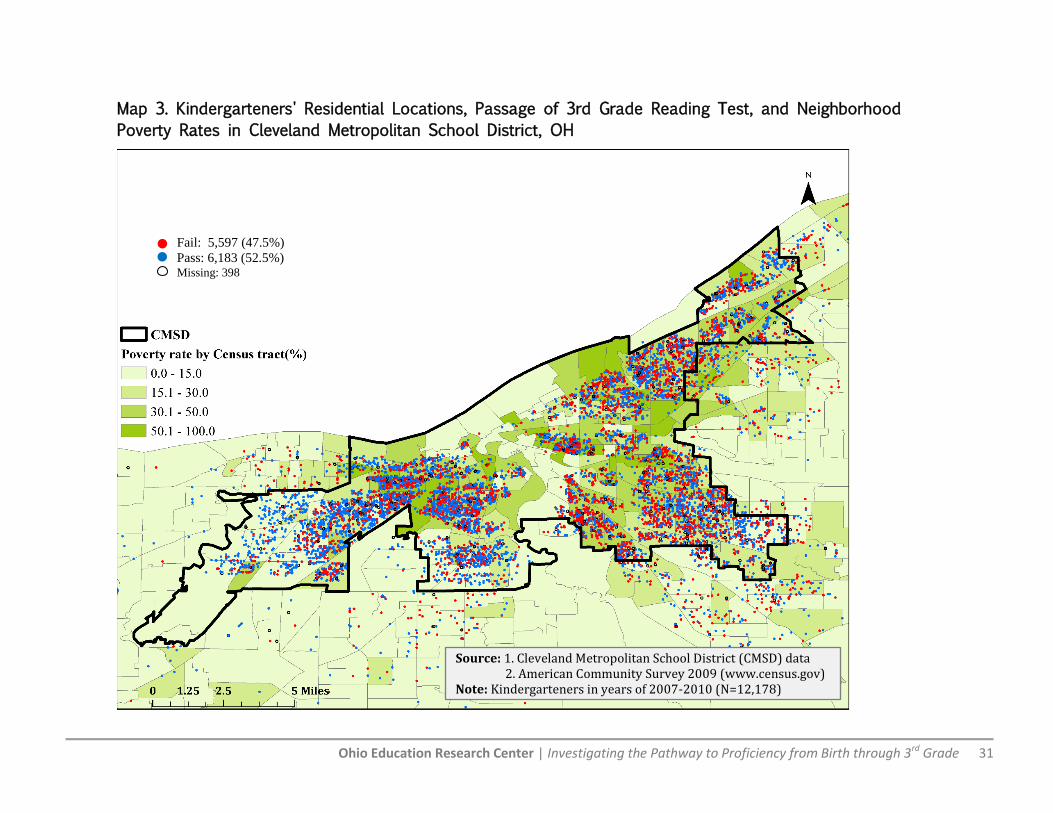
Source: 1. Cleveland Metropolitan School District (CMSD) data 2. American Community Survey 2009 (www.census.gov) Note: Kindergarteners in years of 2007-2010 (N=12,178)
Fail: 5,597 (47.5%)
Pass: 6,183 (52.5%) Missing: 398
Map 3. Kindergarteners' Residential Locations, Passage of 3rd Grade Reading Test, and Neighborhood
Poverty Rates in Cleveland Metropolitan School District, OH
Ohio Education Research Center | Investigating the Pathway to Proficiency from Birth through 3rd Grade 32
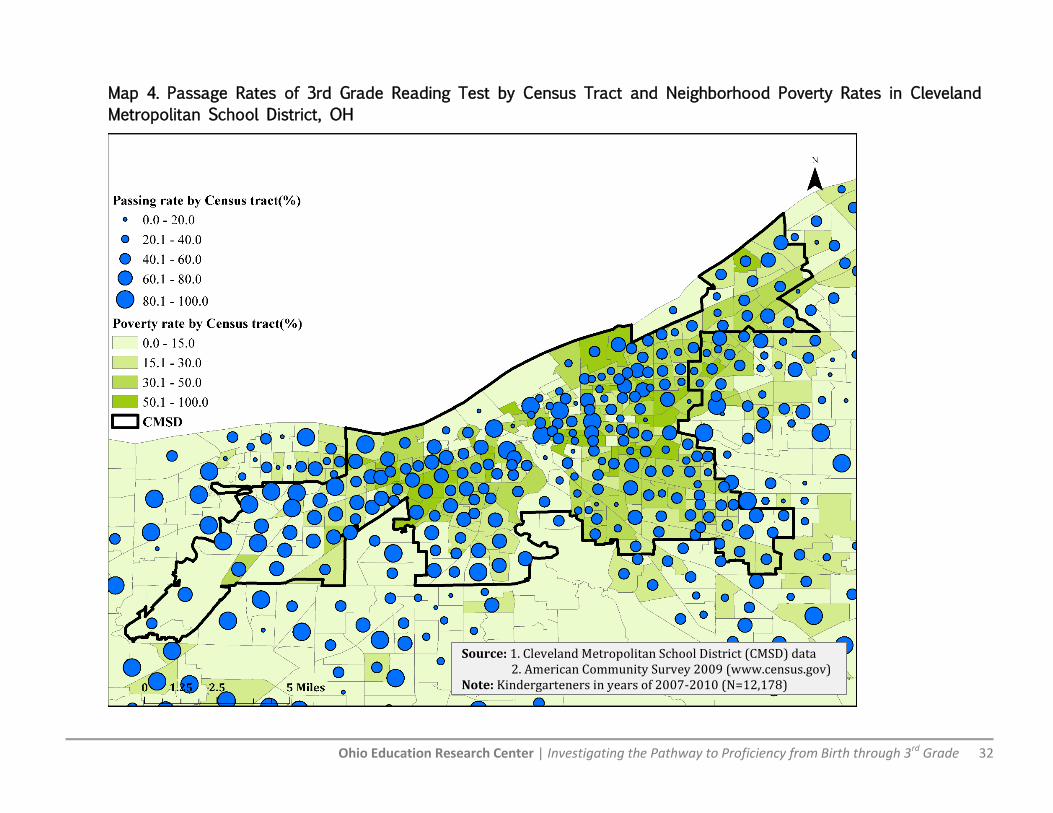
Map 4. Passage Rates of 3rd Grade Reading Test by Census Tract and Neighborhood Poverty Rates in Cleveland
Metropolitan School District, OH
Source: 1. Cleveland Metropolitan School District (CMSD) data 2. American Community Survey 2009 (www.census.gov) Note: Kindergarteners in years of 2007-2010 (N=12,178)
Ohio Education Research Center | Investigating the Pathway to Proficiency from Birth through 3rd Grade 33
The results from this study provide meaningful information related to early literacy development
among children in an urban metropolitan area. The availability of IDS approach and cohort design
enabled comprehensive examination of kindergarten readiness and 3rd grade reading from an
ecological and longitudinal perspective.
Hierarchically organized individual-, family-, and neighborhood-level variables made it possible to
systematically identify subgroups of children challenged with literacy development. First, girls
consistently showed higher KRA-L scores and were more likely to pass the 3rd grade reading test
than boys. Older children had higher KRA-L scores and were more likely to pass the 3rd grade
reading test than younger children. Low-birth weight was negatively associated with KRA-L scores
and the possibility of passing the 3rd grade reading test. Whereas Hispanic children showed lower
KRA-L scores than other racial groups, African-American children had a lower odds ratio of passing
the 3rd grade reading test than other racial groups. Children who were non-native English speakers
had lower KRA-L scores and passing rate of 3rd grade reading test. Children with disabilities before
and after kindergarten entry had lower KRA-L scores and were less likely to pass the 3rd grade
reading test.
Factors related to the child’s family also influenced child literacy development. In particular,
children whose family had economic difficulty tended to show lower KRA-L scores and possibility
of passing the 3rd grade reading test. In addition, children who were born to high risk families, as
indicated by their participation in the ongoing home visiting program, showed lower KRA-L scores
and possibility of passing the 3rd grade reading test. Furthermore, the children who experienced
child maltreatment scored lower on the KRA-L. Social services as well as the school system should
consider these predictors in the process of developing and implementing programs for early
literacy development.
One of the advantages in this study was our ability to track the children’s involvement with various
early childhood services such as foster care, home visiting programs, childcare, public pre-school,
and UPK. The influences of these social services can be considered in light of child literacy
development and the risk factors identified in the previous section. For example, the newborn
home visit, which is a one-time visit for families living under 200% of the FPL, positively affected
CONCLUSIONS
The newborn home visit, which is a one-time visit for
families living under 200% of the FPL, positively affected
early literacy development.
Ohio Education Research Center | Investigating the Pathway to Proficiency from Birth through 3rd Grade 34
early literacy development. This program does not directly provide an educational component of
enhancing literacy to children. However, considering its positive influence on KRA-L and the 3rd
grade reading test, the newborn home visit can play a role in establishing a good starting point of
early literacy development as it supports (1) the discovery of children who may show a
developmental issue or disability earlier, (2) the detection of child maltreatment, (3) the
arrangement of services for families in need, especially lower-educated mothers and immigrant
families (i.e., non-native English or Hispanics), and (4) families
choosing higher quality early childhood services. In addition to
home visiting services, early childhood education services after
age 3 show promising results. All of the early childhood education
services except for family childcare homes were positively
associated with an increase in KRA-L.7 In particular, participation
in CMSD public preschool or UPK increased not only KRA-L scores
but also the passing rates of 3rd grade reading test. However, the
influence of UPK should be carefully interpreted because this
study included a small number of UPK participants (e.g., <2% of
children included in the models).
The results showed that chronic absenteeism in kindergarten was
negatively associated with the passage of the 3rd grade reading
test. Absenteeism in early grades may be a matter of child health
problems or family distress (Romero & Lee, 2008). Although the
multi-level analysis for 3rd grade reading test did not include KRA-
L scores, the association between KRA-L and the passage of 3rd
grade was significantly correlated at a bivariate level (eta.=0.32,
p<0.001). Therefore, the educational plan of the school system
should be considered with both children’s KRA-L score per se and
the risk predictors of KRA-L together in order to enhance the
passing rates of 3rd grade reading test. Furthermore, the positive
influence of CMSD public preschool on KRA-L provides a
meaningful implication to the public school system in terms of
educational continuity. The 20% of children who attended CMSD preschool were exposed to the
public school system before their first kindergarten entry. As well, the CMSD preschool and UPK
had a relatively stronger influence on KRA-L than other publically-funded early childhood services
such as center-based child care and the Head Start program. Hence, the public school system can
assist in adopting and including its educational components to other early childhood services. In
sum, building a cohesive bridge between early childhood services and the public school system can
make it possible for children to (1) stay within a continuity of child development and education, (2)
be prepared for kindergarten, and (3) improve the likelihood of passage of the 3rd grade reading
test.
7 Registered family child care homes (i.e., Type B providers) are permitted to care for up to six children under Ohio regulations. In 2013, approximately 31% of these homes had undergone a quality rating that placed them in the tier of higher quality.
Building a cohesive
bridge between early
childhood services and
the public school system
can make it possible for
children to (1) stay
within a continuity of
child development and
education, (2) be
prepared for
kindergarten, and (3)
improve the likelihood
of passage of the 3rd
grade reading test.
Ohio Education Research Center | Investigating the Pathway to Proficiency from Birth through 3rd Grade 35
By combining birth certificates, monthly addresses from Medicaid, and CMSD data, this study
measured residential and school mobility. First, frequent change of residential address was
associated with decreases in KRA-L scores. Children who attended 3rd grade at the same school as
their kindergarten had a higher possibility of passing the 3rd grade reading test then those who
transferred to other schools or districts. In sum, residential and school mobility were associated
with KRA-L scores and passage of 3rd grade reading test, respectively. Although the school mobility
between CMSD preschool and kindergarten was not included in this study, the positive influence of
CMSD preschool on the early literacy development can be discussed within the theme of “stability”.
For example, if a child lived at the same house from birth to kindergarten entry, attended CMSD
preschool, entered CMSD kindergarten, maintained high attendance rates from kindergarten to 2nd
grade at the same school, and continuously enrolled in 3rd grade at CMSD, the child would likely
have a higher KRA-L scores and increased possibility of passing the 3rd grade reading test all else
being equal. In conclusion, the results combined with CMSD preschool, mobility, and absenteeism
imply that consistency and stability are important for children’s literacy development.
Our sample was individually and geographically homogenous in terms of individual socio-economic
status (i.e., a high portion of African-American children and families with an economic difficulty)
and neighborhood characteristics (i.e., a public school district in an urban area with high poverty
rates). The two analytical models estimated a relatively low neighborhood (between)-level variance
for their outcome. Yet, in spite of that, higher neighborhood-level poverty rates significantly
decreased KRA-L scores (p=0.005) and marginally decreased likelihood of passing the 3rd grade
reading test (p=0.076).
Limitations and Future Study
Future research should address the limitations in this study by using more geographically extended
research designs, more integrated data, and advanced statistical approaches.
First of all, the cohort design of this study made it possible to effectively track children in two ways:
retrospective (from birth to kindergarten) and prospective (from kindergarten to 3rd grade).
However, this study was geographically limited by the focus on one school district and the relative
economic and ethnic homogeneity of the underlying population. Therefore, future studies should
include both urban and suburban school districts to better understand neighborhood- and school-
level effects. One particular data limitation relates to children who leave the public school system to
attend school in charter or parochial schools. At present there is no systematic data available on
these children and their departure from the sample may produce systematic biases.
Overall, the IDS approach enhanced the quality of data available for analysis, especially the
integration of local and state IDS. The CHILD system contributed to integrating various records
regarding child development, especially early childhood services. The EMIS enabled the CHILD
Ohio Education Research Center | Investigating the Pathway to Proficiency from Birth through 3rd Grade 36
system to (1) update missing information of educational outcomes8 and (2) track the children who
transferred to other public schools in Ohio9. However, this study contained only public school
records making predictions about children who transferred to private or charter schools after
CMSD kindergarten impossible. Future research needs to collect these data to enhance the quality
of IDS as well as to compare the differences between private and public school systems.
Finally, an important limitation is selection bias because we used administrative records and a non-
experimental design. In particular, the statistical interpretation of early childhood services effects
should be considered in light of the fact that families voluntarily choose to enroll their children in
those services and service receipt is based on eligibility criteria. Future studies should explore
mechanisms to adopt a more rigorous analysis to appropriately deal with selection bias issue (e.g.,
propensity score matching analysis) (Guo & Frazer, 2009). Additionally, residential location and
mobility are also subject to selection bias and the factors potentially affecting these choices are not
measureable using administrative records.
The present study demonstrated the potential of methods that draw on integrated data systems to
better inform policy and practice, especially as it relates to experiences that occur across time and
across service systems. The prospects for success of children in their early academic career are
directly influenced by their experiences prior to kindergarten. This requires greater consideration
of approaches that seek to support early development of children as a mechanism to facilitate
academic success.
8 962 cases without KRA-L scores (Total N=13,959 of KRA-L model) were found in the EMIS; these cases had taken KRA-L test outside of CMSD and enrolled in CMSD or vice versa. 9 The EMIS provided 2,834 cases (Total N=12,178 of 3rd grade reading model) who transferred to other public schools in Ohio.
Ohio Education Research Center | Investigating the Pathway to Proficiency from Birth through 3rd Grade 37
Appleyard, K., Egeland, B., Dulmen, M. H. M., & Alan Sroufe, L. (2005). When more is not better: The
role of cumulative risk in child behavior outcomes. Journal of Child Psychology and Psychiatry, 46(3), 235-245.
Evans, G. W. (2004). The environment of childhood poverty. American Psychologist, 59(2), 77-92. Evans, G. W., Gonnella, C., Marcynyszyn, L. A., Gentile, L., & Salpekar, N. (2005). The role of chaos in
poverty and children's socioemotional adjustment. Psychological Science, 16(7), 560-565. Fischer, R. L., Lalich, N., & Coulton, C. (2008). Taking it to scale: Evaluating the scope and reach of a
community-wide initiative on early childhood. Evaluation and Program Planning, 31, 199-208.
Guo, S., & Fraser, M. W. (2009). Propensity score analysis: Statistical methods and
applications. Thousand Oaks, CA: Sage. Hart, B., & Risley, T. R. (1995). Meaningful differences in the everyday experience of young American
children. Baltimore, MD: Paul H Brookes Publishing. Hernandez, D. J. (2011). Double jeopardy: How third grade reading skills and poverty influence high
school graduation. Baltimore, MD: Annie E. Casey Foundation. Hernandez, D. J. (2012). Pre K-3rd: Next steps for state longitudinal systems. New York: Foundation
for Child Development. Individuals with Disabilities Education Act of 2004, 20 U.S.C § 1400. Hopson, L. M., & Lee, E. (2011). Mitigating the effect of family poverty on academic and behavioral
outcomes: The role of school climate in middle and high school. Children and Youth Services Review, 33(11), 2221-2229.
Martin, A., Razza, R. A., & Brooks-Gunn, J. (2012). Specifying the links between household chaos and
preschool children's development. Early Child Development and Care, 182(10), 1247-1263. McKnight , P. E. McKnight , K. M. Sidani , S. Figueredo , A. J. (2007). Missing data: A gentle
introduction. New York: Guilford Press. Mistry, R. S., Benner, A. D., Biesanz, J. C., Clark, S. L., & Howes, C. (2010). Family and social risk, and
parental investments during the early childhood years as predictors of low-income children's school readiness outcomes. Early Childhood Research Quarterly, 25(4), 432-449.
Ohio Department of Education (education.ohio.gov). Raudenbush, S. W., & Bryk, A. S. (2002). Hierarchical linear models: Applications and data analysis
methods. Newbury Park, CA: Sage.
REFERENCES
Ohio Education Research Center | Investigating the Pathway to Proficiency from Birth through 3rd Grade 38
Raudenbush, S. W., Bryk, A. S., Cheong, Y. F., Congdon, R., & du Toit, M. (2011). HLM 7: Hierarchical
linear & nonlinear modeling. Lincolnwood, IL: Scientific Software International. Romero, M., & Lee, Y. S. (2008). The Influence of maternal and family risk on chronic absenteeism in
early schooling. New York: National Center for Children in Poverty, Columbia University. Sektnan, M., McClelland, M. M., Acock, A., & Morrison, F. J. (2010). Relations between early family
risk, children's behavioral regulation, and academic achievement. Early Childhood Research Quarterly, 25(4), 464-479.
U.S. Census Bureau (www.census.gov). West, D. (2012). Big data for education: Data mining, data analytics, and web dashboards.
Washington, D.C.: The Brookings Institution. Wodtke, G. T., Harding, D. J., & Elwert, F. (2011). Neighborhood effects in temporal perspective the
impact of long-term exposure to concentrated disadvantage on high school graduation. American Sociological Review, 76(5), 713-736.

Ohio Education Research Center | Investigating the Pathway to Proficiency from Birth through 3rd Grade 39

Ohio Education Research Center | Investigating the Pathway to Proficiency from Birth through 3rd Grade 40
www.oerc.osu.edu | [email protected] | (855) 231-7753
The Ohio State University | John Glenn College of Public Affairs | 1810 College Rd. | Columbus, OH 43210