Embed Size (px)
Citation preview
Transp Porous Med (2012) 93:577–595DOI 10.1007/s11242-012-9970-7
Investigating the Fracture Network Effects on SweepEfficiency during WAG Injection Process
A. A. Dehghan · S. Ghorbanizadeh · Sh. Ayatollahi
Received: 15 March 2011 / Accepted: 21 February 2012 / Published online: 8 March 2012© Springer Science+Business Media B.V. 2012
Abstract In this study, the main recovery mechanisms behind oil/water/gas interactionsduring the water-alternating-gas (WAG) injection process, in a network of matrix/fracture,were fundamentally investigated. A visual micromodel was utilized to provide insights intothe potential applications of WAG process in fractured oil-wet media as well as the possibilityof observing microscopic displacement behavior of fluids in the model. The model was madeof an oil-wet facture/matrix network system, comprised of four matrix blocks surroundedwith fractures. Different WAG injection scenarios, such as slug arrangements and the effectsof fluid injection rates on oil recovery were studied. A new equation representing the capillarynumber, considering the fracture viscous force and matrix capillary force, was developed tomake the experimental results more similar to a real field. In general, WAG tests performedin the fractured model showed a higher oil recovery factor compared with the results of gasand water injection tests at their optimum rates. The results showed that the presence ofan oil film, in all cases, was the main reason for co-current drainage and double displace-ment of oil under applied driving forces. Furthermore, the formation of oil liquid bridgesimproved the recovery efficiency, which was greatly influenced by the size of fracture con-necting the two matrix blocks; these connecting paths were more stable when there was initialwater remaining in the media. Analyzing different recovery curves and microscopic view ofthe three phases in the transparent model showed that starting an injection mode with gas
A. A. Dehghan (B) · S. GhorbanizadehDepartment of Chemical and Petroleum Engineering, Sharif University of Technology, Tehran, Irane-mail: [email protected]; [email protected]
Sh. AyatollahiEOR Research Center, School of Chemical and Petroleum Engineering, Shiraz University,P.O. Box 71345-1719, Shiraz, Iran
Present Address:Sh. AyatollahiDepartment of Chemical and Petroleum Engineering,Sharif University of Technology, Tehran, Iran
123
578 A. A. Dehghan et al.
(followed by repeated small slugs of water and gas), could considerably improve oil recoveryby pushing water into the matrix zone and increasing the total sweep efficiency.
Keywords Fractured reservoir · WAG · Gas injection · Water flooding · Glass micromodel ·Pore scale
List of SymbolsNc,mf Capillary number�P Pressure differencevx,f Velocity of phase x in the fractureμx Viscosity of phase xLm Length of matrixkf Fracture permeabilityσox Interfacial tension of oil and phase xRm Hydraulic radiuskm Matrix permeabilityKf Fracture permeabilityQg,f Gas flow rate in fractureQw,f Water flow rate in fracture
Subscriptsw Waterg Gaso Oilf Fracturem Matrixlab At laboratory conditionres At reservoir condition
1 Introduction
Naturally fractured reservoirs represent a considerable fraction of oil and gas reserves, espe-cially in the Middle East region. Primary production from these kinds of reserves typicallyleads to low recovery values with excessive gas/oil production through the fractures andvery little sweep efficiency of the matrix blocks. The presence of connected fracture net-works makes the application of traditional-enhanced oil recovery techniques less feasible.To find out the amount of oil recovery and distribution of the injected fluids throughout thefractured reservoirs while gravity-, capillary-, and viscous-induced forces are affecting thematrix sweep efficiency, models with a network of fractures must be designed and utilized(Haghighi et al. 1994; Christensen et al. 2001).
The matrix–fracture interaction affects the distribution of immiscible fluids during anyEOR process in fractured media, which determines to a large degree the effectiveness of fluiddisplacement from the matrix. The performance of such a project is substantially influencedby the matrix block geometry, the connectivity of fracture networks, fluid and rock properties,and the fracture and pore-size distributions (Haghighi et al. 1994). Drainage and imbibition
123
Investigating the Fracture Network Effects on Sweep Efficiency 579
processes are known as the main mechanisms for fluid displacement; however, the type ofinteraction between matrix and fracture considerably affects the oil recovery efficiency, whenan external fluid is injected into the fractured reservoir.
A large number of EOR field projects in fractured carbonate reservoirs have been reportedin the literature since the early 1970s, among them the continuous gas injection (CGI) pro-cess is the most common recovery mechanism, with a very low oil-production rate (Manriqueet al. 2007). Continuous water injection (CWI) is not recommended due to its low recoveryefficiency, as a consequence of favoring the water to bypass oil-saturated matrixes throughthe fractures, when the matrix blocks are preferentially oil-wet (Shedid 2006). Water-alter-nating-gas (WAG) injection scheme is the method that refers to utilizing these two morecommon fluids in specific sequence to enhance the reservoirs sweep efficiency. Althoughit was believed that the advantages of water flooding and gas injection together were notintegrated, due to the uneven sweeping of fractured reservoirs (attributed to the existenceof fracture networks) (Heeremans et al. 2006), some field scale applications of WAG arereported (Manrique et al. 2007; Heeremans et al. 2006; Christensen et al. 2001).
The published results in the literature show significant efforts for increasing oil recoveryefficiency by modifying the WAG process; such as injection scenarios, slug size modifi-cation, change of injection rate, etc. (Christensen et al. 1998; Gorell 1990; Prieditis et al.1991; Rogers and Grigg 2000). These research activities mostly dealt with laboratory scaleexamination and feasibility study of the WAG process for specific oil reservoirs, and stillneed to be analyzed for proper design and implementation of this method. Furthermore,a wide range of variables have been investigated as the major design parameters; such asreservoir heterogeneity, fluid properties, availability and composition of the injected gas,injection pattern, WAG ratio, capillary pressure and relative permeability, as well as res-ervoir wettability (Christensen et al. 2001; Heeremans et al. 2006; Morrow 1990). How-ever, most of them focused on the conventional water-wet models, without considering thereal complicated types of reservoirs such as fractured formations. Therefore, a comparativestudy on different water/gas injection scenarios, which considers the influence of the frac-ture–matrix network system on the displacement process, remains a topic of debate in theliterature.
Despite this progress, our understanding about displacement mechanisms in fracturedsystems is still basic and phenomenological. By using transparent porous media, significantinsights into the physical mechanisms have been obtained and it is possible to develop con-sistent models based on microscopic observations. Despite its limitation to two dimensions,flow visualization has been very useful in clarifying flow mechanisms in many processes(Haghighi et al. 1994; Campbell and Orr 1985; Danesh et al. 1987; Lenormand et al. 1983;Sohrabi et al. 2004, 2008; Dehghan et al. 2009a,b; van Dijke et al. 2010). Three-phaseimmiscible WAG injection behavior in non-fractured micromodels has previously been stud-ied (Dong et al. 2005; van Dijke et al. 2004, 2006); however, the role of matrix–fractureinteraction on performance behavior of the WAG process, especially in fractured oil-wetmedia, has not been well explained. In this study, a novel experimental set-up is used toutilize an oil-wet fractured glass micromodel (representing a micro-scale replica of naturallyfractured carbonate reservoir) for a WAG process. The injection of fluids was performedon a horizontal plane into the model, to negate gravitational influence and investigate thecompetition between the remaining forces, mainly viscous and capillary. The performanceof different displacement mechanisms such as CGI, CWI, and WAG processes were studiedusing the fractured network in selected media. Different fracture sizes were also applied inthe model and the effect of connate water was examined.
123
580 A. A. Dehghan et al.
Table 1 Composition of the brine
Parameter Sodium Potassium Calcium Magnesium Sulfate Bicarbonate Chloride
Valence 1 1 2 2 2 1 1
Concentration (mg/l) 4,771 165 130 38 2,150 190 6,200
2 Experimental Details
Different parameters were studied using an extensive experimental test design including: (i)the effects of a fracture–matrix network system, (ii) monitoring the microscopic fluid dis-placement mechanism, (iii) changing the rates of injection of different fluids, (iv) differentinjection scenarios such as CGI, CWI, and WAG with different slug arrangement, and (v) theeffect of the presence of connate water in the models. The micromodel tests were conductedin a fracture–matrix network of pore and throats designed in the form of a glass micromodel,using Kerosene and brine as the hydrocarbon and aqueous phase, respectively, along withN2 as the injected gas. The model was also properly processed and aged to make it oil wet.All the experiments to assist visual observation of the fluid displacement mechanisms wereperformed at ambient conditions.
2.1 Fluid Properties
Kerosene was used as the hydrocarbon phase with a viscosity of 1cp and density of 0.74 g/ cm3
at 26◦C, and dyed with Sudan Red to provide the required color contrast for image analysis.Synthetic brine using de-ionized water and mineral salts with a purity of 99.9% (purchasedfrom Merck company) was prepared to match the composition of the brine, which is shownin Table 1. The brine was also dyed with Methylene Blue for color contrast. Pure N2 wasused as the injection gas in all tests.
2.2 Experimental Set-up
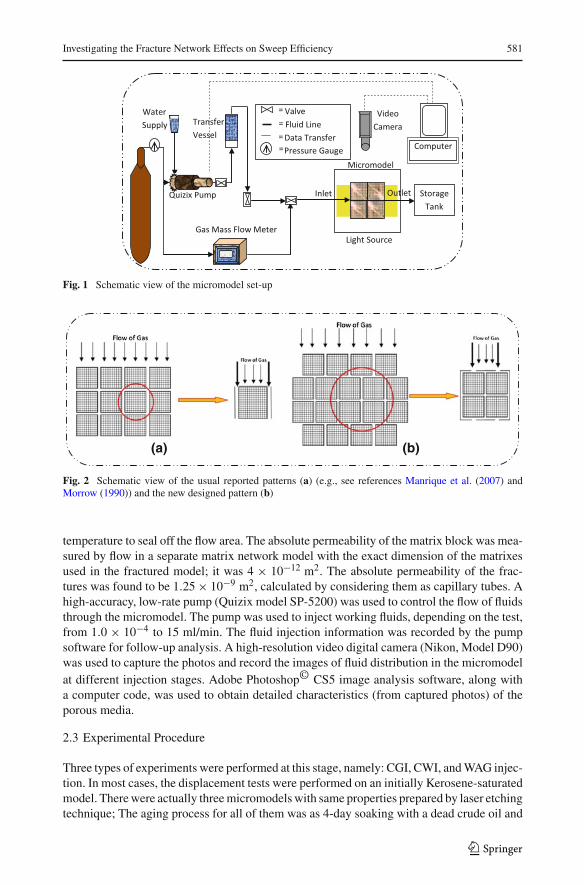
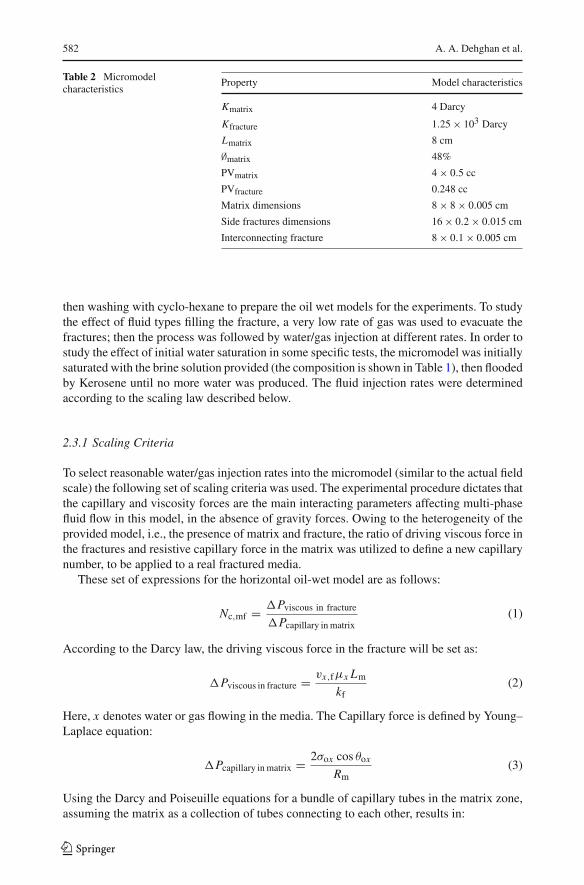
As schematically shown in Fig. 1 the experimental assembly consists of different parts; themost important of which are the glass micromodel, pumping and optical systems. To create afracture–matrix network, a special pattern was designed using Corel Draw© software, withits properties shown in Table 2. The model was built in a way to incorporate the effects offracture–matrix interaction, similar to the fractures distribution in carbonated reservoirs. Aschematic of the model is shown in Fig. 2, to be compared with previous models used in theliterature (e.g., see Firoozabadi et al. 1997; Dastyari et al. 2005). It is worth mentioning thatthis model is conceptually similar to the Warren and Root proposed dual porosity configu-ration (Van Golt-Racht 1982; Warren and Root 1963). The size of the pore and throats indifferent blocks are the same, but the fractures’ size is different. To minimize the capillaryforces in the fractures, the relative size of the fractures was somehow greater than the fieldscale. The provided model was engraved on a glass surface using a Laser beam with an inten-sity of 24% of a 150-watt laser source (having pores with dimensions of about 50 × 100 µmin cross-section). The patterned glass plate was then sandwiched with another flat glass plateand placed very gently in an oven with an accurately controlled temperature. In this step,the system was heated to 780◦C gradually and then allowed to cool down slowly to ambient
123
Investigating the Fracture Network Effects on Sweep Efficiency 581
Fig. 1 Schematic view of the micromodel set-up
(a) (b)
Fig. 2 Schematic view of the usual reported patterns (a) (e.g., see references Manrique et al. (2007) andMorrow (1990)) and the new designed pattern (b)
temperature to seal off the flow area. The absolute permeability of the matrix block was mea-sured by flow in a separate matrix network model with the exact dimension of the matrixesused in the fractured model; it was 4 × 10⁻¹² m2. The absolute permeability of the frac-tures was found to be 1.25 × 10⁻⁹ m2, calculated by considering them as capillary tubes. Ahigh-accuracy, low-rate pump (Quizix model SP-5200) was used to control the flow of fluidsthrough the micromodel. The pump was used to inject working fluids, depending on the test,from 1.0 × 10⁻⁴ to 15 ml/min. The fluid injection information was recorded by the pumpsoftware for follow-up analysis. A high-resolution video digital camera (Nikon, Model D90)was used to capture the photos and record the images of fluid distribution in the micromodelat different injection stages. Adobe Photoshop© CS5 image analysis software, along witha computer code, was used to obtain detailed characteristics (from captured photos) of theporous media.
2.3 Experimental Procedure
Three types of experiments were performed at this stage, namely: CGI, CWI, and WAG injec-tion. In most cases, the displacement tests were performed on an initially Kerosene-saturatedmodel. There were actually three micromodels with same properties prepared by laser etchingtechnique; The aging process for all of them was as 4-day soaking with a dead crude oil and
123
582 A. A. Dehghan et al.
Table 2 Micromodelcharacteristics
Property Model characteristics
Kmatrix 4 Darcy
Kfracture 1.25 × 10³ Darcy
Lmatrix 8 cm
∅matrix 48%
PVmatrix 4 × 0.5 cc
PVfracture 0.248 cc
Matrix dimensions 8 × 8 × 0.005 cm
Side fractures dimensions 16 × 0.2 × 0.015 cm
Interconnecting fracture 8 × 0.1 × 0.005 cm
then washing with cyclo-hexane to prepare the oil wet models for the experiments. To studythe effect of fluid types filling the fracture, a very low rate of gas was used to evacuate thefractures; then the process was followed by water/gas injection at different rates. In order tostudy the effect of initial water saturation in some specific tests, the micromodel was initiallysaturated with the brine solution provided (the composition is shown in Table 1), then floodedby Kerosene until no more water was produced. The fluid injection rates were determinedaccording to the scaling law described below.
2.3.1 Scaling Criteria
To select reasonable water/gas injection rates into the micromodel (similar to the actual fieldscale) the following set of scaling criteria was used. The experimental procedure dictates thatthe capillary and viscosity forces are the main interacting parameters affecting multi-phasefluid flow in this model, in the absence of gravity forces. Owing to the heterogeneity of theprovided model, i.e., the presence of matrix and fracture, the ratio of driving viscous force inthe fractures and resistive capillary force in the matrix was utilized to define a new capillarynumber, to be applied to a real fractured media.
These set of expressions for the horizontal oil-wet model are as follows:
Nc,mf = �Pviscous in fracture
�Pcapillary in matrix(1)
According to the Darcy law, the driving viscous force in the fracture will be set as:
�Pviscous in fracture = vx,fμx Lm
kf(2)
Here, x denotes water or gas flowing in the media. The Capillary force is defined by Young–Laplace equation:
�Pcapillary in matrix = 2σox cos θox
Rm(3)
Using the Darcy and Poiseuille equations for a bundle of capillary tubes in the matrix zone,assuming the matrix as a collection of tubes connecting to each other, results in:
123
Investigating the Fracture Network Effects on Sweep Efficiency 583
Table 3 Typical value of therock-fluid parameters in realreservoirs (Saidi 1987)
Matrix–fracture parameter Typical valueat reservoirconditions
Lm (matrix length or block height) 10 ft
kf (fracture permeability) 1000 Darcy
km (matrix permeability) 0.01 Darcy
σog (gas–oil interfacial tension) 5 dyne/cm
σow (water–oil interfacial tension) 30 dyne/cm
μg (gas viscosity) 0.03 cp
μw (water viscosity) 1.0 cp
km = R2m
8→ Rm = √
8km (4)
Substituting this equation in (3) and then into (1) results in:
�Pcapillary in matrix = 2σox cos θox√8km
(5)
Nc,mf =√
8
2 cos θox
vx,fμx Lm√
km
kfσox(6)
Denoting α = √8/(2 cos θox ), it is obvious that α depends on the pore geometry and state of
wettability of the porous media. For the examples with strong oil wetness, the term of cos θox
could be ignored in the calculations. Finally, the following form for the capillary number isfound:
Nc,mf = Lm√
km
kf
vx,fμx
σox(7)
This new expression for the capillary number can be used to find reasonable gas and waterinjection rates in the fractured porous media. Hence before starting the tests, the range of thisnew capillary number (Nc,mf ), for a real reservoir case, was calculated to be compared withthe values applied in the laboratory tests. Considering typical values of a fractured reservoir’scharacteristics (Saidi 1987; Novakowski et al. 2006, see also Table 3), indicates that the mag-nitude of Nc,mf for the case of water injection is from 10−4 to 10−2 and for the example of gasflooding was found to be between 10−3 and 1 (see supporting information in Appendix A).In the next step, the boundary value of these parameters was used to determine the exactrate of injection in the model. The procedure of calculating the appropriate injection ratesof water and gas, which were going to be used in the tests, is also presented in supportinginformation in Appendix B.
3 Results and Discussion
The results are divided into three main parts: CGI, CWI, and WAG injection. In each case themicroscopic displacement mechanisms along with the quantitative amount of oil displace-ment was analyzed and compared. Moreover, in each category the role of initial fracture fluid
123
584 A. A. Dehghan et al.
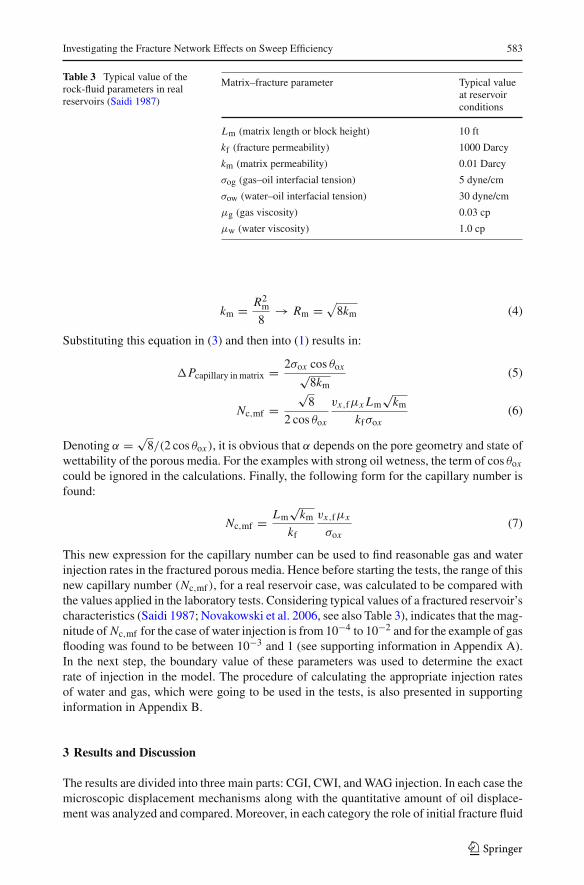
Fig. 3 Microscopic pictures representing the state of wetting order of fluids
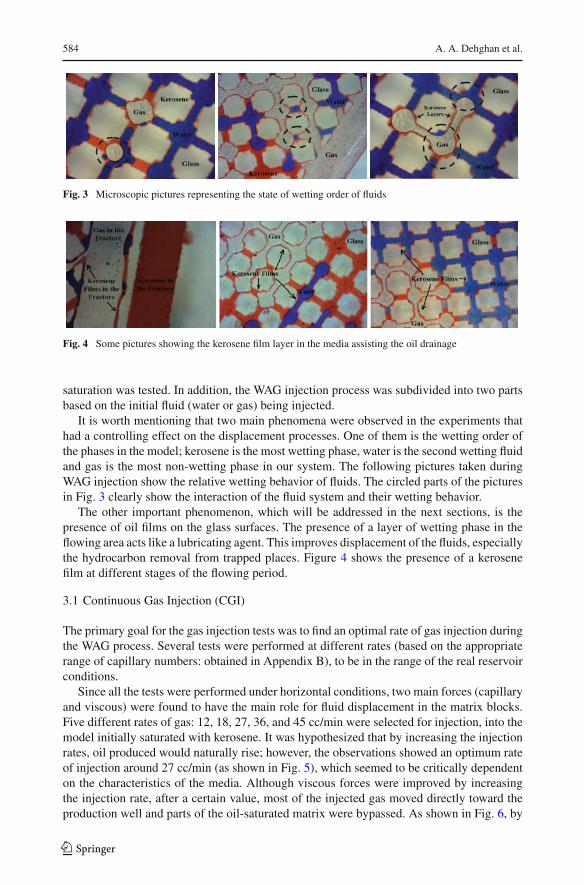
Fig. 4 Some pictures showing the kerosene film layer in the media assisting the oil drainage
saturation was tested. In addition, the WAG injection process was subdivided into two partsbased on the initial fluid (water or gas) being injected.
It is worth mentioning that two main phenomena were observed in the experiments thathad a controlling effect on the displacement processes. One of them is the wetting order ofthe phases in the model; kerosene is the most wetting phase, water is the second wetting fluidand gas is the most non-wetting phase in our system. The following pictures taken duringWAG injection show the relative wetting behavior of fluids. The circled parts of the picturesin Fig. 3 clearly show the interaction of the fluid system and their wetting behavior.
The other important phenomenon, which will be addressed in the next sections, is thepresence of oil films on the glass surfaces. The presence of a layer of wetting phase in theflowing area acts like a lubricating agent. This improves displacement of the fluids, especiallythe hydrocarbon removal from trapped places. Figure 4 shows the presence of a kerosenefilm at different stages of the flowing period.
3.1 Continuous Gas Injection (CGI)
The primary goal for the gas injection tests was to find an optimal rate of gas injection duringthe WAG process. Several tests were performed at different rates (based on the appropriaterange of capillary numbers: obtained in Appendix B), to be in the range of the real reservoirconditions.
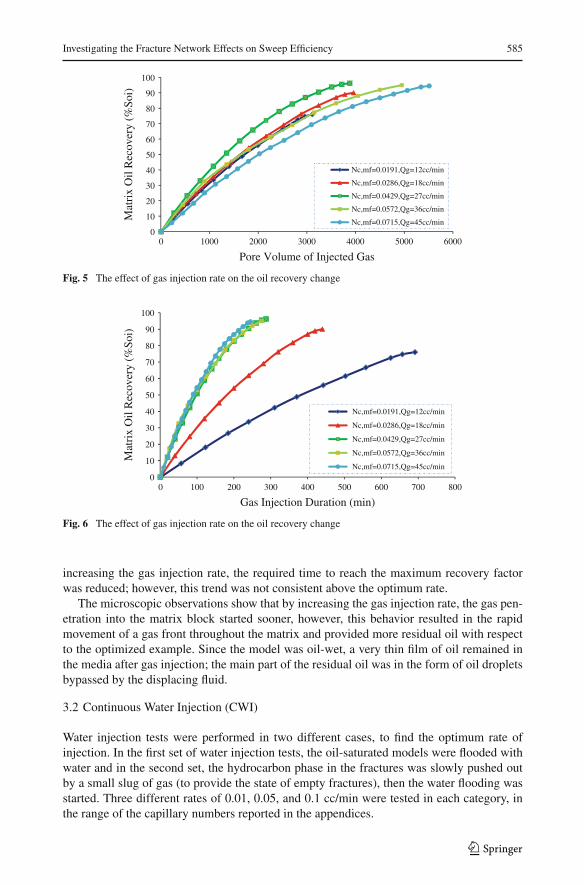
Since all the tests were performed under horizontal conditions, two main forces (capillaryand viscous) were found to have the main role for fluid displacement in the matrix blocks.Five different rates of gas: 12, 18, 27, 36, and 45 cc/min were selected for injection, into themodel initially saturated with kerosene. It was hypothesized that by increasing the injectionrates, oil produced would naturally rise; however, the observations showed an optimum rateof injection around 27 cc/min (as shown in Fig. 5), which seemed to be critically dependenton the characteristics of the media. Although viscous forces were improved by increasingthe injection rate, after a certain value, most of the injected gas moved directly toward theproduction well and parts of the oil-saturated matrix were bypassed. As shown in Fig. 6, by
123
Investigating the Fracture Network Effects on Sweep Efficiency 585
0
10
20
30
40
50
60
70
80
90
100
0 1000 2000 3000 4000 5000 6000
Mat
rix
Oil
Rec
over
y (%
Soi)
Pore Volume of Injected Gas
Nc,mf=0.0191,Qg=12cc/min
Nc,mf=0.0286,Qg=18cc/min
Nc,mf=0.0429,Qg=27cc/min
Nc,mf=0.0572,Qg=36cc/min
Nc,mf=0.0715,Qg=45cc/min
Fig. 5 The effect of gas injection rate on the oil recovery change
0
10
20
30
40
50
60
70
80
90
100
0 100 200 300 400 500 600 700 800
Mat
rix
Oil
Rec
over
y (%
Soi)
Gas Injection Duration (min)
Nc,mf=0.0191,Qg=12cc/min
Nc,mf=0.0286,Qg=18cc/min
Nc,mf=0.0429,Qg=27cc/min
Nc,mf=0.0572,Qg=36cc/min
Nc,mf=0.0715,Qg=45cc/min
Fig. 6 The effect of gas injection rate on the oil recovery change
increasing the gas injection rate, the required time to reach the maximum recovery factorwas reduced; however, this trend was not consistent above the optimum rate.
The microscopic observations show that by increasing the gas injection rate, the gas pen-etration into the matrix block started sooner, however, this behavior resulted in the rapidmovement of a gas front throughout the matrix and provided more residual oil with respectto the optimized example. Since the model was oil-wet, a very thin film of oil remained inthe media after gas injection; the main part of the residual oil was in the form of oil dropletsbypassed by the displacing fluid.
3.2 Continuous Water Injection (CWI)
Water injection tests were performed in two different cases, to find the optimum rate ofinjection. In the first set of water injection tests, the oil-saturated models were flooded withwater and in the second set, the hydrocarbon phase in the fractures was slowly pushed outby a small slug of gas (to provide the state of empty fractures), then the water flooding wasstarted. Three different rates of 0.01, 0.05, and 0.1 cc/min were tested in each category, inthe range of the capillary numbers reported in the appendices.
123
586 A. A. Dehghan et al.
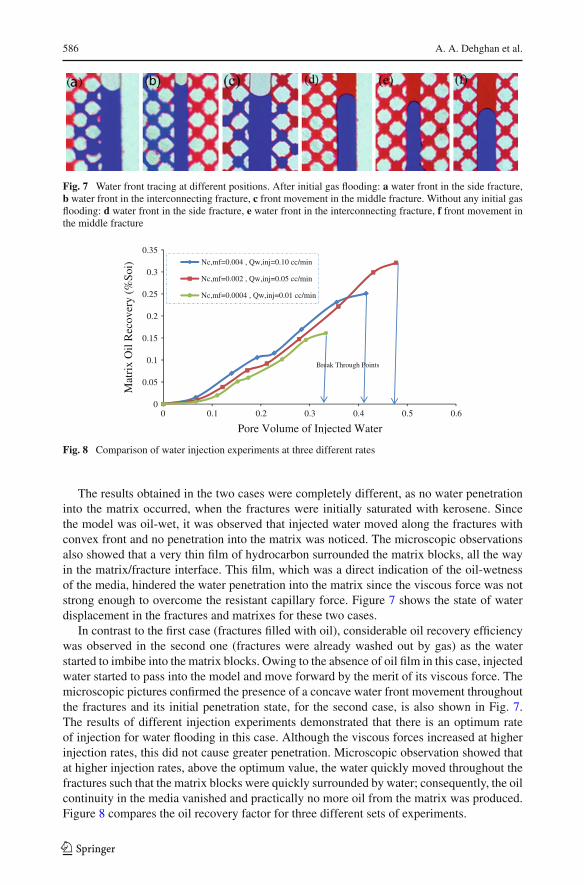
Fig. 7 Water front tracing at different positions. After initial gas flooding: a water front in the side fracture,b water front in the interconnecting fracture, c front movement in the middle fracture. Without any initial gasflooding: d water front in the side fracture, e water front in the interconnecting fracture, f front movement inthe middle fracture
0
0.05
0.1
0.15
0.2
0.25
0.3
0.35
0 0.1 0.2 0.3 0.4 0.5 0.6
Mat
rix
Oil
Rec
over
y (%
Soi)
Pore Volume of Injected Water
Nc,mf=0.004 , Qw,inj=0.10 cc/min
Nc,mf=0.002 , Qw,inj=0.05 cc/min
Nc,mf=0.0004 , Qw,inj=0.01 cc/min
Break Through Points
Fig. 8 Comparison of water injection experiments at three different rates
The results obtained in the two cases were completely different, as no water penetrationinto the matrix occurred, when the fractures were initially saturated with kerosene. Sincethe model was oil-wet, it was observed that injected water moved along the fractures withconvex front and no penetration into the matrix was noticed. The microscopic observationsalso showed that a very thin film of hydrocarbon surrounded the matrix blocks, all the wayin the matrix/fracture interface. This film, which was a direct indication of the oil-wetnessof the media, hindered the water penetration into the matrix since the viscous force was notstrong enough to overcome the resistant capillary force. Figure 7 shows the state of waterdisplacement in the fractures and matrixes for these two cases.
In contrast to the first case (fractures filled with oil), considerable oil recovery efficiencywas observed in the second one (fractures were already washed out by gas) as the waterstarted to imbibe into the matrix blocks. Owing to the absence of oil film in this case, injectedwater started to pass into the model and move forward by the merit of its viscous force. Themicroscopic pictures confirmed the presence of a concave water front movement throughoutthe fractures and its initial penetration state, for the second case, is also shown in Fig. 7.The results of different injection experiments demonstrated that there is an optimum rateof injection for water flooding in this case. Although the viscous forces increased at higherinjection rates, this did not cause greater penetration. Microscopic observation showed thatat higher injection rates, above the optimum value, the water quickly moved throughout thefractures such that the matrix blocks were quickly surrounded by water; consequently, the oilcontinuity in the media vanished and practically no more oil from the matrix was produced.Figure 8 compares the oil recovery factor for three different sets of experiments.
123
Investigating the Fracture Network Effects on Sweep Efficiency 587
As shown in Fig. 8, at a lower injection rate, the water viscous force is not large enough topenetrate into the matrix. Therefore, early water breakthrough in this case is obvious, how-ever, at higher injection rates the breakthrough time increases, while its effect on oil recoverydepends on the rate of injection. The inference is that the main reason for oil production inthis set of tests is water penetration into the matrix blocks. This mechanism has the mostinfluential role, whenever the continuity between two blocks are formed.
3.3 Water-Alternating-Gas Injection (WAG)
The main objective of the previous tests using CGI and CWI scenarios was to find the opti-mum gas and water injection rates for the WAG process. The results showed that applying ahigh-gas injection rate is not recommended, since it causes early gas breakthrough and moregas production, which makes it more suitable for gas recycling tests. Therefore, it was decidedto apply gas injections at lower rates, i.e., 6 and 12 cc/min, along with the obtained optimumwater rate. In total, six main categories of WAG injection tests were designed to study theeffects of injection rate, slug arrangement, and the presence of connate water saturation.
The initial size of water slug was designed to be a fraction of total fracture volume, whichwas then gradually decreased for subsequent cycles. Gas slugs were also injected to the orderof three times total fracture volume.
3.3.1 WAG Injection Initiated by Water Flood
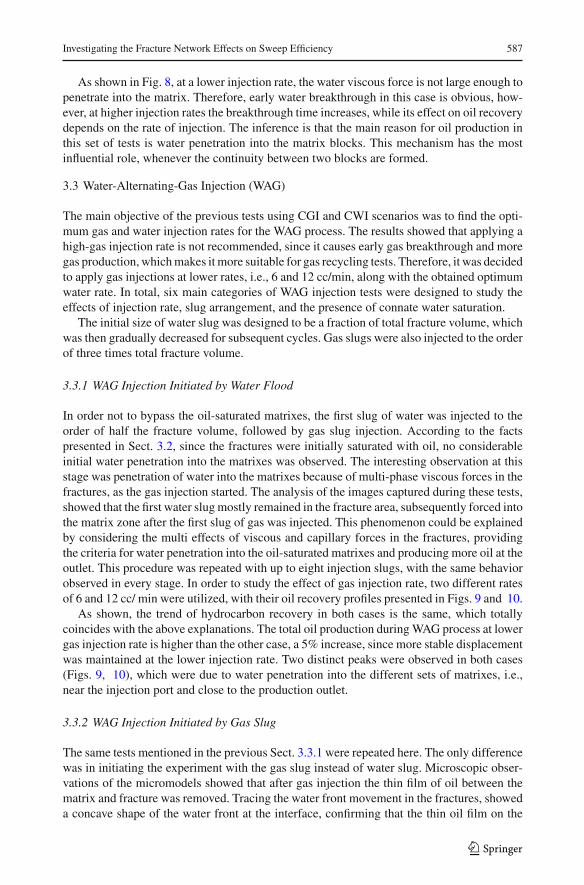
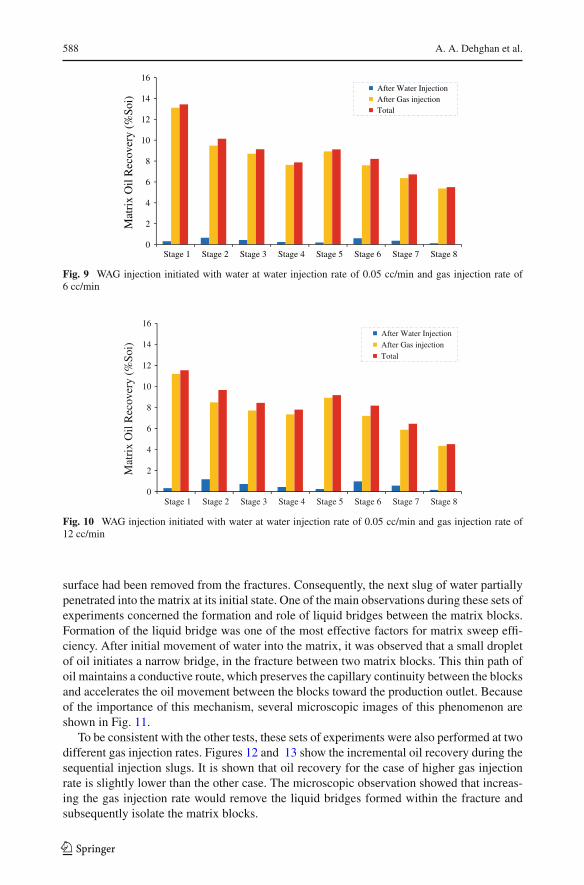
In order not to bypass the oil-saturated matrixes, the first slug of water was injected to theorder of half the fracture volume, followed by gas slug injection. According to the factspresented in Sect. 3.2, since the fractures were initially saturated with oil, no considerableinitial water penetration into the matrixes was observed. The interesting observation at thisstage was penetration of water into the matrixes because of multi-phase viscous forces in thefractures, as the gas injection started. The analysis of the images captured during these tests,showed that the first water slug mostly remained in the fracture area, subsequently forced intothe matrix zone after the first slug of gas was injected. This phenomenon could be explainedby considering the multi effects of viscous and capillary forces in the fractures, providingthe criteria for water penetration into the oil-saturated matrixes and producing more oil at theoutlet. This procedure was repeated with up to eight injection slugs, with the same behaviorobserved in every stage. In order to study the effect of gas injection rate, two different ratesof 6 and 12 cc/ min were utilized, with their oil recovery profiles presented in Figs. 9 and 10.
As shown, the trend of hydrocarbon recovery in both cases is the same, which totallycoincides with the above explanations. The total oil production during WAG process at lowergas injection rate is higher than the other case, a 5% increase, since more stable displacementwas maintained at the lower injection rate. Two distinct peaks were observed in both cases(Figs. 9, 10), which were due to water penetration into the different sets of matrixes, i.e.,near the injection port and close to the production outlet.
3.3.2 WAG Injection Initiated by Gas Slug
The same tests mentioned in the previous Sect. 3.3.1 were repeated here. The only differencewas in initiating the experiment with the gas slug instead of water slug. Microscopic obser-vations of the micromodels showed that after gas injection the thin film of oil between thematrix and fracture was removed. Tracing the water front movement in the fractures, showeda concave shape of the water front at the interface, confirming that the thin oil film on the
123
588 A. A. Dehghan et al.
0
2
4
6
8
10
12
14
16
Stage 1 Stage 2 Stage 3 Stage 4 Stage 5 Stage 6 Stage 7 Stage 8
Mat
rix
Oil
Rec
over
y (%
Soi)
After Water InjectionAfter Gas injectionTotal
Fig. 9 WAG injection initiated with water at water injection rate of 0.05 cc/min and gas injection rate of6 cc/min
0
2
4
6
8
10
12
14
16
Stage 1 Stage 2 Stage 3 Stage 4 Stage 5 Stage 6 Stage 7 Stage 8
Mat
rix
Oil
Rec
over
y (%
Soi)
After Water InjectionAfter Gas injectionTotal
Fig. 10 WAG injection initiated with water at water injection rate of 0.05 cc/min and gas injection rate of12 cc/min
surface had been removed from the fractures. Consequently, the next slug of water partiallypenetrated into the matrix at its initial state. One of the main observations during these sets ofexperiments concerned the formation and role of liquid bridges between the matrix blocks.Formation of the liquid bridge was one of the most effective factors for matrix sweep effi-ciency. After initial movement of water into the matrix, it was observed that a small dropletof oil initiates a narrow bridge, in the fracture between two matrix blocks. This thin path ofoil maintains a conductive route, which preserves the capillary continuity between the blocksand accelerates the oil movement between the blocks toward the production outlet. Becauseof the importance of this mechanism, several microscopic images of this phenomenon areshown in Fig. 11.
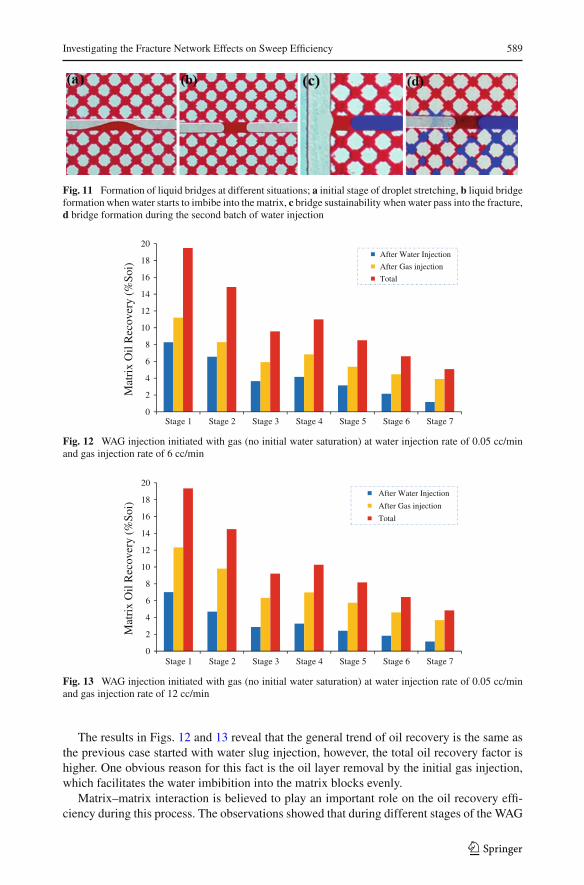
To be consistent with the other tests, these sets of experiments were also performed at twodifferent gas injection rates. Figures 12 and 13 show the incremental oil recovery during thesequential injection slugs. It is shown that oil recovery for the case of higher gas injectionrate is slightly lower than the other case. The microscopic observation showed that increas-ing the gas injection rate would remove the liquid bridges formed within the fracture andsubsequently isolate the matrix blocks.
123
Investigating the Fracture Network Effects on Sweep Efficiency 589
Fig. 11 Formation of liquid bridges at different situations; a initial stage of droplet stretching, b liquid bridgeformation when water starts to imbibe into the matrix, c bridge sustainability when water pass into the fracture,d bridge formation during the second batch of water injection
0
2
4
6
8
10
12
14
16
18
20
Stage 1 Stage 2 Stage 3 Stage 4 Stage 5 Stage 6 Stage 7
Mat
rix
Oil
Rec
over
y (%
Soi)
After Water Injection
After Gas injection
Total
Fig. 12 WAG injection initiated with gas (no initial water saturation) at water injection rate of 0.05 cc/minand gas injection rate of 6 cc/min
0
2
4
6
8
10
12
14
16
18
20
Stage 1 Stage 2 Stage 3 Stage 4 Stage 5 Stage 6 Stage 7
Mat
rix
Oil
Rec
over
y (%
Soi)
After Water Injection
After Gas injection
Total
Fig. 13 WAG injection initiated with gas (no initial water saturation) at water injection rate of 0.05 cc/minand gas injection rate of 12 cc/min
The results in Figs. 12 and 13 reveal that the general trend of oil recovery is the same asthe previous case started with water slug injection, however, the total oil recovery factor ishigher. One obvious reason for this fact is the oil layer removal by the initial gas injection,which facilitates the water imbibition into the matrix blocks evenly.
Matrix–matrix interaction is believed to play an important role on the oil recovery effi-ciency during this process. The observations showed that during different stages of the WAG
123
590 A. A. Dehghan et al.
Showing main flow direction Showing penetrated oil into the lower matrix from upper block
Oil displacing water form fracture into the matrix
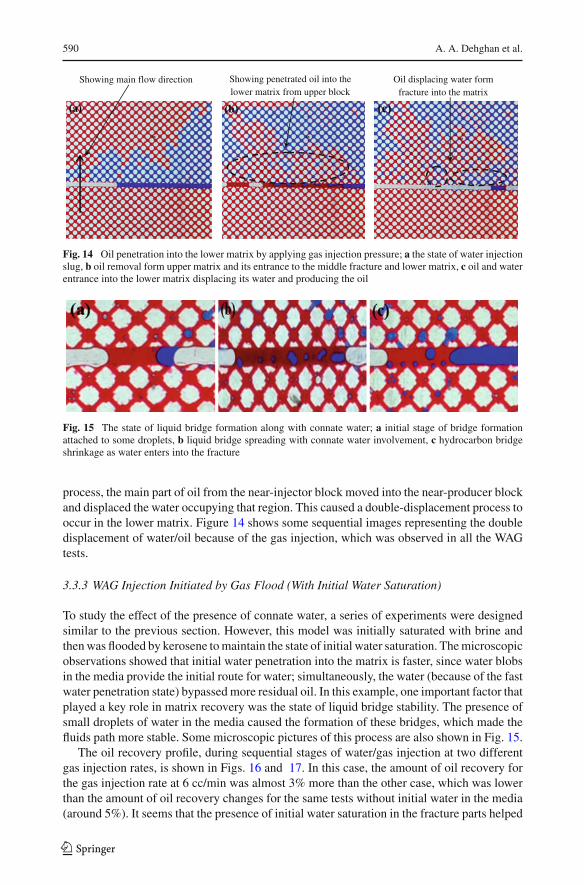
Fig. 14 Oil penetration into the lower matrix by applying gas injection pressure; a the state of water injectionslug, b oil removal form upper matrix and its entrance to the middle fracture and lower matrix, c oil and waterentrance into the lower matrix displacing its water and producing the oil
Fig. 15 The state of liquid bridge formation along with connate water; a initial stage of bridge formationattached to some droplets, b liquid bridge spreading with connate water involvement, c hydrocarbon bridgeshrinkage as water enters into the fracture
process, the main part of oil from the near-injector block moved into the near-producer blockand displaced the water occupying that region. This caused a double-displacement process tooccur in the lower matrix. Figure 14 shows some sequential images representing the doubledisplacement of water/oil because of the gas injection, which was observed in all the WAGtests.
3.3.3 WAG Injection Initiated by Gas Flood (With Initial Water Saturation)
To study the effect of the presence of connate water, a series of experiments were designedsimilar to the previous section. However, this model was initially saturated with brine andthen was flooded by kerosene to maintain the state of initial water saturation. The microscopicobservations showed that initial water penetration into the matrix is faster, since water blobsin the media provide the initial route for water; simultaneously, the water (because of the fastwater penetration state) bypassed more residual oil. In this example, one important factor thatplayed a key role in matrix recovery was the state of liquid bridge stability. The presence ofsmall droplets of water in the media caused the formation of these bridges, which made thefluids path more stable. Some microscopic pictures of this process are also shown in Fig. 15.
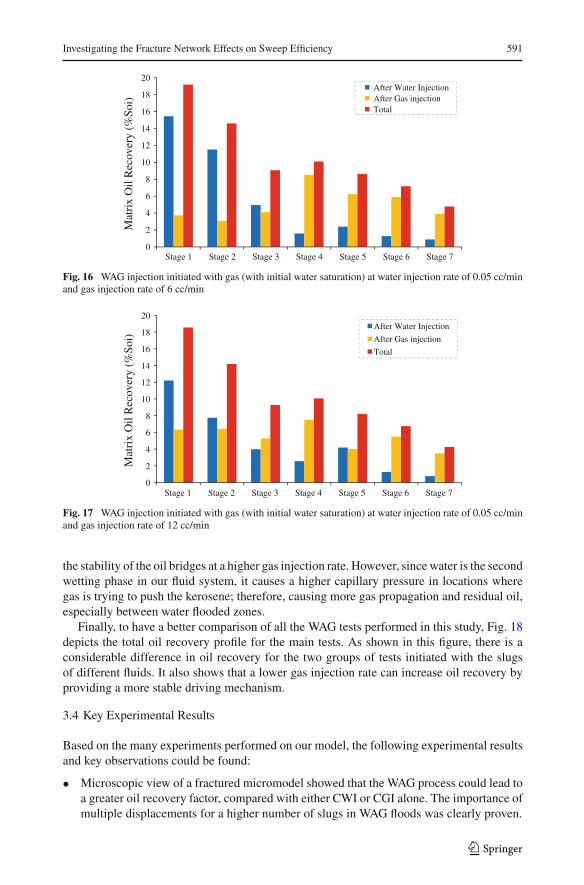
The oil recovery profile, during sequential stages of water/gas injection at two differentgas injection rates, is shown in Figs. 16 and 17. In this case, the amount of oil recovery forthe gas injection rate at 6 cc/min was almost 3% more than the other case, which was lowerthan the amount of oil recovery changes for the same tests without initial water in the media(around 5%). It seems that the presence of initial water saturation in the fracture parts helped
123
Investigating the Fracture Network Effects on Sweep Efficiency 591
0
2
4
6
8
10
12
14
16
18
20
Stage 1 Stage 2 Stage 3 Stage 4 Stage 5 Stage 6 Stage 7
Mat
rix
Oil
Rec
over
y (%
Soi)
After Water InjectionAfter Gas injectionTotal
Fig. 16 WAG injection initiated with gas (with initial water saturation) at water injection rate of 0.05 cc/minand gas injection rate of 6 cc/min
0
2
4
6
8
10
12
14
16
18
20
Mat
rix
Oil
Rec
over
y (%
Soi)
After Water Injection
After Gas injection
Total
Stage 1 Stage 2 Stage 3 Stage 4 Stage 5 Stage 6 Stage 7
Fig. 17 WAG injection initiated with gas (with initial water saturation) at water injection rate of 0.05 cc/minand gas injection rate of 12 cc/min
the stability of the oil bridges at a higher gas injection rate. However, since water is the secondwetting phase in our fluid system, it causes a higher capillary pressure in locations wheregas is trying to push the kerosene; therefore, causing more gas propagation and residual oil,especially between water flooded zones.
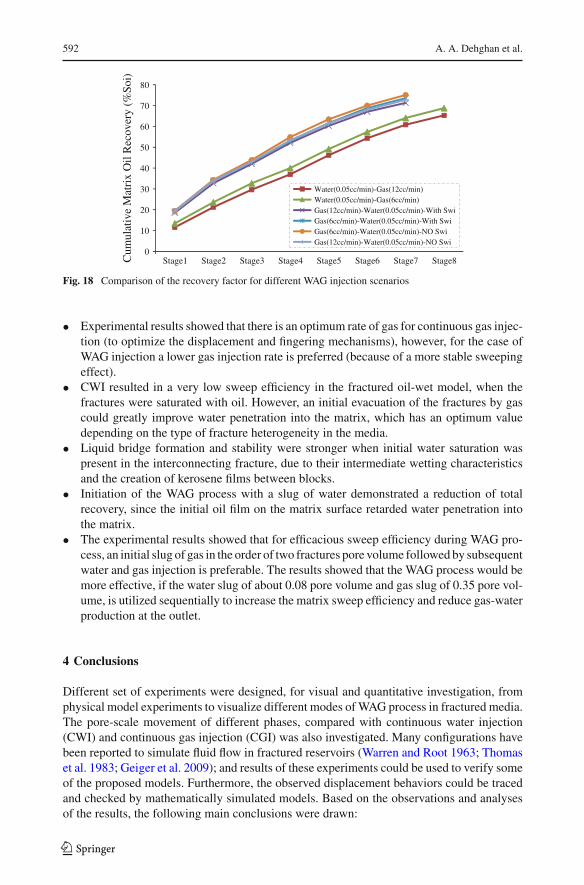
Finally, to have a better comparison of all the WAG tests performed in this study, Fig. 18depicts the total oil recovery profile for the main tests. As shown in this figure, there is aconsiderable difference in oil recovery for the two groups of tests initiated with the slugsof different fluids. It also shows that a lower gas injection rate can increase oil recovery byproviding a more stable driving mechanism.
3.4 Key Experimental Results
Based on the many experiments performed on our model, the following experimental resultsand key observations could be found:
• Microscopic view of a fractured micromodel showed that the WAG process could lead toa greater oil recovery factor, compared with either CWI or CGI alone. The importance ofmultiple displacements for a higher number of slugs in WAG floods was clearly proven.
123
592 A. A. Dehghan et al.
0
10
20
30
40
50
60
70
80
Stage1 Stage2 Stage3 Stage4 Stage5 Stage6 Stage7 Stage8Cum
ulat
ive
Mat
rix
Oil
Rec
over
y (%
Soi)
Water(0.05cc/min)-Gas(12cc/min)Water(0.05cc/min)-Gas(6cc/min)Gas(12cc/min)-Water(0.05cc/min)-With Swi Gas(6cc/min)-Water(0.05cc/min)-With SwiGas(6cc/min)-Water(0.05cc/min)-NO SwiGas(12cc/min)-Water(0.05cc/min)-NO Swi
Fig. 18 Comparison of the recovery factor for different WAG injection scenarios
• Experimental results showed that there is an optimum rate of gas for continuous gas injec-tion (to optimize the displacement and fingering mechanisms), however, for the case ofWAG injection a lower gas injection rate is preferred (because of a more stable sweepingeffect).
• CWI resulted in a very low sweep efficiency in the fractured oil-wet model, when thefractures were saturated with oil. However, an initial evacuation of the fractures by gascould greatly improve water penetration into the matrix, which has an optimum valuedepending on the type of fracture heterogeneity in the media.
• Liquid bridge formation and stability were stronger when initial water saturation waspresent in the interconnecting fracture, due to their intermediate wetting characteristicsand the creation of kerosene films between blocks.
• Initiation of the WAG process with a slug of water demonstrated a reduction of totalrecovery, since the initial oil film on the matrix surface retarded water penetration intothe matrix.
• The experimental results showed that for efficacious sweep efficiency during WAG pro-cess, an initial slug of gas in the order of two fractures pore volume followed by subsequentwater and gas injection is preferable. The results showed that the WAG process would bemore effective, if the water slug of about 0.08 pore volume and gas slug of 0.35 pore vol-ume, is utilized sequentially to increase the matrix sweep efficiency and reduce gas-waterproduction at the outlet.
4 Conclusions
Different set of experiments were designed, for visual and quantitative investigation, fromphysical model experiments to visualize different modes of WAG process in fractured media.The pore-scale movement of different phases, compared with continuous water injection(CWI) and continuous gas injection (CGI) was also investigated. Many configurations havebeen reported to simulate fluid flow in fractured reservoirs (Warren and Root 1963; Thomaset al. 1983; Geiger et al. 2009); and results of these experiments could be used to verify someof the proposed models. Furthermore, the observed displacement behaviors could be tracedand checked by mathematically simulated models. Based on the observations and analysesof the results, the following main conclusions were drawn:
123
Investigating the Fracture Network Effects on Sweep Efficiency 593
• The main cause of water penetration into the oil-wet matrix block is the driving forcegenerated by the gas injection rate. The lower gas injection rate demonstrates more stablebehavior for water displacement and lower gas production at the injection port.
• The presence of initial water in the media increases the volume of residual oil in thematrix blocks, since the rapid connection of initial water with injected water causes fastertrapping of the oil.
• Formation of the liquid bridges in interconnecting fractures greatly improves the oil sweepefficiency from the matrix blocks, by reducing capillary force in the fracture and formingcapillary continuity in the model.
• The reduction of phase continuity in weakly wetted pores, and the presence of an inter-connecting fracture, requires incorporation of double displacements for the mobilizationof disconnected phase clusters.
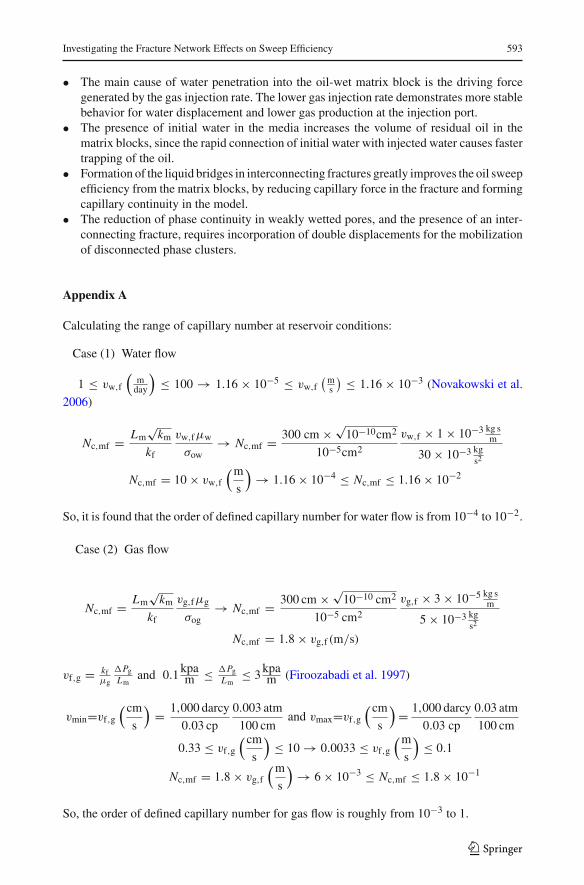
Appendix A
Calculating the range of capillary number at reservoir conditions:
Case (1) Water flow
1 ≤ vw,f
(m
day
)≤ 100 → 1.16 × 10⁻⁵ ≤ vw,f
(ms
) ≤ 1.16 × 10⁻³ (Novakowski et al.
2006)
Nc,mf = Lm√
km
kf
vw,fμw
σow→ Nc,mf = 300 cm × √
10−10cm2
10−5cm2
vw,f × 1 × 10⁻³ kg sm
30 × 10−3 kgs2
Nc,mf = 10 × vw,f
(m
s
)→ 1.16 × 10⁻⁴ ≤ Nc,mf ≤ 1.16 × 10⁻²
So, it is found that the order of defined capillary number for water flow is from 10−4 to 10−2.
Case (2) Gas flow
Nc,mf = Lm√
km
kf
vg,fμg
σog→ Nc,mf = 300 cm × √
10−10 cm2
10−5 cm2
vg,f × 3 × 10⁻⁵ kg sm
5 × 10⁻³ kgs2
Nc,mf = 1.8 × vg,f (m/s)
vf,g = kfμg
�PgLm
and 0.1 kpam ≤ �Pg
Lm≤ 3 kpa
m (Firoozabadi et al. 1997)
vmin=vf,g
(cm
s
)= 1,000 darcy
0.03 cp
0.003 atm
100 cmand vmax=vf,g
(cm
s
)= 1,000 darcy
0.03 cp
0.03 atm
100 cm
0.33 ≤ vf,g
(cm
s
)≤ 10 → 0.0033 ≤ vf,g
(m
s
)≤ 0.1
Nc,mf = 1.8 × vg,f
(m
s
)→ 6 × 10⁻³ ≤ Nc,mf ≤ 1.8 × 10⁻¹
So, the order of defined capillary number for gas flow is roughly from 10−3 to 1.
123
594 A. A. Dehghan et al.
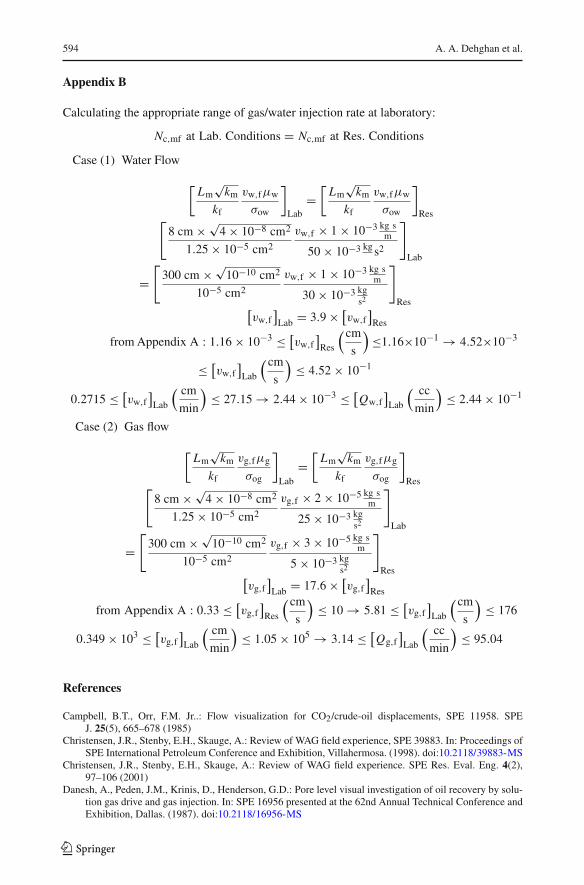
Appendix B
Calculating the appropriate range of gas/water injection rate at laboratory:
Nc,mf at Lab. Conditions = Nc,mf at Res. Conditions
Case (1) Water Flow
[Lm
√km
kf
vw,fμw
σow
]
Lab=
[Lm
√km
kf
vw,fμw
σow
]
Res[8 cm × √
4 × 10⁻⁸ cm2
1.25 × 10⁻⁵ cm2
vw,f × 1 × 10⁻³ kg sm
50 × 10−3 kg s2
]
Lab
=[
300 cm × √10−10 cm2
10−5 cm2
vw,f × 1 × 10⁻³ kg sm
30 × 10−3 kgs2
]
Res[vw,f
]Lab = 3.9 × [
vw,f]
Res
from Appendix A : 1.16 × 10⁻³ ≤ [vw,f
]Res
(cm
s
)≤1.16×10⁻¹ → 4.52×10⁻³
≤ [vw,f
]Lab
(cm
s
)≤ 4.52 × 10⁻¹
0.2715 ≤ [vw,f
]Lab
( cm
min
)≤ 27.15 → 2.44 × 10⁻³ ≤ [
Qw,f]
Lab
( cc
min
)≤ 2.44 × 10⁻¹
Case (2) Gas flow
[Lm
√km
kf
vg,fμg
σog
]
Lab
=[
Lm√
km
kf
vg,fμg
σog
]
Res[8 cm × √
4 × 10⁻⁸ cm2
1.25 × 10⁻⁵ cm2
vg,f × 2 × 10⁻⁵ kg sm
25 × 10−3 kgs2
]
Lab
=[
300 cm × √10−10 cm2
10−5 cm2
vg,f × 3 × 10⁻⁵ kg sm
5 × 10⁻³ kgs2
]
Res[vg,f
]Lab = 17.6 × [
vg,f]
Res
from Appendix A : 0.33 ≤ [vg,f
]Res
(cm
s
)≤ 10 → 5.81 ≤ [
vg,f]
Lab
(cm
s
)≤ 176
0.349 × 10³ ≤ [vg,f
]Lab
( cm
min
)≤ 1.05 × 10⁵ → 3.14 ≤ [
Qg,f]
Lab
( cc
min
)≤ 95.04
References
Campbell, B.T., Orr, F.M. Jr..: Flow visualization for CO2/crude-oil displacements, SPE 11958. SPEJ. 25(5), 665–678 (1985)
Christensen, J.R., Stenby, E.H., Skauge, A.: Review of WAG field experience, SPE 39883. In: Proceedings ofSPE International Petroleum Conference and Exhibition, Villahermosa. (1998). doi:10.2118/39883-MS
Christensen, J.R., Stenby, E.H., Skauge, A.: Review of WAG field experience. SPE Res. Eval. Eng. 4(2),97–106 (2001)
Danesh, A., Peden, J.M., Krinis, D., Henderson, G.D.: Pore level visual investigation of oil recovery by solu-tion gas drive and gas injection. In: SPE 16956 presented at the 62nd Annual Technical Conference andExhibition, Dallas. (1987). doi:10.2118/16956-MS
123
Investigating the Fracture Network Effects on Sweep Efficiency 595
Dastyari, A., Bashukooh, B., Shariatpanahi, S.F., Sahimi, M.: Visualization of gravity drainage in a fracturedsustem during gas injection using glass micromodel. In: SPE 93673 presented at 14th oil and gas showand conference, Bahrain. (2005). doi:10.2118/93673-MS
Dehghan, A.A., Farzaneh, S.A., Kharrat, R., Ghazanfari, M.H., Rashtchian, D.: Pore-level investigationof heavy oil recovery during water alternating solvent injection process. Trans. Porous Media 83(3),653–666 (2009). doi:10.1007/s11242-009-9463-5
Dehghan, A.A., Kharrat, R., Ghazanfari, M.H., Vossoughi, S.: Quantifying the role of pore geometry andmedium heterogeneity on heavy oil recovery during solvent/co-solvent flooding in water-wet systems. J.Porous Media 14(4), 363–373 (2009). doi:10.1615/JPorMedia.v14.i4.80
Dong, M., Foraie, J., Huang, S., Chatzis, I: Analysis of immiscible water-alternating-gas (WAG) injectionusing micromodels. J. Can. Petrol. Tech. 44(2), 17–25 (2005)
Firoozabadi, A., Markeset, T., Dindoruk, B.: Viscous displacement in fractured porous media. J. Can. Petrol.Tech. 36(9), 50–62. (1997). doi:10.2118/97-09-05
Geiger, S., Matthaei, S., Niessner, J., Helmig, R.: Black-oil simulations for three-component, three-phase flowin fractured porous media. SPE J. 14(2), 338–354. SPE- 107485-PA. (2009). doi:10.2118/107485-PA
Gorell, S.B.: Implications of water-alternate-gas injection, for profile control and injectivity. In: SPE 20210,Proceedings of SPE/DOE Enhanced Oil Recovery Symposium, Tulsa. (1990). doi:10.2118/20210-MS
Haghighi, M., Xu, B., Yortsos, Y.C.: Visualization and simulation of immiscible displacement in fracturedsystems using micromodels: I. drainage. J. Colloid Interface Sci. 166, 168–179 (1994)
Heeremans, J.C., Esmaiel, T.E.H., van Kruijsdijk, C.P.J.W.: Feasibility Study of WAG Injection in NaturallyFractured Reservoirs, SPE 100033. In: Proceedings of SPE/DOE Symposium on Improved Oil Recovery,Tulsa. (2006). doi:10.2118/100034-MS
Lenormand, R., Zarcone, C., Sarr, A.: Mechanisms of the displacement of one fluid by another in a networkof capillary ducts. J. Fluid Mech. 135, 337–353 (1983)
Manrique, E.J., Muci, V.E., Gurfinkel, M.E.: EOR field experiences in carbonate reservoirs in the UnitedStates. SPE Res. Eval. Eng. 10(6), 667–686 (2007)
Morrow, N.R.: Wettability and its effect on oil recovery. SPE J. Petrol. Tech. 42(12), 1476–1484 (1990)Novakowski, K., Bickerton, G., Lapcevic, P., Voralek, J., Ross, N.: Measurements of groundwater velocity in
discrete rock fractures. J. Contam. Hydrol. 82(1–2), 44–60 (2006)Prieditis, J., Wolle, C.R., Notz, P.K.: A laboratory and field injectivity study: CO2 WAG in the San Andres
formation of west Texas, SPE 22653. In: SPE Annual Technical Conference and Exhibition, Dallas.(1991). doi:10.2118/22653-MS
Rogers, J.D., Grigg, B.R.: A Literature analysis of the WAG injectivity abnormalities in the CO2 process,SPE 59329, Proceedings of SPE/DOE Improved Oil Recovery Symposium, Tulsa. (2000). doi:10.2118/59329-MS
Saidi, A.M.: Textbook of reservoir engineering of fractured reservoirs. TOTAL edition press, ISBN: 2-905143-09-6 (1987)
Shedid, A.S.: Influences of fracture orientation on oil recovery by water and polymer flooding processes: anexperimental approach. J. Pet. Sci. Eng. 50(3-4), 285–292 (2006)
Sohrabi, M., Tehrani, D.H., Danesh, A., Henderson, G.D.: Visualization of oil recovery by water-alternating-gas injection using high-pressure micromodels. SPE J. 9(3), 290–301. SPE- 89000-PA. (2004). doi:10.2118/89000-PA
Sohrabi, M., Danesh, A., Jamiolahmady, M.: Visualisation of residual oil recovery by near-miscible gas andSWAG injection using high-pressure micromodels. Trans. Porous Media 74(2), 239–257 (2008)
Thomas, L.K., Dixon, T.N., Pierson, R.G.: Fractured reservoir simulation. SPE J. 23(1), 42–54. SPE-9305-PA.(1983). doi:10.2118/9305-PA
van Dijke, M.I.J, Sorbie, K.S., Sohrabi, M., Danesh, A.: Three-phase flow WAG processes in mixed-wet porousmedia: pore-scale network simulations and comparison with water-wet micromodel experiment. SPE J.9(1), 57–66. SPE- 87822-PA. (2004). doi:10.2118/87822-PA
van Dijke, M.I.J., Sorbie, K.S., Sohrabi, M., Danesh, A.: Pore-scale modeling of three-phase flow in mixed-wetporous media: multiple displacement chains. J. Pet. Sci. Eng. 52, 71–86 (2006)
van Dijke, M.I.J., Lorentzen, M., Sohrabi, M., Sorbie, K.S.: Pore-scale simulation of wag floods in mixed-wetmicromodels. SPE J. 15(1), 238–247. SPE-113684-PA. (2010). doi:10.2118/113684-PA
Van Golt-Racht, T.D.: Textbook of Fundamentals of fractured reservoir engineering. Elsevier Scientific pub-lication, New York, ISBN: 0-444-42046-0 (1982)
Warren, J.E., Root, P.J.: The behavior of naturally fractured reservoirs. SPE J. 3(3), 245–255 (1963). doi:10.2118/426-PA
123