Embed Size (px)
Citation preview

American Journal of Mechanical and Materials Engineering 2020; 4(3): 43-47
http://www.sciencepublishinggroup.com/j/ajmme
doi: 10.11648/j.ajmme.20200403.11
ISSN: 2639-9628 (Print); ISSN: 2639-9652 (Online)
Investigating the Effects of Welding Processes on Tensile Stress and Strain Properties of Welded Mild Steel Plates Using Statistical Analysis
Oladebeye Dayo Hephzibah1, *
, Adejuyigbe Samuel Babatope2,
Olorunnishola Akim Abayomi Gideon1
1Department of Mechanical Engineering Technology, Federal Polytechnic, Ado-Ekiti, Nigeria 2Mechatronics Engineering Department, Federal University, Oye-Ekiti, Nigeria
Email address:
*Corresponding author
To cite this article: Oladebeye Dayo Hephzibah, Adejuyigbe Samuel Babatope, Olorunnishola Akim Abayomi Gideon. Investigating the Effects of Welding
Processes on Tensile Stress and Strain Properties of Welded Mild Steel Plates Using Statistical Analysis. American Journal of Mechanical
and Materials Engineering. Vol. 4, No. 3, 2020, pp. 43-47. doi: 10.11648/j.ajmme.20200403.11
Received: June 26, 2020; Accepted: July 13, 2020; Published: July 28, 2020
Abstract: As test samples, mild steel plates with thicknesses of 0.5 mm, 0.6 mm, 0.7 mm, 0.8 mm, 0.9 mm, and 1.0 mm
were made. After welding these test samples underwent Tensile Stress and strain tests with the Built Welding Robot and
Manual Electric Arc Welding Machine. Both data collected from tensile stress and tensile stress were analyzed and the data
produced from Electric Arc welding operations, the Robot welding operations and un-welded plates (control) were compared
with one another. The analyses of the data obtained from the developed welding robot, manual electric arc welding and un-
welded (control) mild steel plates of different thicknesses were carried out for tensile stress and strain. The descriptive statistics,
ANOVA analysis, test of homogeneity of Variances and Post Hoc test (Least Significant Differences) were the statistical tools
deployed using Statistical Package of Social Sciences (SPSS version 2016). The results showed that the robot welding sample
produced gave the lowest tensile stress while the un-welded samples (CONTROL) gave the highest. The un-welded
(CONTROL) samples gave the highest tensile strain values while the lowest was given by the developed robot welding
samples. Finally, it was evident from the analyses results that the welding processes have significant impact on the tensile
stress and strain properties of the welded mild steel plates and that good welding quality can be achieved more with the
developed welding robot.
Keywords: Welding Processes, Tensile Stress, Tensile Strain, Mild Steel, Statistical Analysis
1. Introduction
At weld toes the crack initiation and early propagation is
controlled by the distribution of local stress around the weld.
Its fatigue analysis and evaluation already has a very long
history [1]. Several researchers, including Peterson, Manson
and Haibach, carried out initial investigations in the 1960's to
link the frequency of fatigue to a local stress or strain
measured at a certain point close to the weld toe, for example
at a distance of 2 mm [2]. While the characteristic strength of
fatigue associated with this local stress shows a relatively
low dispersion, it has been shown that it is indeed influenced
by the local notch at the weld toe and is not independent of
the local notch geometry [3]. Studies of relatively thick
tubular joints found that the local notch effect of the weld toe
has an effect on the stress in the region up to 0.3-0.4·t (t-plate
thickness) away from the weld toe. This led to the
development of the well-known hot-spot stress method in the
1970s, with the concept of reference points for stress
assessment and extrapolation at certain distances away from
the weld, which depend on the thickness of the plate or shell.
This research investigation showed that the assessment of
tubular joints fatigue strength due to their complex joint
geometry and high local bending of the tubular walls was
effective [4].
Early 1980s also saw first attempts to apply the technique
44 Oladebeye Dayo Hephzibah et al.: Investigating the Effects of Welding Processes on Tensile Stress and Strain
Properties of Welded Mild Steel Plates Using Statistical Analysis
to welded joints on boards. Due to the local structural
geometry of ship hull data, remarkable investigations were
carried out in Japan to examine the stress concentration [5].
The construction stress was obtained by linearization of the
stress via the thickness of the plate from finite-element
analyses. Some investigations described structural stress at
the hot spot (welded toe) as the surface stress that can be
measured at the hot spot in accordance with the theories used
in engineering structures [6]. He has shown that structural
stress can be evaluated either by surface extrapolation or
linearization, e.g. through the thickness of the wall, to
exclude the local non-linear stress peak caused by the weld
toe.
A generalized hot-spot stress approach was developed for
plate structures in the early 1990's using Radaj's efficient
noch stress approach and applied it to complex welded
structures [7, 8]. Specific guidelines on the determination of
stress for fatigue analysis of welded components were
provided. However, some experiments showed that the
resulting stresses are still influenced by the meshing of finite
elements and the properties of elements [9]. Additional
recommendations were provided for finite element modeling
and hot-spot stress assessment, the latter based on detailed
round-robin stress analysis of several aspects. For in-plane
notches such as welded edge gussets, where plate thickness is
no longer a valid parameter for defining the reference points
for stress evaluation, special considerations have been shown
to be important [10, 11]. In these cases, alternate methods
were suggested for the hot-spot stress analysis, using
absolute distances for the reference points [12, 13]. A
systematic guidance for an approach to structural hot-spot
stress is currently being prepared [14].
Radaj's structural stress description (1990) was used to
measure the structural stress directly from the finite-element
results at the weld toe position using elementary structural
mechanics principles [15]. Several say and prove
insensitivity to the mesh, however, mainly on 2D basic joints
[15, 16]. The various approaches for structural stress
assessment were explained in more detail and contrasted with
each other. Afterwards, numerous 2D and 3D examples
demonstrated their implementation, demonstrating the
similarity of the approaches and addressing the question, how
far mesh-insensitivity can be achieved [17]. It has been
emphasized that the structural stress approach was limited to
the fatigue strength assessment of weld toes, where cracks
start from the surface of the structure [18]. Cracks beginning
from the root are not protected by completely penetrated
welds and require a separate evaluation method [19].
Statistics is an integral component of engineering research
from concept initiation to project reporting and it affects all
facets of the research process, from data collection and
management to review and interpretation. The application of
statistics to the welding sciences, and especially in our area
of interest, has become more widespread and complex to
investigate the effects of welding processes on tensile stress
and strain properties of welded mild steel plates.
Statistical methods involved in conducting a study include
the planning, design, data collection, analysis, meaningful
interpretation and reporting of the research findings. The
statistical analysis gives value to the meaningless numbers,
breathing life into useless results. The findings and
inferences are correct only when use is made of proper
statistical tests. This article will attempt to familiarize the
reader with the basic methods of science adopted while
performing this science.
2. Instruments Deployed for the
Experiments
The following instrument was deployed for carrying out
experiments of mechanical properties on the welded and un-
welded mild steel plates of different thickness as shown in
Figure 1 [20].
Figure 1. Universal Instron Machine, Model 3369, Maker (Instron).
3. Tensile Test on Different Thicknesses
of Mild Steel Plate Specimens with
Manual, Developed Robot Welding
and Control Operations
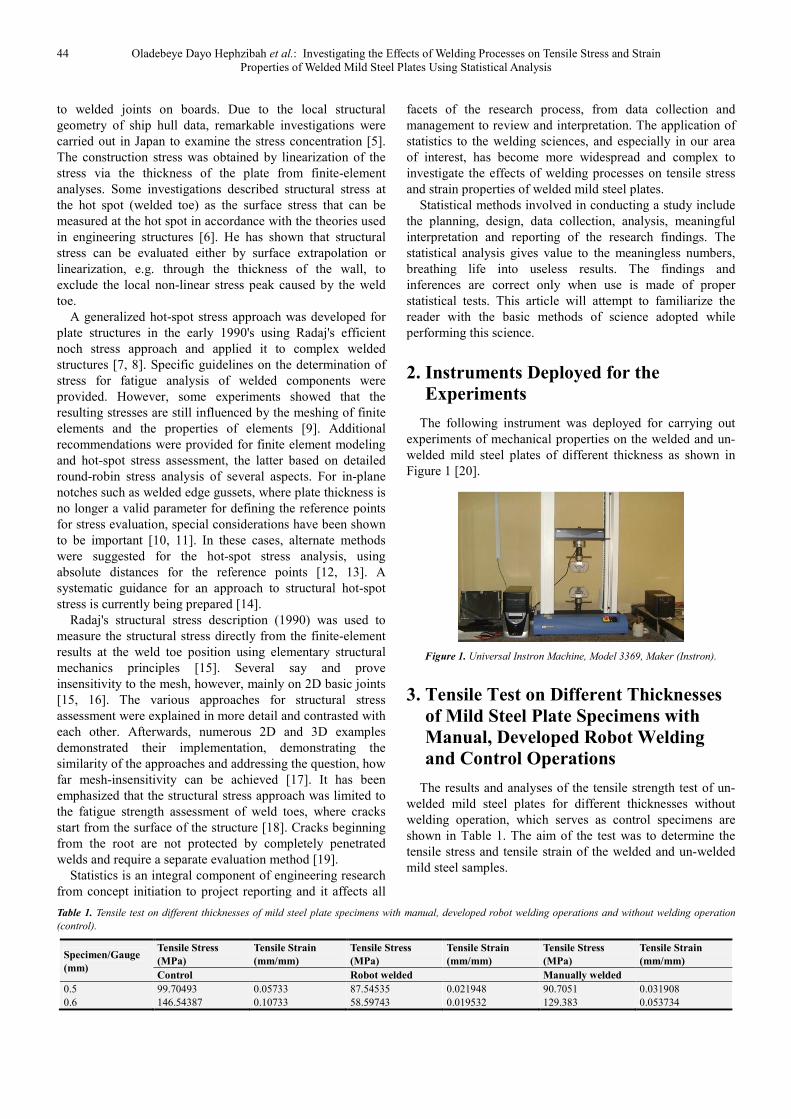
The results and analyses of the tensile strength test of un-
welded mild steel plates for different thicknesses without
welding operation, which serves as control specimens are
shown in Table 1. The aim of the test was to determine the
tensile stress and tensile strain of the welded and un-welded
mild steel samples.
Table 1. Tensile test on different thicknesses of mild steel plate specimens with manual, developed robot welding operations and without welding operation
(control).
Specimen/Gauge
(mm)
Tensile Stress
(MPa)
Tensile Strain
(mm/mm)
Tensile Stress
(MPa)
Tensile Strain
(mm/mm)
Tensile Stress
(MPa)
Tensile Strain
(mm/mm)
Control Robot welded Manually welded
0.5 99.70493 0.05733 87.54535 0.021948 90.7051 0.031908
0.6 146.54387 0.10733 58.59743 0.019532 129.383 0.053734

American Journal of Mechanical and Materials Engineering 2020; 4(3): 43-47 45
Specimen/Gauge
(mm)
Tensile Stress
(MPa)
Tensile Strain
(mm/mm)
Tensile Stress
(MPa)
Tensile Strain
(mm/mm)
Tensile Stress
(MPa)
Tensile Strain
(mm/mm)
Control Robot welded Manually welded
0.7 175.13934 0.11200 109.8256 0.016946 125.627 0.03533
0.8 212.69445 0.17067 136.078 0.028058 177.957 0.085466
0.9 269.31944 0.14333 222.047 0.0134 234.374 0.050264
1.0 303.98739 0.19733 129.6537 0.030838 279.6685 0.045502
Figure 2 shows variation in tensile stress on weld and un-
welded mild steel plates (specimens) of different sizes in
which the un-welded (CONTROL) samples gave the highest.
Developed robot welding sample gave the lowest. This was
expected of the developed robot welding samples given their
comparatively higher hardness and lower extension values
over both the electric arc welding and un-welded
(CONTROL) Samples.
Figure 2. Tensile Stress of Welded and Un-welded Mild Steel Plate Specimen for the Tensile Strength Test.
Figure 3 shows the variation in tensile strain on welded
and un-welded mild steel plates (specimens) of different sizes
in which the un-welded (CONTROL) samples gave the
highest values while developed robot welding samples gave
the lowest. This was expected since developed robot welding
samples had comparatively higher hardness, lower extension
and lower tensile stress values over both the electric arc
welding and un-welded (CONTROL) values.
Figure 3. Tensile Strain of Welded and Un-welded Mild Steel Plate Specimen for the Tensile Strength Test.
4. Statistical Analyses Results and
Discussion
The statistical tools adopted in this research include;
descriptive statistics, ANOVA analysis, test of homogeneity
of Variances and Post Hoc test (Least Significant Differences)
while the software deployed for the analysis is Statistical
Package of Social Sciences (SPSS version 2016).
4.1. Statistical Analysis of the Tensile Stress of Welded and
Un-Welded Mild Steel Plate Specimens
Tables 2, 3 and 4 show the statistical analysis of the tensile
stress of welded and un-welded mild steel plate specimens.
Table 2 reveals the descriptive statistics of the tensile stress
in which the developed robot welding samples collectively
have the lowest mean value of 123.96, standard deviation
value of 55.85 and variance value of 3119.22. Table 3 shows
homogeneity of variance among tensile stresses of the

46 Oladebeye Dayo Hephzibah et al.: Investigating the Effects of Welding Processes on Tensile Stress and Strain
Properties of Welded Mild Steel Plates Using Statistical Analysis
samples in which the result reveals that there is no variation
in the tensile stresses among the tests of the samples since p-
value is 0.526. Table 4 shows in the ANOVA test result that
there is no significant difference in the tensile stresses of the
samples since p-value is 0.185.
Table 2. Descriptive Statistics of the Tensile Stress of the Samples.
N Mean Std.
Deviation Variance
Std.
Error
95% Confidence Interval for Mean Minimum Maximum
Lower Bound Upper Bound
Control 6 201.23 76.56 5861.43 31.26 120.89 281.57 99.70 303.99
Electric Arc Welding 6 171.61 74.12 5493.77 30.26 93.83 249.39 82.66 279.67
Developed Robot Welding 6 123.96 55.85 3119.22 22.80 65.35 182.57 58.60 222.05
Total 18 165.60 73.01 5330.46 17.21 129.30 201.91 58.60 303.99
Table 3. Test of Homogeneity of Variances among Tensile Stress of the Samples.
Levene Statistic df1 df2 Sig. (p-value)
0.671 2 15 0.526
Table 4. ANOVA Test of the Tensile Stress of the Samples.
Sum of Squares Df Mean Square F calc. Sig. (p-value) F critical
Between Groups 18237.16 2 9118.58 1.89 0.185 3.68
Within Groups 72371.16 15 4824.74
Total 90608.32 17
4.2. Statistical Analysis of the Tensile Strain of Welded and
Un-Welded Mild Steel Plate Specimens
Tables 5, 6, 7 and 8 show the statistical analysis of the tensile
strain of welded and un-welded mild steel plate specimens.
Table 5 reveals the descriptive statistics of the tensile strain in
which the developed robot welding samples collectively have
the lowest mean value of 0.022, standard deviation value of
0.007 and variance value of 0.001. Table 6 shows homogeneity
of variance among tensile strains of the samples in which the
result reveals that there is variation in the tensile strains among
the tests of the samples since p-value is 0.008.
Table 7 shows in the ANOVA test result that there is
significant difference in the tensile strains of the samples in
which developed robot welding operation gave the lowest
tensile strains compared with electric arc welding and un-
welded (CONTROL) since p-value is 0.001. Table 8 shows the
mean difference of -0.109 between developed robot welding
and un-welded (CONTROL) samples and -0.028 between
developed robot welding and electric arc welding samples.
Table 5. Descriptive Statistics of the Tensile Strain of the Samples.
N Mean Std.
Deviation Variance
Std.
Error
95% Confidence Interval for Mean Minimum Maximum
Lower Bound Upper Bound
Control 6 0.131 0.050 0.0025 0.020 0.079 0.184 0.057 0.197
Electric Arc Welding 6 0.050 0.019 0.0004 0.008 0.030 0.070 0.030 0.085
Developed Robot Welding 6 0.022 0.007 0.0001 0.003 0.015 0.029 0.013 0.031
Total 18 0.068 0.056 0.0036 0.013 0.040 0.096 0.013 0.197
Table 6. Test of homogeneity of variances among Tensile Strain of the samples.
Levene Statistic df1 df2 Sig. (p-value)
6.724 2 15 0.008
Table 7. ANOVA Test of the Tensile Strain of the Samples.
Sum of Squares Df Mean Square F calc. Sig. (p-value) F critical
Between Groups 0.039 2 0.019 19.84 0.001 3.68
Within Groups 0.015 15 0.001
Total 0.053 17
Table 8. Post Hoc test: Least Significant Differences (LSD) for Tensile Strain multiple Comparisons between the Samples.
(I) Samples (J) Samples Mean Difference
(I-J) Std. Error
Sig. (p-
value)
95% Confidence Interval for Mean
Lower Bound Upper Bound
Control Electric Arc Welding 0.081* 0.018 0.001 0.043 0.120
Developed Robot Welding 0.109* 0.018 0.001 0.071 0.148
Electric Arc Welding Control -0.081* 0.018 0.001 -0.120 -0.043
Developed Robot Welding 0.028 0.018 0.139 -0.010 0.067
Developed Robot Welding Control -0.109* 0.018 0.001 -0.148 -0.071
Electric Arc Welding -0.028 0.018 0.139 -0.067 0.010

American Journal of Mechanical and Materials Engineering 2020; 4(3): 43-47 47
5. Conclusion
The robot welding sample produced gave the lowest
tensile stress while the un-welded samples (CONTROL)
gave the highest. The un-welded (CONTROL) samples gave
the highest tensile strain values while the lowest was given
by the developed robot welding samples. This implies that
the ratio of the deformation to the initial dimension of the
material is lesser with the developed robot welding samples
when compared with the manual arc welding samples and the
un-welded samples. While the un-welded samples exhibited
the highest amount of deformation under stress. Therefore, it
is evident that the welding processes have significant impact
on the tensile stress and strain properties of the welded mild
steel plates and that good welding quality can be achieved
more with the developed welding robot.
6. Recommendation
For a minimum deformation and a good arc welding quality,
the developed welding robot with its comparative advantages is
therefore recommended for automation of welding processes.
References
[1] Radaj, D. and Sonsino, C. M. (1998). Fatigue assessment of welded joints by local approaches. Cambridge: Abington Publication.
[2] Haibach, E. (1968). Fatigue Strength of Welded Joints from Viewpoint of Local Strain Measurement (in German). Report FB-77, Fraunhofer- Institut fu¨r Betriebsfestigkeit (LBF), Darmstadt.
[3] Atztori, G. and Meneghetti, G. (2001). Fatigue strength of filled welded structural steels: finite elements, strain gauges and reality. International Journal of Fatigue, 23: 713–21.
[4] van Wingerde, A. M., Packer, J. A. and Wardenier, J. (1995). Criteria for the fatigue assessment of hollow structural section connections. J Construct Steel Res; 35: 71–115.
[5] Matoba, M., Kawasaki, T., Fujii, T. and Yamauchi, T. (1983). Evaluation of fatigue strength of welded structures—hull’s members, hollow section joints, piping and vessel joints. IIW-Doc. XIII-1082-83, International Institute of Welding.
[6] Radaj, D. (1990). Design and analysis of fatigue-resistant welded structures. German Edition: DVS-Verlag, Du¨sseldorf 1985; English Edition: Abington Publ., Cambridge.
[7] Petershagen, H., Fricke, W. and Massel, T. (1991). Application of the local approach to the fatigue strength assessment of
welded structures in ships. IIW Doc. XIII-1409-91, International Institute of Welding.
[8] Fricke, W. and Petershagen, H. (1992). Detail design of welded ship structures based on hot spot stresses. In: Caldwell JB, Ward G, editors. Practical design of ships and mobile units. Elsevier Science.
[9] Niemi, E. (1995). Recommendations concerning stress determination for fatigue analysis of welded components. Cambridge: Abington Publication.
[10] Huther, I., Gorski, S., Lieurade, H. P., Laborde, S. and Recho, N. (1999). Longitudinal non loaded welded joints geometrical stress approach. Welding in the World, 43 (3): 20–6.
[11] Fricke, W. (2002). Recommended hot spot analysis procedure for structural details of ships and FPSOs based on round-robin FE analyses. International Journal of Offshore and Polar Engng, 12 (1): 40–7.
[12] Niemi, E. and Tanskanen, P. (2000). Hot spot stress determination for welded edge gussets. Welding in the World; 44 (5): 31–7.
[13] Fricke, W. and Bogdan, R. (2001). Determination of hot spot stress in structural members with in-plane notches using a coarse element mesh. IIW-Doc. XIII-1870-01, International Institute of Welding.
[14] Niemi, E. (2001). Structural Stress Approach to Fatigue Analysis of Welded Components—Designer’s Guide. IIW- Doc. XIII-1819-00/XV-1090-01 (Final Draft), International Institute of Welding.
[15] Dong, P. (2001). A structural stress definition and numerical implementation for fatigue analyses, International Journal of Fatigue, 23 (10): 865–76.
[16] Dong, P., Hong, J. K. and Cao, Z. (2001). A mesh- insensitive structural stress procedure for fatigue evaluation of welded structures. IIW- Doc. XIII-1902-01/XV-1089- 01, International Institute of Welding.
[17] Doerk, O. Fricke, W. and Weissenborn, C. (2003). Comparison of different calculation methods for structural stresses at welded joints, International Journal of Fatigue, 25: 359–369.
[18] Kim, W. S., Kim, D. H, Lee, S. G. and Lee, Y. K. (2001). Fatigue strength of load carrying box fillet weldment in ship structure. In: Wu Y-S, Cui W-C, Zhou G-J, editors. Practical design of ships and other floating structures. Elsevier Science.
[19] Paetzold, H. and Doerk, O. and Kierkegaard, H. (2001). Fatigue behaviour of different bracket connectons. In: Wu Y-S, Cui W-C, Zhou G-J, editors. Practical design of ships and other floating structures (Ed. Elsevier).
[20] Oladebeye, D. H., Adejuyigbe, S. B. and Kareem, B. (2020). Metallurgical Analyses of Welding Using a Developed Mini-Robot. American Journal of Mechanical and Materials Engineering, 4 (2): 26-36.