Embed Size (px)
Citation preview
University of Arkansas, Fayetteville University of Arkansas, Fayetteville
ScholarWorks@UARK ScholarWorks@UARK
Theses and Dissertations
12-2019
Investigating Egg Storage Conditions, Hatch Characteristics, and Investigating Egg Storage Conditions, Hatch Characteristics, and
Feeding Methods of Commercially Produced Poultry Feeding Methods of Commercially Produced Poultry
Joshua R. Deines University of Arkansas, Fayetteville
Follow this and additional works at: https://scholarworks.uark.edu/etd
Part of the Animal Studies Commons, Poultry or Avian Science Commons, and the Veterinary
Physiology Commons
Citation Citation Deines, J. R. (2019). Investigating Egg Storage Conditions, Hatch Characteristics, and Feeding Methods of Commercially Produced Poultry. Theses and Dissertations Retrieved from https://scholarworks.uark.edu/etd/3450
This Dissertation is brought to you for free and open access by ScholarWorks@UARK. It has been accepted for inclusion in Theses and Dissertations by an authorized administrator of ScholarWorks@UARK. For more information, please contact [email protected].
Investigating Egg Storage Conditions, Hatch Characteristics, and Feeding Methods
of Commercially Produced Poultry
A dissertation submitted in partial fulfillment
of the requirements for the degree of
Doctor of Philosophy in Poultry Science
by
Joshua R. Deines
Colorado State University
Bachelor of Science in Animal Science and Agricultural Education, 2014
December 2019
University of Arkansas
This dissertation is approved for recommendation to the Graduate Council.
____________________________________
Samuel J. Rochell, Ph.D.
Dissertation Director
____________________________________ ____________________________________
F. Dustan Clark, Ph.D. Edward E. Gbur, Ph.D.
Committee Member Committee Member
____________________________________
Bob Wideman, Ph.D.
Committee Member
ABSTRACT
Advancements in poultry research continue to add knowledge and understanding to an
already technical industry. Such information has led to new developments in early feeding
strategies which provide nutrients to broiler chicks while in the egg or during transport. This
wealth of knowledge in poultry research extends beyond chickens and is utilized for other
species, such as quail and pheasants, including how fertile eggs are stored and incubated.
However, methods of early feeding broilers have not been investigated in industry relevant
approaches to understand its effects, including how timing of feed access interacts with the hatch
window. As well, quail and pheasant producers currently utilize modified chicken protocols for
storing eggs and are in need of species specific data. Therefore, 2 major projects comprised of 5
experiments were designed to investigate egg storage conditions, hatch characteristics, and
feeding methods of commercially produced poultry.
In the first series of experiments, fertile eggs from Japanese (Coturnix) Quail, Coturnix
coturnix japonica and Ring-necked (Common) Pheasant, Phasianus colchicus, were subjected to
a range of egg storage temperatures (10.0, 12.8, 15.6, 18.3, and 21.1°C or 50, 55, 60, 65, and
70°F) to observe the effects on hatching and production traits. It was confirmed that the
temperature of egg storage plays a significant role in the hatch of fertile, which was highest at
10.0 and 12.8°C for the pheasants and was similar for quail.
The second series of experiments investigated the effects of hatch window and nutrient
access in the hatcher on performance and processing yield of broilers. This was accomplished by
utilizing experimental hatching baskets: control hatching baskets with no nutrients provided or
baskets equipped to provide access to feed and water. Chicks were also identified according to
their time of hatch within a 24 h hatch window period. These findings indicated that chicks from

different hatch window periods are physiologically unique. Furthermore, nutrient access in the
hatcher may reduce weight loss in the hatcher, especially for early hatching chicks, and increase
body weight during the first 7 to 28 d of growth, but has no influence on subsequent performance
or processing yields.

© 2019 by Joshua R. Deines
All Rights Reserved
ACKNOWLEDGEMENTS
I would like to express special gratitude to my major professor, Dr. Samuel J. Rochell,
for his guidance throughout my PhD graduate program. His advice and teachings have helped me
grow as a person and as a researcher. This accomplishment would not have been possible
without his support, especially during the challenging times.
Appreciation is extended to my dissertation advisory committee members for their advice
during my research and writing process: Dr. Samuel J. Rochell, Dr. F. Dustan Clark, Dr. Edward
E. Gbur, and Dr. Bob Wideman. Also to Dr. Dan Donoghue who served on the committee during
my preliminary examinations and to Dr. Thomas S. Whiting who has been a supportive mentor.
I wish to thank Dr. R. Keith Bramwell who encouraged me to pursue a PhD and allowed
me that opportunity at the University of Arkansas. His vast knowledge of all things poultry and
ability to share that information in an enjoyable and passionate way has been an inspiration to
me. He has been more than generous in providing me opportunities to be a part of his work and
the poultry industry through hands-on experience, professional introductions, and invitations to
present.
The friendship, hard work, and assistance of those around me at the university have been
an immense help in completing research trials and has not gone unnoticed. Doug Yoho, Laura
Chick, Rodney Wolfe, and the rest of the “crew” at the farm, processing plant, and feed mill
have made work at the research farm enjoyable and they have put in extra effort to ensure my
success. On campus, Gary Davis, Sara Landis, Donna Delozier, and many others have
contributed to enjoyable memories and supported my efforts. My graduate student colleagues,
whom I look forward to working with “on the other side”, have provided an enjoyable learning
and working atmosphere.

Most importantly, I want to thank my family for continuously supporting me in my
personal and professional endeavors. Their encouragement throughout life has been the biggest
contributor to reaching this point in my education. They truly care about me and show that daily.
Through their examples, they instilled in me values of hard work and honesty, but most
importantly they have shown me what is most important in life: faith and family.
As iron sharpens iron, so one man sharpens another.
– Proverbs 27:17 (NIV)
DEDICATION
I dedicate this dissertation to my wonderful wife, Brittany R. Deines. She is the steadfast
support that has allowed me to accomplish this achievement and overcome any challenge we
encounter. Her constant love and faithfulness make everyday a joy and a blessing. She has
integrity that is unmatched and her joyful character is an inspiration to everyone.
In addition, I dedicate this dissertation to the loved ones lost during my time in graduate
school:
My father, Richard (Dick) D. Deines (December 8, 1947 – April 19, 2018)
My sister-in-law, Caitlyn M. Lear (July 30, 1998 - July 4, 2018)
My grandfather, Joseph (J.D.) D. Herman (September 6, 1927 – May 5, 2019)
For God so loved the world that he gave his one and only Son, that whoever believes in him shall
not perish but have eternal life.
– John 3:16 (NIV)
TABLE OF CONTENTS
I. INTRODUCTION AND LITERATURE REVIEW ..............................................................1
A. Introduction ..............................................................................................................2
B. Literature Review Overview ....................................................................................3
C. Embryo Development ..............................................................................................4
D. Egg Storage ............................................................................................................13
E. Early Feeding .........................................................................................................18
F. References ..............................................................................................................25
II. MANUSCRIPT: Effects of egg storage temperature on quail and pheasant production .....31
A. Abstract ..................................................................................................................32
B. Introduction ............................................................................................................33
C. Materials and Methods ...........................................................................................34
D. Results and Discussion ..........................................................................................38
E. Conclusions and Applications ................................................................................41
F. Acknowledgments..................................................................................................41
G. References ..............................................................................................................42
H. Tables .....................................................................................................................44
III. MANUSCRIPT: Effects of hatch window and nutrient access in the hatcher on
performance and processing yield of broiler chicks reared according to time of hatch .......47
A. Abstract ..................................................................................................................48
B. Introduction ............................................................................................................49
C. Materials and Methods ...........................................................................................51
D. Results and Discussion ..........................................................................................54
E. Acknowledgments..................................................................................................60
F. References ..............................................................................................................61
G. Tables .....................................................................................................................63
IV. MANUSCRIPT: Effects of hatch window and nutrient access in the hatcher on
performance and processing yield of broiler chicks reared with equal hatch window
representation ........................................................................................................................71
A. Abstract ..................................................................................................................72
B. Introduction ............................................................................................................73
C. Materials and Methods ...........................................................................................74
D. Results ....................................................................................................................78
E. Discussion ..............................................................................................................80
F. Acknowledgments..................................................................................................83
G. References ..............................................................................................................84
H. Tables .....................................................................................................................85
V. CONCLUSIONS ..................................................................................................................93
APPENDIX ...........................................................................................................................95
LIST OF TABLES
Table 2.1 Hatch characteristics, chick quality, and performance resulting from quail eggs
stored at different temperatures ................................................................................45
Table 2.2 Hatch characteristics, incidence of malposition and anomaly, and chick quality
resulting from pheasant eggs stored at different temperatures .................................46
Table 2.3 Performance characteristics of pheasants hatching from eggs stored at different
temperatures ..............................................................................................................47
Table 3.1 Ingredient and calculated nutrient composition of common diets ............................65
Table 3.2 Effects of hatch window period (HWP) and nutrient access of feed and water
(FAW) or control (CTL) in the hatching basket on body weight (BW) and BW
change of broiler chicks ............................................................................................66
Table 3.3 Effects of hatch window period (HWP) and nutrient access of feed and water
(FAW) or control (CTL) in the hatching basket on body, yolk, and liver weights of
3 d old broiler chicks ................................................................................................67
Table 3.4 Live performance of broilers from different hatch window periods (HWP) within a
single hatch window provided feed and water (FAW) in the hatching basket
compared to a control (CTL) from 0 to 21 d post-hatch ...........................................68
Table 3.5 Live performance of broilers from different hatch window periods (HWP) within a
single hatch window provided feed and water (FAW) in the hatching basket
compared to a control (CTL) from 0 to 42 d post-hatch ...........................................69
Table 3.6 Body weight coefficient of variation (CV) and cumulative mortality of broilers from
different hatch window periods (HWP) within a single hatch window provided feed
and water (FAW) in the hatching basket compared to a control (CTL) ...................70
Table 3.7 Processing weight and yield of broilers from different hatch window periods (HWP)
within a single hatch window provided feed and water (FAW) in the hatching
basket compared to a control (CTL) .........................................................................71
Table 3.8 Processing weight and yield of broilers from different hatch window periods (HWP)
within a single hatch window provided feed and water (FAW) in the hatching
basket compared to a control (CTL) .........................................................................72
Table 4.1 Ingredient and calculated nutrient composition of common diets ............................88
Table 4.2 Effects of hatch window period (HWP) and nutrient access of feed and water
(FAW) or control (CTL) in the hatching basket on body, yolk, and liver weights of
day-old old broiler chicks .........................................................................................89
Table 4.3 Effects of hatch window period (HWP) and nutrient access of feed and water
(FAW) or control (CTL) in the hatching basket on body, yolk, and liver weights of
3 d old broiler chicks ................................................................................................90
Table 4.4 Body weight (g) of broilers from different hatch window periods (HWP) within a
single hatch window provided feed and water (FAW) in the hatching basket
compared to a control (CTL) ....................................................................................91
Table 4.5 Live performance of broilers provided feed and water (FAW) nutrient access in the
hatching basket compared to a control (CTL) from 0 to 42 d post-hatch .................92
Table 4.6 Body weight coefficient of variation (CV) and cumulative mortality of broilers from
different hatch window periods (HWP) within a single hatch window provided feed
and water (FAW) in the hatching basket compared to a control (CTL) ...................93
Table 4.7 Processing weight and yield of broilers from different hatch window periods (HWP)
within a single hatch window provided feed and water (FAW) in the hatching
basket compared to a control (CTL) .........................................................................94
Table 4.8 Processing weight and yield of broilers from different hatch window periods (HWP)
within a single hatch window provided feed and water (FAW) in the hatching
basket compared to a control (CTL) .........................................................................95
ABREVIATIONS
AMEn .........................nitrogen-corrected apparent metabolizable energy
ANOVA .....................analysis of variance
BW .............................body weight
BWG ..........................body weight gain
CTL ............................control
CV ..............................coefficient of variation
d..................................day
FAW ...........................feed and water
FCR ............................feed conversion ratio
FI ................................feed intake
ft .................................foot
g..................................gram
h..................................hour
HOF............................hatch of fertile
HWP ...........................hatch window period
IU ...............................international units
ICU .............................international chick units
kcal .............................kilocalorie
kg................................kilogram
m ................................meter
mg ..............................milligram
mL ..............................milliliter
r2 .................................coefficient of determination, simple
SEM ...........................standard error of the mean
TSAA .........................total sulfur amino acids
wk ...............................week
°C ...............................degrees Celsius
°F ................................degrees Fahrenheit

1
CHAPTER I
INTRODUCTION AND LITERATURE REVIEW

2
INTRODUCTION
Poultry production practices have significantly changed over the decades and continue to
advance in efficiency as a result of new knowledge derived from research and industry efforts.
Integration of chicken production segments has allowed the industry to increase in scale, making
chicken more affordable and the most consumed animal protein worldwide. An improved
understanding of chicken biology has led to management decisions to not only meet the needs of
the birds, but to improve their genetic potential. Production of other poultry species, such as the
Ring-necked (Common) Pheasant and Japanese (Coturnix) Quail have followed similar
progressions, but still remain as unique sectors of the poultry industry.
Although humans have been artificially hatching poultry eggs for centuries, the process
continues to evolve. In current commercial and hobby operation there is an increased necessity,
and ability, to store eggs prior to hatching. The storage of chicken eggs is a common practice that
is relatively well understood compared to that of quail and pheasant species, which tend to mimic
practices utilized in chicken systems. Just as chicken production has increased in size and
efficiency, quail and pheasant operations strive to make similar improvements, and this will
require research specific to these species.
Lesser researched subtopics of poultry will become the novel findings in today’s poultry
sciences such as the spread of hatch within a set of eggs, also called the hatch window. The hatch
window is known to impact broiler performance; however, how it relates to specific birds from
within that hatch are less understood. Other topics, such as fasting, have been thoroughly
researched and continue to show the negative effects of fasting chicks and has therefore
increased interest in providing nutrients to chicks before they leave the hatchery. Such methods
of “early feeding” have been making headlines in industry meetings and research journals. The
3
next progression in understanding early feeding and its impact on production requires
investigating specific methods such as hatching basket feeding and its interaction with the hatch
window.
As such the objectives of this collective dissertation are as follows:
1. Investigate the effects of egg storage temperature on pheasant and quail
production to establish an optimum storage temperature for commercial
operations.
2. Investigate how the hatch window impacts specific chicks from a hatch in
subsequent broiler performance and investigate the performance of broilers from
different hatch times reared together and separately.
3. Investigate the effects of providing nutrients to chicks in the hatcher, a method of
early feeding, and determine its implications on broiler performance and
processing yield. Investigate the interaction of hatch window and nutrient access
in the hatchery.
LITERATURE REVIEW OVERVIEW
The goal of this literature review is to provide background information, summarize
previous research, and highlight voids in the topics of embryo development, egg storage, and
early feeding. Literature on these subjects predominantly involves knowledge of chickens
(Gallus gallus domesticus) due to their history as a research model and industry significance;
however, it is important to discuss other species of interest to this dissertation: Ring-necked
(Common) Pheasant (Phasianus colchicus) and Japanese (Coturnix) Quail (Coturnix coturnix
japonica). The information described herein this review is assumed to refer to chickens, unless
otherwise noted.
4
EMBRYO DEVELOPMENT
Structure and composition of the egg
The avian egg is a collection of unique components, which together are purposed for
reproduction and the support of an embryo. Broadly, the egg consists of three separate
components: yolk, albumen, and shell (organic matrix and crystalline shell). The yolk hosts the
living cells and provides nutrients for the developing embryo, the albumen also serves as a
nutrient source and acts as a physiological buffer within the egg, and the shell serves as a rigid
barrier to protect the embryo and regulate gas exchange. An average chicken egg weighs
approximately 58 grams, of which 55.8 percent is albumen, 31.9 percent is yolk, and 12.3
percent is shell; an average 32 gram pheasant egg, is comprised of 53.1 percent albumen, 36.3
percent yolk, and 10.6 percent shell (Romanoff and Romanoff, 1949). In general, precocial bird
eggs are comprised of 30 to 40 percent yolk, which is significantly more than the 15 to 20
percent in eggs from altricial species (Romanoff and Romanoff, 1949).
A yolk, or vitellus, is an ovum from the hen containing a germinal disk (blastodisc,
cicatricula) that is referred to as a blastoderm once fertilized. Here lies the genetic information
and living cells that will eventually become the chick. The blastodisc is cradled by the nucleus of
pander, which is connected to the center of the yolk (latebra) via the neck of latebra. The whole
yolk is stratified in concentric layers of yellow yolk separated by thinner layers of white yolk.
The number of layers varies depending upon the rate of ovulation, but six strata, deposited daily
from dietary nutrients, is most common (Romanoff and Romanoff, 1949). In chickens, the yolk
is comprised of 48.7% water, 32.6% lipids, 16.6% proteins, 1.1% inorganic matter (minerals),
and 1.0% carbohydrates (Romanoff and Romanoff, 1949). The lipid fraction consists of 70%
triacylglycerols, 25% phospholipids, and 5% cholesterol and cholesterol esters (Johnson, 2015).
5
These lipids are the primary energy source for a developing embryo. Aside from the yolk’s role
as an energy source for the embryo, it also contains several antioxidants such as carotenoids and
vitamins, and conveys passive immunity via IgY antibodies (Tesar et al., 2008; Johnson, 2015).
Chicken albumen is primarily composed of water (87.9%) and proteins (10.6%). The
remaining consists of carbohydrates (0.9%), minerals (0.6%), and trace amounts of lipids
(Romanoff and Romanoff, 1949). The albumen of a fully formed egg has four layers: the
chalaziferous (inner thick) layer which is attached to the yolk, the inner thin (liquid) layer, the
outer thick (dense, albuminous sac) layer, and the outer thin (fluid) layer. These layers of
albumen serve many functions for the developing embryo including yolk suspension and support
via the chalazae, nutrient provision (primarily water, protein, and minerals), and protection from
microorganisms. This pathogen shielding extends beyond the physical barrier properties of
albumen and is made possible, in part, due to the ability of albumen proteins (ovotransferrin,
flavoprotein, avidin) to chelate various nutrients required for bacterial growth. The albumen is
also supplied with protease inhibitors such as ovomucin, ovomucoid, ovoinhititor, cystatin, and
ovomacroglobulin which further protect against pathogen invasions. Recent studies continue to
show the importance of supporting maternally derived immunity, including IgY and other
antimicrobial proteins and peptides (e.g. defensins), to health of progeny (Bedrani et al., 2013;
Johnson, 2015).
Surrounding the internal egg components is the shell. The eggshell is actually two distinct
fractions, one is organic and the other is crystalline. The organic fraction of the eggshell consists
of shell membranes, the mammillary cores, the shell matrix, and the cuticle. These organic
structures are small, but important, components of the egg shell that add structural integrity and
are critical for protecting the embryo. There are two shell membranes, inner and outer, made of a
6
meshwork of protein fibers that are semipermeable to allow passage of gasses and water through
the shell (Leach, 1982). Mammillary cores project from the outer membrane surface and are
where calcification is initiated and makes up the greatest proportion of the organic material of an
eggshell. Exterior to the mammillary layer are protein layers and acid mucopolysaccharides,
which together make up the organic shell matrix. The outermost surface of the egg is covered by
a cuticle made of polysaccharides, lipids, and proteins, including 47 proteins identified to exert
antimicrobial activity (Rose-Martel et al., 2012). The antimicrobial characteristics of these
proteins, as well as their barrier function, make the cuticle the first line of defense against
external pathogens.
The crystalline portion of the shell is made of three calcified layers: the mammillary
(knob), palisade, and vertical layers. The crystalline shell provides physical strength and
protection for the egg, while pores in the shell allow gas exchanges (Tullett, 1984; Rahn and
Paganelli, 1990). The shell also provides approximately 80% of the calcium needed by the chick
during embryo development (Johnson, 2015). Eggshell color is derived from various pigments
that are deposited during egg formation. Biliverdin is a blue-green pigment found in the blood
and derived from bile that can penetrate through the whole shell, making the outside and inside
of the egg shell appear blue. Bilirubin is a yellow pigment associated with bile and derived from
the blood. Protoporphyrin is a brown pigment, larger in size than the aforementioned pigments,
and is therefore only found on the exterior of the crystalline shell. A hen’s genetic inheritance
determines egg color, and the absence of pigment results in the visible white color of the
crystalline shell.
7
Egg formation
A commonality among avian species is their oviparity, meaning that there is relatively
little embryonic development within the female. Instead, the eggs of oviparous animals develop
and hatch in the external environment. Most aves only have one functional ovary, which is the
left ovary. Like many characteristics of the avian, having one developed ovary is thought to be a
means of weight reduction to assist with flight; although, many flightless birds also utilize a
single ovary for reproduction. A single ovary also provides more space for a large egg to develop
one at a time without interruption. The Kiwi, which has two functional ovaries, is an exception
(Kinsky, 1971).
By the time a female chick hatches, the process of oogenesis has terminated, with
approximately 480,000 oocytes formed. However, only a few of these will mature into an ovum
and ovulate (Hughes, 1963). Soon after hatching, the oocytes begin organization into primordial
follicles and the process of reproductive maturation continues. The time required for hens to
reach sexual maturity depends on many factors including species (and breed or subspecies),
photo-stimulation, nutrition, and other environmental factors. For example, Japanese quail are
frequently placed in breeding programs 6 weeks after hatching, but can mature even sooner.
Chickens generally take 20 weeks to reach sexual maturity, while pheasants, which are not yet
truly domesticated, can take longer to mature. Pheasants are also more responsive to seasonality
via photoperiodism, and in commercial production, it is not common to artificially light stimulate
pheasants to promote egg production as is routinely done with chickens. Quail and chickens will
continue to produce eggs throughout the year, given proper environment, but pheasants generally
only produce eggs for a limited time when day length is increasing in the spring.
8
Fertilization of the ovum, the act of mating, or even the presence of a male is not required
to simulate egg production in many birds including chickens, quail, and pheasants. This is
partially a result of the female bird’s unique ability to store sperm after mating to be later utilized
for fertilization of the ovum. The amount of time a female can store viable sperm depends on
many variables including species, age, stage of ovulatory cycle when inseminated, and
environmental factors (Lodge et al., 1971; Brillard, 1993; Bakst et al., 1994). Located at the
utero-vaginal junction, specialized sperm storage tubules serve as the holding place for sperm for
up to 12 days in quail and 4 weeks in chickens. Following copulation, the sperm migrates to the
tubules via sperm motility and interactions with the vaginal mucosa (Brillard, 1993).
Once the hen has developed a mature follicle, the ovum (yolk) is released by rupturing of
the stigma and engulfed by the infundibulum, and it remains there for 18 minutes. Sperm leave
the tubules almost immediately after the previous egg is laid and migrate up the reproductive
tract to the infundibulum where fertilization of the recently ovulated ovum quickly occurs
(Olsen, 1942; Perry, 1987) . Genetic sex is determined at fertilization, with females being
heterogametic (ZW) and males being homogametic (ZZ). Immediately after fertilization, the first
layer of albumen is produced, covering the ovum and rejecting future sperm interactions via
antitrypsin factors such as ovomucin, a serine protease inhibitor. The ovum then proceeds to the
magnum, the largest portion of the oviduct, where it remains 2 to 3 hours while the majority of
the albumen is formed. The tumbling, or rolling, movement of the egg down the oviduct is
partially responsible for the creation of the chalazae, which is a thick albumen structure that
serves as a shock absorber to hold the ovum in the middle of the egg. During the next 1 to 2
hours the egg will be in the isthmus, where the inner and outer shell membranes are formed. The
egg spends the majority of its time, 18 to 26 hours, in the uterus (i.e., shell gland) where salts and

9
fluid are absorbed into the albumen and the shell is formed. This is also the site where egg shell
pigmentation occurs. Finally, the egg passes the utero-vaginal junction, enters the vagina, and is
expelled through the cloaca, a process referred to as oviposition. The total process from
ovulation to oviposition takes 24 to 26 hours in chickens.
Incubation and growth
The incubation time required for embryo development varies greatly among avian species
and small variations occur even within a species or strain. Chicken embryo development has
been extensively researched for both improving commercial poultry production and as a learning
model for vertebrate embryonic development. Aristotle characterized the chick embryo as the
ideal object for embryological studies, triggering many others to record descriptive analyses of
gross morphological changes during embryo growth (Hamburger and Hamilton, 1951). Since
these early studies, mechanisms of cellular differentiation, organ function, and biochemical
activity in the egg have become more precisely understood.
Incubation time is 18 days for Japanese Quail, 21 days for chickens, 24 days for most
pheasant species (including the ring-necked), and 28 days for turkeys. Embryonic development is
similar among these species and most other gallinaceous birds, so comparisons can be easily
made with the specific timeline described herein for the chicken. Over the 24 hour period a
fertilized ovum resides in the reproductive tract, it becomes a developing embryo surrounded by
its required nutrients and the warm environment of the hen’s body, which is maintained at a
temperature between 40-41.7°C (104-107°F). At oviposition, the embryo already consists of
some 40,000 to 60,000 organized cells (Eyal-Giladi and Kochav, 1976; Fasenko, 2007).
Incubation in a commercial setting is merely a mechanized approach, with the assistance
of research, to mimic the conditions a hen provides for her eggs. There are four basic

10
requirements during incubation necessary for embryo growth: proper temperature, humidity, gas
exchange, and the turning of eggs. This is accomplished using established incubation profiles in
the hatchery.
A common profile used for hatching broiler chickens at the University of Arkansas
Poultry Research Farm is 37.6°C (99.6°F) at 55% relative humidity (29.4°C/85°F wet bulb), egg
turning every hour, and 36.7°C (98°F) at 54% relative humidity (27.8°C/82°F wet bulb) in the
hatcher (discussed in further reading). A recommended profile for Japanese quail from Quail
International, Inc. is 37.5°C (99.5°F) at 60% relative humidity, egg turning every half hour, and
36.9°C (98.5°F) at 62% relative humidity in the hatcher. MacFarlane Pheasants, Inc. uses the
following parameters for their pheasant eggs: 37.2°C (99.0°F) at 51% relative humidity, egg
turning every hour, and 36.7°C (98.0°F) at 52% relative humidity in the hatcher. Eggs are not
turned in the hatcher.
The various stages of embryo development have been progressively described in a
multitude of publications, perhaps the most influential and well known work was that done by
Hamburger and Hamilton (1951) whose work was the first to identify and designate embryos on
the basis of external characters over the entire period of incubation. Eyal-Giladi and Kochav
(1975) added onto that work by describing cleavage and development prior to oviposition. Tong
et. al. (2013) provides a thorough review of development and the hatching process. All of these
works are the basis for much of this review. Once incubation is initiated, embryo development is
rapid and can be described in three phases: differentiation, growth, and maturation.
Differentiation primarily occurs within the first 6 days of development, and during this time cells
organize and differentiate into what will become the structural and functional organ systems. The
head and heart are visibly forming by day 2 and a heartbeat is detectable at day 3. At day 4 eye
11
pigment is distinct in appearance and area vasculosa (i.e. blood capillary formations) covers 50%
of the yolk sac by day 5 (Hamburger and Hamilton, 1951). During the growth phase, organs
increase in size and body structures become apparent. The egg tooth, comb, and digits become
visible at day 7, bone calcification is initiated at day 8, and feathers and scales on legs are
recognizable at day 11(Hamburger and Hamilton, 1951). Embryos become exothermic at day 13
as their metabolic activity and oxygen consumption increases exponentially. The maturation
phase prepares a chick for the hatching process. During this phase organs reach full, functional
development, the yolk sac is internalized into the body cavity, and the chick orients itself so that
the head is on the air cell end of the egg and tucked under the right wing. In commercial
production eggs are “set” in the incubator, or setter, to initiate development by incubating the
egg. Depending on the operation, eggs are generally taken out of the setter after 18 days of
incubation and put into a hatcher for the remainder of development. The same procedure is done
at day 14 for Japanese quail and day 21 for pheasants. This is known as “transferring” and frees
up space in the incubator, allows eggs to move freely for hatching, and keeps the incubator
cleaner by hatching in a separate machine. A frequently used indicator of incubator function and
egg quality is weight change of eggs from set to transfer. This weight reduction is due to
moisture loss as a result of a properly developing embryo exchanging gasses through the shell.
Typical chicken eggs should be 11-13 percent lighter at transfer to achieve optimum hatchability
from adequate moisture loss. Weight loss, though a helpful tool in chicken production, is often
more variable or unknown for other species of interest such as pheasants.
Hatch
At 19 days of incubation a properly oriented chick will be able to pierce the air cell
membrane with its beak, a process known as internal pipping. The egg tooth, located on the tip of
12
the upper beak, allows the chick to then continue hatching at day 20 by breaking through the
eggshell (external pipping). At this point, a chick will take its first breath and lungs will begin
fully functioning. Chicks will then rest momentarily before proceeding to use their beak and egg
tooth to further break the shell while rotating and eventually entering the external environment.
The wet chick must then dry off before leaving the nest or hatching cabinet.
Even though the average incubation time required for chickens to complete the hatching
process is regarded as 21 days, or 504 hours, the true duration varies. The chick typically leaves
the egg prior to 504 hours which allows time to dry off and mature to an ambulatory chick. A
group of eggs laid in a clutch, or set together in a hatcher, will hatch over a period of time from
first egg to last egg, known as the hatch window. This spread of hatch is impacted by many
factors including the age and strain of parent flock, length and environmental conditions of egg
storage, incubation parameters, and homogeneity or heterogeneity of the eggs (Mather and
Laughlin, 1977; Tona et al., 2003; Careghi et al., 2005; Almeida et al., 2008; Tong et al., 2013;
Johnson, 2015). Commercially produced broiler chickens usually have a 24 to 48 hour hatch
window, where a shorter time is preferred. Desirable hatch windows allow ample time for late
hatching chicks to dry prior to early hatchers getting dehydrated.
Hatch window length is influenced by environmental conditions, but aves exhibit species
specific abilities to initiate and synchronize egg hatching to shorten the hatch window (Reed and
Clark, 2011; Tong et al., 2013). Mechanisms to synchronize hatching time are not well
understood, but include communications in the form of audible sound, egg to egg and parent to
egg physical contact, and possibly other routes. The audible communications are frequently
described as “clicking” sounds that are produced by most avian embryos and can either
accelerate or decelerate the hatching time.

13
EGG STORAGE
Egg storage in nature and the gallinaceous clutch
Most birds reproduce by laying multiple eggs, in daily succession, to form a group called
a clutch. However, the domestic chicken rarely, or never, lays in clutches as a result of selective
breeding to increase egg production. Clutch size is species dependent and also fluctuates with
age and environmental factors. A clutch of eggs is usually 11 to 14 for chickens, 10 to 12 for
pheasants, and 8 to 20 for quail (Romanoff and Romanoff, 1949). Once a clutch is complete, the
parent hen will initiate incubation of all eggs within the clutch. In gallinaceous species this
ensures that the offspring will hatch at relatively the same time and can start foraging for food
together with the parent(s), increasing the odds of survival. Even though the eggs are laid at
various times, it is the increase in egg temperature associated with the onset of incubation that
initiates an increased rate of embryo development. Prior to incubation, eggs remain in a state of
embryonic diapause where some cellular metabolic processes critical for embryo survival do
occur, but further growth and development are not initiated (Mead, 1993; Fasenko, 2007). Due to
the time required for clutch completion, diapause is longer for the first eggs laid within a clutch.
Changes in egg shell and albumen characteristics occur from the first egg laid in a clutch to the
final, which assist with homogeneity of eggs at time of incubation and compensate for the
differing lengths of diapause.
Egg collection and storage in commercial production
In a commercial production setting, fertile hatching eggs are produced on breeder farms
and transported to a hatchery for incubation. Chicken breeder houses have open floor designs to
facilitate the comingling of males and females for breeding and nesting boxes are provided for
the hens to lay. Breeder management practices and equipment contribute to the quality of eggs
14
laid and collected (Appleby, 1984; Meijerhof, 1992). Ideally, eggs are collected multiple times
per day and the hens lay in nesting boxes and not on the floor. Eggs laid on the floor have a
higher proportion of culls and lower hatchability compared to eggs laid in the nest as floor eggs
have a higher risk of being cracked by other moving birds and of contamination with pathogens
from within the litter (Appleby, 1984; Meijerhof, 1992). Even though the egg is naturally
protected by its shell, and internally by the albumen, bacteria and other pathogens can still enter,
usually through the shell pores, and cause a contamination (Berrang et al., 1999). Incubating
undesirable eggs that would typically be considered culls (e.g. cracked, dirty, blood stained,
misshaped, etc.) and improper egg sanitation/washing practices can lead to decreases in
hatchability (Yoho et al., 2008). Eggs that remain in the house after being laid for a longer period
of time (laying house period) may be exposed to undesirable environmental conditions, such as
high temperature, and can also have a lower hatchability (Meijerhof, 1992). Breeder farms have
a cooler or egg storage room designed to better optimize and control environmental conditions
for the eggs. Eggs are generally placed in the cooler immediately after collection and will remain
there up to 3 days at which point they are transported to a hatchery, where additional storage
usually takes place prior to incubation (Fasenko, 2007).
Egg storage conditions and effects on hatchability and performance
Variables in hatching egg production such as an imbalance between the supply of eggs
coming in and demand for chicks going out, machine capacity, and quality of eggs make storing
eggs on farm and at the hatchery a necessity. These factors also influence the length of storage
time. Optimum egg storage time and environmental conditions are conducive for embryonic
diapause and maximize hatchability. “Physiological zero” is a term used to describe the
temperature where eggs stored below will have minimal embryonic metabolism, whereas
15
temperatures above this threshold will cause increased metabolic activity of embryos. Therefore,
storage temperatures should remain below physiological zero, but not so low that the embryo is
negatively impacted. Temperatures considered to be physiological zero for chicken eggs have
been reported to range widely from 19 to 27°C, with variations due to breed/strain, egg
characteristics, length of storage, and environmental factors (Edwards, 1902; Funk and Biellier,
1944; Decuypere and Michels, 1992; Brake et al., 1997). With the variations that exist in
suggested ideal storage conditions, it is advantageous to customize the storage room parameters
to the ideal environment for the particular eggs being set, such variations and suggestions have
been reviewed by Meijerhof (1992), Brake et al. (1997) and Fasenko (2007). Although, in most
settings the quantity and variety of eggs being stored at one time do not allow for frequent
adjustments. Eggs should not be stored above 21°C (69.8°F) to limit bacterial growth, maintain
the embryo without further development, and slow albumen changes (Fasenko, 2007). In general,
as eggs are stored longer, temperature should be lower. The optimum temperature for chicken
eggs stored over 14 d has been reported to be 12°C (Olsen and Haynes, 1948; Funk et al., 1950).
Eggs stored 8 days hatch best with 15°C storage and eggs stored 2 days hatch best after storage
at 18°C. (Kirk et al., 1980). The actual temperature of egg storage, within reason, may not be as
important to the embryo as avoiding temperature fluctuations, as repeated acceleration and
deceleration of development can be burdensome to the embryo. Variations of 1.2°C have been
reported to reduce hatchability by as much as 3.5% (Bramwell and Martin, 2008). Relative
humidity during storage may not be critical as long as extremely dry conditions are avoided, with
the average recommended humidity being 70-80% (Funk and Forward, 1960; Van De Ven,
2004; Fasenko, 2007).

16
The ideal length of storage for chicken eggs has been debated. Some research has
indicated that an egg has its best hatching potential on the day it is laid (Wilson, 1991), whereas
others have suggested that chicken eggs stored for 1 or 2 days have higher hatchability than fresh
set eggs (Funk et al., 1950). Turkey eggs stored for 1-2 days have the highest hatchability,
compared to other storage lengths (Asmundson and MacIlraith, 1948). The discrepancies in
optimum storage time is possibly due to differences in eggs, clutch cycle, albumin quality, and
strain. Such debate has also brought suggestions of an egg’s necessity to “settle” prior to
incubation, where after transport or lay an egg is stored or rested prior to incubating, but the
concept is not thoroughly researched. Storing chicken eggs up to a total of 7 days, including both
on farm and hatchery storage, is an acceptable practice with minimal impacts on hatchability,
which has been well documented and reviewed by Fasenko (2007). However, prolonged storage
periods over 8 days can have many detrimental effects including delayed hatching times, wider
hatch windows, poor chick quality, embryo death, and an overall decrease in hatchability
(Mather and Laughlin, 1977; Reis et al., 1997; Tona et al., 2003; Petek and Dikmen, 2006;
Fasenko, 2007). Extending storage times beyond 7 days has also been shown to negatively
influence growth performance compared with chicks hatched from short term stored eggs (Tona
et al., 2003). Prolonged storage may also compromise aspects of a chicken’s immunity,
specifically acquired immunity, by negativity impacting the abundance of CD3+, CD4−, and
CD8− cells (Goliomytis et al., 2015).
Currently, little egg storage research exists for quail production. Most businesses utilize
conditions similar to that for chickens and practices are slightly modified to fit individual
operations (Raul E. Otalora, production manager, Quail International, Inc., personal
communication). The same is true for pheasants; however, through years of experience in
17
gamebird production, most operations generally store pheasant eggs at lower temperatures than
chickens (MacFarlane Pheasants, Inc. Hatchery Manual and Procedures).
Egg and embryo changes during storage
Albumen characteristics likely play the biggest role in embryo changes and viability over
periods of lay and storage (Hurnik et al., 1978; Brake et al., 1997; Lapão et al., 1999; Tona et al.,
2002). At oviposition albumen pH has been reported to be 7.6-8.5 and during storage it will rise
to about 9.0-9.5 due to the diffusion of dissolved carbon dioxide. The greatest change in pH
occurs in the first 3-4 days of storage and plateaus at approximately 8 days (Benton and Brake,
1996; Brake et al., 1997; Lapão et al., 1999; Tona et al., 2002). Albumen height is an indicator of
viscosity and decreases with length of storage due to albumen liquefaction and deterioration
(Hurnik et al., 1978; Benton and Brake, 1996; Brake et al., 1997; Lapão et al., 1999). These
changes in pH and albumen height during storage are similar to the changes in the eggs over a
clutch cycle. Eggs laid early in a clutch cycle will have higher quality shells and albumen at lay.
The changes to the early laid eggs during storage result in them becoming more similar to the
eggs laid later in the clutch when they are laid. Brake et al. (1997) describes the first eggs in a
clutch as more robust and environmentally resistant than eggs laid later in the clutch, which are
more environmentally sensitive. By the time incubation is initiated by the hen, all eggs in a
clutch are similar in albumen pH, moisture content, and other quality traits.
Long-term storage
The temperature and length of egg storage are considered the most crucial considerations,
but other storage factors also influence hatchability. Storing eggs with the pointed (small) end
down is generally considered best common practice. However, when eggs are stored for
extended periods of time (over 10-14 days), having the pointed end of the egg up may limit the
18
amount of moisture loss and gas exchange, improving hatchability (Van De Ven, 2004; Elibol
and Brake, 2008). Turning the eggs during long term storage may also improve hatchability (Van
De Ven, 2004). Turning the egg during storage likely acts in a similar necessity as turning during
incubation by moving the albumen around which allows metabolic waste material and gasses to
be separated from the embryo. Recent research has also suggested that short periods of
incubation during egg storage (often called SPIDES) can minimize embryo mortality due to
storing over long periods and improve hatchability compared to traditional long term storage
(Dymond et al., 2013; Nicholson et al., 2013). Using SPIDES accelerates growth and metabolic
processes of the embryo allowing for nutrient utilization, waste removal, and replacement of
dead cells which increases the overall viability of the embryo.
EARLY FEEDING
Detriment of post-hatch fasting: the premise of early feeding
The day a chick hatches is regarded as the most challenging day in its life. The process of
hatching is very energy consuming and afterwards the chick must make a significant transition
from endogenous to exogenous feed. This transition is accompanied by the morphological and
physiological changes of the chick’s gastrointestinal tract (Noy and Sklan, 1997). Once a chick
hatches it may remain in the hatcher for some time before being pulled from the machine for
processing (e.g. sexing, counting, vaccinating, boxing) and then transported to the farm, where
feed and water are typically first available. Prior to arrival at the farm chicks rely on the
remainder of the internalized yolk sac for nutrients (Noy and Sklan, 2001). When this fasting
time is long in duration, a delay in yolk sac uptake has been found in poults and a significantly
greater proportion of moisture and lipid is removed in contrast to protein as with poults who are
not fasted (Moran and Reinhart, 1980). The same is likely true for other species.
19
It is well known that chicks held for extended periods of time at the hatchery or are
subjected to other extended delays of access to feed and water will have hindered performance
measurable both immediately and long term. It has been demonstrated that chicks and poults
fasted during a holding period of 48 h after hatch will lose about a tenth of their initial weight
(Pinchasov and Noy, 1993). This weight loss can be attributed almost completely to moisture and
lipid loss from the yolk sac on the first day, with two-thirds of the weight loss on the second day
due to yolk sac loss. Much of which is moisture and lipid loss. Pinchasov and Noy (1993) found
no change in chick body composition during the first 24 h of fasting, but after 48 hours body fat
content was significantly less than newly-hatched or 24 h held birds. These changes in body
composition create a situation of energy shortage for the young bird that ultimately has a
negative impact on early growth and mortality under heat stress. Noy and Sklan (1999)
investigated multiple methods of starting chicks on feed and/or water and compared the
performance of these chicks with those that had been fasted. Chicks that were provided nutrients,
regardless or form or type evaluated, had higher BW than the fasted chicks. Although, depending
on the nutrient(s) administered, the effects were either transient or sustained. They found that the
peak body weight response to early feeding, as opposed to fasting, occurred at 4-6 days in chicks
and 6-8 days in poults with the response decreasing somewhat with time. Much of the
performance depression from fasting may be due to the slower and less developed
gastrointestinal tract in fasted birds. Chicks that are fasted have lower villus height, villus width,
and apparent villus surface area along with lower BW compared to chicks fed sooner (Ganjali et
al., 2015). Research has suggested that long-term BW differences in turkeys may be due to fed
poults having higher satellite cell mitotic activity compared to fasted poults, who have depleted
proliferating satellite cells (Moore et al., 2005). Not only is broiler performance impacted by

20
fasting, but Bigot et al. (2003) suggest other facets of production, such as breeder value, may
also be affected. Neonate chicks that had a posthatch feeding delay may distort genetic selection
by masking the expression of genetic potential and disturbing the estimation of chick breeder
value as seen with the chick BW variation (Bigot et al., 2003).
Methods of early feeding and their effects
Current production goals aim at getting chicks the best start possible, including providing
access to feed and water quickly after hatching. Research and management strategies provide
nutrition to chicks prior to placement and are often referred to as “early feeding”. Much research
has been published, coinciding with new advancements in equipment, since the last comparison
of types of early feeding and reviews on the subject matter (Noy and Sklan, 1999; Noy and Uni,
2010; Kadam et al., 2013). Two predominant methodologies currently receive much attention in
research and industry applications. The first of those is in ovo (IO) feeding whereby nutrients are
delivered to the developing embryo at some stage of incubation. Another method is the
provision of nutrients immediately post-hatch, usually in the hatching baskets or during
transportation to farm placement. Beyond the method of delivering nutrients, the particular
nutrient(s) that are most beneficial for the newly hatched chick are highly debated. While most of
the current literature uses a common chick starter feed as the experimental diet provided, others
have investigated the use of “pre-starter” diets formulated to the needs of a newly hatched chick.
In cases of IO feeding or liquid feeding, individual nutrients (e.g. simple sugar or amino acid) are
commonly used alone or in combinations.
In ovo feeding provides nutrients to the embryo while it is still developing in the egg
during incubation. This is accomplished by using a needle to pierce the shell on the blunt end and
delivering the nutrients either into the air cell, amniotic fluid, the embryo, or the yolk sac.
21
Nutrients are then absorbed or orally consumed by the chick prior to hatching. Such methods
were first used to deliver vaccinations against Marek’s disease (Sharma and Burmester, 1982). In
ovo feeding methods continue to be researched to determine the optimal timing, technique, and
nutrients to be delivered. Such studies have led to industry applications and patents such as that
by Uni and Ferket (2003). In this patent researchers recommend a nutrient composition
containing at least one protein, peptide, amino acid or carbohydrate and/or an enteric modulator,
specifically hydroxymethylbutyrate (HMB). Studies indicate that hatchlings fed an IO
combination of carbohydrates and HMB have a small intestine functionally similar to that of a
conventionally fed 2 d old chick (Tako et al., 2004). Administration of IO nutrients at 18 d of
incubation showed an intestine diameter increase of 17.7% and enteric villi height increase of
47.1% two days after hatch (Uni and Ferket, 2003). The carbohydrates provided IO elevate
glycogen levels in the liver and lead to an increase in relative breast muscle size, which may be a
result of less reliance on glucose production via gluconeogenesis with the added energy from the
injected nutrients (Uni and Ferket, 2004; Uni et al., 2005; Zhai et al., 2011). Combination IO
feeding of protein, carbohydrates, and HMB have also shown the possibility of improving
glycogen status, jejunal nutrient uptake, neonatal growth of turkey poults (Foye et al., 2006,
2007), and the IO feeding of carbohydrates and/or arginine has led to an increased 7 d body
weight and glycogen reserve for ducks (Tangara et al., 2010). Carbohydrates fed IO have also
resulted in a 50% increase of goblet cells containing acidic mucin 36 h after injection compared
to controls (Smirnov et al., 2006). Other research has shown that IO feeding of L-Leu influences
the metabolic activity of free amino acids and might provide thermo-tolerance in young male
broiler chicks by improving the cellular environment and thus alleviating the impact of heat
stress (Han et al., 2019). Certain nutrient combinations (amino acids, trace elements, and/or fatty
22
acids and vitamins) supplemented IO may modulate cell-mediated immunity in chicks and have
been shown to increase bursa (when IO fed fatty acids and vitamins) and thymus (when IO fed
trace elements) weights at hatch (Bakyaraj et al., 2012).
Providing feed or water in the hatcher, during holding, or during transportation is less
researched than IO feeding and much of the existing research is oriented around fasting and
holding times rather than timing of access to nutrients in the modern definition of early feeding.
Some research has investigated the feeding of various diets to chicks in trays in the hatchery
through to placement (5 h period) and found that the BWG at d 7 was higher in fed birds
compared to fasted birds, but the remainder of the 37 d grow out did not show any differences in
live performance, processing, or small intestine weights (Kidd et al., 2007). Similarly, Lamot et
al. (2014) found that the immediate access to feed after hatch affects growth and development
during the first week, but gains are diminished by compensatory growth of fasted chicks (Lamot
et al., 2014). Gelatin-like products, sometimes called hatching supplements or hydrated
nutritional supplements, have a high proportion of water content (usually 70%) and are often
placed in transport boxes when shipping chicks long distances or during long holding periods. A
product called EarlyBird (Sigrah-Zellet, LLC.) was shown to result in a 2.7% increase in body
weight at slaughter age compared to chicks fasted during a 24 hour simulated shipping; however,
the supplementation does not completely compensate for the delayed exposure to feed and water
before placement (Henderson et al., 2008). A similar product called Oasis (Novus International
Incorporated, St. Louis, MO.) consists of 8% protein, 16% carbohydrate, 1% fat, 1% fiber, 2%
ash, and 70% water. Although it has not shown an advantage over regular starter feed, Oasis has
been shown to improve growth, immune development, breast yield, and body weight of birds at
market age when fed after hatching (Dibner et al., 1998; Noy and Sklan, 1999; Boersma et al.,
23
2003). Batal and Parsons (2002) showed similar beneficial effects on growth performance of
chicks fed Oasis compared with fasted chicks. Oasis was also shown to have a beneficial effect
on subsequent MEn of a corn-SBM diet, where the increase in MEn may be a result of Oasis
stimulating development of the digestive tract (Batal and Parsons, 2002). Noy and Sklan (1999)
demonstrated that feeding non-nutritive material (sawdust) has transient effects on BW up to 14
d. This increase in early body weights may be partly due to the ingested material itself and the
physical stimulation leading to accelerated gut development, encouraging the bird to consume
more standard feed and water when accessible. Chicks provided water alone during 24 or 48 h
holding periods at a hatchery have been shown to weigh 2 to 6 g more than fasted chicks at
placements; however, after 2 weeks, there was no influence on performance, intestinal breaking
strength, or incidence of unabsorbed yolk sacs (Fairchild et al., 2006). Others suggest that
hydration is the single stimulus for metabolism in the newly hatched chicks and have shown that
chicks provided water immediately after hatch have sustained improvements in performance
(Thaxton and Parkhurst, 1976). Thaxton and Parkhurst (1976) also noted that water with the
addition of sucrose, or potentially another readily available energy substrate, will also increase
broiler performance if given to chicks prior to placement. Similar results and recommendations
have been found with turkey poults using a more complex nutrient product given orally (Ambex,
Elanco Products Company, Indianapolis) (Waldroup et al., 1974), but glucose in saline delivered
at day of hatch did not show a benefit beyond 2 weeks (Moran, 1990).
Currently, there is a lack of information regarding provision of nutrients in the hatcher
prior to removing the chicks; and more specifically, potential interactions of nutrient access with
the time a chick hatches and is able to start consuming the nutrients. Much of the existing
literature uses inconsistent definitions of the term “early feeding”. Some have defined this as

24
providing nutrients to chicks before leaving the hatchery, whereas others have meant it as a
general management concept to get chicks on feed sooner. The latter is essentially the inverse to
what many consider fasting, and in current production systems of the United States is of less
concern since chicks usually arrive to the farm in adequate time.
25
REFERENCES
Almeida, J. G., S. L. Vieira, R. N. Reis, J. Berres, R. Barros, A. K. Ferreira, and F. V. K.
Furtado. 2008. Hatching distribution and embryo mortality of eggs laid by broiler breeders
of different ages. Brazilian J. Poult. Sci. 10:89–96.
Appleby, M. C. 1984. Factors affecting floor laying by domestic hens: a review. Worlds. Poult.
Sci. J. 40:241–249.
Asmundson, V. S., and J. J. MacIlraith. 1948. Preincubation tests with turkey eggs. Poult. Sci.
27:394–401.
Bakst, M. R., G. Wishart, and J.-P. Brillard. 1994. Oviducal sperm selection, transport, and
storage in poultry. Poult. Sci. Rev. 5:117–143.
Bakyaraj, S., S. K. Bhanja, S. Majumdar, and B. Dash. 2012. Modulation of post-hatch growth
and immunity through in ovo supplemented nutrients in broiler chickens. J. Sci. Food Agric.
92:313–320.
Batal, A. B., and C. M. Parsons. 2002. Effect of fasting versus feeding Oasis after hatching on
nutrient utilization in chicks. Poult. Sci. 81:853–859.
Bedrani, L., E. Helloin, N. Guyot, S. Réhault-Godbert, and Y. Nys. 2013. Passive maternal
exposure to environmental microbes selectively modulates the innate defences of chicken
egg white by increasing some of its antibacterial activities. BMC Microbiol. 13:1–13.
Benton, C. E., and J. Brake. 1996. The effect of broiler breeder flock age and length of egg
storage on egg albumen during early incubation. Poult. Sci. 75:1069–1075.
Berrang, M. E., N. A. Cox, J. F. Frank, and R. J. Buhr. 1999. Bacterial penetration of the
eggshell and shell membranes of the chicken hatching egg: a review. J. Appl. Poult. Res.
8:499–504.
Bigot, K., S. Mignon-Grasteau, M. Picard, and S. Tesseraud. 2003. Effects of delayed feed intake
on body, intestine, and muscle development in neonate broilers. Poult. Sci. 82:781–788.
Boersma, S. I., F. E. Robinson, R. A. Renema, and G. M. Fasenko. 2003. Administering Oasis
hatching supplement prior to chick placement increases initial growth with no effect on
body weight uniformity of female broiler breeders after three weeks of age. J. Appl. Poult.
Res. 12:428–434.
Brake, J., T. J. Walsh, C. E. Benton, J. N. Petitte, R. Meijerhof, and G. Peñalva. 1997. Egg
handling and storage. Poult. Sci. 76:144–151.
Bramwell, R. K., and S. Martin. 2008. On-farm egg storage: avoid pre-incubation. Poult. Int. 47.
Brillard, J. P. 1993. Sperm storage and transport following natural mating and artificial
insemination. Poult. Sci. 72:923–928.
Careghi, C., K. Tona, O. Onagbesan, J. Buyse, E. Decuypere, and V. Bruggeman. 2005. The
effects of the spread of hatch and interaction with delayed feed access after hatch on broiler
performance until seven days of age. Poult. Sci. 84:1314–1320.

26
Decuypere, E., and H. Michels. 1992. Incubation temperature as a management tool: a review.
Worlds. Poult. Sci. J. 48:28–38.
Dibner, J. J., D. Knight, M. L. Kitchell, A. Atwell, A. C. Downs, and E. J. Ivey. 1998. Early
feeding and development of the immune system in neonatal poultry. J. Appl. Poult. Res.
7:425–436.
Dymond, J., B. Vinyard, A. D. Nicholson, N. A. French, and M. R. Bakst. 2013. Short
preincubations during egg storage increase hatchability and chick quality in long-stored
broiler eggs. Poult. Sci. 92:2977–2987.
Edwards, C. 1902. The physiological zero and the index of development for the egg of the
domestic fowl, Gallus domesticus. Am. J. Physiol. Content 6:351–397.
Elibol, O., and J. Brake. 2008. Effect of egg position during three and fourteen days of storage
and turning frequency during subsequent incubation on hatchability of broiler hatching
eggs. Poult. Sci. 87:1237–1241.
Eyal-Giladi, H., and S. Kochav. 1976. From cleavage to primitive streak formation: a
complementary normal table and a new look at the first stages of the development of the
chick. Dev. Biol. 49:321–337.
Fairchild, B. D., J. K. Northcutt, J. M. Mauldin, R. J. Buhr, L. J. Richardson, and N. A. Cox.
2006. Influence of water provision to chicks before placement and effects on performance
and incidence of unabsorbed yolk sacs. J. Appl. Poult. Res. 15:538–543.
Fasenko, G. M. 2007. Egg storage and the embryo. Poult. Sci. 86:1020–1024.
Foye, O. T., P. R. Ferket, and Z. Uni. 2007. The effects of in ovo feeding arginine, β-hydroxy-β-
methyl-butyrate, and protein on jejunal digestive and absorptive activity in embryonic and
neonatal turkey poults. Poult. Sci. 86:2343–2349.
Foye, O. T., Z. Uni, and P. R. Ferket. 2006. Effect of in ovo feeding egg white protein, β-
hydroxy-β-methylbutyrate, and carbohydrates on glycogen status and neonatal growth of
turkeys. Poult. Sci. 85:1185–1192.
Funk, E. M., and H. V Biellier. 1944. The minimum temperature for embryonic development in
the domestic fowl (Gallus domesticus). Poult. Sci. 23:538–540.
Funk, E. M., and J. Forward. 1960. Effect of holding temperature on hatchability of chicken
eggs.in Research Bulletin. University of Missouri Agricultural Experiment Station.
Funk, E. M., J. Forward, and H. L. Kempster. 1950. Effect of holding temperatures on
hatchability of eggs. in Research Bulletin. University of Missouri Agricultural Experiment
Station.
Ganjali, H., A. R. Raji, and H. Zarghi. 2015. Effect of post hatch delayed access to feed on
performance, GIT physical and histological development and yolk absorption in young
broiler chicks. Biomed. Pharmacol. J. 8:945–955.
27
Goliomytis, M., T. Tsipouzian, and A. L. Hager-Theodorides. 2015. Effects of egg storage on
hatchability, chick quality, performance and immunocompetence parameters of broiler
chickens. Poult. Sci. 94:2257–2265.
Hamburger, V., and H. L. Hamilton. 1951. A series of normal stages in the development of the
chick embryo. J. Morphol. 88:49–92.
Han, G., H. Yang, Y. Wang, R. Zhang, K. Tashiro, T. Bungo, M. Furuse, and V. S. Chowdhury.
2019. Effects of in ovo feeding of L-leucine on amino acids metabolism and heat-shock
protein-70, and-90 mRNA expression in heat-exposed chicks. Poult. Sci. 98:1243–1253.
Henderson, S. N., J. L. Vicente, C. M. Pixley, B. M. Hargis, and G. Tellez. 2008. Effect of an
early nutritional supplement on broiler performance. Int. J. Poult. Sci. 7:211–214.
Hughes, G. C. 1963. The population of germ cells in the developing female chick. J. Embryol.
exp. Morph 11:513–536.
Hurnik, G. I., B. S. Reinhart, and J. F. Hurnik. 1978. Relationship between albumen quality and
hatchability in fresh and stored hatching eggs. Poult. Sci. 57:854–857.
Johnson, A. L. 2015. Reproduction in the female.Pages 635–665 in Avian Physiology. Scanes,
C.G., ed. 6th ed. Academic Press, Waltham, MA.
Kadam, M. M., M. R. Barekatain, S. K Bhanja, and P. A. Iji. 2013. Prospects of in ovo feeding
and nutrient supplementation for poultry: The science and commercial applications-a
review. J. Sci. Food Agric. 93:3654–3661.
Kidd, M. T., J. W. Taylor, C. M. Page, B. D. Lott, and T. N. Chamblee. 2007. Hatchery feeding
of starter diets to broiler chicks. J. Appl. Poult. Res. 16:234–239.
Kinsky, F. C. 1971. The consistent presence of paired ovaries in the Kiwi (Apteryx) with some
discussion of this condition in other birds. J. Ornithol. 112:334–357.
Kirk, S., G. C. Emmans, R. McDonald, and D. Arnot. 1980. Factors affecting the hatchability of
eggs from broiler breeders. Br. Poult. Sci. 21:37–53.
Lamot, D. M., I. B. van de Linde, R. Molenaar, C. W. van der Pol, P. J. A Wijtten, B. Kemp, and
H. van den Brand. 2014. Effects of moment of hatch and feed access on chicken
development. Poult. Sci. 93:2604–2614.
Lapão, C., L. T. Gama, and M. Chaveiro Soares. 1999. Effects of broiler breeder age and length
of egg storage on albumen characteristics and hatchability. Poult. Sci. 78:640–645.
Leach, R. M. 1982. Biochemistry of the organic matrix of the eggshell. Poult. Sci. 61:2040–
2047.
Lodge, J. R., N. S. Fechheimer, and R. G. Jaap. 1971. The relationship of in vivo sperm storage
interval to fertility and embryonic survival in the chicken. Biol. Reprod. 5:252–257.
Mather, C. M., and K. F. Laughlin. 1977. Storage of hatching eggs: the effect on early embryonic
development. Br. Poult. Sci. 18:597–603.
Mead, R. A. 1993. Embryonic diapause in vertebrates. J. Exp. Zool. 266:629–641.

28
Meijerhof, R. 1992. Pre-incubation holding of hatching eggs. Worlds. Poult. Sci. J. 48:57–68.
Moore, D. T., P. R. Ferket, and P. E. Mozdziak. 2005. Early post-hatch fasting induces satellite
cell self-renewal. Comp. Biochem. Physiol. 142:331–339.
Moran, E. T. 1990. Effects of egg weight, glucose administration at hatch, and delayed access to
feed and water on the poult at 2 weeks of age. Poult. Sci. 69:1718–1723.
Moran, E. T., and B. S. Reinhart. 1980. Poult yolk sac amount and composition upon placement:
effect of breeder age, egg weight, sex, and subsequent change with feeding or fasting. Poult.
Sci. 59:1521–1528.
Nicholson, D., N. French, S. Tullett, E. Van Lierde, and G. Jun. 2013. Short periods of
incubation during egg storage-SPIDES. Lohmann Inf. 48.
Noy, Y., and D. Sklan. 1997. Posthatch development in poultry. J. Appl. Poult. Res. 6:344–354.
Noy, Y., and D. Sklan. 1999. Different types of early feeding and performance in chicks and
poults. J. Appl. Poult. Res. 8:16–24.
Noy, Y., and D. Sklan. 2001. Yolk and exogenous feed utilization in the posthatch chick. Poult.
Sci. 80:1490–1495.
Noy, Y., and Z. Uni. 2010. Early nutritional strategies. Worlds. Poult. Sci. J. 66:639–646.
Olsen, M. W. 1942. Maturation, fertilization, and early cleavage in the hen’s egg. J. Morphol.
70:513–533.
Olsen, M. W., and S. K. Haynes. 1948. The effect of different holding temperatures on the
hatchability of hens’ eggs. Poult. Sci. 27:420–426.
Perry, M. M. 1987. Nuclear events from fertilisation to the early cleavage stages in the domestic
fowl (Gallus domesticus). J. Anat 150:99–109.
Petek, M., and S. Dikmen. 2006. The effects of prestorage incubation and length of storage of
broiler breeder eggs on hatchability and subsequent growth performance of progeny. Czech
J. Anim. Sci. 51:73–77.
Pinchasov, Y., and Y. Noy. 1993. Comparison of post-hatch holding time and subsequent early
performance of broiler chicks and turkey poults. Br. Poult. Sci. 34:111–120.
Reed, W. L., and M. E. Clark. 2011. Beyond maternal effects in birds: responses of the embryo
to the environment. Integr. Comp. Biol. 51:73–80.
Reis, L. H., L. T. Gama, and M. Chaveiro Soares. 1997. Effects of short storage conditions and
broiler breeder age on hatchability, hatching time, and chick weights. Poult. Sci. 76:1459–
1466.
Romanoff, A. L., and A. J. Romanoff. 1949. The Avian Egg. John Wiley & Sons, Inc., New
York.
Rose-Martel, M., J. Du, and M. T. Hincke. 2012. Proteomic analysis provides new insight into
the chicken eggshell cuticle. J. Proteomics 75:2697–2706.
29
Sharma, J. M., and B. R. Burmester. 1982. Resistance to Marek’s Disease at hatching in chickens
vaccinated as embryos with the Turkey Herpesvirus. Avian Dis. 26:134–149.
Smirnov, A., E. Tako, P. R. Ferket, and Z. Uni. 2006. Mucin gene expression and mucin content
in the chicken intestinal goblet cells are affected by in ovo feeding of carbohydrates. Poult.
Sci. 85:669–673.
Tako, E., P. R. Ferket, and Z. Uni. 2004. Effects of in ovo feeding of carbohydrates and β-
hydroxy-β-bethylbutyrate on the development of chicken intestine. Poult. Sci. 83:2023–
2028.
Tangara, M., W. Chen, J. Xu, F. R. Huang, and J. Peng. 2010. Effects of in ovo feeding of
carbohydrates and arginine on hatchability, body weight, energy metabolism and perinatal
growth in duck embryos and neonates. Br. Poult. Sci. 51:602–608.
Tesar, D. B., E. J. Cheung, and P. J. Bjorkman. 2008. The chicken yolk sac IgY receptor, a
mammalian mannose receptor family member, transcytoses IgY across polarized epithelial
cells. Mol. Biol. Cell 19:1587–1593.
Thaxton, J. P., and C. R. Parkhurst. 1976. Growth, efficiency, and livability of newly hatched
broilers as influenced by hydration and intake of sucrose. Poult. Sci. 55:2275–2279.
Tona, K., F. Bamelis, B. De Ketelaere, V. Bruggeman, and E. Decuypere. 2002. Effect of
induced molting on albumen quality, hatchability, and chick body weight from broiler
breeders. Poult. Sci. 81:327–332.
Tona, K., F. Bamelis, B. De Ketelaere, V. Bruggeman, V. M. B. Moraes, J. Buyse, O.
Onagbesan, and E. Decuypere. 2003. Effects of egg storage time on spread of hatch, chick
quality, and chick juvenile growth. Poult. Sci. 82:736–741.
Tong, Q., C. E. Romanini, V. Exadaktylos, C. Bahr, D. Berckmans, H. Bergoug, N. Eterradossi,
N. Roulston, R. Verhelst, I. M. McGonnell, and T. Demmers. 2013. Embryonic
development and the physiological factors that coordinate hatching in domestic chickens.
Poult. Sci. 92:620–628.
Uni, Z., and P. R. Ferket. 2003. Enhancement of development of oviparous species by in ovo
feeding.
Uni, Z., and R. P. Ferket. 2004. Methods for early nutrition and their potential. Worlds. Poult.
Sci. J. 60:101–111.
Uni, Z., P. R. Ferket, E. Tako, and O. Kedar. 2005. In ovo feeding improves energy status of
late-term chicken embryos. Poult. Sci. 84:764–770.
Van De Ven, L. 2004. Storage of hatching eggs in the production process. Int. Hatch. Pract.
18:27–31.
Waldroup, P. W., C. M. Hillard, J. E. Grigg, and G. C. Harris. 1974. The effectiveness of
nutrient solutions given to young turkey poults in drinking water or by oral and parenteral
dosage. Poult. Sci. 1056:1056–1060.
30
Wilson, H. R. 1991. Interrelationships of egg size, chick size, posthatching growth and
hatchability. Worlds. Poult. Sci. J. 47:5–20.
Yoho, D. E., J. R. Moyle, A. D. Swaffar, and R. K. Bramwell. 2008. Effect of incubating poor
quality broiler breeder hatching eggs on overall hatchability and hatch of fertile. Avian
Advice 10:1–3.
Zhai, W., L. W. Bennett, P. D. Gerard, R. Pulikanti, and E. D. Peebles. 2011. Effects of in ovo
injection of carbohydrates on somatic characteristics and liver nutrient profiles of broiler
embryos and hatchlings. Poult. Sci. 90:2681–2688.
31
CHAPTER II
MANUSCRIPT:
Effects of egg storage temperature on quail and pheasant production1
1Prepared for submission to Journal of Applied Poultry Research
32
ABSTRACT
Logistical constraints in commercial poultry production require storage of fertile hatching
eggs prior to incubation. The ideal conditions of chicken egg storage have been thoroughly
researched; however, the appropriate egg storage temperature for other poultry species are not
well characterized. Three experiments investigated a range of egg storage temperatures (10.0,
12.8, 15.6, 18.3, and 21.1°C) on hatching and production traits of Japanese (Coturnix) Quail and
Ring-necked (Common) Pheasant. Following a storage period of 7 d at the treatment
temperature, eggs were incubated using established protocols for the species. Hatch of fertile
(HOF) and chick quality were investigated, and hatched chicks were subsequently reared in floor
pens to determine effects on growth performance. Results of these studies indicated that pheasant
egg HOF was highest (P < 0.001) when eggs were stored at 10.0 or 12.8°C, lowest at 21.1°C,
and intermediate for 15.6 and 18.3°C temperatures. Egg storage at 21.1°C resulted in the highest
(P = 0.010) early embryonic mortality, 14.8%. There were no differences (P > 0.05) observed in
pheasant BW, FCR, or mortality among egg storage temperature treatments. These same storage
temperatures had similar effects on HOF of quail eggs. Historically, most quail and pheasant
eggs have been stored using modifications of chicken production practices; however, it was
found that the ideal storage temperatures for these species are likely lower than previously
thought and that implementing the current advised storage temperatures of up to 12.8°C may
improve hatchability and chick quality for commercial producers and hobbyists.
Key words: egg storage, temperature, moisture loss, hatchability, pheasant, quail, chick quality
33
INTRODUCTION
Prior to incubation, poultry eggs may be stored in a physiological state called diapause
which allows them to remain viable once subjected to proper incubation conditions. In nature,
this allows a female bird to lay a clutch of eggs over a period of several days, a clutch of eggs is
usually 11 to 14 for chicken, 10 to 12 for pheasants, and 8 to 20 for quail, but can vary with age
and environmental factors. Once a clutch is complete, the parent hen will initiate incubation of
all eggs within the entire clutch at once. In gallinaceous species, this ensures that the offspring
will hatch at relatively the same time and can start foraging for food together with the parents,
increasing the odds of survival. Even though the eggs are laid at various times, it is the increase
in egg temperature associated with the onset of incubation that initiates an increased rate of
embryo development. Prior to incubation and during embryonic diapause some cellular
metabolic processes critical for embryo survival do occur, but further growth and development
are not initiated (Mead, 1993; Fasenko, 2007).
The phenomenon of embryonic diapause can be exploited by commercial and hobby
producers so that a sufficient quantity of eggs can be stored to fill an incubation machine,
complete a customer order, and better schedule hatch days. Optimum egg storage conditions are
conducive for embryonic diapause and maximize hatchability. For chickens and turkeys, this
temperature has been found to be about 21°C, depending on length of storage time, and 70-80%
relative humidity (Funk and Forward, 1960; Meijerhof, 1992; Fasenko, 2007). Storage
temperatures should remain below a point of incubation, but not so low that the embryo is
negatively impacted. Temperature not only controls the rate of cell proliferation of the embryo,
but also effects the amount of gas exchange and moisture loss of the egg during storage; both of
these factors can change the quality and pH of the albumen, and ultimately, egg hatchability
34
(Hurnik et al., 1978; Benton and Brake, 1996; Brake et al., 1997; Lapão et al., 1999). The actual
temperature of egg storage may not be as influential on embryonic development as temperature
fluctuations. Repeated acceleration and deceleration of development can be burdensome to the
embryo, and variations of 1.1°C have been reported to reduce hatchability by as much as 3.5%
(Bramwell and Martin, 2008).
Currently, there is a lack of research to establish optimal storage temperature
recommendations for commercial poultry species other than chickens. Most quail egg producers
utilize conditions similar to those for chickens, but exact conditions vary among individual
operations (Raul E. Otalora, production manager, Quail International, Inc., personal
communication). In commercial pheasant production, years of production experience have led
most operations to generally store pheasant eggs at far lower temperatures than chicken eggs
(MacFarlane Pheasants, Inc. Hatchery Manual and Procedures). Therefore, the current study
aims to determine ideal temperatures at which to store pheasant and quail eggs for maximum
hatchability and post-hatch performance.
MATERIALS AND METHODS
These experiments were conducted at the University of Arkansas Poultry Research Farm
(Fayetteville, AR). All animal care and experimental procedures were approved by the
University of Arkansas Institutional Animal Care and Use Committee prior to initiation of the
experiment.
Quail eggs
A total of 5,040 eggs from a commercial meat line of Japanese (Coturnix) Quail,
Coturnix coturnix japonica, were utilized in experiment 1. All eggs were sourced through
International Quail, Inc. (Greensboro, GA) and came from a single prime-age flock on April 12.
35
Pheasant eggs
Due to a limited number of incubators used to apply the storage temperature treatments,
the experiment was repeated to generate 2 replicate trials. Both experiments were conducted
using Ring-necked (Common) Pheasant, Phasianus colchicus. Eggs were sourced from a
commercialized line of hunting release birds through MacFarlane Pheasants, Inc. (Janesville,
WI). Experiment 2 utilized 1,770 eggs from a single breeder flock collected on April 30 and
experiment 3 utilized 1,770 eggs from a single flock at the end of laying season collected on July
18.
Egg storage conditions
In all experiments, eggs were randomly assigned to one of five storage temperature
treatments: 10.0, 12.8, 15.6, 18.3, or 21.1°C (50, 55, 60, 65, or 70°F). All eggs were received on
day of or day after collection at the breeder farm, transported to the University of Arkansas, and
maintained at a room temperature of approximately 21.7°C (71°F) overnight. At 6:00 h the
following morning eggs were subjected to their respective treatment temperatures using 5
incubators (GQF Sportsmen Series, GQF Manufacturing Company, Inc., Savannah, GA, USA)
placed inside a single walk-in cooler maintained at 7.2°C (45°F). With the ambient temperature
of the cooler below the lowest storage temperature, each of the incubators could be heated up to
its target temperature. Prior to the experiment, machines were calibrated to hold their respective
treatment temperature while in the cooler. Internal thermometers and fans provided circulation
and even temperatures throughout each machine. Digital probes (AcuRite model 00568SBDI,
Chaney Instrument Co., Lake Geneva, WI, USA) inside the cooler and each machine were used
to record temperature and humidity throughout the experiment. Observed temperatures did not
36
fluctuate more than ± 1.1°C (2°F) from target for any treatment. Eggs were stored for a period of
7 d.
Incubation and hatching conditions
Following a storage period of exactly 7 d, eggs were removed from the treatment
machines at 6:00 h and moved into the hatchery hallway. All eggs were randomly distributed
into the same setter machine (Ps500, Jamesway Incubator Company, Inc. Cambridge, ON,
Canada). The setter was programmed to 26.7°C (80°F) for 4 h to allow all eggs to reach the same
temperature prior to incubation.
Incubation parameters of the quail eggs followed commercial recommendations and
included a temperature of 37.5°C (99.5°F) at 60% relative humidity from 0 to 14 d in the setter
and 36.9°C (98.5°F) at 62% relative humidity from 14 to 18 d in the hatcher. Quail eggs were
turned every half hour while in the setter. Incubation parameters of the pheasant eggs also
followed commercial recommendations and included a temperature of 37.2°C (99.0°F) at 51%
relative humidity from 0 to 21 d in the setter and 36.7°C (98.0°F) at 52% relative humidity from
21 to 24 d in the hatcher. Pheasant eggs were turned every hour while in the setter. All eggs
within an experiment were randomly distributed and separated by basket in the same hatcher
(Ps500 Jamesway Incubator Company, Inc. Cambridge, ON, Canada).
After the 18 d incubation period for the quail or the 24 d period for the pheasant, hatched
chicks were removed from the hatcher. Chick quality was measured by visual observation
including incidence rate of splay legs and cull chicks (open navel, deformity, or otherwise would
not be placed in industry practice). Unhatched eggs were broken open to determine fertility, time
of embryo mortality or progress of hatch, and incidence of anomaly, malposition and
contamination using methods from Hamburger and Hamilton (1951), Fant (1957), and

37
Ainsworth et al. (2010). In the pheasant experiments, a separate pilot trial was conducted using
28 eggs which were incubated without being subjected to the storage treatments. These eggs
were individually weighed at the start of incubation and again at transfer on d 21 to evaluate
moisture loss, which is often used as a tool to assess incubation parameters and adequate gas
exchange. In addition, the sample of eggs served as a pilot hatch for this particular strain of
pheasants and provided an estimation of total h of incubation.
Determination of growth performance
In all experiments chicks were placed in floor pens randomly distributed by treatment in
an experimental rearing facility. Each pen was equipped with a 1.524 m (5 ft) diameter circle of
cardboard to create a brooding ring, a single water line with 5 nipples, and 3 supplemental
waterers (NDF, Stromberg’s, Pine River, MN). Starter feeds for each species were manufactured
to meet nutritional needs (National Research Council, 1994) of the chicks and were provided in 2
feeders in each pen (355900E, Georgia Poultry Equipment, Newton Grove, NC). Mortality
weights were recorded daily. Feed and water were provided ad libitum and other specifications
were aligned to industry standards from the Production Manual of Quail International, Inc and
the MacFarlane Pheasants, Inc. Brooder Manual.
In experiment 1 quail chicks hatched from each of the 10.0, 12.8, 15.6, 18.3, and 21.1°C
treatments were divided and placed into 4 pens per treatment of 190 birds each. Bird weight and
feed consumption were recorded per pen at placement, d 7, and d 10.
In the pheasant experiments, chicks hatched from each of the 10.0, 12.8, 15.6, 18.3, and
21.1°C treatments were divided and placed into a maximum number of pens according to the
outcome of each hatch, while maintaining equal bird density. In experiment 2, there were 4 pens
of the 10.0 and 12.8°C treatments and 3 pens of the 15.6, 18.3, and 21.1°C treatments, with 65
38
birds per pen. In experiment 3, there were 4 pens of the 12.8°C treatment, 3 pens of 10.0, 15.6,
and 18.3°C treatments, and 2 pens of the 21.1°C treatment, with 60 birds per pen. Bird weight
and feed consumption were recorded per pen at placement and d 7.
Statistical Analyses
Due to an industry-wide fertile quail egg shortage, we were not able to complete a
replicate quail trial as was done for the pheasants. Therefore, the quail data are reported as means
observed in experiment 1.
Pheasant data were analyzed using SAS 9.4 (Cary, NC) using the GLIMMIX procedure
for ANOVA. The experimental unit was the egg storage machine and the data were blocked by
the 2 replicate pheasant experiments. Each egg was an observational unit for the hatch data, each
pen was an observational unit for the post-hatch data. Proportional hatch data was analyzed
assuming a beta distribution. Any P ≤ 0.05 was considered statistically significant.
RESULTS AND DISCUSSION
The ideal, and maximum, amount of time that chicken eggs can be stored has been
debated, but storage up to 7 d is considered to have minimal impact on hatchability and chick
quality (Fasenko, 2007). A storage period of 7 d was chosen in this experiment so that eggs had
sufficient time to be influenced by treatment temperatures without being directly influenced by
time alone. It is also common practice in quail and gamebird operations to store eggs for longer
than what is typical in a chicken hatchery. Lower temperatures are preferred with longer egg
storage (Brake et al., 1997).
Although the quail trial could not be replicated, it proved to be a beneficial preliminary
experiment that confirmed a sensitivity within the tested range of egg storage temperatures. In
experiment 1, quail eggs had the highest observed hatch of fertile (HOF) for the 10.0°C egg

39
storage treatment at 90.43%, with little decrease for the storage temperatures of 12.8 and 15.6°C
(Table 2.1). The lowest HOF was observed for eggs stored at 21.1°C, 83.60%. The cull rate
trended up with temperature. Means appeared similar among treatments for BW, FCR, or
mortality (Table 2.1). However, the numerical trends of BW and FCR follow a similar pattern to
that of hatchability. The influence of egg storage temperature on HOF for quail was similar to
that of the pheasant, indicating that the Japanese (Coturnix) quail may be a beneficial model for
pheasants and other game birds. The Japanese quail has also been proclaimed as a useful poultry
research model (Wilson et al., 1961; Huss et al., 2008). Experiments by Wilson et al. (1984)
using a non-domesticated quail, the Bobwhite, found that storage should not extend beyond 7 d
and during that time, tested temperatures played a minimal role in hatchability. However,
prolonged storage was most successful at a temperature of 12.8°C, which is similar to the current
findings.
At transfer, moisture loss of pheasant eggs was 15.5% on average for the eggs that
hatched during the pilot trial. Generally, chicken and turkey eggs should lose about 12% by
transfer at 18 d for optimum results (Hulet et al., 1987; Meijerhof and Van Beek, 1993; Cobb,
2008). The larger proportional loss in pheasant eggs during the pilot study was likely a result of
two factors. First, pheasant eggs are in the setter for 3 d longer than chicken eggs which allows
more time for moisture to escape the egg. Secondly, pheasant eggs are physically smaller in
dimension, and have a higher surface area to volume ratio, giving more opportunity for relative
gas exchange through the shell.
Pheasant eggs stored at 10.0 and 12.8°C yielded the highest (P < 0.001) HOF values of
79.6 and 80.6%, respectively (Table 2.2). The HOF was intermediate for eggs stored at
temperatures of 15.6 and 18.3°C, and lowest when eggs were stored at 21.1°C (63.2%). The low

40
HOF for the 21.1°C stored eggs was due to the significantly higher (P = 0.010) early embryonic
mortality and a higher trend (P = 0.067) in late embryonic mortality. The incidence of anomalies
and malpositions were not determined for each treatment during both experiments, so statistical
analyses are not possible for this data set; however, observed means are reported in Table 2.3.
The 2 pheasant hatches also had differing incidence of splay leg possibly as a result of season or
hatch basket; however, the observed average rate was 0.57% for the 12.8°C treatment and was
numerically higher for 15.6 and 18.3°C; the highest observed rate was for 21.1°C at 3.71%. A
similar trend was observed for total cull rate. The BW at 0 or 7 d, FCR, or mortality were not
affected (P > 0.05) by the egg storage temperature (Table 2.3). This may indicate that the tested
temperatures of egg storage influenced the pheasant embryo during storage and development,
especially early on as noted by the early embryonic mortality rates, but once the chicks hatched
their growth potential was not altered.
The present study found that temperature did play a significant role in HOF, which was
highest at 10.0 and 12.8°C for pheasant. Quail had a very similar response. Since the lower
temperature tested of 10.0°C also yielded the highest HOF, future investigations of egg storage
temperature should contain additional treatments below 10.0°C to determine the lower limit. The
temperatures that yielded the highest HOF also result in the highest chick quality and lowest cull
rate, indicating that ideal egg storage temperatures for both species may be lower than that of
chickens which is approximately 21°C. A possible explanation for this species difference is that
over decades of commercial production inadvertent genetic selection of chickens occurred for the
eggs hatching better after storage at near room temperatures. The climate and geographic
location where each species evolved may also explain the difference; chickens have evolved in
tropic and sub-tropic regions of southeast Asia, this particular species of pheasant comes from a
41
temperate region of central and northern China, and the quail also have temperate climate
ancestry throughout Asia and the Middle East.
CONCLUSIONS AND APPLICATIONS
1. Hatchability is significantly impacted by storage temperature when hatching eggs are
stored for 7 d. A preliminary experiment using Japanese (Coturnix) quail indicated that
HOF is sensitive to egg storage temperatures in the range of 10.0 to 21.1°C.
2. Pheasant eggs had the highest HOF when stored at 10.0 and 12.8°C, indicating that hatch is
likely not negatively impacted when eggs are stored below 12.8°C. Storing pheasant eggs
at 21.1°C significantly increased early embryonic mortality, but storage temperature did not
affect performance.
3. Quail eggs had the highest observed HOF when stored at 10.0°C, additional experiments
are needed to confirm these preliminary data.
4. Quail and pheasants responded similarly to egg storage temperature. These findings also
indicated that quail and pheasant eggs respond differently to storage temperature than do
chicken eggs.
5. Further experiments are necessary to determine the lower limits of quail and pheasant egg
storage temperature and model the ideal egg storage conditions for each species.
ACKNOWLEDGEMENTS
We thank MacFarlane Pheasants, Inc. and all of their staff for supplying the pheasant
eggs and practical recommendations necessary for this project. Appreciation is also extended to
Quail International, Inc. and Raul Otalora for providing the quail eggs and technical advice used
in these experiments.

42
REFERENCES
Ainsworth, S. J., R. L. Stanley, and D. J. R. Evans. 2010. Developmental stages of the Japanese
quail. J. Anat. 216:3–15.
Benton, C. E., and J. Brake. 1996. The effect of broiler breeder flock age and length of egg
storage on egg albumen during early incubation. Poult. Sci. 75:1069–1075.
Brake, J., T. J. Walsh, C. E. Benton, J. N. Petitte, R. Meijerhof, and G. Peñalva. 1997. Egg
handling and storage. Poult. Sci. 76:144–151.
Bramwell, R. K., and S. Martin. 2008. On-farm egg storage: avoid pre-incubation. Poult. Int. 47.
Cobb. 2008. Hatchery management guide. Siloam Springs, AR.
Fant, R. J. 1957. Criteria for aging pheasant embryos. J. Wildl. Manage. 21:324–328.
Fasenko, G. M. 2007. Egg storage and the embryo. Poult. Sci. 86:1020–1024.
Funk, E. M., and J. Forward. 1960. Effect of holding temperature on hatchability of chicken
eggs.in Research Bulletin. University of Missouri Agricultural Experiment Station.
Hamburger, V., and H. L. Hamilton. 1951. A series of normal stages in the development of the
chick embryo. J. Morphol. 88:49–92.
Hulet, R. M., V. L. Christensen, and L. G. Bagley. 1987. Controlled egg weight loss during
incubation of turkey eggs. Poult. Sci. 66:428–432.
Hurnik, G. I., B. S. Reinhart, and J. F. Hurnik. 1978. Relationship between albumen quality and
hatchability in fresh and stored hatching eggs. Poult. Sci. 57:854–857.
Huss, D., G. Poynter, and R. Lansford. 2008. Japanese quail (Coturnix japonica) as a laboratory
animal model. Lab Anim. (NY). 37:513–519.
Lapão, C., L. T. Gama, and M. Chaveiro Soares. 1999. Effects of broiler breeder age and length
of egg storage on albumen characteristics and hatchability. Poult. Sci. 78:640–645.
Mead, R. A. 1993. Embryonic diapause in vertebrates. J. Exp. Zool. 266:629–641.
Meijerhof, R. 1992. Pre-incubation holding of hatching eggs. Worlds. Poult. Sci. J. 48:57–68.
Meijerhof, R., and G. Van Beek. 1993. Mathematical modelling of temperature and moisture loss
of hatching eggs. J. Theor. Biol. 165:27–41.
National Research Council. 1994. Nutrient requirements of poultry. National Academies Press.
Wilson, W. R., U. K. Abbott, and H. Abplanalp. 1961. Evaluation of Coturnix (Japanese Quail)
as a pilot animal for poultry. Poult. Sci. 40:651–657.
43
Wilson, H. R., B. L. Beane, and D. R. Ingram. 1984. Hatchability of Bobwhite Quail eggs: effect
of storage time and temperature. Poult. Sci. 63:1715–1718.
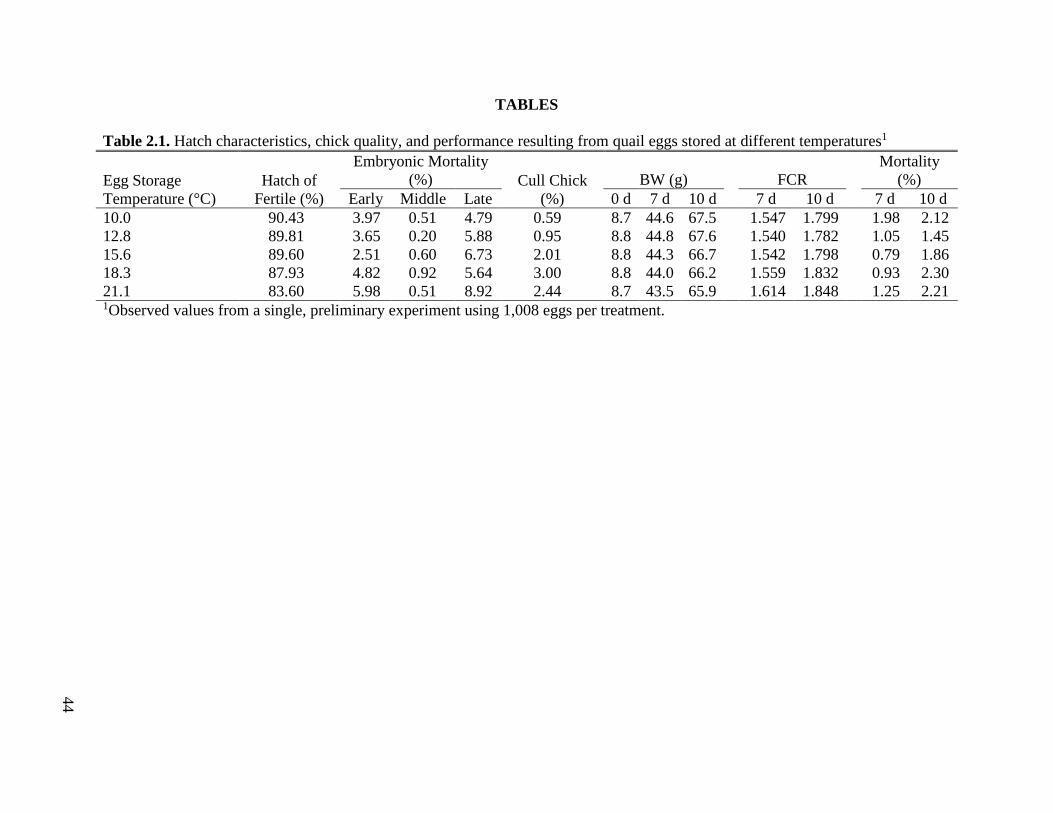
44
TABLES
Table 2.1. Hatch characteristics, chick quality, and performance resulting from quail eggs stored at different temperatures1
Egg Storage
Temperature (°C)
Hatch of
Fertile (%)
Embryonic Mortality
(%) Cull Chick
(%)
BW (g) FCR
Mortality
(%)
Early Middle Late 0 d 7 d 10 d 7 d 10 d 7 d 10 d
10.0 90.43 3.97 0.51 4.79 0.59 8.7 44.6 67.5 1.547 1.799 1.98 2.12
12.8 89.81 3.65 0.20 5.88 0.95 8.8 44.8 67.6 1.540 1.782 1.05 1.45
15.6 89.60 2.51 0.60 6.73 2.01 8.8 44.3 66.7 1.542 1.798 0.79 1.86
18.3 87.93 4.82 0.92 5.64 3.00 8.8 44.0 66.2 1.559 1.832 0.93 2.30
21.1 83.60 5.98 0.51 8.92 2.44 8.7 43.5 65.9 1.614 1.848 1.25 2.21 1Observed values from a single, preliminary experiment using 1,008 eggs per treatment.
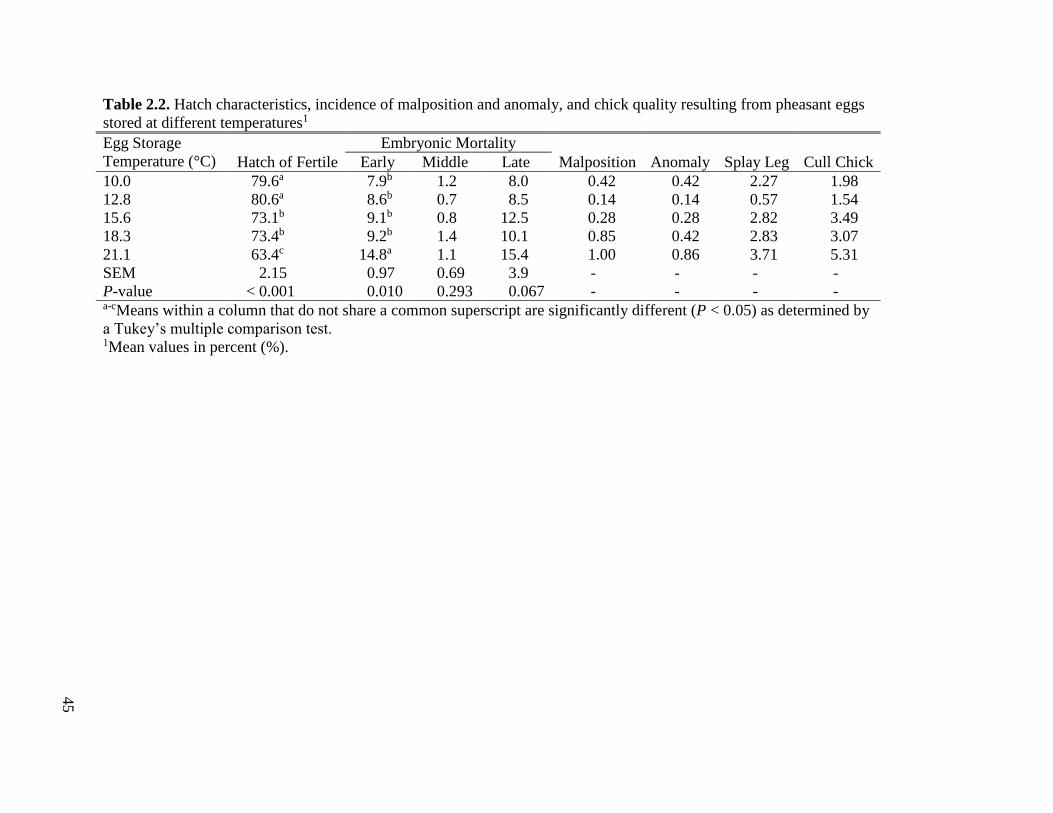
45
Table 2.2. Hatch characteristics, incidence of malposition and anomaly, and chick quality resulting from pheasant eggs
stored at different temperatures1
Egg Storage
Temperature (°C) Hatch of Fertile
Embryonic Mortality
Early Middle Late Malposition Anomaly Splay Leg Cull Chick
10.0 79.6a 7.9b 1.2 8.0 0.42 0.42 2.27 1.98
12.8 80.6a 8.6b 0.7 8.5 0.14 0.14 0.57 1.54
15.6 73.1b 9.1b 0.8 12.5 0.28 0.28 2.82 3.49
18.3 73.4b 9.2b 1.4 10.1 0.85 0.42 2.83 3.07
21.1 63.4c 14.8a 1.1 15.4 1.00 0.86 3.71 5.31
SEM 2.15 0.97 0.69 3.9 - - - -
P-value < 0.001 0.010 0.293 0.067 - - - - a-cMeans within a column that do not share a common superscript are significantly different (P < 0.05) as determined by
a Tukey’s multiple comparison test. 1Mean values in percent (%).
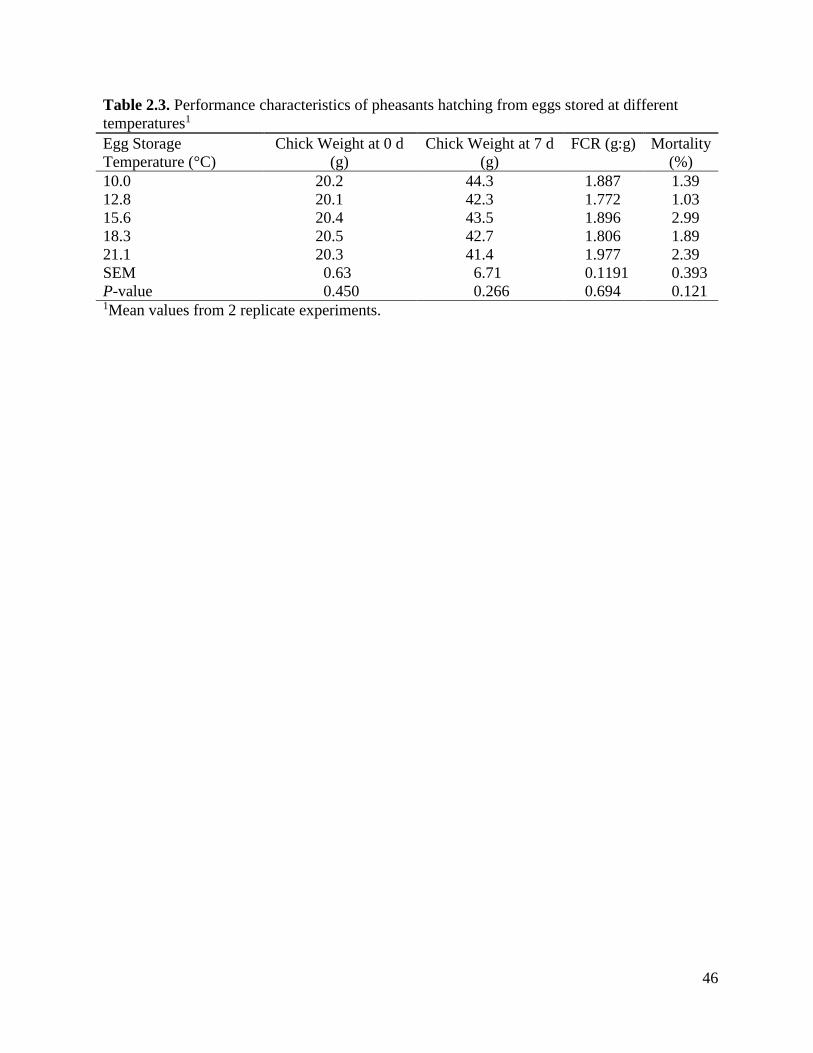
46
Table 2.3. Performance characteristics of pheasants hatching from eggs stored at different
temperatures1
Egg Storage
Temperature (°C)
Chick Weight at 0 d
(g)
Chick Weight at 7 d
(g)
FCR (g:g) Mortality
(%)
10.0 20.2 44.3 1.887 1.39
12.8 20.1 42.3 1.772 1.03
15.6 20.4 43.5 1.896 2.99
18.3 20.5 42.7 1.806 1.89
21.1 20.3 41.4 1.977 2.39
SEM 0.63 6.71 0.1191 0.393
P-value 0.450 0.266 0.694 0.121 1Mean values from 2 replicate experiments.
47
CHAPTER III
MANUSCRIPT:
Effects of hatch window and nutrient access in the hatcher on performance and processing
yield of broiler chicks reared according to time of hatch2
2Prepared for submission to Poultry Science
48
ABSTRACT
This experiment investigated the effects of hatch window and nutrient availability in
hatching baskets on organ weights, performance, and processing yield of broilers. Eggs were
hatched in illuminated hatchers. At the end of each hatch window period (HWP), hatched chicks
were placed into either: control (CTL) hatching baskets with no nutrients or baskets providing
access to feed and water (FAW). This resulted in 6 treatments in a factorial arrangement of 3
HWP (early, middle, or late) and 2 basket types (CTL or FAW). Chicks remained in
experimental baskets until 504 h and were then subjected to a 4 h holding period at the hatchery
without nutrient access. Subsequently, 1,500 hatched chicks were reared in floor pens for 42 d
with 5 replicate pens per treatment. Common phase-fed diets and water were provided ad
libitum. Bird weights and feed consumption were recorded weekly. Individual bird weights were
taken at 21 and 42 d. At 43 d, 14 males from each pen were processed. There was an interaction
between HWP and basket type for placement BW (P = 0.028) and BW change in the hatcher (P
< 0.001). The HWP influenced BW at hatch (P = 0.007), 7 d (P < 0.001), and 14 d (P < 0.001)
and FI at 7 d (P < 0.001) and 14 d (P = 0.002). Chicks from FAW baskets were heavier (P <
0.001) than those from CTL baskets at 7 d; afterwards they were similar (P > 0.05) in BW. Yolk
and liver weights were similar (P > 0.05) between basket treatments at 3 d post-hatch. No
differences (P > 0.05) in FCR, mortality, or processing were observed between basket
treatments. Interestingly, early hatching chicks were lightest at hatch but higher FI drove an
increased BWG. The findings indicate that hatcher nutrient access may reduce weight loss in the
hatcher, especially for early hatching chicks, but had no influence on subsequent performance or
processing yields beyond 7 d post-hatch.
Key words: early feeding, nutrient access, hatch window, hatcher, broiler

49
INTRODUCTION
Once a chick hatches it remains in the hatcher for a variable amount of time depending
upon many influences, but one of the most influential is the hatch window. Hatch window refers
to the period of time, from first egg to last egg, in which a group of eggs laid in a clutch or set
together in a hatcher will hatch. This spread of hatch affects early development and has been
shown to be impacted by many factors including the age of parent flock (Almeida et al., 2008),
length and environmental conditions of egg storage (Mather and Laughlin, 1977; Tona et al.,
2003), incubation parameters and chick communication (Tong et al., 2013), and homogeneity or
heterogeneity of the eggs. Commercially produced broilers generally have a 24 to 48 h hatch
window, and a shorter time is preferred to avoid problematic dehydration of early hatchers. The
commonly regarded 21 d or 504 h incubation period varies in true duration and the chick
typically leaves the egg prior to this point, allowing it sufficient time to dry off and mature to an
ambulatory chick. After processing at the hatchery (e.g. sexing, counting, vaccinating, boxing)
chicks are then transported to the farm, where feed and water is typically first available. Clearly,
earlier hatching chicks have a longer delay in access to exogenous nutrients than their later
hatching counterparts. Indeed, Careghi et al. (2005) suggested that the beginning of delays in
feed access should be determined from the time of hatch and not when the hatch is pulled.
It is well documented that chicks held for extended periods of time in the hatchery, or
that are in any other way subjected to extended delays of access to feed and water, will have
hindered immediate and long term performance (Noy and Sklan, 1997; Vieira and Moran, 1999;
Bigot et al., 2003). Compared to chicks placed after pull of hatch, chicks remaining in the
hatcher for an additional 24 h weighed less and lost approximately 5% BW during that time
(Casteel et al., 1994). Similarly, Pinchasov and Noy (1993) found that chicks and poults lost
50
approximately 10% of their initial weight when fasted during a holding period of 48 h after
hatch, and that weight loss was attributed almost completely to the degradation of the yolk sac
during the first 24 h post-hatch. From 24 to 48 h post-hatch, two-thirds of the weight loss was
due to degradation of the yolk sac. The process of hatching is very energetically demanding, and
afterwards the chick must transition from endogenous to exogenous nutrients. This process is
accompanied by the appropriate morphological and physiological changes of the chick’s
gastrointestinal tract (Noy and Sklan, 1997) and may be enhanced with early feeding.
Several approaches to early feeding, including in ovo and hatcher feeding, have been
investigated with varying degrees of success, as reviewed by multiple authors (Noy and Sklan,
1999; Noy and Uni, 2010; Willemsen et al., 2010). One particular method of early feeding is
providing nutrients immediately post-hatch in the hatching baskets or during transportation from
the hatchery to the farm. Feeding various diets to chicks in trays while held at the hatchery
through to placement (5 h period) increased 7 d BWG for fed birds compared to fasted birds, but
there were no differences in live performance, processing or small intestine weights (Kidd et al.,
2007). Similarly, others have found that the immediate access to feed affects growth and
development during the first week post-hatch; however, compensatory growth of fasted and early
hatching chicks may diminish these early benefits (Lamot et al., 2014).
Most of the previous literature on early post-hatch feeding has focused on comparing fed
birds to those exposed to fasting periods of 24 h or more. Although this approach can help
generate physiological responses and mimic longer transport times common in many countries,
such extended fasting periods are not typically observed in broiler production settings of the
United States. Most published experiments also involve immediate feed access to chicks from
different hatching times by removing them from the hatcher and placing them in rearing facilities
51
rather than providing feed throughout the hatch within the baskets. Therefore, the current
experiment was conducted to examine the effects of providing nutrient access in the hatching
baskets on the subsequent live performance and processing yields of chicks subjected to industry
standard holding times. Furthermore, potential interactions of hatching basket nutrient access
with the time of hatch within a hatching window were considered.
MATERIALS AND METHODS
This experiment was conducted at the University of Arkansas Poultry Research Farm
(Fayetteville, AR). All animal care and experimental procedures were approved by the
University of Arkansas Institutional Animal Care and Use Committee prior to initiation of the
experiment.
Egg source and incubation
Fertile eggs from a single, 39 wk old Cobb MV x 500 breeder flock were sourced from a
commercial broiler integrator. Eggs were transported to the University of Arkansas Poultry
Research Farm hatchery and held overnight in an egg storage room at 18.3°C. All eggs were then
set in a single machine (Ps500 Jamesway Incubator Company, Inc. Cambridge, ON, Canada) and
incubated using a common broiler profile of 37.6°C at 55% relative humidity (29.4°C wet bulb)
from 0 to 18 d. Eggs were turned every hour.
Nutrient access and hatch window
At 18 d of incubation, eggs were transferred into standard hatch baskets within two
hatchers (Ps500 Jamesway Incubator Company, Inc. Cambridge, ON, Canada) set at 36.7°C and
54% relative humidity (27.8°C wet bulb) until time of pull at 504 h. The hatchers were equipped
with LED lighting to provide approximately 21.5 lux to the interior of the hatching baskets.
Forty hatching baskets without eggs were also placed in the hatchers and designated as control
52
(CTL) baskets with no nutrients provided or baskets containing feed and water (FAW). The feed
provided in the FAW baskets was the same crumbled starter subsequently fed to all chicks at
placement (Table 3.1). Feed and water were provided ad libitum in 50 mL reagent reservoirs
(89094-680 VWR International, West Chester, PA, USA). Each basket received 3 reservoirs
containing a total of 150 g of water and 3 reservoirs containing a total of 350 g of feed. Recorded
amounts of water and feed were added as needed to ensure baskets never ran out. When chicks
were removed from the hatcher, remaining feed and water were weighed. Three separate
hatching baskets in each hatcher never contained chicks but were configured as FAW baskets to
measure evaporative water loss.
In addition to nutrient access in the hatching basket, a second treatment factor included
hatch window period (HWP). A previous pilot trial was conducted by hatching eggs from a
similar breeder flock to determine the spread of hatch and define a hatch window. Based on these
data it was determined that the hatch window be divided into 3 HWP referenced by number of
hours until pull (early, 24 to 18 h; middle, 18 to 12 h; late, 12 to 6 h). At the end of each HWP,
all hatched chicks were removed from their standard basket, tagged for identification, weighed,
and placed into either a CTL or FAW experimental basket until the hatch was pulled at 504 h. A
chick was defined as hatched once fully and independently cleared from the shell. The HWP in
which a chick hatched established the amount of time chicks had access to the experimental
hatching baskets (CTL or FAW). Chicks in early, middle, and late HWP had 18, 12, or 6 h
access to experimental hatching baskets, respectively. The relatively few chicks that hatched
more than 24 h before or within 6 h of pull were not used in this experiment. There were 20 CTL
(7 early, 9 middle, and 4 late HWP) and 20 FAW (6 early, 8 middle, and 6 late HWP) hatching
baskets, with each basket containing 50 chicks.
53
Growout, sampling, and processing
At 21 d, experimental baskets were removed from the hatcher. Chicks from each
experimental basket were weighed and placed into a chick box. Chicks were held at the hatchery
in these boxes for 4 h to simulate commercially-relevant processing and holding times and no
nutrients were provided for any chicks during this time. At the conclusion of the holding time,
chicks were transported to an experimental rearing facility for placement. Of the 40 experimental
baskets, 15 CTL (5 early, 6 middle, and 4 late HWP) and 15 FAW (5 early, 5 middle, 5 late)
were utilized for the growout.
All 50 chicks from each experimental basket were placed in a single floor pen to assess
live performance in a 42 d experiment. The pens measured 1.52 x 3.05 m and contained used
litter that had been top-dressed with fresh pine shavings. Each pen had 2 hanging feeders with
commercial feed pans and a single water line with 10 nipples. At 3 d post-hatch 3 birds from
each pen were randomly selected and euthanized and their yolk sacs and livers were collected
and weighed. Bird weights and feed consumption were recorded weekly by pen. Individual bird
weights were taken at 21 d and 42 d to assess uniformity. Mortality and associated weights were
recorded daily. Common starter (0 to 14 d), grower (14 to 28 d), and finisher (28 to 42 d) feeds
(Table 3.1) and water were provided ad libitum. Feed was removed from the pens 10 h prior to
processing on 43 d. Fourteen males from each pen were randomly selected, wing-banded, and
processed for determination of carcass and parts weights and yields. Following evisceration,
birds were chilled in ice water for 4 h before deboning.
Statistical analysis
The experiment consisted of 6 treatments in a factorial arrangement of 3 HWP (early,
middle, or late) x 2 hatching basket types (CTL or FAW), with 6 replications of the CTL-middle
54
HWP group, 4 replications of the CLT-late HWP group, and 5 replications for all other
combinations. Hatcher location was the blocking factor for all hatch data and pen location was
the blocking factor for live performance and processing data. All data were analyzed using SAS
9.4 (Cary, NC). The MIXED procedure was utilized for ANOVA, with a Tukey’s multiple
comparison test used to separate means. Any P ≤ 0.05 was considered statistically significant.
RESULTS AND DISCUSSION
In the current experiment, the time of hatch directly coincided with the time at which
chicks had access to nutrients in the hatching basket. As such, we hypothesized that any changes
in chick weight that may occur in the hatcher due to dehydration or yolk utilization would be
influenced by both HWP and hatching basket nutrient access. At time of hatch, BW were highest
(P = 0.007) for late hatchers, lowest for early hatchers, and intermediate for middle hatchers
(Table 3.2). This finding is in agreement with the study of Lamot et al. (2014) who also found
that earlier hatching chicks were lighter than later hatchers. By the time of pull at 504 h, chicks
in early, middle, and late HWP had 18, 12, or 6 h of access to their experimental basket (CTL or
FAW). Chicks from CTL baskets had a larger decrease in BW from hatch to pull compared to
the chicks from FAW baskets; however, this change in BW varied among HWP groups, leading
to a significant (P < 0.001) HWP x basket treatment interaction. Chicks from the FAW-early
HWP group did not lose any BW (P = 0.954) but the FAW-middle and late HWP lost 0.23 and
0.42 g respectively. These later hatchers likely did not have enough time to consume an amount
of water and feed that would counter the dehydration and yolk utilization, it is also possible that
there is a learning period for chicks to locate and start consuming nutrients. An inverse pattern of
HWP BW change was observed for CTL chicks. Chicks from the CTL-early HWP lost 2.49 g or
5.36% BW and chicks from CTL late HWP lost 0.93 g or 1.99% BW, thus finding that the longer
55
the CTL chicks were without nutrients in the hatcher after hatching, the more (P < 0.001)
absolute and relative BW they lost. Similarly, Sklan et al. (2000) reported that chicks and poults
without nutrients in hatching baskets decrease linearly in BW while in the hatcher, losing
between 0.14 and 0.17 g per h, but by providing feed access the amount lost can be decreased
especially for early hatching chicks and poults.
Interestingly, after removal from the hatcher, chicks from the FAW baskets lost more (P
< 0.001) BW, 0.79 g or 1.68%, during the 4 h hatchery holding period than the CTL chicks, 0.50
g or 1.11% (Table 3.2). A possible explanation for this is that the CTL chicks have already lost a
lot of moisture while in the hatcher, while the FAW chicks consumed water and therefore had
more water to lose. Even though the FAW chicks lost more BW during holding they still had a
1.45 g higher BW at placement compared to CTL chicks and there was a significant (P = 0.028)
interaction with HWP (Table 3.2). The HWP also influenced absolute (P = 0.032) and relative (P
= 0.028) BW change from pull to place and the early HWP lost more relative BW than the
middle HWP, the late HWP was intermediate. Overall weight change from hatch until placement
had a significant (P < 0.001) interaction between HWP and basket type. The chicks from FAW
baskets lost similar amounts of BW among HWP but the CTL-early HWP lost more than the
middle and late HWP groups. During this time, chicks from CTL baskets lost more than double
the amount of BW as the FAW group.
An attempt was made to measure consumption of water and feed by chicks from each
HWP while in the hatcher. It was evident water and feed disappearance occurred in the FAW
hatching baskets and there were trends for more disappearance as access time increased (i.e.
greater consumption for early hatchers than late hatchers). Additionally, feed could be visually
observed in the crop of chicks from FAW baskets. However, the calculated feed and water
56
consumption, even after accounting for evaporation loss, did not logically line up with the BW
change. It is likely that the necessity to move hatch baskets led to more feed and water loss than
anticipated, in addition to wastage by the chicks. Nonetheless, the baskets were arranged so that
chicks in CTL baskets did not have access to any FAW from the aforementioned spillage.
Sampling at 3 d post-hatch showed that the yolk-free BW, 85.43 g, of chicks from FAW
baskets was higher (P < 0.001) than that of chicks from CTL baskets, 80.01 g (Table 3.3).
Absolute and relative residual yolk weights were not different between FAW and CTL indicating
that the chicks from FAW baskets were growing more body tissue. Chicks from the late HWP
had lower (P = 0.012) yolk-free BW, 79.92 g, and higher (P = 0.025) relative yolk weight,
2.65%, compared to those from the early HWP, 85.33 g and 2.17%, and the middle HWP was
intermediate. This trend in yolk-free BW is inverse to what is expected based on the observed
placement BW but may be explained by 7 d BW described later. Absolute yolk weight was not
different between HWP (P = 0.075). The weight or relative weight of the liver was not different
(P > 0.05) between any of the groups. This all suggests that yolk-free BW differences were not
due to yolk size and utilization or variations in liver growth.
At 7 d, chicks from FAW baskets remained heavier than the CTL chicks (P < 0.001) but
at 14 d they had similar BW (P = 0.146) and remained similar (P > 0.05) in BW throughout the
remainder of the experiment (Table 3.4, 3.5). No differences in BWG, FI, or FCR were observed
beyond 7 d (Table 3.4, 3.5) which is in agreement with the finding of Kidd et al. (2007) who also
observed transient improvements in early growth. However, the current findings are in contrast
to other studies that reported sustained benefits in performance up to 42 d after providing early
feed access (Noy and Sklan, 1999; Henderson et al., 2008). However, each of these studies
compared fed chicks to those that were fasted for more than 24 h, and methods of nutrient

57
provision differed from the current experiment. Sklan et al. (2000) provided feed to chicks and
poults in the hatching baskets and reported a heavier BW of fed chicks compared to a control to
21 d post-hatch. The longer hatch window and holding time during that study may have
accounted for the sustained depression of BW in control birds and the contrast to the current
study. These inconsistent findings indicate that the amount of time a chick is with or without
nutrients, after its true time of hatch and before the time it is placed in the house, make a
significant impact on the potential for future performance of that chick. Also, the method and
type of nutrients provided may not provide equal benefits. It is recommended that the definition
of early feeding be refined so that future references to the term mean only methods of which to
provide chicks nutrients post-hatch (to differentiate from in ovo feeding) and pre-placement on
farm (with industry relevant holding times).
No significant (P > 0.05) HWP x nutrient access interactions were observed during the
growout but each main effect influenced broiler performance. The middle and late HWP chicks
were heavier than early HWP chicks at placement (P < 0.001) (Table 3.2). Interestingly, the
inverse was observed at d 7 whereby chicks from the early HWP were significantly heavier than
chicks from middle and late HWP (P < 0.001) and they remained heavier at d 14 (P < 0.001)
(Table 3.4). The switch in BW at 7 d was made by the significantly higher BWG of chicks from
the early HWP (P < 0.001) as a result of increased FI (P < 0.001) (Table 3.4). The FCR was not
a contributor, and in fact, the later hatching chicks tended to have a lower FCR than earlier
hatching chicks (P = 0.054). Lamot et al. (2014) had similar findings that earlier hatching chicks
are lighter at placement but at d 4, through compensatory growth, become heavier than later
hatching counterparts. We observed that 14 d cumulative BWG (P < 0.001) and FI (P = 0.002)
continued to be highest for the early HWP, but were similar (P > 0.05) among HWP for the

58
remainder of the experiment (Table 3.5). After 14 d, chicks from each HWP were also similar (P
> 0.05) in BW.
Uniformity of BW is a production target that is considered an indicator of overall broiler
health and performance (Cobb, 2018). Other authors have reported that feeding in hatching
baskets improves growth and uniformity from placement to 21 d (Sklan et al., 2000) even though
chicks start their feeding and growth curve at different times depending on the hatch window. In
the current experiment, average BW CV among all treatment groups was 9.4% at 21 d and
10.7% at 42 d, with no effects of treatment observed (Table 3.6). Mortality, a direct indicator of
flock health, was not affected by any of the treatments and the cumulative average was 2.01% at
42 d (Table 3.6). With low overall BW CV and mortality this was considered a good performing
and desirable flock, treatment differences could potentially be detected in a more challenging
environment or with a less desirable flock.
Previous reports have found that early post-hatch fasting decreased satellite cell
proliferation and delayed growth, suggesting the importance of immediate postnatal feeding
(Halevy et al., 2000). Others have found that there is no compensatory response in the satellite
cell populations following early post-hatch fasting but also suggested that any improvements in
post-hatch muscle growth through early feeding were not occurring through a satellite cell
mitotic pathway (Mozdziak et al., 2002). In the current study, meat yield was an important
measure of muscle growth and processing took place at 43 d post-hatch. There were no
differences between FAW and CTL birds for any of the processing weights or yields (Table 3.7,
Table 3.8). There is no published processing data on chicks fed in the hatching basket. However,
other early feeding studies have shown improved breast yield of fed chicks at 5 d post-hatch
when compared to 48 h delay fed chicks (Wang et al., 2014) and at 36 d post-hatch when
59
compared to chicks held in boxes for 34 h (Noy and Sklan, 1999). Although there were no
differences in 42 d BW among HWP groups in the current experiment, live weight of birds
processed from the early and middle HWP groups were heavier (P = 0.026) than those from late
HWP group. This is possibly due to the fact that a sub-sample of only males were randomly
selected for processing, whereas live weighs taken in the house at 42 d included weights of all
birds form both sexes. A lower (P = 0.018) leg quarter weight was also observed for late HWP
compared to other HWP groups. The current experiment found that yield was similar (P > 0.05)
for all parts among all treatment groups at 43 d. Lamot et al. (2014) reported that earlier hatching
chicks had a higher breast meat yield at 18 d post-hatch compared to middle and late hatching
chickens.
Additional research of hatching basket feeding is needed to determine if the effects are
similar among other genetic strains and variations in hatch window. Obviously, differences in
holding times have created contrasts among early feeding studies and more data would assist in
finding the threshold of time without feed that a yolk can support a chick and be able to recover
via compensatory growth. The findings of this experiment indicate that feed and water access in
the hatcher may lead to higher chick weights at placement by minimizing BW loss of early
hatching chicks while in the hatcher and increase the weight of broilers during the first 7 d of
growth. However, nutrient access in the hatcher likely had no influence on final 42 d BW,
processing yield, FCR, or mortality. This study also highlighted the differences in early growth
rate between chicks hatching at various time periods within the hatch window. Earlier hatching
chicks were shown to be lighter at hatch, but had a higher FI driving BWG and allowing them to
become heavier than their later hatching counterparts at 7 d. The early BW differences observed
60
among treatment groups were transient and did not impact final 42 d BW and may suggest that 7
d BW is not an accurate predictor of treatment impacts on BW at market age.
ACKNOWEDGEMENTS
A special thanks to George’s Poultry, Inc. (Springdale, AR) for providing the eggs used
in this experiment.
61
REFERENCES
Almeida, J. G., S. L. Vieira, R. N. Reis, J. Berres, R. Barros, A. K. Ferreira, and F. V. K.
Furtado. 2008. Hatching distribution and embryo mortality of eggs laid by broiler breeders
of different ages. Brazilian J. Poult. Sci. 10:89–96.
Bigot, K., S. Mignon-Grasteau, M. Picard, and S. Tesseraud. 2003. Effects of delayed feed intake
on body, intestine, and muscle development in neonate broilers. Poult. Sci. 82:781–788.
Careghi, C., K. Tona, O. Onagbesan, J. Buyse, E. Decuypere, and V. Bruggeman. 2005. The
effects of the spread of hatch and interaction with delayed feed access after hatch on broiler
performance until seven days of age. Poult. Sci. 84:1314–1320.
Casteel, E. T., J. L. Wilson, R. J. Buhr, and J. E. Sander. 1994. The influence of extended
posthatch holding time and placement density on broiler performance. Poult. Sci. 73:1679–
1684.
Cobb. 2018. Broiler management guide. Siloam Springs, AR.
Halevy, O., A. Geyra, M. Barak, Z. Uni, and D. Sklan. 2000. Early posthatch starvation
decreases satellite cell proliferation and skeletal muscle growth in chicks. J. Nutr 130:858–
864.
Henderson, S. N., J. L. Vicente, C. M. Pixley, B. M. Hargis, and G. Tellez. 2008. Effect of an
early nutritional supplement on broiler performance. Int. J. Poult. Sci. 7:211–214.
Kidd, M. T., J. W. Taylor, C. M. Page, B. D. Lott, and T. N. Chamblee. 2007. Hatchery feeding
of starter diets to broiler chicks. J. Appl. Poult. Res. 16:234–239.
Lamot, D. M., I. B. van de Linde, R. Molenaar, C. W. van der Pol, P. J. A Wijtten, B. Kemp, and
H. van den Brand. 2014. Effects of moment of hatch and feed access on chicken
development. Poult. Sci. 93:2604–2614.
Mather, C. M., and K. F. Laughlin. 1977. Storage of hatching eggs: the effect on early embryonic
development. Br. Poult. Sci. 18:597–603.
Mozdziak, P. E., T. J. Walsh, and D. W. McCoy. 2002. The effect of early posthatch nutrition on
satellite cell mitotic activity. Poult. Sci. 81:1703–1708.
Noy, Y., and D. Sklan. 1997. Posthatch development in poultry. J. Appl. Poult. Res. 6:344–354.
Noy, Y., and D. Sklan. 1999. Different types of early feeding and performance in chicks and
poults. J. Appl. Poult. Res. 8:16–24.
Noy, Y., and Z. Uni. 2010. Early nutritional strategies. Worlds. Poult. Sci. J. 66:639–646.
Pinchasov, Y., and Y. Noy. 1993. Comparison of post-hatch holding time and subsequent early
performance of broiler chicks and turkey poults. Br. Poult. Sci. 34:111–120.
62
Sklan, D., Y. Nox, A. Hoyzman, and I. Rozenboim. 2000. Decreasing weight loss in the hatchery
by feeding chicks and poults in hatching trays. J. Appl. Poult. Res. 9:142–148.
Tona, K., F. Bamelis, B. De Ketelaere, V. Bruggeman, V. M. B. Moraes, J. Buyse, O.
Onagbesan, and E. Decuypere. 2003. Effects of egg storage time on spread of hatch, chick
quality, and chick juvenile growth. Poult. Sci. 82:736–741.
Tong, Q., C. E. Romanini, V. Exadaktylos, C. Bahr, D. Berckmans, H. Bergoug, N. Eterradossi,
N. Roulston, R. Verhelst, I. M. McGonnell, and T. Demmers. 2013. Embryonic
development and the physiological factors that coordinate hatching in domestic chickens.
Poult. Sci. 92:620–628.
Vieira, S. L., and E. T. Moran. 1999. Effects of delayed placement and used litter on broiler
yields. J. Appl. Poult. Res. 8:75–81.
Wang, Y., Y. Li, E. Willems, H. Willemsen, L. Franssens, A. Koppenol, X. Guo, K. Tona, E.
Decuypere, J. Buyse, and N. Everaert. 2014. Spread of hatch and delayed feed access affect
post hatch performance of female broiler chicks up to day 5. Animal 8:610–617.
Willemsen, H., M. Debonne, Q. Swennen, N. Everaert, C. Careghi, H. Han, V. Bruggeman, K.
Tona, and E. Decuypere. 2010. Delay in feed access and spread of hatch: importance of
early nutrition. Worlds. Poult. Sci. J. 66:177–188.
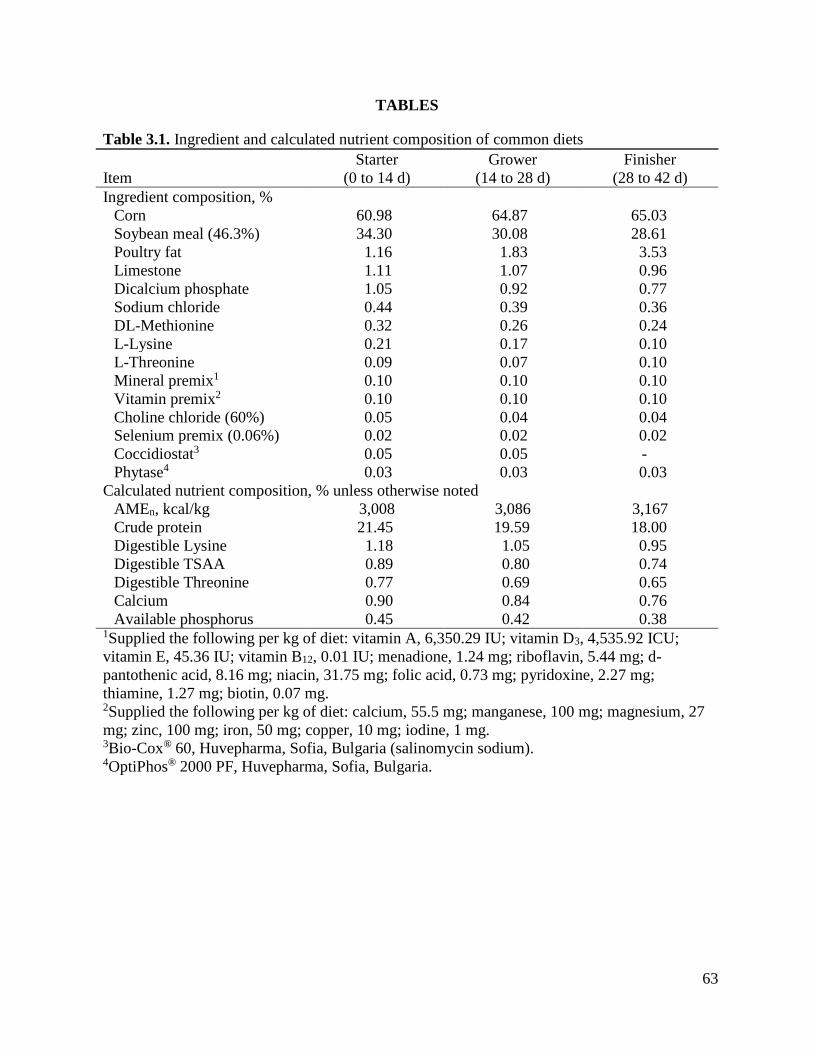
63
TABLES
Table 3.1. Ingredient and calculated nutrient composition of common diets
Item
Starter
(0 to 14 d)
Grower
(14 to 28 d)
Finisher
(28 to 42 d)
Ingredient composition, %
Corn 60.98 64.87 65.03
Soybean meal (46.3%) 34.30 30.08 28.61
Poultry fat 1.16 1.83 3.53
Limestone 1.11 1.07 0.96
Dicalcium phosphate 1.05 0.92 0.77
Sodium chloride 0.44 0.39 0.36
DL-Methionine 0.32 0.26 0.24
L-Lysine 0.21 0.17 0.10
L-Threonine 0.09 0.07 0.10
Mineral premix1 0.10 0.10 0.10
Vitamin premix2 0.10 0.10 0.10
Choline chloride (60%) 0.05 0.04 0.04
Selenium premix (0.06%) 0.02 0.02 0.02
Coccidiostat3 0.05 0.05 -
Phytase4 0.03 0.03 0.03
Calculated nutrient composition, % unless otherwise noted
AMEn, kcal/kg 3,008 3,086 3,167
Crude protein 21.45 19.59 18.00
Digestible Lysine 1.18 1.05 0.95
Digestible TSAA 0.89 0.80 0.74
Digestible Threonine 0.77 0.69 0.65
Calcium 0.90 0.84 0.76
Available phosphorus 0.45 0.42 0.38 1Supplied the following per kg of diet: vitamin A, 6,350.29 IU; vitamin D3, 4,535.92 ICU;
vitamin E, 45.36 IU; vitamin B12, 0.01 IU; menadione, 1.24 mg; riboflavin, 5.44 mg; d-
pantothenic acid, 8.16 mg; niacin, 31.75 mg; folic acid, 0.73 mg; pyridoxine, 2.27 mg;
thiamine, 1.27 mg; biotin, 0.07 mg. 2Supplied the following per kg of diet: calcium, 55.5 mg; manganese, 100 mg; magnesium, 27
mg; zinc, 100 mg; iron, 50 mg; copper, 10 mg; iodine, 1 mg. 3Bio-Cox® 60, Huvepharma, Sofia, Bulgaria (salinomycin sodium). 4OptiPhos® 2000 PF, Huvepharma, Sofia, Bulgaria.

64
Table 3.2. Effects of hatch window period (HWP) and nutrient access of feed and water (FAW) or control (CTL) in the hatching
basket on body weight (BW) and BW change of broiler chicks
Item
BW (g) BW Change
Hatch Pull Placement
Hatch to Pull Pull to Place Hatch to Place
Absolute
(g)
Relative
(%)
Absolute
(g)
Relative
(%)
Absolute
(g)
Relative
(%)
Interaction means
Early – CTL (n = 7) 46.32 43.98c 43.32c -2.49e -5.36e -0.53 -1.21 -3.01d -6.49d
Early – FAW (n = 6) 46.37 46.37a 45.51ab 0.01a 0.01a -0.86 -1.85 -0.85a -1.83a
Middle – CTL (n = 9) 46.75 45.05b 44.66b -1.69d -3.62d -0.40 -0.88 -2.09c -4.47c
Middle – FAW (n = 8) 46.78 46.55a 45.89a -0.23ab -0.49ab -0.66 -1.42 -0.89a -1.90a
Late – CTL (n = 4) 46.86 45.93ab 45.51ab -0.93c -1.99c -0.57 -1.24 -1.50b -3.21b
Late – FAW (n = 6) 47.51 47.09a 46.25a -0.42b -0.87b -0.84 -1.79 -1.26ab -2.64ab
SEM 0.291 0.302 0.292 0.113 0.233 0.097 0.206 0.155 0.321
Main effect of HWP
Early (n = 13) 46.34b 45.17c 44.42b -1.24c -2.68c -0.69 -1.53b -1.93b -4.16b
Middle (n = 17) 46.76ab 45.80b 45.28a -0.96b -2.05b -0.53 -1.15a -1.49a -3.18a
Late (n = 10) 47.18a 46.51a 45.80a -0.67a -1.43a -0.71 -1.51ab -1.38a -2.92a
SEM 0.188 0.195 0.189 0.073 0.151 0.062 0.133 0.100 0.207
Main effect of basket
CTL (n = 20) 46.64 44.98b 44.44b -1.70b -3.66b -0.50a -1.11a -2.20b -4.72b
FAW (n = 20) 46.89 46.67a 45.89a -0.21a -0.45a -0.79b -1.68b -1.00a -2.12a
SEM 0.138 0.143 0.138 0.054 0.110 0.046 0.098 0.074 0.152
P-values
HWP 0.007 <0.001 <0.001 <0.001 <0.001 0.032 0.028 <0.001 <0.001
Basket 0.210 <0.001 <0.001 <0.001 <0.001 <0.001 <0.001 <0.001 <0.001
HWP x Basket 0.371 0.049 0.028 <0.001 <0.001 0.900 0.937 <0.001 <0.001 a-eMeans within a column that do not share a common superscript are significantly different (P < 0.05) as determined by a Tukey’s
multiple comparison test.
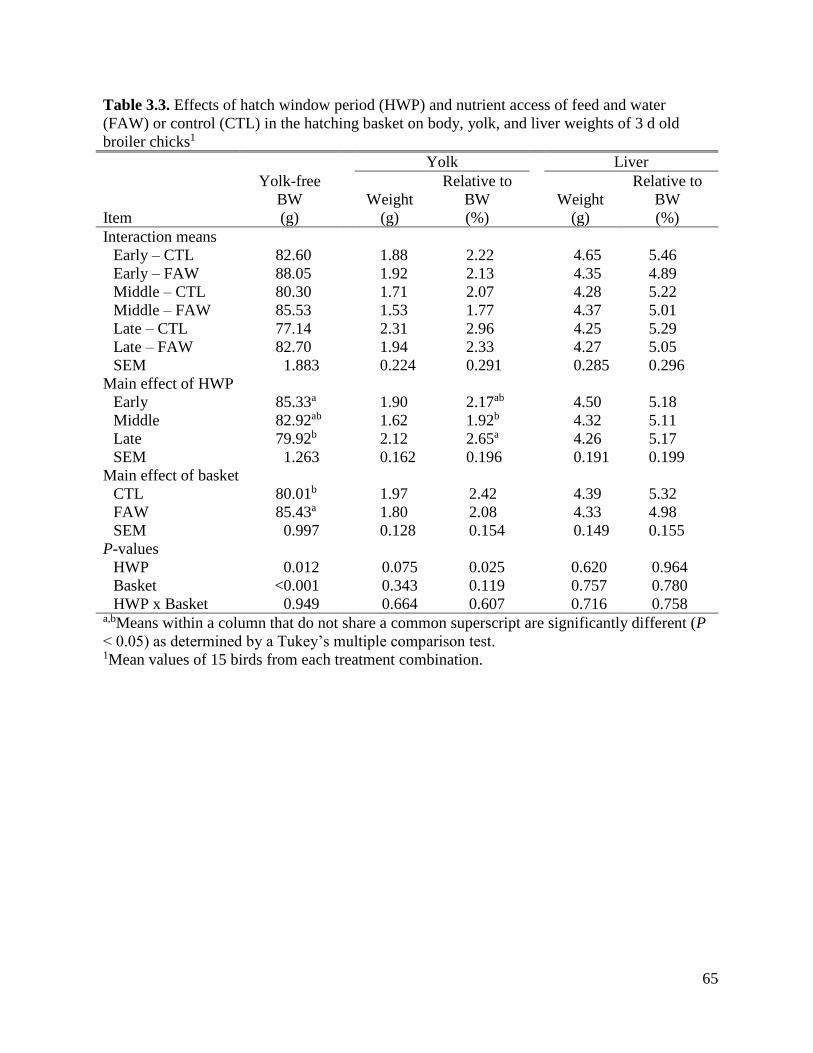
65
Table 3.3. Effects of hatch window period (HWP) and nutrient access of feed and water
(FAW) or control (CTL) in the hatching basket on body, yolk, and liver weights of 3 d old
broiler chicks1
Yolk Liver
Item
Yolk-free
BW
(g)
Weight
(g)
Relative to
BW
(%)
Weight
(g)
Relative to
BW
(%)
Interaction means
Early – CTL 82.60 1.88 2.22 4.65 5.46
Early – FAW 88.05 1.92 2.13 4.35 4.89
Middle – CTL 80.30 1.71 2.07 4.28 5.22
Middle – FAW 85.53 1.53 1.77 4.37 5.01
Late – CTL 77.14 2.31 2.96 4.25 5.29
Late – FAW 82.70 1.94 2.33 4.27 5.05
SEM 1.883 0.224 0.291 0.285 0.296
Main effect of HWP
Early 85.33a 1.90 2.17ab 4.50 5.18
Middle 82.92ab 1.62 1.92b 4.32 5.11
Late 79.92b 2.12 2.65a 4.26 5.17
SEM 1.263 0.162 0.196 0.191 0.199
Main effect of basket
CTL 80.01b 1.97 2.42 4.39 5.32
FAW 85.43a 1.80 2.08 4.33 4.98
SEM 0.997 0.128 0.154 0.149 0.155
P-values
HWP 0.012 0.075 0.025 0.620 0.964
Basket <0.001 0.343 0.119 0.757 0.780
HWP x Basket 0.949 0.664 0.607 0.716 0.758 a,bMeans within a column that do not share a common superscript are significantly different (P
< 0.05) as determined by a Tukey’s multiple comparison test. 1Mean values of 15 birds from each treatment combination.

66
Table 3.4. Live performance of broilers from different hatch window periods (HWP) within a single hatch window provided feed
and water (FAW) in the hatching basket compared to a control (CTL) from 0 to 21 d post-hatch1
7 d 14 d 21 d
Item
BW
(g)
BWG
(g)
FI
(g)
FCR BW
(g)
BWG
(g)
FI
(g)
FCR BW
(g)
BWG
(g)
FI
(g)
FCR
Interaction means
Early – CTL 181 138 168 1.195 476 432 521 1.195 957 914 1,250 1.363
Early – FAW 186 141 173 1.203 476 430 523 1.207 962 917 1,244 1.346
Middle – CTL 176 131 158 1.182 463 418 497 1.183 949 905 1,219 1.341
Middle – FAW 182 136 161 1.163 471 425 499 1.167 961 915 1,220 1.329
Late – CTL 171 125 144 1.131 450 405 485 1.192 954 908 1,225 1.345
Late – FAW 175 129 151 1.149 456 410 480 1.167 940 894 1,192 1.330
SEM 1.2 1.2 2.7 0.0251 4.3 4.3 10.5 0.0229 10.4 10.4 20.7 0.0140
Main effect of HWP
Early 184a 139a 170a 1.199 476a 431a 522a 1.201 950 915 1,247 1.354
Middle 179b 133b 159b 1.172 467a 421b 498b 1.175 955 910 1,219 1.335
Late 173c 127c 148c 1.140 453b 407c 483b 1.178 947 901 1,209 1.338
SEM 0.8 0.8 1.8 0.0169 2.9 2.9 7.1 0.0154 7.0 7.0 13.9 0.0094
Main effect of basket
CTL 176b 131b 156b 1.169 463 418 501 1.190 953 909 1,231 1.350
FAW 181a 135a 162a 1.172 468 422 501 1.180 955 909 1,219 1.335
SEM 0.6 0.6 1.4 0.0132 2.3 2.3 5.5 0.0120 5.4 5.4 10.9 0.0073
P-values
HWP <0.001 <0.001 <0 .001 0.054 <0.001 <0.001 0.002 0.388 0.413 0.334 0.130 0.268
Basket <0.001 <0.001 0.015 0.886 0.146 0.305 0.986 0.555 0.873 0.988 0.414 0.176
HWP x Basket 0.620 0.588 0.749 0.701 0.528 0.482 0.926 0.634 0.392 0.397 0.655 0.978 a-cMeans within a column that do not share a common superscript are significantly different (P < 0.05) as determined by a Tukey’s
multiple comparison test. 1Mean values of 6 replications of CTL middle HWP, 4 replications of CLT late HWP and 5 replications for all other treatment
combinations.

67
Table 3.5. Live performance of broilers from different hatch window periods (HWP) within a single hatch window provided
feed and water (FAW) in the hatching basket compared to a control (CTL) from 0 to 42 d post-hatch1
28 d 35 d 42 d
Item
BW
(g)
BWG
(g)
FI
(g)
FCR BW
(g)
BWG
(g)
FI
(g)
FCR BW
(g)
BWG
(g)
FI
(g)
FCR
Interaction means
Early – CTL 1,639 1,595 2,318 1.442 2,317 2,273 3,521 1.540 2,839 2,796 4,746 1.679
Early – FAW 1,624 1,578 2,286 1.442 2,307 2,261 3,507 1.540 2,863 2,818 4,717 1.660
Middle – CTL 1,629 1,583 2,303 1.447 2,334 2,289 3,570 1.545 2,903 2,858 4,849 1.671
Middle – FAW 1,644 1,598 2,292 1.431 2,323 2,277 3,517 1.538 2,916 2,870 4,821 1.650
Late – CTL 1,638 1,592 2,323 1.457 2,363 2,318 3,613 1.557 2,958 2,913 4,834 1.651
Late – FAW 1,623 1,576 2,256 1.428 2,326 2,280 3,506 1.530 2,862 2,816 4,778 1.687
SEM 15.7 15.6 37.0 0.0149 23.3 23.4 51.7 0.0101 42.3 42.3 72.7 0.0164
Main effect of HWP
Early 1,631 1,587 2,302 1.442 2,312 2,267 3,514 1.540 2,851 2,807 4,732 1.669
Middle 1,636 1,591 2,298 1.439 2,329 2,283 3,543 1.541 2,909 2,864 4,835 1.660
Late 1,630 1,584 2,289 1.443 2,345 2,299 3,559 1.544 2,910 2,864 4,806 1.669
SEM 10.5 10.5 24.8 0.0100 15.7 15.7 34.7 0.0074 28.4 28.4 48.8 0.0110
Main effect of basket
CTL 1,635 1,590 2,315 1.449 2,338 2,294 3,568 1.547 2,900 2,855 4,810 1.667
FAW 1,630 1,584 2,278 1.434 2,319 2,273 3,510 1.536 2,880 2,834 4,772 1.666
SEM 8.2 8.2 19.4 0.0078 12.2 12.3 27.1 0.0058 22.2 22.1 38.1 0.0086
P-values
HWP 0.890 0.898 0.935 0.968 0.325 0.346 0.628 0.948 0.226 0.238 0.270 0.787
Basket 0.672 0.590 0.187 0.188 0.273 0.240 0.142 0.168 0.535 0.508 0.490 0.926
HWP x Basket 0.448 0.429 0.706 0.598 0.787 0.793 0.627 0.387 0.257 0.261 0.974 0.127 1Mean values of 6 replications of CTL middle HWP, 4 replications of CLT late HWP and 5 replications for all other treatment
combinations.
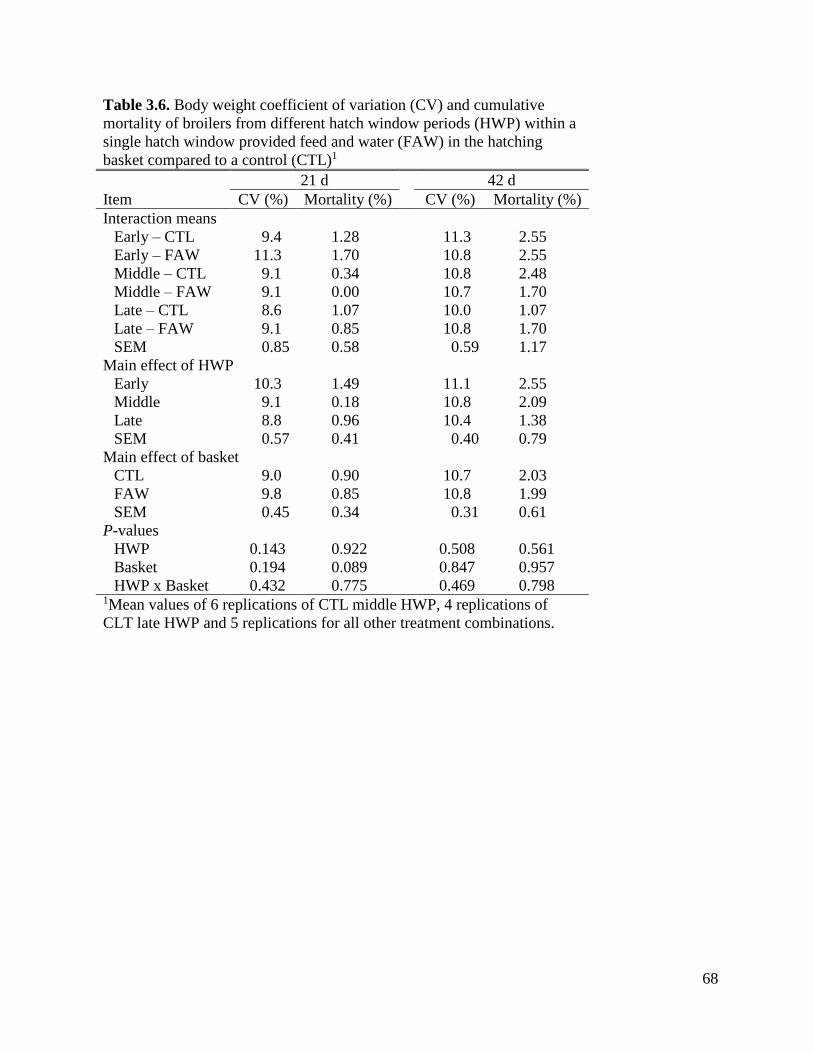
68
Table 3.6. Body weight coefficient of variation (CV) and cumulative
mortality of broilers from different hatch window periods (HWP) within a
single hatch window provided feed and water (FAW) in the hatching
basket compared to a control (CTL)1
21 d 42 d
Item CV (%) Mortality (%) CV (%) Mortality (%)
Interaction means
Early – CTL 9.4 1.28 11.3 2.55
Early – FAW 11.3 1.70 10.8 2.55
Middle – CTL 9.1 0.34 10.8 2.48
Middle – FAW 9.1 0.00 10.7 1.70
Late – CTL 8.6 1.07 10.0 1.07
Late – FAW 9.1 0.85 10.8 1.70
SEM 0.85 0.58 0.59 1.17
Main effect of HWP
Early 10.3 1.49 11.1 2.55
Middle 9.1 0.18 10.8 2.09
Late 8.8 0.96 10.4 1.38
SEM 0.57 0.41 0.40 0.79
Main effect of basket
CTL 9.0 0.90 10.7 2.03
FAW 9.8 0.85 10.8 1.99
SEM 0.45 0.34 0.31 0.61
P-values
HWP 0.143 0.922 0.508 0.561
Basket 0.194 0.089 0.847 0.957
HWP x Basket 0.432 0.775 0.469 0.798 1Mean values of 6 replications of CTL middle HWP, 4 replications of
CLT late HWP and 5 replications for all other treatment combinations.
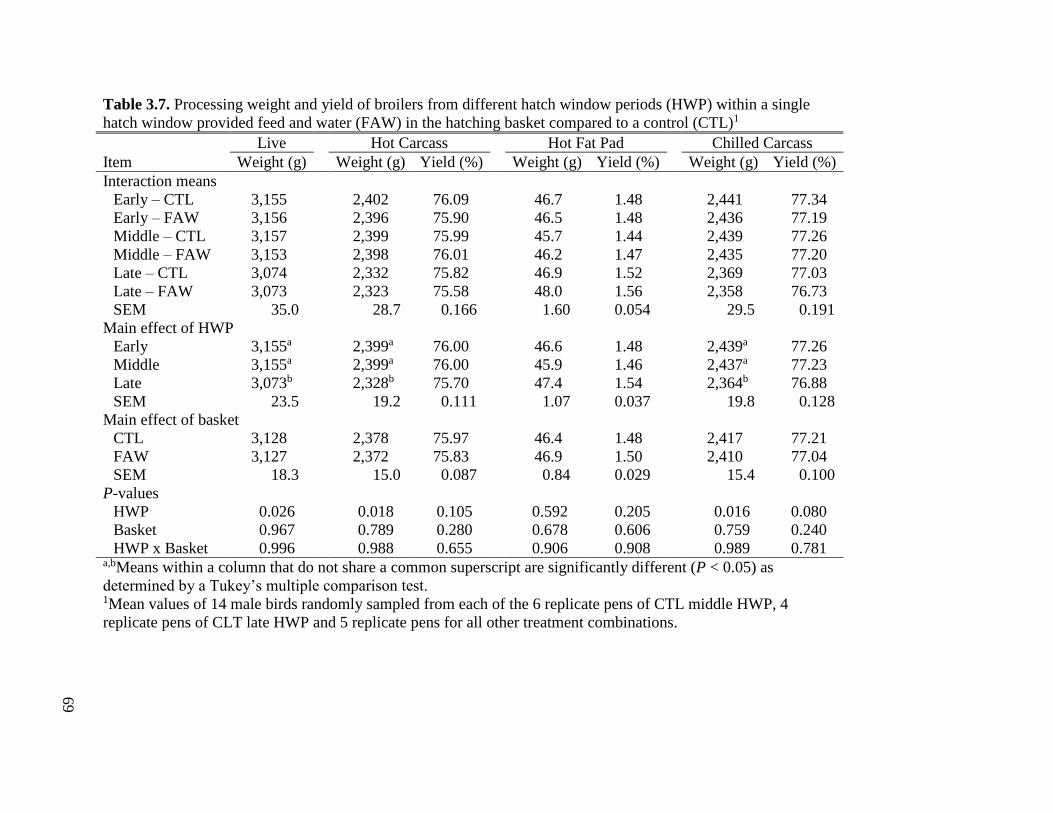
69
Table 3.7. Processing weight and yield of broilers from different hatch window periods (HWP) within a single
hatch window provided feed and water (FAW) in the hatching basket compared to a control (CTL)1
Live Hot Carcass Hot Fat Pad Chilled Carcass
Item Weight (g) Weight (g) Yield (%) Weight (g) Yield (%) Weight (g) Yield (%)
Interaction means
Early – CTL 3,155 2,402 76.09 46.7 1.48 2,441 77.34
Early – FAW 3,156 2,396 75.90 46.5 1.48 2,436 77.19
Middle – CTL 3,157 2,399 75.99 45.7 1.44 2,439 77.26
Middle – FAW 3,153 2,398 76.01 46.2 1.47 2,435 77.20
Late – CTL 3,074 2,332 75.82 46.9 1.52 2,369 77.03
Late – FAW 3,073 2,323 75.58 48.0 1.56 2,358 76.73
SEM 35.0 28.7 0.166 1.60 0.054 29.5 0.191
Main effect of HWP
Early 3,155a 2,399a 76.00 46.6 1.48 2,439a 77.26
Middle 3,155a 2,399a 76.00 45.9 1.46 2,437a 77.23
Late 3,073b 2,328b 75.70 47.4 1.54 2,364b 76.88
SEM 23.5 19.2 0.111 1.07 0.037 19.8 0.128
Main effect of basket
CTL 3,128 2,378 75.97 46.4 1.48 2,417 77.21
FAW 3,127 2,372 75.83 46.9 1.50 2,410 77.04
SEM 18.3 15.0 0.087 0.84 0.029 15.4 0.100
P-values
HWP 0.026 0.018 0.105 0.592 0.205 0.016 0.080
Basket 0.967 0.789 0.280 0.678 0.606 0.759 0.240
HWP x Basket 0.996 0.988 0.655 0.906 0.908 0.989 0.781 a,bMeans within a column that do not share a common superscript are significantly different (P < 0.05) as
determined by a Tukey’s multiple comparison test. 1Mean values of 14 male birds randomly sampled from each of the 6 replicate pens of CTL middle HWP, 4
replicate pens of CLT late HWP and 5 replicate pens for all other treatment combinations.

70
Table 3.8. Processing weight and yield of broilers from different hatch window periods (HWP) within a single hatch window
provided feed and water (FAW) in the hatching basket compared to a control (CTL)1
Breast Tender Leg Quarter Wing
Item Weight (g) Yield (%) Weight (g) Yield (%) Weight (g) Yield (%) Weight (g) Yield (%)
Interaction means
Early – CTL 645.4 20.39 131.1 4.15 729.2 23.13 249.3 7.92
Early – FAW 637.7 20.19 131.2 4.16 740.3 23.44 246.1 7.81
Middle – CTL 629.2 19.94 129.0 4.10 743.1 23.58 248.1 7.89
Middle – FAW 625.0 19.81 128.9 4.09 744.2 23.62 248.8 7.91
Late – CTL 624.3 20.26 126.8 4.12 721.5 23.48 242.7 7.91
Late – FAW 604.9 19.65 126.4 4.11 718.8 23.40 244.3 7.96
SEM 12.86 0.242 2.09 0.043 8.46 0.160 3.23 0.052
Main effect of HWP
Early 641.6 20.29 131.1 4.16 734.7ab 23.28 247.7 7.86
Middle 627.1 19.87 129.0 4.09 743.7a 23.60 248.5 7.90
Late 614.6 19.96 126.6 4.12 720.2b 23.44 243.5 7.93
SEM 8.62 0.162 1.41 0.029 5.67 0.107 2.17 0.035
Main effect of basket
CTL 633.0 20.20 129.0 4.12 731.3 23.39 246.7 7.90
FAW 622.6 19.88 128.8 4.12 734.4 23.49 246.4 7.89
SEM 6.73 0.127 1.10 0.023 4.43 0.084 1.69 0.027
P-values
HWP 0.095 0.139 0.085 0.244 0.018 0.105 0.223 0.361
Basket 0.281 0.089 0.945 0.994 0.617 0.432 0.905 0.764
HWP x Basket 0.797 0.518 0.993 0.975 0.657 0.397 0.687 0.222 a,bMeans within a column that do not share a common superscript are significantly different (P < 0.05) as determined by a
Tukey’s multiple comparison test. 1Mean values of 14 male birds randomly sampled from each of the 6 replicate pens of CTL middle HWP, 4 replicate pens of
CLT late HWP and 5 replicate pens for all other treatment combinations.

71
CHAPTER IV
MANUSCRIPT:
Effects of hatch window and nutrient access in the hatcher on performance and processing
yield of broiler chicks reared with equal hatch window representation3
3Prepared for submission to British Poultry Science
72
ABSTRACT
The objectives of this experiment were to investigate the effects of feed and water availability in
hatching baskets on broiler performance, processing yield, and organ weights. In addition, the
influence of hatch window and time of access to in the hatcher was evaluated. Fertile Cobb 500
eggs were transferred into an illuminated hatcher. The experiment was a split-plot design with a
whole-plot factor of 2 hatching basket types [control (CTL) hatching baskets with no nutrients
provided or baskets providing access to feed and water (FAW)]and a sub-plot factor of 3 hatch
window periods (HWP): early, pre-peak, post-peak or late. After pull of hatch, chicks were held
for 4 h at the hatchery without nutrient access. Subsequently, 1,352 chicks were reared in 26
floor pens designated as CTL (n = 13) or FAW (n = 13), with 13 chicks from each of the 4 HWP
per pen (52 chicks per pen). Organs weights were taken from a sample of chicks in each pen at
placement and 3 d post-hatch. At 43 d, 16 males from each pen were processed. Chicks from
FAW baskets were 1 g heavier (P < 0.001) than those from CTL baskets at placement and
remained heavier through 28 d (P = 0.003); afterwards they were similar (P > 0.05) in BW
during the 42 d experiment. No differences (P > 0.05) in FCR, mortality, or processing data were
observed between CTL and FAW basket treatments. Hatch window period influenced BW at
placement (P < 0.001) where the early hatching chicks were lighter than all other HWP. The
early hatching chicks became heavier at 7 d (P < 0.001). This experiment indicates that earlier
hatching chicks were lighter in BW at hatch but increased BWG allow them to become heavier
than their later hatching counterparts at d 7 post-hatch. It was also found that hatching basket
nutrient access may increase the BW of broilers at placement and during the first 4 wk of growth,
but has no influence on 42 d BW, processing yield, FCR, or mortality.
Key words: early feeding, nutrient access, hatch window, hatcher, basket, broiler, growth

73
INTRODUCTION
The modern broiler has been selected for rapid growth, allowing a desired market weight
to be reached in a shorter amount of time than that of broilers from the past (Zuidhof et al.,
2014). This growth is initiated once the chick begins consuming exogenous feed, which it
efficiently converts to body tissue. Feed intake of newly hatched chicks has been shown to
increase yolk secretions to the small intestine and increase glucose and methionine uptake (Noy
and Sklan, 2001). Further, Noy and Sklan (1999) reported that sawdust fed to chicks after hatch
resulted in a higher BW at 4 d post-hatch compared to a control, indicating that non-nutritive
material present in the gastrointestinal tract may also initiate a similar physiological response. As
the chick transitions from endogenous to exogenous nutrient sources, the digestive system
undergoes significant alterations as it matures with age, and providing feed to chicks soon after
hatch increases the rate of this development. Conversely, chick fasting and delayed placement
studies have reported depressions in BW that persist to market age, decreased uniformity, and
higher mortality (Pinchasov and Noy, 1993; Vieira and Moran, 1999; Bigot et al., 2003). Prior to
water and feed access, chicks are relying on their remaining yolk sac to provide energy (Noy and
Sklan, 1999b) and nutrients for growth, and yolk sac degradation accounts for the majority of
BW loss during the first 24 after hatch (Pinchasov and Noy, 1993).
In addition to processing at the hatchery and transportation to the farm, the time at which
a chick hatches determines how long it has until its first access to water and feed. The hatch
window is generally 24 to 48 for commercially produced broilers and therefore earlier hatching
chicks have considerably more time out of the egg until placement. While chicks are held in the
hatcher without water and feed they rapidly begin to decrease in BW as a result of dehydration
and yolk utilization (Casteel et al., 1994; Sklan et al., 2000).
74
Early feeding methods such as in ovo and hatcher feeding have been investigated as
strategies to provide immediate access to nutrients and avoid the negative effects of delayed
placement (Noy and Sklan, 1999a; Noy and Uni, 2010; Willemsen et al., 2010). Feeding in
hatching baskets is a method that allows chicks access nutrients immediately after hatching and
becoming ambulatory, and Sklan et al. (2000) showed that this is an effective approach for
decreasing the amount of BW chicks and poults lose while in the hatcher, particularly for earlier
hatchers. However, compensatory growth of fasted and early hatching chicks may diminish
these early benefits (Kidd et al., 2007; Lamot et al., 2014).
Clearly, the variation of success reported for various early feeding strategies warrant
further investigation. Further, existing literature on early post-hatch feeding has focused on
comparing fed birds to those exposed to fasting periods of 24 h or more, which have generated
physiological responses but such extended fasting periods are not typically observed in practical
broiler production. It is also critical to understand the effects on flock performance as chicks
from different hatch times are reared together when they have also started exogenous feed
consumption at varying times. A partner experiment was conducted in a similar fashion;
however, the chicks were reared separately based upon hatch time. As such, the current
experiment was conducted to examine the effects of providing nutrient access in the hatching
baskets on the subsequent live performance and processing yields of chicks subjected to industry
relevant holding times and reared with equal hatch window representation.
MATERIALS AND METHODS
This experiment was conducted at the University of Arkansas Poultry Research Farm
(Fayetteville, AR). All animal care and experimental procedures were approved by the

75
University of Arkansas Institutional Animal Care and Use Committee prior to initiation of the
experiment.
Egg source and incubation
Fertile eggs from a single, 36 wk old Cobb MV x 500 breeder flock were sourced from a
commercial broiler integrator. Eggs were transported to the University of Arkansas Poultry
Research Farm hatchery and held overnight in an egg storage room at 18.3°C. All 2,520 eggs
were then set in a single machine (Ps500 Jamesway Incubator Company, Inc. Cambridge, ON,
Canada) and incubated using a common broiler profile of 37.6°C at 55% relative humidity
(29.4°C wet bulb) from 0 to 18 d. Eggs were turned every hour.
Nutrient access and hatch window
At 18 d of incubation, eggs were transferred to the hatcher (Ps500 Jamesway Incubator
Company, Inc. Cambridge, ON, Canada) set at 36.7°C and 54% relative humidity (27.8°C wet
bulb) until time of pull at 504 h. The hatcher was equipped with LED lighting to provide
approximately 21.5 lux to the interior in the hatch baskets. Eggs were randomly assigned to
either control (CTL) hatching baskets with no nutrients provided or baskets containing feed and
water (FAW). Standard hatch baskets were modified by creating a center divider. Eighty-six
eggs were placed on one side and the other side was void of eggs but provided the CTL or FAW
experimental treatment. After hatching, chicks were then moved to the experimental side of the
basket as described below. Feed and water were provided ad libitum in 50 mL reagent reservoirs
(89094-680 VWR International, West Chester, PA, USA) with each FAW basket containing 3
reservoirs of water and 3 reservoirs of feed. The feed provided in FAW baskets was the same
crumbled starter subsequently fed to all chicks at placement (Table 4.1).
76
In addition to nutrient access in the hatching basket, a sub-plot treatment factor included
hatch window period (HWP). A pilot trial was conducted a week in advance by hatching eggs
from the same breeder flock to determine the spread of hatch and define a hatch window. Based
on these data it was determined that the hatch window be divided into 4 HWP based upon
number of h before pull at 504 h: early (30 to 24 h), pre-peak (24 to 18 h), post-peak (18 to 12 h),
and late (12 to 6 h). Each HWP represented approximately 25% of the total hatch time. At the
end of each HWP all hatched chicks were removed from the egg side of the basket, tagged for
identification, and placed into the experimental side of the basket. A chick was defined as
hatched once fully and independently cleared from the shell. The HWP in which a chick hatched
established the amount of time chicks had access to the experimental hatching baskets (CTL or
FAW). Chicks in early, pre-peak, post-peak, and late HWP had 24 h, 18 h, 12 h, of 6 h access to
experimental hatching baskets, respectively. No chicks hatched more than 30 h before pull and
the relatively few chicks that hatched within 6 h of pull were not used in this experiment.
Growout, sampling, and processing
At 504 h, experimental baskets were removed from the hatcher. Chicks were segregated
by treatment combination. Subsequently, 56 chicks of the same treatment (CTL or FAW), which
included 14 from each HWP, were randomly selected and placed into a common chick box.
Chicks were held at the hatchery in these boxes for 4 h to simulate commercially-relevant
processing and holding times and no nutrients were provided for any chicks during this time. At
the conclusion of the holding time, 1 chick from each HWP in each box was randomly selected
for sampling where the yolk sac and liver were collected and weighed. The other chicks were
transported to an experimental rearing facility for placement.
77
All 52 remaining chicks from each box were placed in a single floor pen to asses live
performance in a 42 d experiment. The pens measured 1.52 x 3.05 m and contained fresh pine
shavings. Each pen had 2 hanging feeders with commercial feed pans and a single water line
with 10 nipples. There were 13 replicate pens of FAW and CTL nutrient access treatments, each
with 13 birds from each HWP. At 3 d post-hatch, 1 bird from each HWP from each pen were
randomly selected and euthanized and their yolk sacs and livers were collected and weighed.
Bird weights and feed consumption were recorded weekly by pen. Individual bird weights were
taken at 21 d and 42 d to assess uniformity. Mortality and associated weights were recorded
daily. Common starter (0 to 14 d), grower (14 to 28 d), and finisher (28 to 42 d) feeds (Table 4.1)
and water were provided ad libitum. Feed was removed from the pens 10 h prior to processing on
43 d. A total of 366 birds were processed using males from each HWP from each pen which
were randomly selected, wing-banded, and processed for determination of carcass and parts
weights and yields. Following evisceration, birds were chilled in ice water for 4 h before
deboning.
Statistical analysis
The experiment consisted of 8 treatments in a factorial arrangement of 4 HWP (early,
pre-peak, post-peak, or late) x 2 hatching basket types (CTL or FAW). This resulted in a split-
plot design where the whole-plot factor was experimental hatching basket type and the sub-plot
factor was the HWP with 13 replications of CTL and FAW by pen. All data were analyzed using
SAS 9.4 (Cary, NC). The MIXED procedure was utilized for ANOVA, with a Tukey’s multiple
comparison test used to separate means. Any P ≤ 0.05 was considered statistically significant.
78
RESULTS
Yolk and Liver
There was a HWP x basket type interaction (P = 0.026) on yolk-free BW at placement
(Table 4.2). This interaction was because chicks in the FAW-early HWP group were 3.83 g
heavier (P < 0.05) than the CTL basket chicks in the early HWP, but other HWP combinations
were similar (P > 0.05). There were no main or interactive effects (P > 0.05) of basket type on
absolute or relative liver or yolk weights at placement. For HWP, absolute and relative yolk
weights followed the same general trend with the highest values for the late hatchers, lowest for
the early hatchers, and intermediate values for the pre- and post-peak hatchers. The late HWP
group also had the highest (P = 0.002) relative yolk weight, 12.85%. The liver weights of day-
old chicks had an inverse trend. Chicks from the early HWP had higher (P = 0.009) liver weights
averaging 1.50 g compared to the 1.22 g of chicks from the late HWP, other HWP were
intermediate (Table 4.2). The relative liver weight was also highest (P = 0.002) for early HWP
chicks at 3.53 %.
At d 3, yolks sampled were no longer significantly different (P > 0.05) in absolute or
relative weight among treatment groups (Table 4.3). There was, however, a significant difference
in yolk-free BW between HWP (P = 0.040) and nutrient access treatments (P = 0.010). Liver
samples at 3 d post-hatch no longer indicated a difference (P > 0.05) in relative liver weights
between HWP; however, early HWP chicks still had a higher (P = 0.022) absolute liver weight,
5.26 g, compared to late HWP chicks, 4.56 g, other HWP were intermediate (Table 4.3). No
absolute or relative liver differences were observed between basket type treatments.
79
Performance
At placement, chicks from FAW baskets were 1.0 g heavier (P < 0.001) than chicks from
CTL baskets. The HWP also affected (P < 0.001) placement BW with the later hatching chicks
being the heaviest, but becoming the lightest at 7 d post-hatch (P < 0.001; Table 4.4). The effects
of HWP on BW were apparent (P ≤ 0.05) throughout the remainder of the experiment, but varied
in ranking and magnitude. Chicks provided nutrient access in the hatching baskets continued to
have higher BW than CTL chicks at 7d (P < 0.001), 14 d (P < 0.001), 21 d (P < 0.001), and 28 d
(P = 0.003). The remainder of the 42 d growout showed no BW differences (P > 0.05) between
basket types. During the growout period no HWP x basket type interactions (P > 0.05) for BW
were observed. Feed consumption was measured by whole pen due to the split-plot arrangement
and co-rearing of chicks from different HWP. The higher BW of FAW birds up to d 28 coincided
with higher BWG (P = 0.009) to 28 d and higher (P = 0.005) FI to 21 d; after which there were
no differences (P > 0.05; Table 4.5). Pens of FAW and CTL basket treatments had similar (P >
0.05) FCR throughout the 42 d experiment.
The average BW CV was 8.72% at 21 d and 11.36% at 42 d, and there were no
differences (P > 0.05) among treatment groups (Table 4.6). Mortality was not affected (P > 0.05)
by any of the treatments and the cumulative average was 2.57% at 42 d (Table 4.6).
Processing
The ranking differences among HWP observed for the 42 d live weight were again
observed for the live bird weight of those selected for sampling (P = 0.033; Table 4.7); however,
hot and chilled carcass weights were not different (P > 0.05). Differences among HWP were
found for hot fat pad weight (P = 0.021) and yield (P = 0.049) which were not separated by
Tukey’s but trended to increase in weight and yield from the early to late HWP. A HWP x basket
80
type interaction was observed for tender yield (P = 0.002; Table 4.8) and wing weight (P =
0.029). Leg quarter weight (P = 0.009) and yield (P = 0.015) were also different among HWP.
Nutrient access in the hatching basket did not have any significant effects (P > 0.05) on
processing weights or yield.
DISCUSSION
We have previously characterized the effects of nutrient access in hatching baskets as it
related to different hatch times when chicks were reared according to time of hatch. The current
study was based on having equal hatch window representation in each pen to more accurately
represent effects of hatching basket feeding in commercial production. However, while the
normal distribution of a typical hatch window would not result in equal representation of all
HWP for the flock, equally stratifying birds from all HWP into each pen provided a more valid
design for statistical analysis in the current experiment.
The comparison of 0 d yolk samples showed that HWP affected the amount of absolute
(P = 0.002) and relative (P = 0.002) yolk weight, assuming a similar initial yolk weight, the
earlier hatching chicks had more time outside of the egg and thus utilized more yolk. The liver
weight, on the other hand, was higher (P = 0.009) for the early HWP chicks compared to late
HWP and intermediate for other HWP. This somewhat inverse relationship between yolk and
liver size at placement may indicate a transition of yolk nutrients to tissue development. Chicks
from FAW baskets had similar yolk weights to CTL chicks; however, they showed a tendency
for higher (P = 0.054) yolk-free BW that corresponded with a higher placement weight. These
chicks were likely more hydrated and were observed to have full crops at placement, which also
would have added to their total BW. Average absolute and relative yolk sac weights decreased
from approximately 5 to 1 g and 11 to 1% from 0 to 3 d of age and indicated that chicks quickly
81
utilized their yolk sacs during this period. At 3 d post-hatch, ranking of liver weights by HWP
was similar to that observed at 0 d. Liver and yolk sac weight differences among hatch times
diminished during early growth which is supported by hatch moment studies by Lamot et al.
(2014) who found no differences in liver or yolk sac weight at 4 d post-hatch.
During the growout, basket type and HWP both independently affected performance of
the broilers, but the effects of each factor varied among time points. Early hatching birds were
lighter (P < 0.001) at placements than birds from other HWP, but interestingly became heavier
(P < 0.001) than the post-peak and late HWP chicks by 7 d. There was clearly a faster growth
rate in order for this compensation occur, but due to the pen arrangement in which birds from all
HWP shared a common feeder, we were unable to identify if this compensation in BW was due
to increased FI, better FCR, or both. This is in agreement with studies by Lamot et al. (2014)
who also found that earlier hatching chicks were lighter, but had accelerated growth after
placement as a result of higher FI. This, combined with a longer amount of growth time allowed
them to become heavier than their later hatching counterparts by 4 d post-hatch.
Chicks from FAW baskets were heavier (P < 0.05) than CTL birds at each time point to
28 d. This was likely driven by an early initiation of feed consumption in the hatcher as shown
by a 1 g BW advantage at placement (P < 0.001), but the higher (P = 0.005) FI to 21 d supported
higher BWG (P = 0.009) to 28 d. Beyond 28 d, the FAW birds were similar (P > 0.05) in BW to
the birds from CTL baskets. The type of early feeding, length of fasting, and duration of the
growout have all led to varying degrees of success with approaches to early feeding. For
example, Sklan et al. (2000) fed chicks in hatching basket and noticed a higher BW in fed chicks
throughout the 21 d experiment, while Kidd et al. (2007) found no BW differences between
control birds and those fed in trays during pre-placement holding beyond 7d of age.

82
Providing water and feed in hatching baskets does allow immediate access to nutrients
once a chick hatches and also initiates feeding and growth at differing times for the same hatch
of chicks to be reared together. Therefore BW CV were considered important to evaluate
uniformity among treatments due to its ability to indicate overall broiler health and performance
(Cobb, 2018). The CV for all treatment groups and low overall mortality indicated this was a
desirable flock, where no differences (P > 0.05) were observed in either of these measurements
(Table 4.6). Perhaps a more challenging environment would generate noticeable differences
among the groups since the current experiment utilized eggs from a prime-age breeder flock and
fresh litter.
Live weight differences among HWP at 42 d were similar in relation to the live weights
at processing where the post-peak HWP group was heavier (P = 0.033) than the early HWP
chicks, with other groups having intermediate weights. These weights were overall heavier than
BW in Table 4.4 due to the sub-sample of only males being used for processing. Fat pad weight
(P = 0.021) and yield (P = 0.049) differences among HWP were also detected, which may reflect
differences in body composition and feed efficiency, but this cannot be confirmed due to the
common pen rearing of all HWP and a lack of more extensive body composition analyses.
Processing at 42 d surprisingly found a significant HWP x basket type interaction (P = 0.002) for
tender yield which can be attributed to the CTL yield decrease from early to late HWP groups
while the FAW groups were similar for all HWP. A significant interaction (P = 0.029) was also
found for wing weight, although a Tukey’s test did not separate the means. The leg quarter
weight (P = 0.009) and yield (P = 0.015) were the only processing measurements influenced by
HWP alone. The absolute leg quarter weight ranked the same among HWP as the live weights,
83
but interestingly, is the only part that was statistically separated. The significance of relative leg
quarter weight differences among HWP are not apparent.
The findings of this experiment indicate that feed and water access in the hatcher may
lead to higher chick weights at placement and increase the weight of broilers during the first 28 d
of growth. However, feed and water access in the hatcher had no influence on final 42 body
weight, processing yield, FCR, or mortality. The findings also highlighted an intriguing BW
compensation of early hatching chicks, which were lighter at hatch but became heavier than their
later hatching counterparts by 7 d. The current study showed merging of weights by basket type
and compensation of BW by HWP suggesting that the placement or 7 d BW of broilers may not
always be an accurate predictor of BW at market. This is important in reviewing similar early
post-hatch feeding studies due to the fact that none, to the authors’ knowledge, have processed or
grown birds beyond 21 d without fasting for extended periods. Further research using varying
holding times and hatch window lengths, in addition to more challenging environmental
conditions (e.g., heat stress or sub-clinical disease) would assist in determining if and when
hatching basket feeding yields an advantage at market and processing.
ACKNOWEDGEMENTS
A special thanks to George’s Poultry, Inc. (Springdale, AR, USA) for providing the
fertile hatching eggs used in this experiment.

84
REFERENCES
Bigot, K., S. Mignon-Grasteau, M. Picard, and S. Tesseraud. 2003. Effects of delayed feed intake
on body, intestine, and muscle development in neonate broilers. Poult. Sci. 82:781–788.
Casteel, E. T., J. L. Wilson, R. J. Buhr, and J. E. Sander. 1994. The influence of extended
posthatch holding time and placement density on broiler performance. Poult. Sci. 73:1679–
1684.
Cobb. 2018. Broiler management guide. Siloam Springs, AR.
Kidd, M. T., J. W. Taylor, C. M. Page, B. D. Lott, and T. N. Chamblee. 2007. Hatchery feeding
of starter diets to broiler chicks. J. Appl. Poult. Res. 16:234–239.
Lamot, D. M., I. B. van de Linde, R. Molenaar, C. W. van der Pol, P. J. A Wijtten, B. Kemp, and
H. van den Brand. 2014. Effects of moment of hatch and feed access on chicken
development. Poult. Sci. 93:2604–2614.
Noy, Y., and D. Sklan. 1999a. Different types of early feeding and performance in chicks and
poults. J. Appl. Poult. Res. 8:16–24.
Noy, Y., and D. Sklan. 1999b. Energy utilization in newly hatched chicks. Poult. Sci. 78:1750–
1756.
Noy, Y., and D. Sklan. 2001. Yolk and exogenous feed utilization in the posthatch chick. Poult.
Sci. 80:1490–1495.
Noy, Y., and Z. Uni. 2010. Early nutritional strategies. Worlds. Poult. Sci. J. 66:639–646.
Pinchasov, Y., and Y. Noy. 1993. Comparison of post-hatch holding time and subsequent early
performance of broiler chicks and turkey poults. Br. Poult. Sci. 34:111–120.
Sklan, D., Y. Nox, A. Hoyzman, and I. Rozenboim. 2000. Decreasing weight loss in the hatchery
by feeding chicks and poults in hatching trays. J. Appl. Poult. Res. 9:142–148.
Vieira, S. L., and E. T. Moran. 1999. Effects of delayed placement and used litter on broiler
yields. J. Appl. Poult. Res. 8:75–81.
Willemsen, H., M. Debonne, Q. Swennen, N. Everaert, C. Careghi, H. Han, V. Bruggeman, K.
Tona, and E. Decuypere. 2010. Delay in feed access and spread of hatch: importance of
early nutrition. Worlds. Poult. Sci. J. 66:177–188.
Zuidhof, M. J., B. L. Schneider, V. L. Carney, D. R. Korver, and F. E. Robinson. 2014. Growth,
efficiency, and yield of commercial broilers from 1957, 1978, and 2005. Poult. Sci.
93:2970–2982.
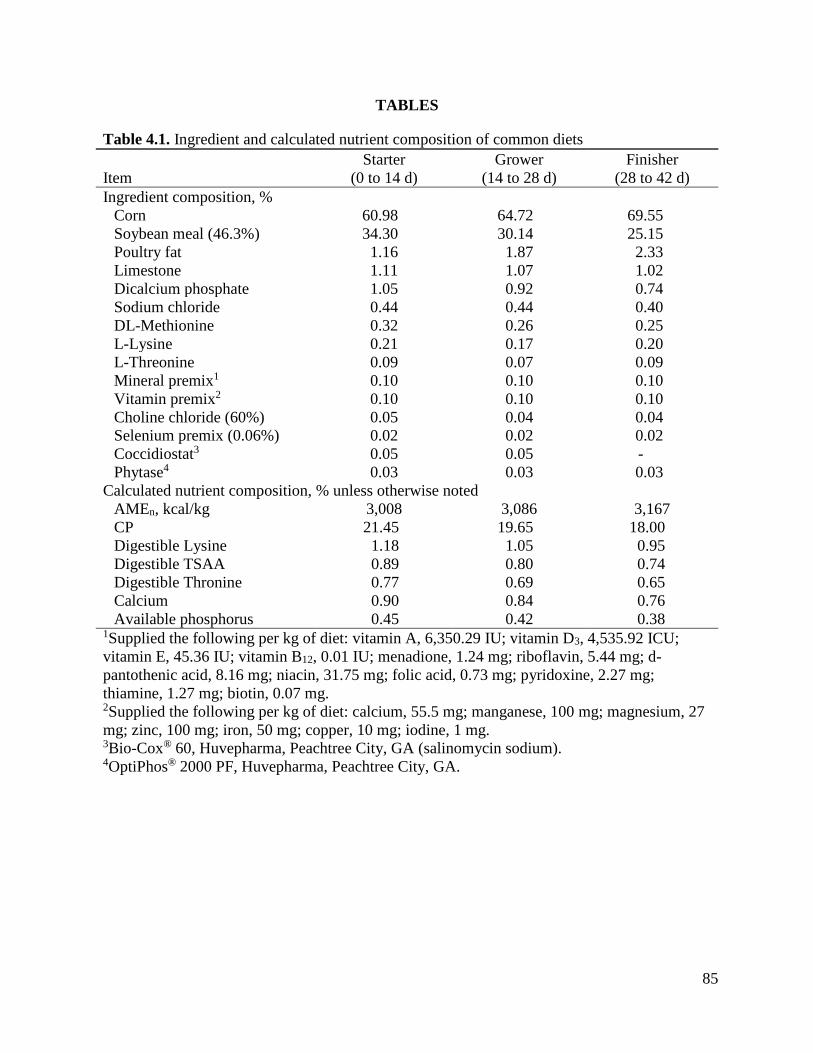
85
TABLES
Table 4.1. Ingredient and calculated nutrient composition of common diets
Item
Starter
(0 to 14 d)
Grower
(14 to 28 d)
Finisher
(28 to 42 d)
Ingredient composition, %
Corn 60.98 64.72 69.55
Soybean meal (46.3%) 34.30 30.14 25.15
Poultry fat 1.16 1.87 2.33
Limestone 1.11 1.07 1.02
Dicalcium phosphate 1.05 0.92 0.74
Sodium chloride 0.44 0.44 0.40
DL-Methionine 0.32 0.26 0.25
L-Lysine 0.21 0.17 0.20
L-Threonine 0.09 0.07 0.09
Mineral premix1 0.10 0.10 0.10
Vitamin premix2 0.10 0.10 0.10
Choline chloride (60%) 0.05 0.04 0.04
Selenium premix (0.06%) 0.02 0.02 0.02
Coccidiostat3 0.05 0.05 -
Phytase4 0.03 0.03 0.03
Calculated nutrient composition, % unless otherwise noted
AMEn, kcal/kg 3,008 3,086 3,167
CP 21.45 19.65 18.00
Digestible Lysine 1.18 1.05 0.95
Digestible TSAA 0.89 0.80 0.74
Digestible Thronine 0.77 0.69 0.65
Calcium 0.90 0.84 0.76
Available phosphorus 0.45 0.42 0.38 1Supplied the following per kg of diet: vitamin A, 6,350.29 IU; vitamin D3, 4,535.92 ICU;
vitamin E, 45.36 IU; vitamin B12, 0.01 IU; menadione, 1.24 mg; riboflavin, 5.44 mg; d-
pantothenic acid, 8.16 mg; niacin, 31.75 mg; folic acid, 0.73 mg; pyridoxine, 2.27 mg;
thiamine, 1.27 mg; biotin, 0.07 mg. 2Supplied the following per kg of diet: calcium, 55.5 mg; manganese, 100 mg; magnesium, 27
mg; zinc, 100 mg; iron, 50 mg; copper, 10 mg; iodine, 1 mg. 3Bio-Cox® 60, Huvepharma, Peachtree City, GA (salinomycin sodium). 4OptiPhos® 2000 PF, Huvepharma, Peachtree City, GA.

86
Table 4.2. Effects of hatch window period (HWP) and nutrient access of feed and water
(FAW) or control (CTL) in the hatching basket on body, yolk, and liver weights of day-old
broiler chicks1
Yolk Liver
Item
Yolk-free
BW
(g)
Weight
(g)
Relative to
BW
(%)
Weight
(g)
Relative to
BW
(%)
Interaction means
Early – CTL 36.39b 4.38 10.58 1.34 3.30
Early – FAW 40.22a 3.98 9.00 1.65 3.75
Pre-peak – CTL 38.23ab 5.06 12.30 1.32 2.87
Pre-peak – FAW 38.25ab 4.51 10.53 1.32 3.10
Post-peak – CTL 39.06ab 4.99 11.22 1.39 3.21
Post-peak – FAW 38.98ab 5.51 12.39 1.30 2.92
Late – CTL 37.85ab 5.61 12.80 1.21 2.81
Late – FAW 38.21ab 5.67 12.98 1.22 2.78
SEM 0.792 0.397 0.852 0.084 0.207
Main effect of HWP
Early 38.31 4.18b 9.79b 1.50a 3.53a
Pre-peak 38.24 4.78ab 11.41ab 1.32ab 2.98b
Post-peak 39.02 5.25a 11.80ab 1.34ab 3.06ab
Late 38.03 5.64a 12.85a 1.22b 2.80b
SEM 0.549 0.276 0.590 0.058 0.143
Main effect of basket
CTL 37.88 5.01 11.72 1.31 3.05
FAW 38.91 4.91 11.20 1.37 3.14
SEM 0.381 0.193 0.410 0.041 0.099
P-values
HWP 0.594 0.002 0.002 0.009 0.002
Basket 0.054 0.726 0.361 0.299 0.519
HWP x Basket 0.026 0.505 0.224 0.089 0.276 a,bMeans within a column that do not share a common superscript are significantly different (P
< 0.05) as determined by a Tukey’s multiple comparison test. 1Mean values of 13 birds from each treatment combination.

87
Table 4.3. Effects of hatch window period (HWP) and nutrient access of feed and water
(FAW) or control (CTL) in the hatching basket on body, yolk, and liver weights of 3 d old
broiler chicks1
Yolk Liver
Item
Yolk-free
BW
(g)
Weight
(g)
Relative to
BW
(%)
Weight
(g)
Relative to
BW
(%)
Interaction means
Early – CTL 80.62 1.15 1.41 4.83 5.92
Early – FAW 89.07 0.79 0.87 5.69 6.33
Pre-peak – CTL 81.64 0.99 1.20 4.73 5.71
Pre-peak – FAW 84.43 0.96 1.13 4.79 5.61
Post-peak – CTL 80.00 0.98 1.22 4.72 5.80
Post-peak – FAW 84.04 1.02 1.22 5.23 6.11
Late – CTL 79.86 1.03 1.27 4.68 5.79
Late – FAW 78.83 1.23 1.57 4.43 5.54
SEM 1.912 0.139 0.175 0.233 0.228
Main effect of HWP
Early 84.85a 0.97 1.14 5.26a 6.13
Pre-peak 83.03ab 0.98 1.16 4.76ab 5.66
Post-peak 82.02ab 1.00 1.22 4.97ab 5.95
Late 79.34b 1.13 1.42 4.56b 5.66
SEM 1.352 0.098 0.124 0.165 0.161
Main effect of basket
CTL 80.53b 1.04 1.28 4.74 5.80
FAW 84.09a 1.00 1.20 5.04 5.90
SEM 0.956 0.0694 0.087 0.116 0.114
P-values
HWP 0.040 0.605 0.359 0.022 0.113
Basket 0.010 0.697 0.533 0.076 0.565
HWP x Basket 0.106 0.232 0.126 0.094 0.411 a,bMeans within a column that do not share a common superscript are significantly different (P
< 0.05) as determined by a Tukey’s multiple comparison test. 1Mean values of 13 birds from each treatment combination.

88
Table 4.4. Body weight (g) of broilers from different hatch window periods (HWP)
within a single hatch window provided feed and water (FAW) in the hatching basket
compared to a control (CTL)1
Days of Age
Item 0 7 14 21 28 35 42
Interaction means
Early – CTL 42.3 185 458 918 1,610 2,235 2,810
Early – FAW 43.7 197 479 963 1,649 2,266 2,885
Pre-peak – CTL 43.2 185 456 910 1,609 2,262 2,871
Pre-peak – FAW 44.4 195 475 968 1,659 2,309 2,937
Post-peak – CTL 44.1 181 457 928 1,655 2,273 2,965
Post-peak – FAW 45.1 190 466 950 1,665 2,326 2,951
Late – CTL 44.8 178 446 920 1,594 2,291 2,915
Late – FAW 45.1 182 456 938 1,631 2,283 2,941
SEM 0.25 1.8 4.0 11.4 16.1 33.9 33.8
Main effect of HWP
Early 43.0c 191a 458a 940 1,629ab 2,250 2,847b
Pre-peak 43.8b 190ab 456a 939 1,634ab 2,286 2,904ab
Post-peak 44.6a 186b 457a 939 1,660a 2,300 2,958a
Late 45.0a 180c 446b 929 1,612b 2,287 2,928ab
SEM 0.18 1.2 2.8 7.9 11.2 23.5 23.4
Main effect of basket
CTL 43.6b 182b 454b 919b 1,617b 2,265 2,890
FAW 44.6a 191a 469a 955a 1,651a 2,296 2,928
SEM 0.124 0.9 2.0 5.7 8.1 17.0 16.9
P-values
HWP <0.001 <0.001 0.001 0.706 0.028 0.490 0.010
Basket <0.001 <0.001 <0.001 <0.001 0.003 0.189 0.106
HWP x Basket 0.146 0.101 0.376 0.224 0.637 0.796 0.528 a-cMeans within a column that do not share a common superscript are significantly
different (P < 0.05) as determined by a Tukey’s multiple comparison test. 1Mean values of 13 (0 d) or 12 (7, 14, 21, 38, 35, 42 d) birds, less mortality, from each
HWP in each of the 13 replicate pens of FAW or CTL basket treatment.
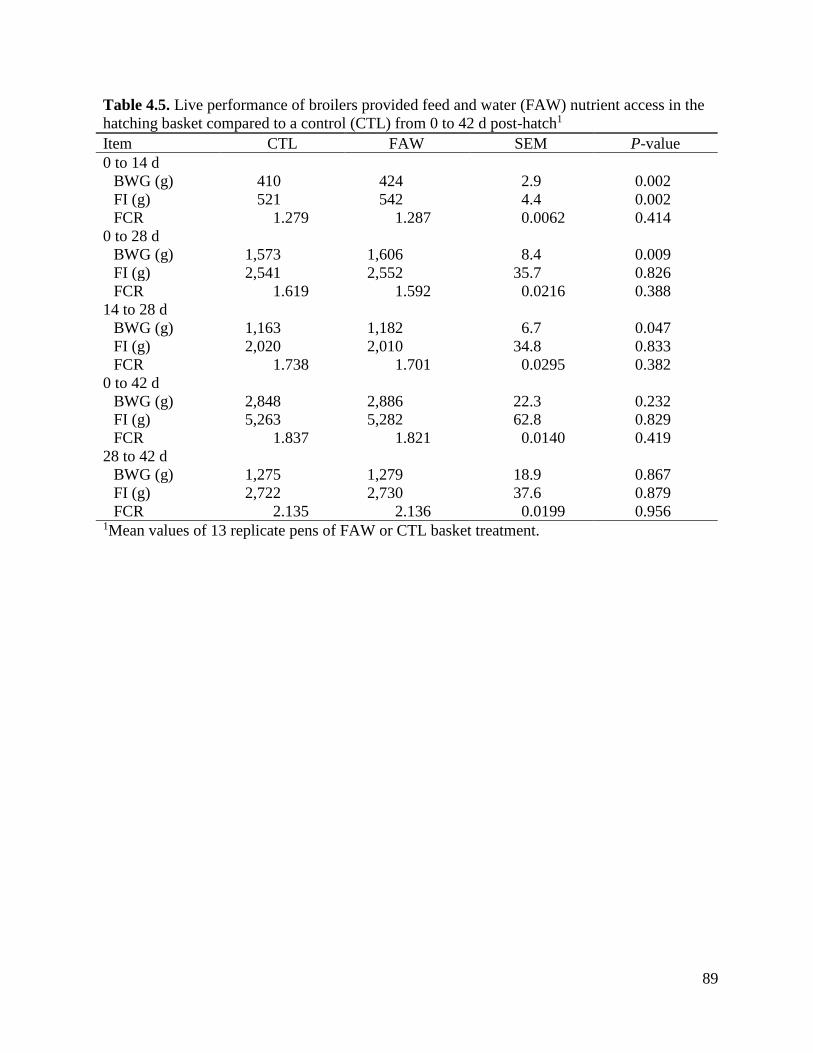
89
Table 4.5. Live performance of broilers provided feed and water (FAW) nutrient access in the
hatching basket compared to a control (CTL) from 0 to 42 d post-hatch1
Item CTL FAW SEM P-value
0 to 14 d
BWG (g) 410 424 2.9 0.002
FI (g) 521 542 4.4 0.002
FCR 1.279 1.287 0.0062 0.414
0 to 28 d
BWG (g) 1,573 1,606 8.4 0.009
FI (g) 2,541 2,552 35.7 0.826
FCR 1.619 1.592 0.0216 0.388
14 to 28 d
BWG (g) 1,163 1,182 6.7 0.047
FI (g) 2,020 2,010 34.8 0.833
FCR 1.738 1.701 0.0295 0.382
0 to 42 d
BWG (g) 2,848 2,886 22.3 0.232
FI (g) 5,263 5,282 62.8 0.829
FCR 1.837 1.821 0.0140 0.419
28 to 42 d
BWG (g) 1,275 1,279 18.9 0.867
FI (g) 2,722 2,730 37.6 0.879
FCR 2.135 2.136 0.0199 0.956 1Mean values of 13 replicate pens of FAW or CTL basket treatment.
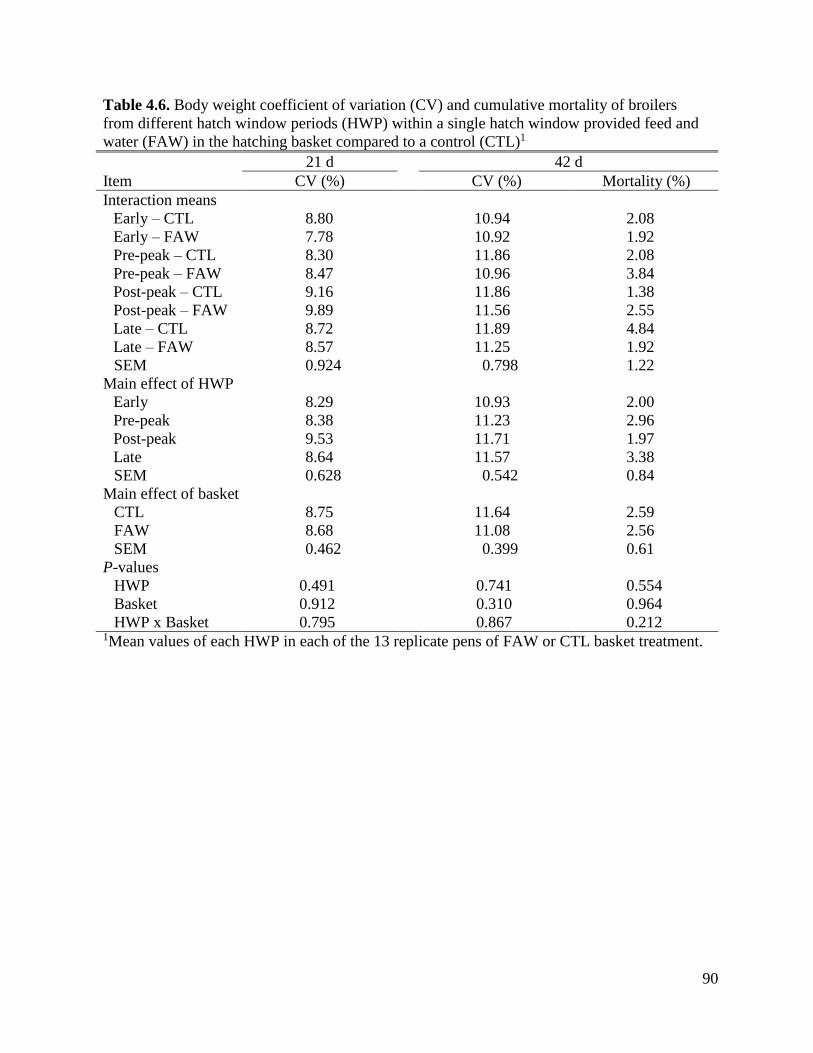
90
Table 4.6. Body weight coefficient of variation (CV) and cumulative mortality of broilers
from different hatch window periods (HWP) within a single hatch window provided feed and
water (FAW) in the hatching basket compared to a control (CTL)1
21 d 42 d
Item CV (%) CV (%) Mortality (%)
Interaction means
Early – CTL 8.80 10.94 2.08
Early – FAW 7.78 10.92 1.92
Pre-peak – CTL 8.30 11.86 2.08
Pre-peak – FAW 8.47 10.96 3.84
Post-peak – CTL 9.16 11.86 1.38
Post-peak – FAW 9.89 11.56 2.55
Late – CTL 8.72 11.89 4.84
Late – FAW 8.57 11.25 1.92
SEM 0.924 0.798 1.22
Main effect of HWP
Early 8.29 10.93 2.00
Pre-peak 8.38 11.23 2.96
Post-peak 9.53 11.71 1.97
Late 8.64 11.57 3.38
SEM 0.628 0.542 0.84
Main effect of basket
CTL 8.75 11.64 2.59
FAW 8.68 11.08 2.56
SEM 0.462 0.399 0.61
P-values
HWP 0.491 0.741 0.554
Basket 0.912 0.310 0.964
HWP x Basket 0.795 0.867 0.212 1Mean values of each HWP in each of the 13 replicate pens of FAW or CTL basket treatment.

91
Table 4.7. Processing weight and yield of broilers from different hatch window periods (HWP) within a single hatch
window provided feed and water (FAW) in the hatching basket compared to a control (CTL)1
Live Hot Carcass Hot Fat Pad Chilled Carcass
Item Weight (g) Weight (g) Yield (%) Weight (g) Yield (%) Weight (g) Yield (%)
Interaction means
Early – CTL 3,152 2,389 75.74 46.8 1.49 2,432 77.14
Early – FAW 3,200 2,414 75.39 48.0 1.50 2,457 76.75
Pre-peak – CTL 3,216 2,424 75.34 49.1 1.53 2,471 76.83
Pre-peak – FAW 3,242 2,442 75.29 46.4 1.42 2,484 76.61
Post-peak – CTL 3,296 2,478 75.17 50.8 1.55 2,525 76.58
Post-peak – FAW 3,263 2,456 75.24 50.8 1.52 2,503 76.70
Late – CTL 3,250 2,433 74.87 50.8 1.57 2,480 76.28
Late – FAW 3,192 2,390 74.86 52.2 1.64 2,431 76.14
SEM 39.2 32.6 0.346 1.88 0.058 33.2 0.362
Main effect of hatch period
Early 3,176b 2,401 75.56 47.4 1.49 2,445 76.95
Pre-peak 3,229ab 2,433 75.32 47.8 1.48 2,478 76.72
Post-peak 3,280a 2,467 75.20 50.8 1.54 2,514 76.64
Late 3,221ab 2,411 74.87 51.5 1.60 2,455 76.21
SEM 26.1 21.7 0.231 1.25 0.039 22.1 0.242
Main effect of basket
CTL 3,229 2,431 75.28 49.4 1.53 2,477 76.71
FAW 3,224 2,425 75.20 49.4 1.52 2,469 76.55
SEM 18.1 15.1 0.160 0.86 0.027 15.3 0.167
P-values
HWP 0.033 0.105 0.157 0.021 0.049 0.088 0.140
Basket 0.868 0.783 0.692 0.993 0.685 0.684 0.477
HWP x Basket 0.390 0.602 0.917 0.574 0.329 0.583 0.882 a,bMeans within a column that do not share a common superscript are significantly different (P < 0.05) as determined
by a Tukey’s multiple comparison test. 1Mean values of 4 male birds randomly sampled from each HWP within each of 13 replicate pens per basket
treatment.
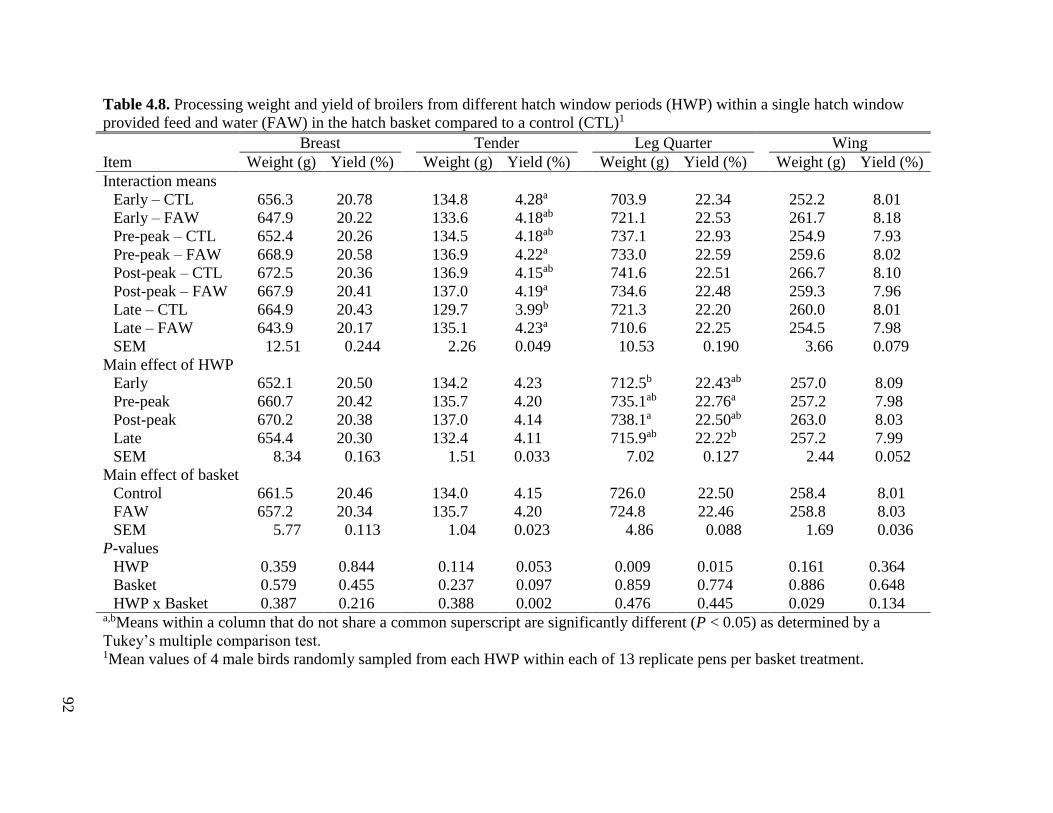
92
Table 4.8. Processing weight and yield of broilers from different hatch window periods (HWP) within a single hatch window
provided feed and water (FAW) in the hatch basket compared to a control (CTL)1
Breast Tender Leg Quarter Wing
Item Weight (g) Yield (%) Weight (g) Yield (%) Weight (g) Yield (%) Weight (g) Yield (%)
Interaction means
Early – CTL 656.3 20.78 134.8 4.28a 703.9 22.34 252.2 8.01
Early – FAW 647.9 20.22 133.6 4.18ab 721.1 22.53 261.7 8.18
Pre-peak – CTL 652.4 20.26 134.5 4.18ab 737.1 22.93 254.9 7.93
Pre-peak – FAW 668.9 20.58 136.9 4.22a 733.0 22.59 259.6 8.02
Post-peak – CTL 672.5 20.36 136.9 4.15ab 741.6 22.51 266.7 8.10
Post-peak – FAW 667.9 20.41 137.0 4.19a 734.6 22.48 259.3 7.96
Late – CTL 664.9 20.43 129.7 3.99b 721.3 22.20 260.0 8.01
Late – FAW 643.9 20.17 135.1 4.23a 710.6 22.25 254.5 7.98
SEM 12.51 0.244 2.26 0.049 10.53 0.190 3.66 0.079
Main effect of HWP
Early 652.1 20.50 134.2 4.23 712.5b 22.43ab 257.0 8.09
Pre-peak 660.7 20.42 135.7 4.20 735.1ab 22.76a 257.2 7.98
Post-peak 670.2 20.38 137.0 4.14 738.1a 22.50ab 263.0 8.03
Late 654.4 20.30 132.4 4.11 715.9ab 22.22b 257.2 7.99
SEM 8.34 0.163 1.51 0.033 7.02 0.127 2.44 0.052
Main effect of basket
Control 661.5 20.46 134.0 4.15 726.0 22.50 258.4 8.01
FAW 657.2 20.34 135.7 4.20 724.8 22.46 258.8 8.03
SEM 5.77 0.113 1.04 0.023 4.86 0.088 1.69 0.036
P-values
HWP 0.359 0.844 0.114 0.053 0.009 0.015 0.161 0.364
Basket 0.579 0.455 0.237 0.097 0.859 0.774 0.886 0.648
HWP x Basket 0.387 0.216 0.388 0.002 0.476 0.445 0.029 0.134 a,bMeans within a column that do not share a common superscript are significantly different (P < 0.05) as determined by a
Tukey’s multiple comparison test. 1Mean values of 4 male birds randomly sampled from each HWP within each of 13 replicate pens per basket treatment.

93
CHAPTER V
CONCLUSIONS
94
In summary, species specific research benefits other commercially produced poultry by
providing accurate information relevant to the physiology of bird species being raised. Such is
evident in the current experiment findings that the ideal egg storage temperature for pheasants
and quail is likely lower than that of chickens. Pheasant eggs had the highest HOF when stored at
10.0 and 12.8°C, indicating that hatch is likely not negatively impacted when eggs are stored
below 12.8°C. Storing pheasant eggs at 21.1°C significantly increased early embryonic
mortality, but storage temperature did not affect performance. Similar observations were made
for quail. Changing management decisions based on this new information may lead to an
increase in hatchability of fertile eggs, and therefore improve efficiency and profitability. Further
experiments are necessary to determine the lower limits of quail and pheasant egg storage
temperature and model the ideal egg storage conditions for each species.
Additionally, the data presented reflects the necessity to investigate early feeding
practices using industry relevant holding times. Chick weight loss while in the hatcher was
shown to be reduced by providing nutrients in the hatching baskets, and this advantage led to
increased growth up to 28 d post-hatch. However, it is also concluded that in these scenarios,
nutrient access in the hatching baskets did not provide an end benefit to boiler performance, or
processing yield, but may in other scenarios. The hatch window was shown to have a significant
impact on the growth rate of a broiler. Specifically, early hatching chicks were lighter at hatch,
but through increased feed intake become heavier than their later hatching counterparts at 7 d
post-hatch. However, when chicks were reared according to hatch time the 42 d BW became
similar and when chicks of different hatch times were reared together the earlier hatching chicks
were again lighter in BW at 42 d.

95
APPENDIX
96