Embed Size (px)
Citation preview
Investigate OOT and OOS in Stability Studies
Kang Ping Xiao
Director, Analytical Development Global Innovation & Development Center Bayer Consumer Health, Morristown NJ
IVT’S LAB WEEK SERIES,
Investigating Laboratory Out-of-Specification (OOS) Test Results;
Stability Testing
DECEMBER 9th, 2015, Philadelphia PA
1 The opinions and conclusions expressed in this presentation are solely the views of the author and do not necessarily reflect those of the Bayer Consumer Health.
Regulatory Guidance on OOS/OOT Investigation • FDA Guidance for Industry
http://www.fda.gov/downloads/drugs/guidancecomplianceregulatoryinformation/guidances/ucm070287.pdf
• MHRA (Medicines and Healthcare products Regulatory Agency)
https://www.gov.uk/government/publications/out-of-specification-investigations
• EMA
• ICH
• WHO
2
FDA Guidance on OOS/OOT Investigation
• Out-of-specification (OOS) test results includes all test results that fall outside the specifications or acceptance criteria established in drug applications, drug master files (DMFs), official compendia, or by the manufacturer.
• OOS also applies to all in-process laboratory tests that are outside of established specifications.
• Sources of OOS include:
• Aberration of the measurement process - PHASE I: LABORATORY INVESTIGATION
• Aberration of the manufacturing process - PHASE II: FULL-SCALE OOS INVESTIGATION
• Impact on other batches depending on the identified source.
• Investigation should be thorough, timely, unbiased, well-documented, and scientifically sound.
• Much of the guidance for OOS investigation may be useful for examining results that are OOT.
3
MHRA Guidance on OOS/OOT Investigation
• It is complementary to the FDA guideline.
• Provides definitions for Out-of-Specification (OOS) Results, Out of Trend (OOT) Results, and atypical / aberrant / anomalous results.
• Breaks down the investigation flow to Phase Ia, Phase Ib, Phase II, and Phase III.
• Provided some guidance on handling OOS and OOT results for stability testing.
Permission of using MHRA presentation materials has been obtained from the Information Management Division of Medicines and Healthcare Products Regulatory Agency , UK
4
Out of Trend (OOT)
• An out-of-trend (OOT) result is a stability result that does not follow the expected trend, either in comparison with other stability batches or with respect to previous results collected during a stability study
• The issue of OOT is an important topic both from a regulatory and business point of view.
• OOT results are not necessarily OOS, but they do not look like a typical data point.
• Scientific literature and regulatory guidelines do not fully address this issue. No established statistical procedure that is widely used to identify OOT results.
5
OOS/OOT during Stability Studies
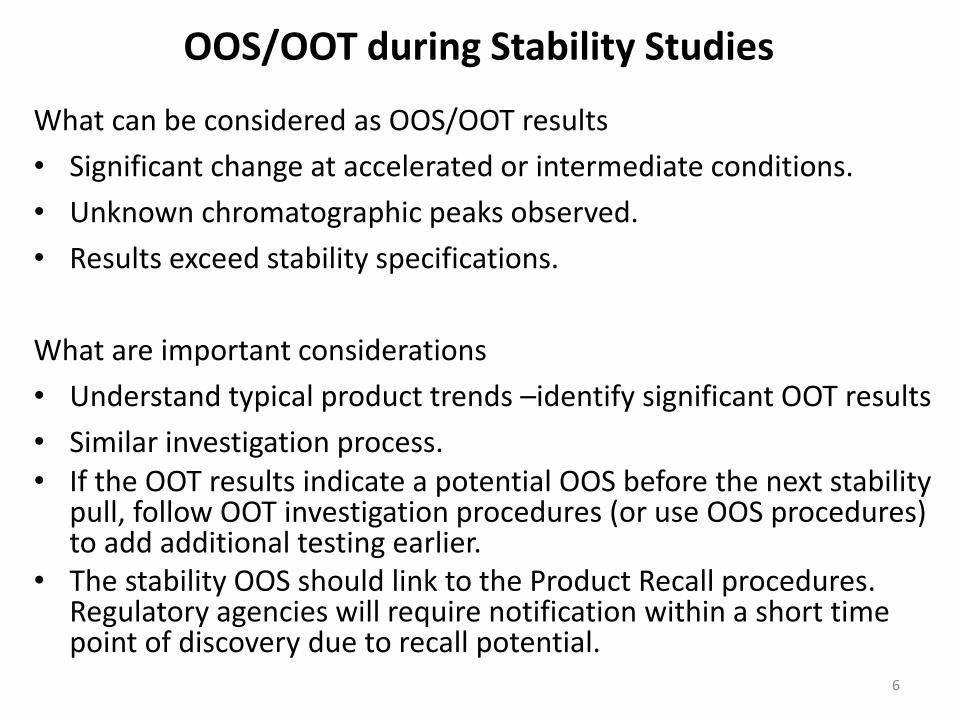
What can be considered as OOS/OOT results
• Significant change at accelerated or intermediate conditions.
• Unknown chromatographic peaks observed.
• Results exceed stability specifications.
What are important considerations
• Understand typical product trends –identify significant OOT results
• Similar investigation process. • If the OOT results indicate a potential OOS before the next stability
pull, follow OOT investigation procedures (or use OOS procedures) to add additional testing earlier.
• The stability OOS should link to the Product Recall procedures. Regulatory agencies will require notification within a short time point of discovery due to recall potential.
6
Approaches of Determining OOT Results
• Methods for Identifying Out-of-Trend Results in Ongoing Stability Data (2013) http://www.pharmtech.com/methods-identifying-out-trend-results-ongoing-stability-data
• Identification of Out-of-Trend Stability Results, A Review of the Potential Regulatory Issue and Various Approaches (2003) http://pharmalytik.com/images/stories/PDF/article%20out%20of%20trend%20april03.pdf
7
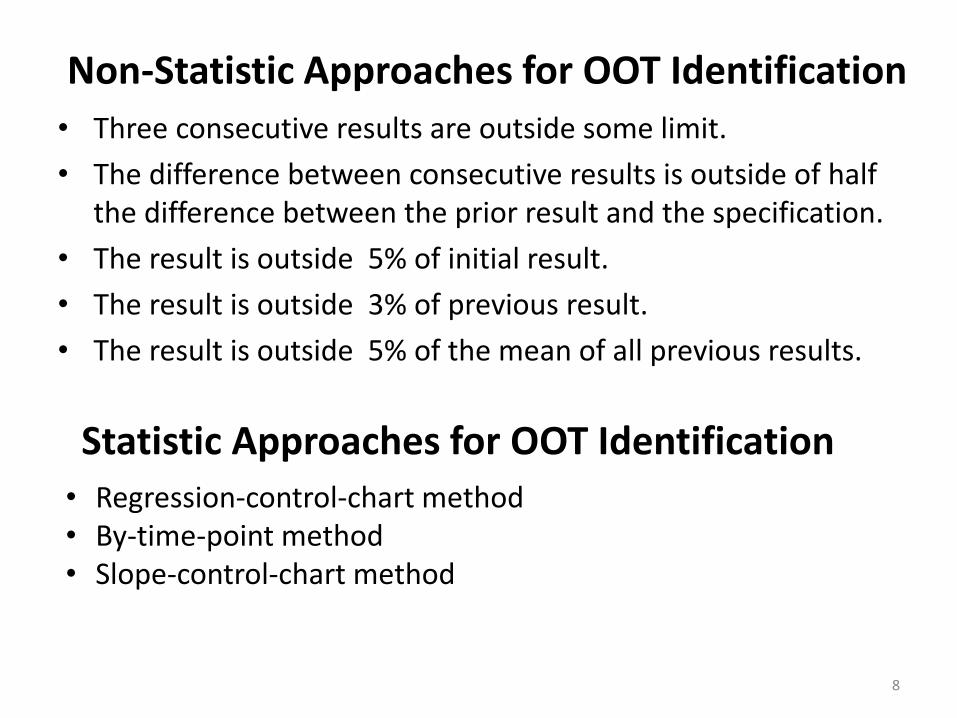
Non-Statistic Approaches for OOT Identification
• Three consecutive results are outside some limit.
• The difference between consecutive results is outside of half the difference between the prior result and the specification.
• The result is outside 5% of initial result.
• The result is outside 3% of previous result.
• The result is outside 5% of the mean of all previous results.
8
Statistic Approaches for OOT Identification • Regression-control-chart method • By-time-point method • Slope-control-chart method
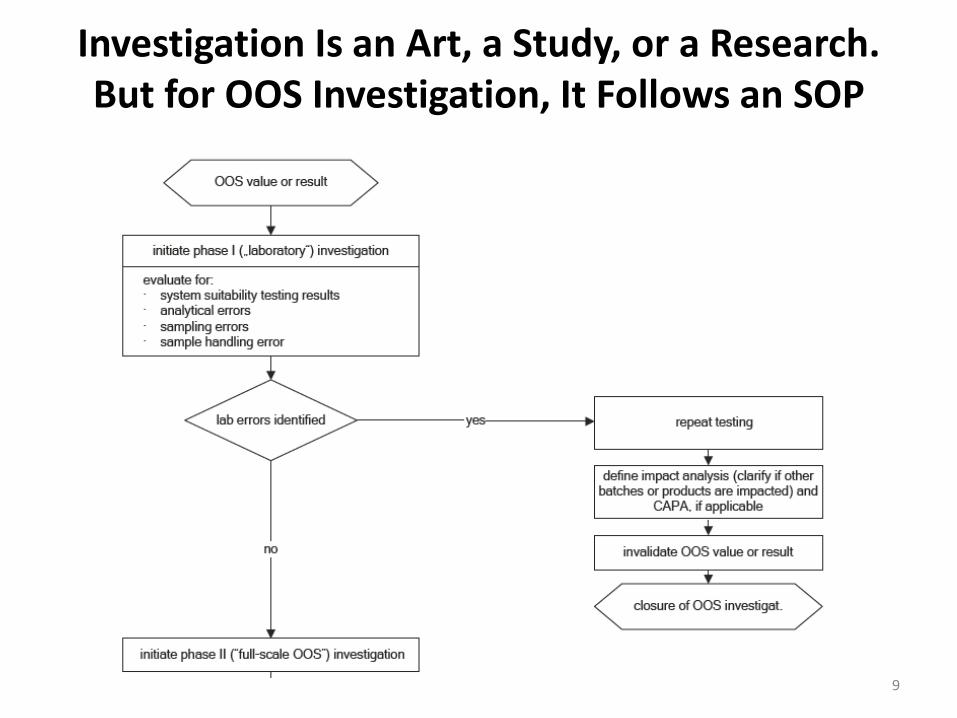
Investigation Is an Art, a Study, or a Research. But for OOS Investigation, It Follows an SOP
9
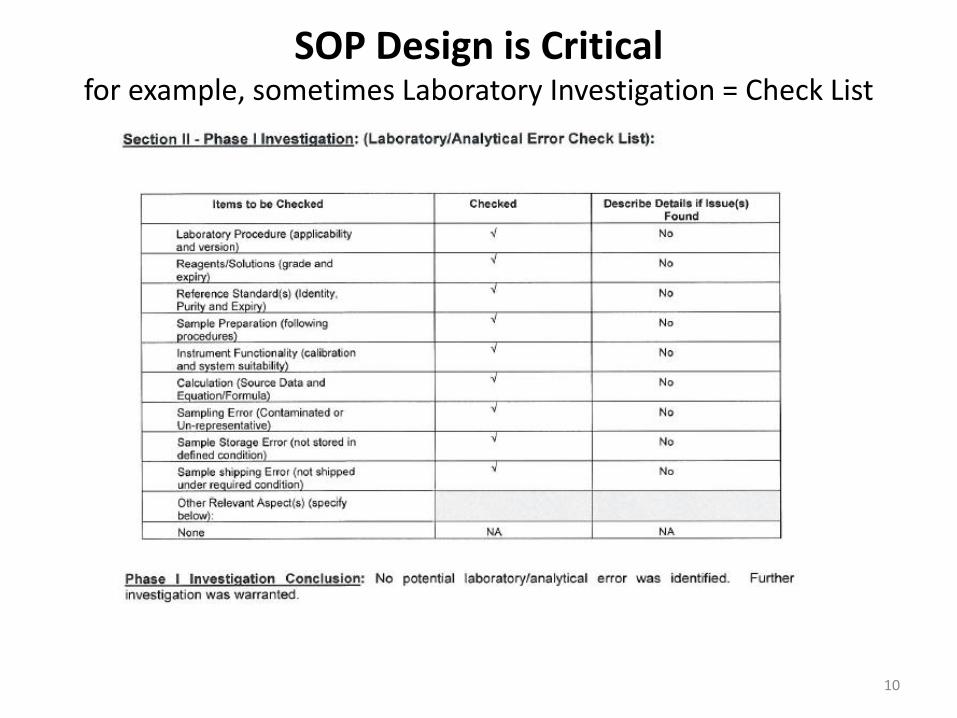
SOP Design is Critical for example, sometimes Laboratory Investigation = Check List
10
But Wait!
• Did I do any meaningful investigation of laboratory error before going to the full scale investigation?
• Did the checklist provide me the opportunity to even do an investigation?
• Design of OOS SOP is critical for providing guidance for investigation.
11
FDA Guideline on Phase I Laboratory Investigation
• Assessment of the accuracy of the laboratory's data.
• Keep test preparations (including the composite or the homogenous source of the aliquot tested).
• If this initial assessment indicates that no meaningful errors were made in the analytical method used to arrive at the data, a full-scale OOS investigation should be conducted.
It does not layout a detailed instruction on how much investigation should be carried out during Phase I. 12
Case Study I, to use or not to use your research brain, that is the
question, …, sometimes
• OOS result was obtained during a long term stability study. • The SOP was designed in a way that Phase I section only contained
a check list. • The analyst was convinced before performing any preliminary re-
analysis that the method robustness was the underlying problem, while FDA guideline states that there should be no preconceived assumptions as to the cause of the OOS result.
• The check list was quickly filled out to pass Phase I, without performing a re-injection of the original sample solution or re-preparation using the original sample composite.
• Laboratory investigation on the method robust was conducted and written in the SOP section for Phase II investigation.
• The OOS result was invalided after a comprehensive study to demonstrate the result was caused by the method.
• However, internal QA audit regarded the OOS investigation as a major violation since Phase II investigation is supposed to involve manufacturing and not only the analytical laboratory.
13
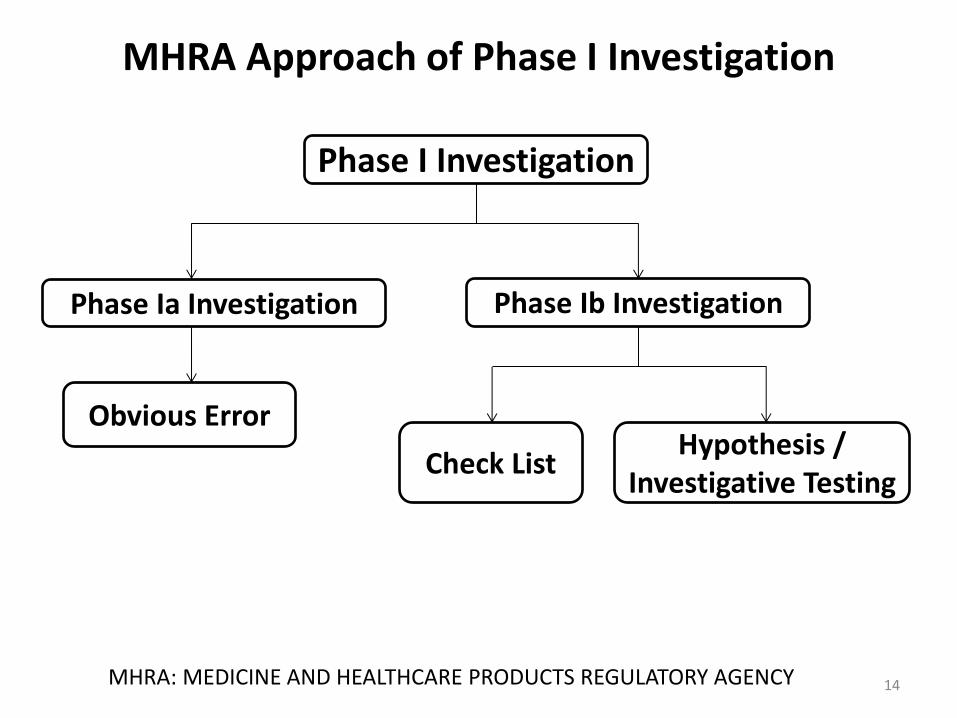
MHRA Approach of Phase I Investigation
14 MHRA: MEDICINE AND HEALTHCARE PRODUCTS REGULATORY AGENCY
Phase I Investigation
Phase Ia Investigation Phase Ib Investigation
Obvious Error
Check List Hypothesis /
Investigative Testing
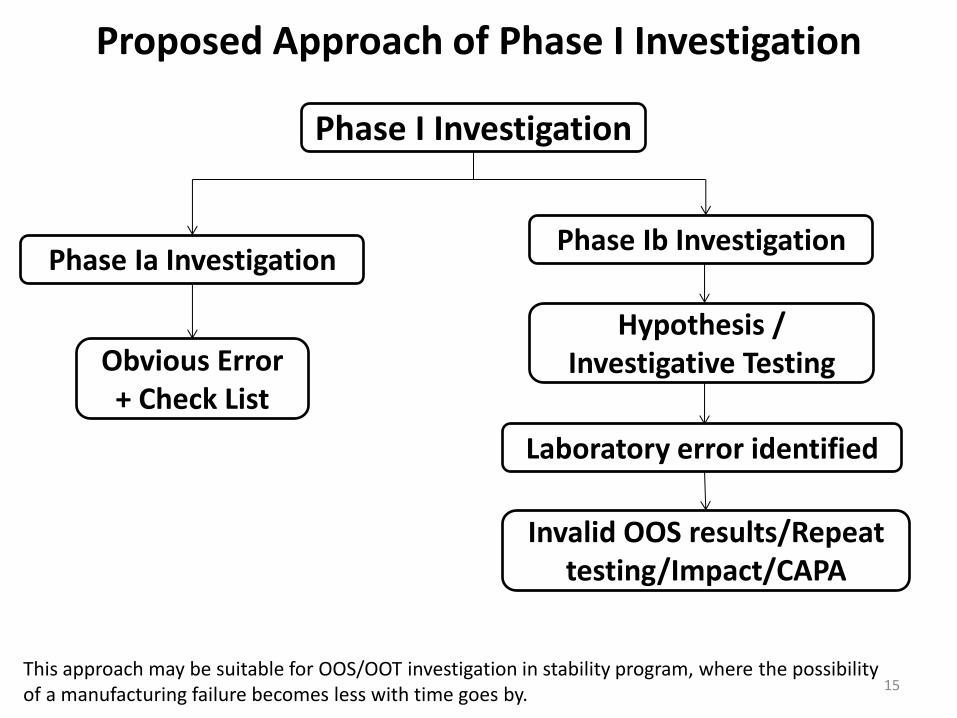
Proposed Approach of Phase I Investigation
15
Phase I Investigation
Phase Ia Investigation Phase Ib Investigation
Obvious Error + Check List
Hypothesis / Investigative Testing
This approach may be suitable for OOS/OOT investigation in stability program, where the possibility of a manufacturing failure becomes less with time goes by.
Laboratory error identified
Invalid OOS results/Repeat testing/Impact/CAPA
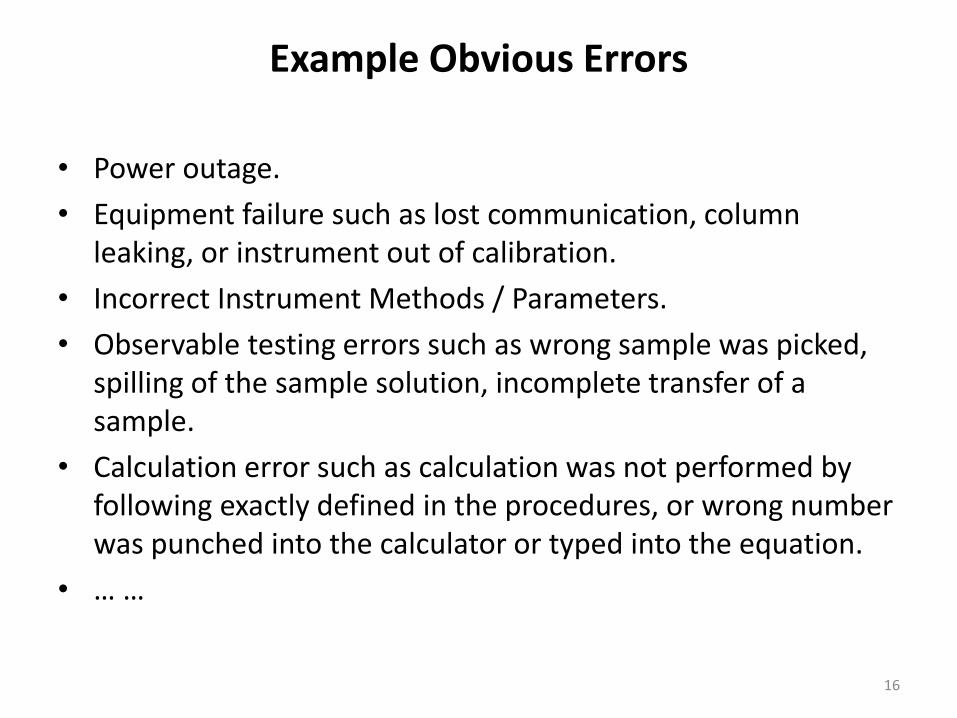
Example Obvious Errors
• Power outage.
• Equipment failure such as lost communication, column leaking, or instrument out of calibration.
• Incorrect Instrument Methods / Parameters.
• Observable testing errors such as wrong sample was picked, spilling of the sample solution, incomplete transfer of a sample.
• Calculation error such as calculation was not performed by following exactly defined in the procedures, or wrong number was punched into the calculator or typed into the equation.
• … …
16
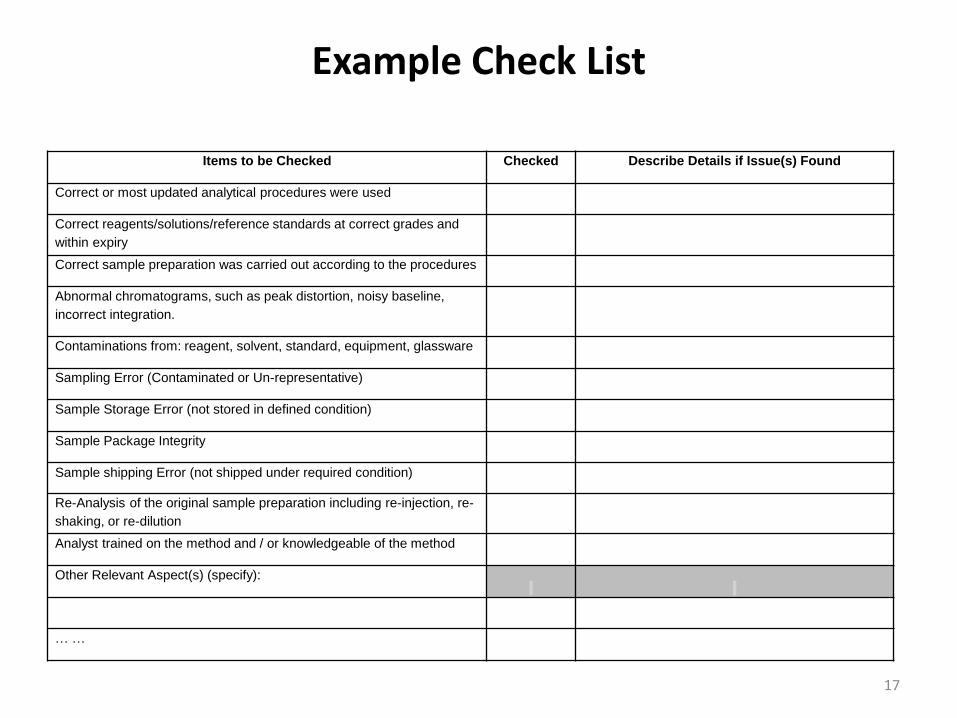
Example Check List
17
Items to be Checked Checked Describe Details if Issue(s) Found
Correct or most updated analytical procedures were used
Correct reagents/solutions/reference standards at correct grades and
within expiry
Correct sample preparation was carried out according to the procedures
Abnormal chromatograms, such as peak distortion, noisy baseline,
incorrect integration.
Contaminations from: reagent, solvent, standard, equipment, glassware
Sampling Error (Contaminated or Un-representative)
Sample Storage Error (not stored in defined condition)
Sample Package Integrity
Sample shipping Error (not shipped under required condition)
Re-Analysis of the original sample preparation including re-injection, re-
shaking, or re-dilution
Analyst trained on the method and / or knowledgeable of the method
Other Relevant Aspect(s) (specify):
… …
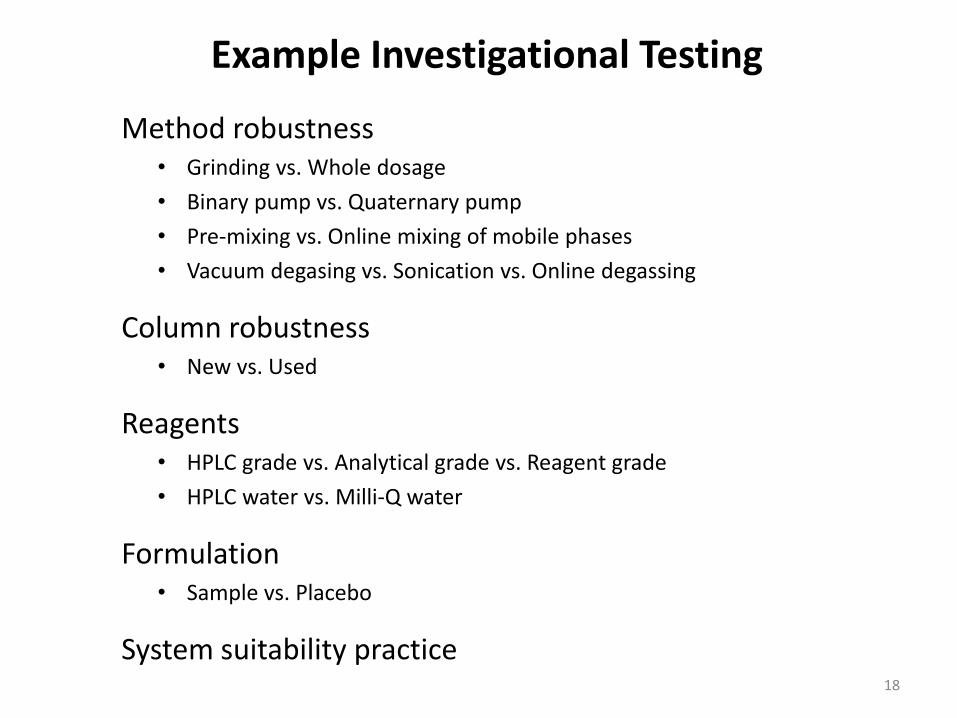
Example Investigational Testing
Method robustness • Grinding vs. Whole dosage
• Binary pump vs. Quaternary pump
• Pre-mixing vs. Online mixing of mobile phases
• Vacuum degasing vs. Sonication vs. Online degassing
Column robustness • New vs. Used
Reagents • HPLC grade vs. Analytical grade vs. Reagent grade
• HPLC water vs. Milli-Q water
Formulation • Sample vs. Placebo
System suitability practice
18
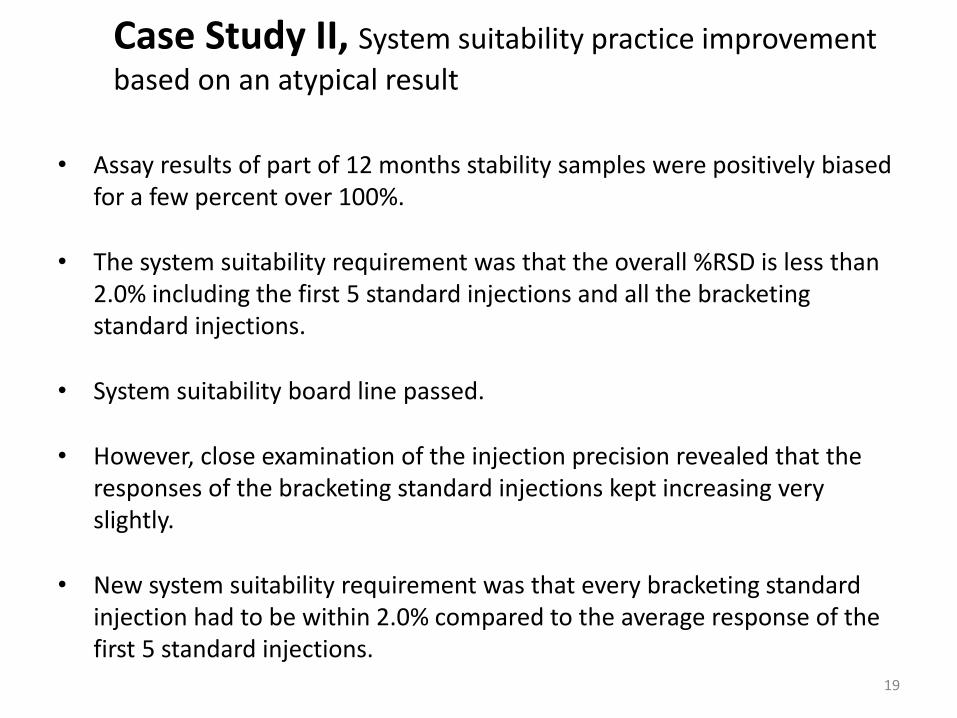
Case Study II, System suitability practice improvement
based on an atypical result
• Assay results of part of 12 months stability samples were positively biased for a few percent over 100%.
• The system suitability requirement was that the overall %RSD is less than 2.0% including the first 5 standard injections and all the bracketing standard injections.
• System suitability board line passed.
• However, close examination of the injection precision revealed that the responses of the bracketing standard injections kept increasing very slightly.
• New system suitability requirement was that every bracketing standard injection had to be within 2.0% compared to the average response of the first 5 standard injections.
19
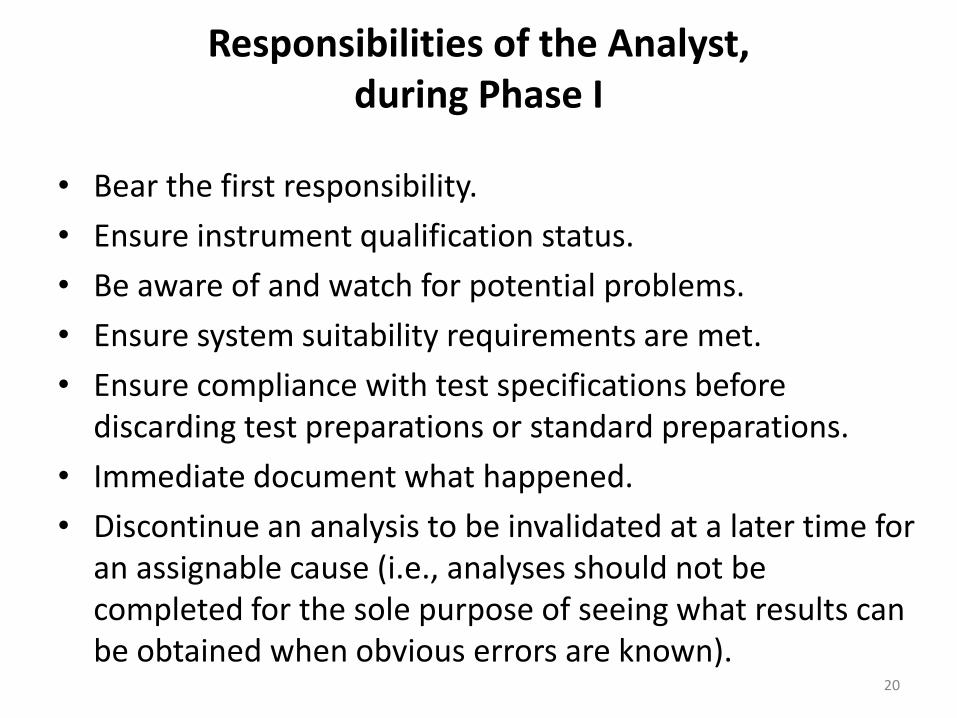
Responsibilities of the Analyst, during Phase I
• Bear the first responsibility.
• Ensure instrument qualification status.
• Be aware of and watch for potential problems.
• Ensure system suitability requirements are met.
• Ensure compliance with test specifications before discarding test preparations or standard preparations.
• Immediate document what happened.
• Discontinue an analysis to be invalidated at a later time for an assignable cause (i.e., analyses should not be completed for the sole purpose of seeing what results can be obtained when obvious errors are known).
20
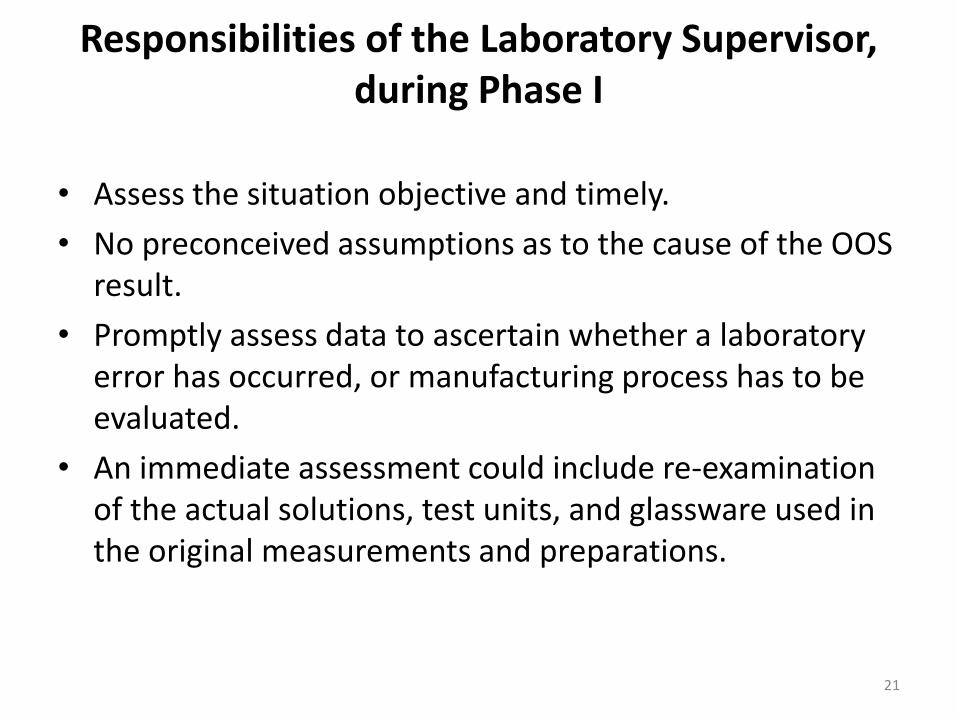
Responsibilities of the Laboratory Supervisor, during Phase I
• Assess the situation objective and timely.
• No preconceived assumptions as to the cause of the OOS result.
• Promptly assess data to ascertain whether a laboratory error has occurred, or manufacturing process has to be evaluated.
• An immediate assessment could include re-examination of the actual solutions, test units, and glassware used in the original measurements and preparations.
21
Responsibilities of the Laboratory Supervisor, during Phase I, continued
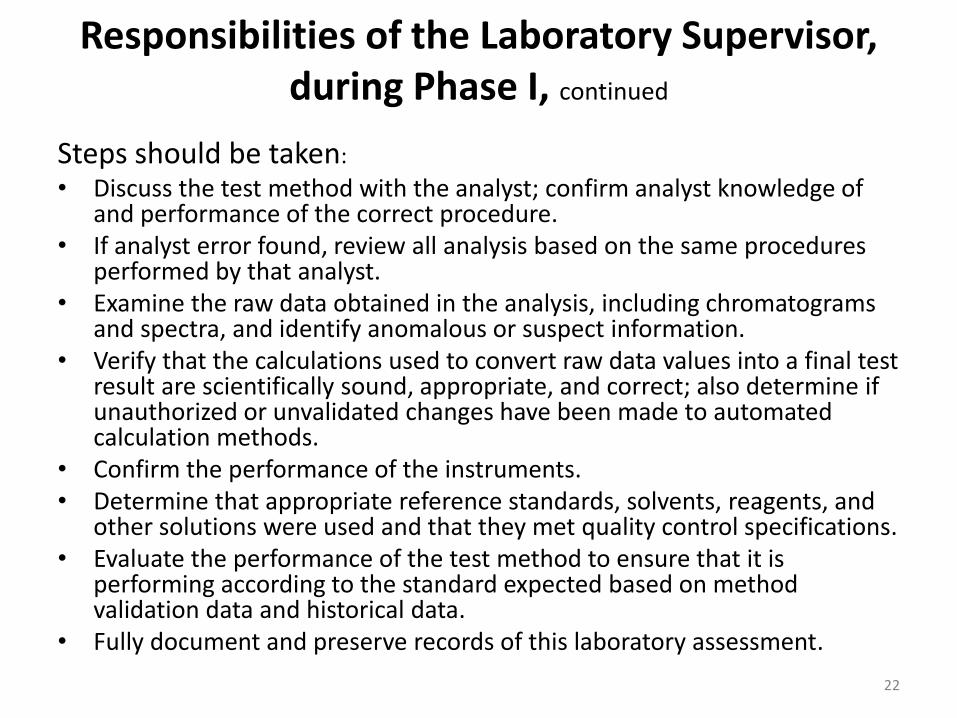
Steps should be taken:
• Discuss the test method with the analyst; confirm analyst knowledge of and performance of the correct procedure.
• If analyst error found, review all analysis based on the same procedures performed by that analyst.
• Examine the raw data obtained in the analysis, including chromatograms and spectra, and identify anomalous or suspect information.
• Verify that the calculations used to convert raw data values into a final test result are scientifically sound, appropriate, and correct; also determine if unauthorized or unvalidated changes have been made to automated calculation methods.
• Confirm the performance of the instruments. • Determine that appropriate reference standards, solvents, reagents, and
other solutions were used and that they met quality control specifications. • Evaluate the performance of the test method to ensure that it is
performing according to the standard expected based on method validation data and historical data.
• Fully document and preserve records of this laboratory assessment.
22
Responsibilities of the Laboratory Supervisor, during Phase I, continued
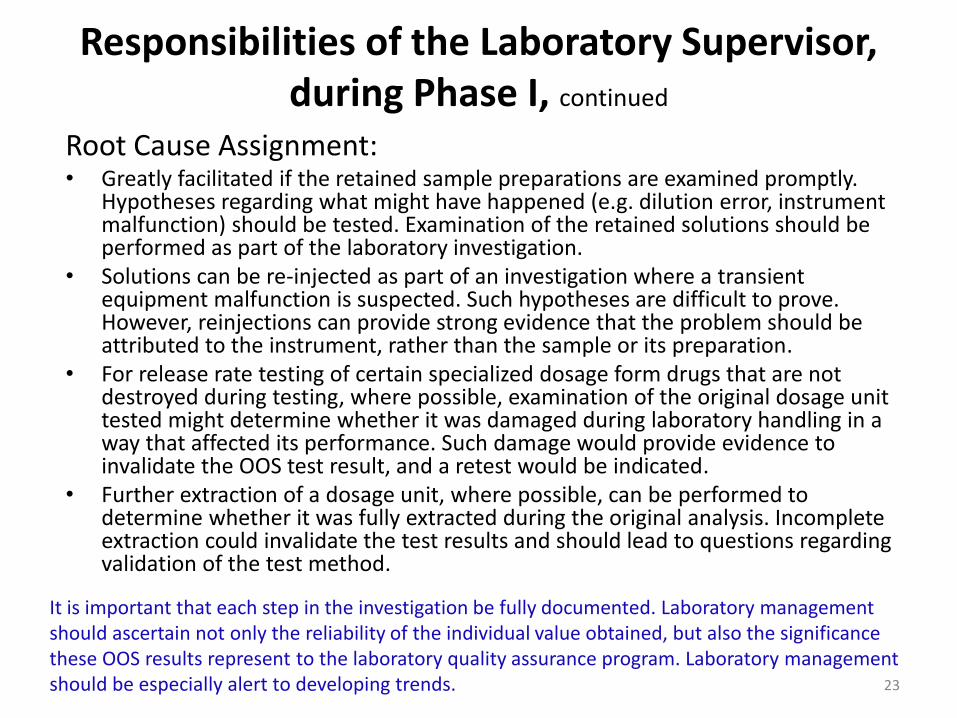
Root Cause Assignment: • Greatly facilitated if the retained sample preparations are examined promptly.
Hypotheses regarding what might have happened (e.g. dilution error, instrument malfunction) should be tested. Examination of the retained solutions should be performed as part of the laboratory investigation.
• Solutions can be re-injected as part of an investigation where a transient equipment malfunction is suspected. Such hypotheses are difficult to prove. However, reinjections can provide strong evidence that the problem should be attributed to the instrument, rather than the sample or its preparation.
• For release rate testing of certain specialized dosage form drugs that are not destroyed during testing, where possible, examination of the original dosage unit tested might determine whether it was damaged during laboratory handling in a way that affected its performance. Such damage would provide evidence to invalidate the OOS test result, and a retest would be indicated.
• Further extraction of a dosage unit, where possible, can be performed to determine whether it was fully extracted during the original analysis. Incomplete extraction could invalidate the test results and should lead to questions regarding validation of the test method.
23
It is important that each step in the investigation be fully documented. Laboratory management should ascertain not only the reliability of the individual value obtained, but also the significance these OOS results represent to the laboratory quality assurance program. Laboratory management should be especially alert to developing trends.
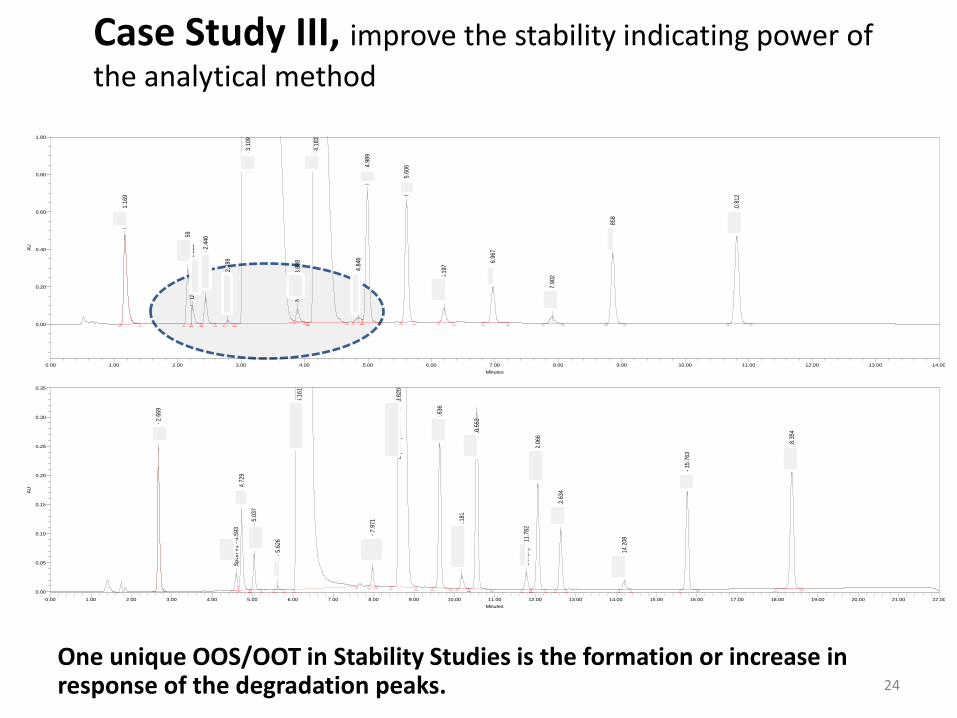
Case Study III, improve the stability indicating power of
the analytical method
One unique OOS/OOT in Stability Studies is the formation or increase in response of the degradation peaks. 24
HN
PA
- 1
.169
MN
A -
2.1
59U
nspe
cifie
d #5
- 2
.225
Uns
peci
fied
#1 -
2.4
40
Uns
peci
fied
#2 -
2.7
89
Nap
Na
- 3.
109
Nor
-DIP
H -
3.8
88
DIP
H -
4.1
83
DIP
H N
-Oxi
de -
4.8
46
HM
N -
4.9
89
MN
E -
5.6
06
Ben
zhy
- 6.
197
AM
N -
6.9
67
Ben
zo -
7.9
02
NM
E -
8.8
58
EM
N -
10.
812
AU
0.00
0.20
0.40
0.60
0.80
1.00
Minutes
0.00 1.00 2.00 3.00 4.00 5.00 6.00 7.00 8.00 9.00 10.00 11.00 12.00 13.00 14.00
HN
PA
- 2
.669
SpU
n #1
- 4
.593
MN
A -
4.7
29
SpU
n #2
- 5
.037
SpU
n #3
- 5
.626
Nap
roxe
n S
odiu
m -
6.1
61
Nor
-DIP
H -
7.9
71
Dip
henh
ydra
min
e H
Cl -
8.6
20
HM
N -
9.6
36
DIP
H N
-Oxi
de -
10.
181
MN
E -
10.
553
Ben
zhy
- 11
.782
SpU
n #4
- 1
2.06
6
AM
N -
12.
634
Ben
zo -
14.
208
NM
E -
15.
763
EM
N -
18.
354
AU
0.00
0.05
0.10
0.15
0.20
0.25
0.30
0.35
Minutes
0.00 1.00 2.00 3.00 4.00 5.00 6.00 7.00 8.00 9.00 10.00 11.00 12.00 13.00 14.00 15.00 16.00 17.00 18.00 19.00 20.00 21.00 22.00
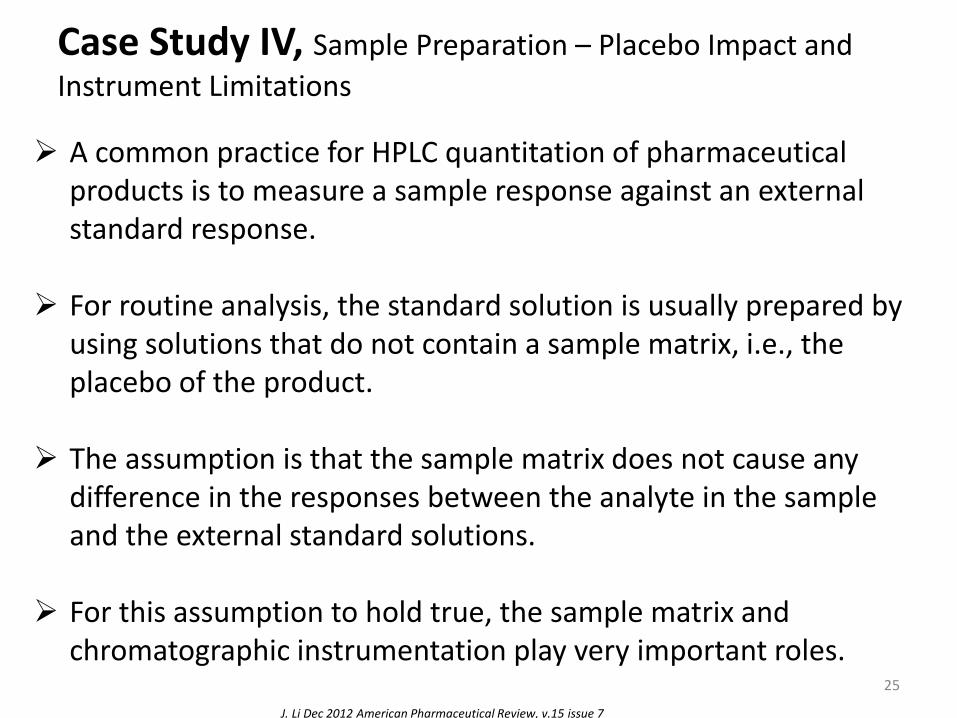
Case Study IV, Sample Preparation – Placebo Impact and
Instrument Limitations
A common practice for HPLC quantitation of pharmaceutical products is to measure a sample response against an external standard response.
For routine analysis, the standard solution is usually prepared by using solutions that do not contain a sample matrix, i.e., the placebo of the product.
The assumption is that the sample matrix does not cause any difference in the responses between the analyte in the sample and the external standard solutions.
For this assumption to hold true, the sample matrix and chromatographic instrumentation play very important roles.
25
J. Li Dec 2012 American Pharmaceutical Review, v.15 issue 7
Sample Preparation – Placebo Impact and Instrument Limitations, Example
Differences between placebo concentrations, autosampler temperatures, injector sample withdrawing speeds, and injection volumes on Agilent HPLC, Waters Alliance HPLC, and Waters Acquity UPLC were investigated in one study.
In extreme cases, a sample response can be 90% less than the standard response, which obviously causes attention.
But in some cases, the difference in responses is less than 4% and maybe overlooked.
Product development endeavors can be wrongly focused on product stability, content uniformity, etc., without knowing that the undesired analytical recoveries are actually caused by the method which overlooks the sample matrix effect or does not take into account the delicate nature of chromatographic instrumentation.
26
J. Li Dec 2012 American Pharmaceutical Review, v.15 issue 7
Sample Preparation – Peak Shape Does Not Necessarily Tell the Truth
Retention Time (minutes)
0.20 0.40 0.60 0.80 1.00 1.20 1.40 1.60 1.80 2.00 2.20 2.40 2.60 2.80 3.00
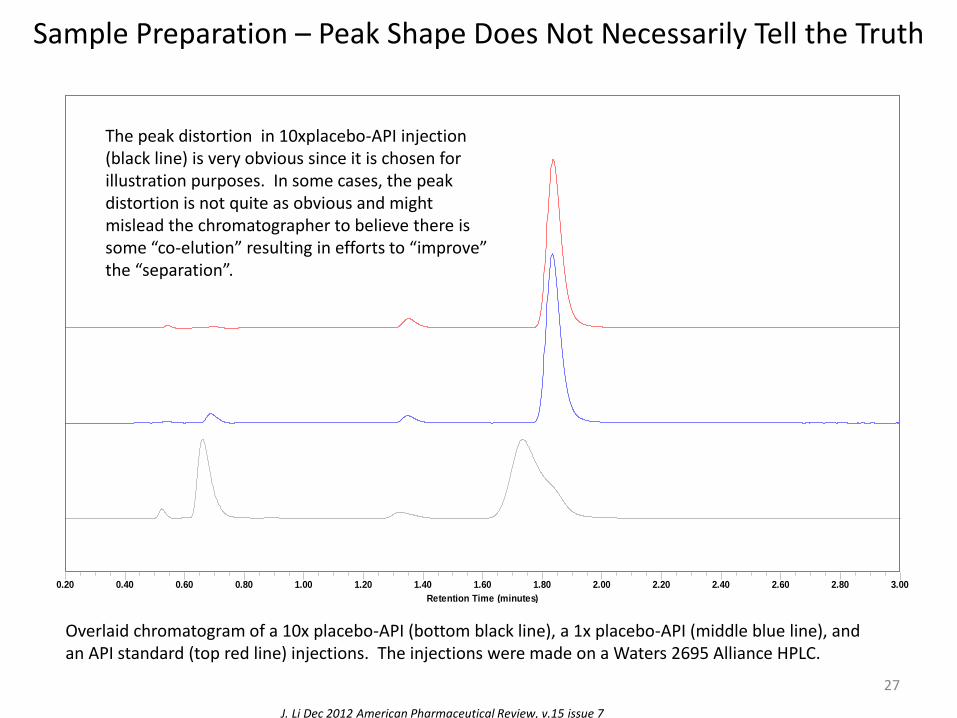
Overlaid chromatogram of a 10x placebo-API (bottom black line), a 1x placebo-API (middle blue line), and an API standard (top red line) injections. The injections were made on a Waters 2695 Alliance HPLC.
The peak distortion in 10xplacebo-API injection (black line) is very obvious since it is chosen for illustration purposes. In some cases, the peak distortion is not quite as obvious and might mislead the chromatographer to believe there is some “co-elution” resulting in efforts to “improve” the “separation”.
27
J. Li Dec 2012 American Pharmaceutical Review, v.15 issue 7
Sample Preparation – Peak Shape Does Not Necessarily Tell the Truth
Retention Time (minutes)
0.60 0.70 0.80 0.90 1.00 1.10 1.20 1.30 1.40 1.50 1.60 1.70 1.80 1.90 2.00 2.10 2.20 2.30 2.40 2.50 2.60 2.70 2.80 2.90 3.00
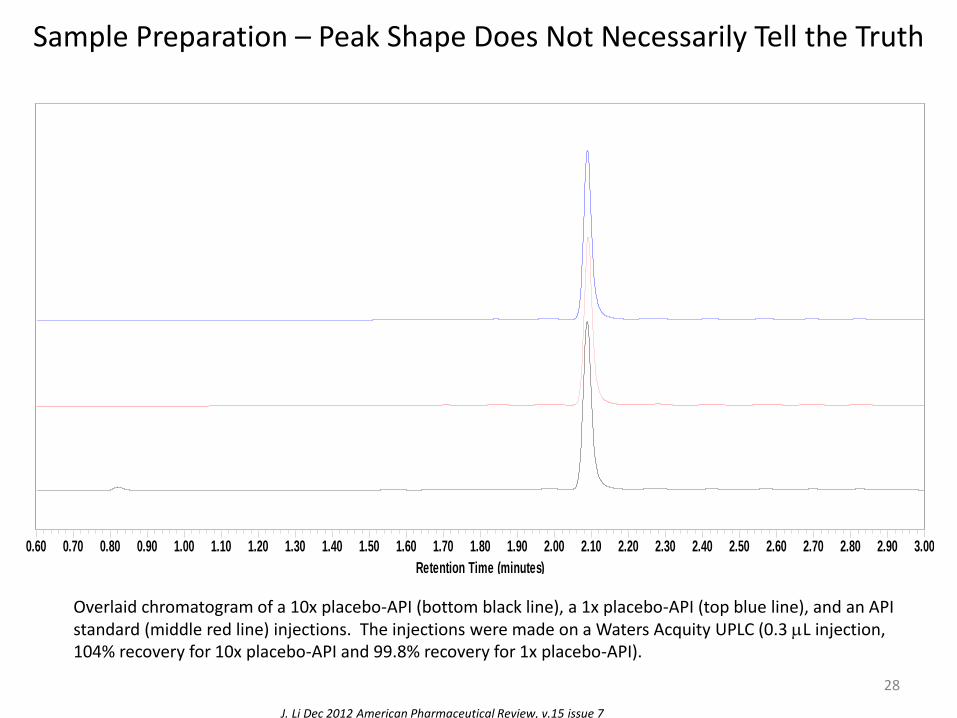
Overlaid chromatogram of a 10x placebo-API (bottom black line), a 1x placebo-API (top blue line), and an API standard (middle red line) injections. The injections were made on a Waters Acquity UPLC (0.3 mL injection, 104% recovery for 10x placebo-API and 99.8% recovery for 1x placebo-API).
28
J. Li Dec 2012 American Pharmaceutical Review, v.15 issue 7
Sample Preparation – Impacts on Different Instruments
29
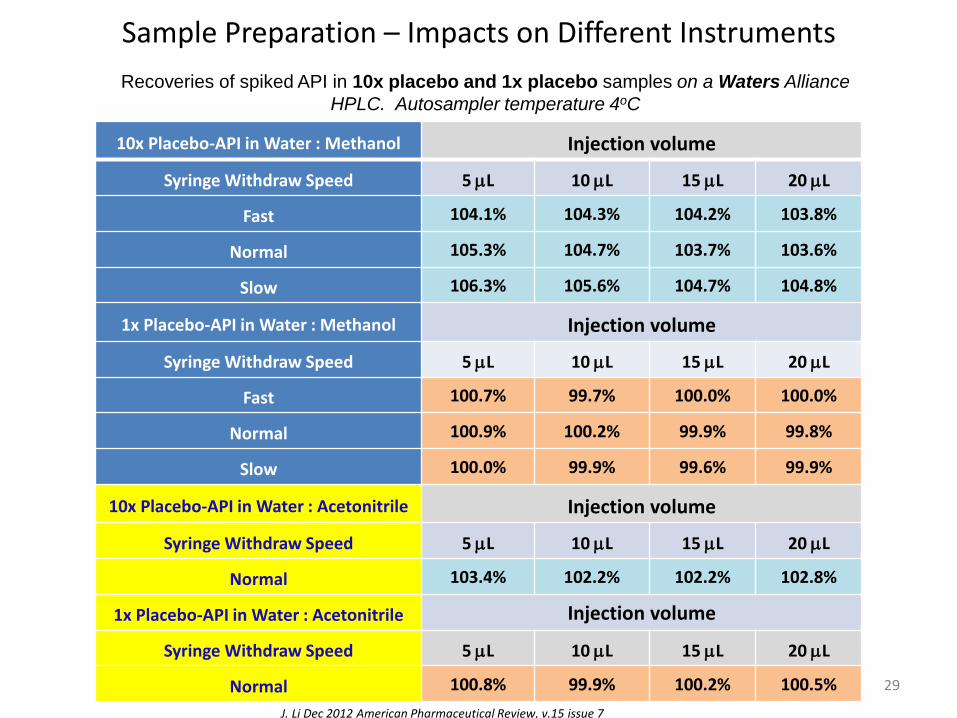
10x Placebo-API in Water : Methanol Injection volume
Syringe Withdraw Speed 5 mL 10 mL 15 mL 20 mL
Fast 104.1% 104.3% 104.2% 103.8%
Normal 105.3% 104.7% 103.7% 103.6%
Slow 106.3% 105.6% 104.7% 104.8%
1x Placebo-API in Water : Methanol Injection volume
Syringe Withdraw Speed 5 mL 10 mL 15 mL 20 mL
Fast 100.7% 99.7% 100.0% 100.0%
Normal 100.9% 100.2% 99.9% 99.8%
Slow 100.0% 99.9% 99.6% 99.9%
10x Placebo-API in Water : Acetonitrile Injection volume
Syringe Withdraw Speed 5 mL 10 mL 15 mL 20 mL
Normal 103.4% 102.2% 102.2% 102.8%
1x Placebo-API in Water : Acetonitrile Injection volume
Syringe Withdraw Speed 5 mL 10 mL 15 mL 20 mL
Normal 100.8% 99.9% 100.2% 100.5%
J. Li Dec 2012 American Pharmaceutical Review, v.15 issue 7
Recoveries of spiked API in 10x placebo and 1x placebo samples on a Waters Alliance
HPLC. Autosampler temperature 4oC
Sample Preparation – Impacts on Different Instruments
30
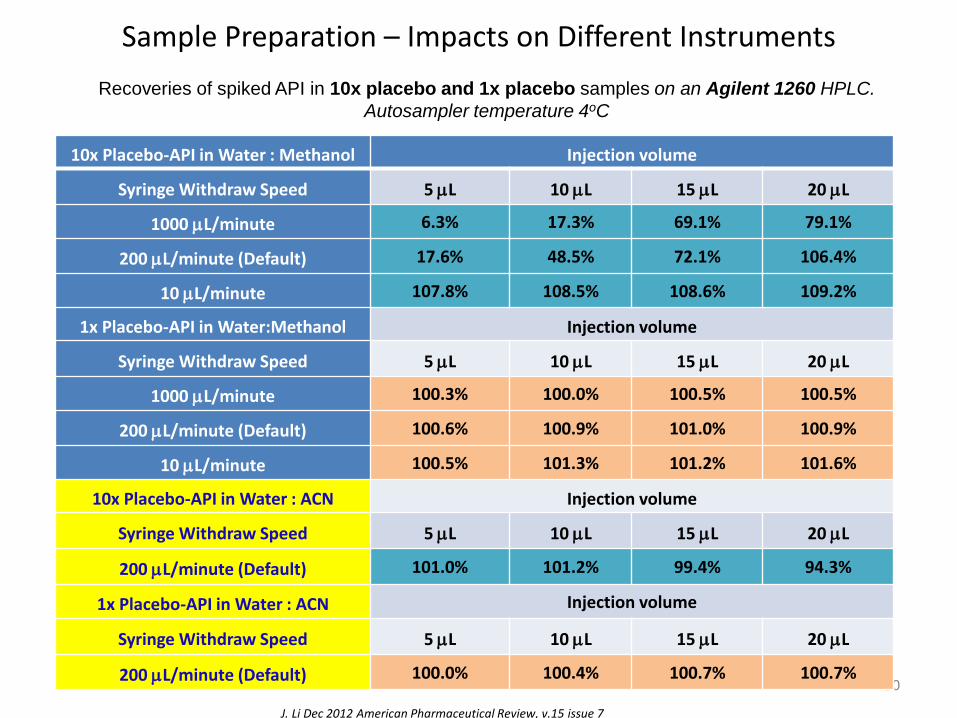
10x Placebo-API in Water : Methanol Injection volume
Syringe Withdraw Speed 5 mL 10 mL 15 mL 20 mL
1000 mL/minute 6.3% 17.3% 69.1% 79.1%
200 mL/minute (Default) 17.6% 48.5% 72.1% 106.4%
10 mL/minute 107.8% 108.5% 108.6% 109.2%
1x Placebo-API in Water:Methanol Injection volume
Syringe Withdraw Speed 5 mL 10 mL 15 mL 20 mL
1000 mL/minute 100.3% 100.0% 100.5% 100.5%
200 mL/minute (Default) 100.6% 100.9% 101.0% 100.9%
10 mL/minute 100.5% 101.3% 101.2% 101.6%
10x Placebo-API in Water : ACN Injection volume
Syringe Withdraw Speed 5 mL 10 mL 15 mL 20 mL
200 mL/minute (Default) 101.0% 101.2% 99.4% 94.3%
1x Placebo-API in Water : ACN Injection volume
Syringe Withdraw Speed 5 mL 10 mL 15 mL 20 mL
200 mL/minute (Default) 100.0% 100.4% 100.7% 100.7%
J. Li Dec 2012 American Pharmaceutical Review, v.15 issue 7
Recoveries of spiked API in 10x placebo and 1x placebo samples on an Agilent 1260 HPLC.
Autosampler temperature 4oC
Sample Preparation – Impacts on Different Instruments
31
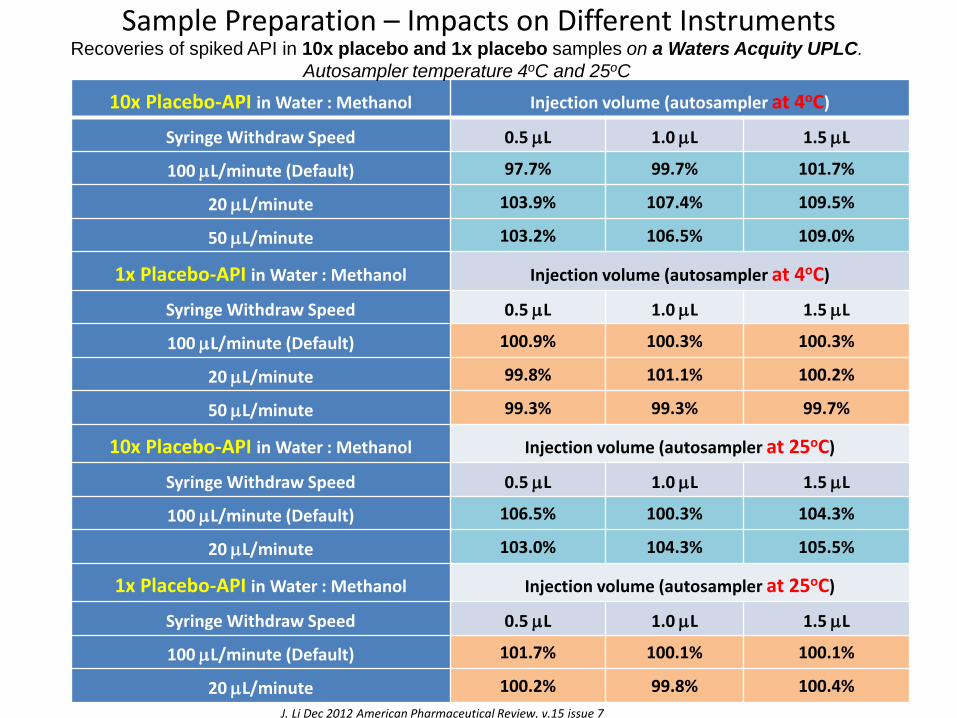
10x Placebo-API in Water : Methanol Injection volume (autosampler at 4oC)
Syringe Withdraw Speed 0.5 mL 1.0 mL 1.5 mL
100 mL/minute (Default) 97.7% 99.7% 101.7%
20 mL/minute 103.9% 107.4% 109.5%
50 mL/minute 103.2% 106.5% 109.0%
1x Placebo-API in Water : Methanol Injection volume (autosampler at 4oC)
Syringe Withdraw Speed 0.5 mL 1.0 mL 1.5 mL
100 mL/minute (Default) 100.9% 100.3% 100.3%
20 mL/minute 99.8% 101.1% 100.2%
50 mL/minute 99.3% 99.3% 99.7%
10x Placebo-API in Water : Methanol Injection volume (autosampler at 25oC)
Syringe Withdraw Speed 0.5 mL 1.0 mL 1.5 mL
100 mL/minute (Default) 106.5% 100.3% 104.3%
20 mL/minute 103.0% 104.3% 105.5%
1x Placebo-API in Water : Methanol Injection volume (autosampler at 25oC)
Syringe Withdraw Speed 0.5 mL 1.0 mL 1.5 mL
100 mL/minute (Default) 101.7% 100.1% 100.1%
20 mL/minute 100.2% 99.8% 100.4%
Recoveries of spiked API in 10x placebo and 1x placebo samples on a Waters Acquity UPLC.
Autosampler temperature 4oC and 25oC
J. Li Dec 2012 American Pharmaceutical Review, v.15 issue 7
Sample Preparation – Impacts on Different Instruments
32
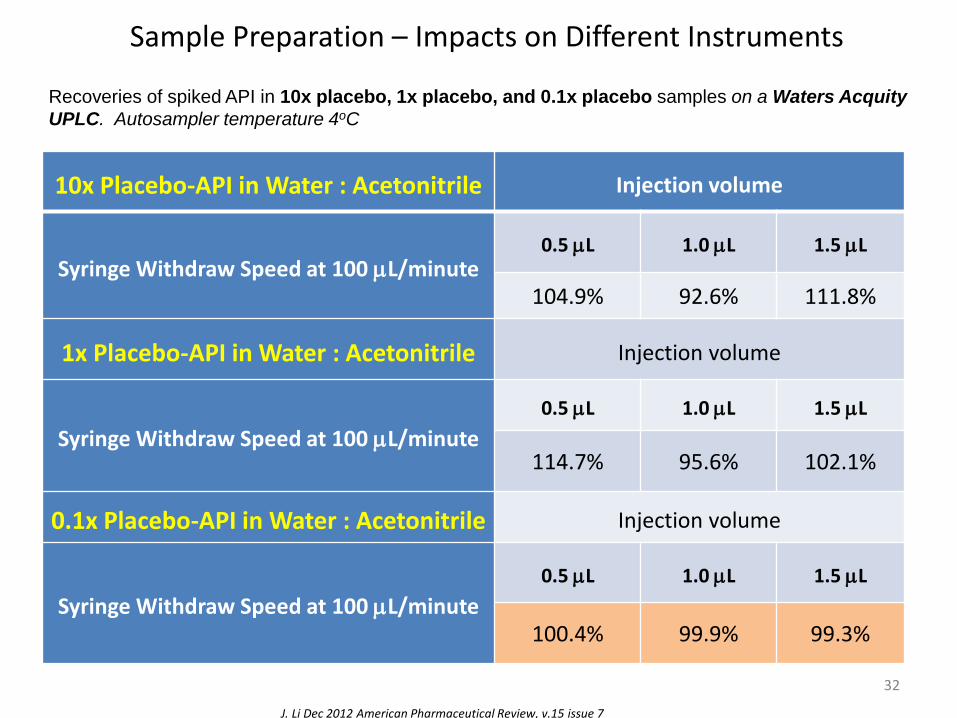
10x Placebo-API in Water : Acetonitrile Injection volume
Syringe Withdraw Speed at 100 mL/minute 0.5 mL 1.0 mL 1.5 mL
104.9% 92.6% 111.8%
1x Placebo-API in Water : Acetonitrile Injection volume
Syringe Withdraw Speed at 100 mL/minute
0.5 mL 1.0 mL 1.5 mL
114.7% 95.6% 102.1%
0.1x Placebo-API in Water : Acetonitrile Injection volume
Syringe Withdraw Speed at 100 mL/minute
0.5 mL 1.0 mL 1.5 mL
100.4% 99.9% 99.3%
Recoveries of spiked API in 10x placebo, 1x placebo, and 0.1x placebo samples on a Waters Acquity
UPLC. Autosampler temperature 4oC
J. Li Dec 2012 American Pharmaceutical Review, v.15 issue 7
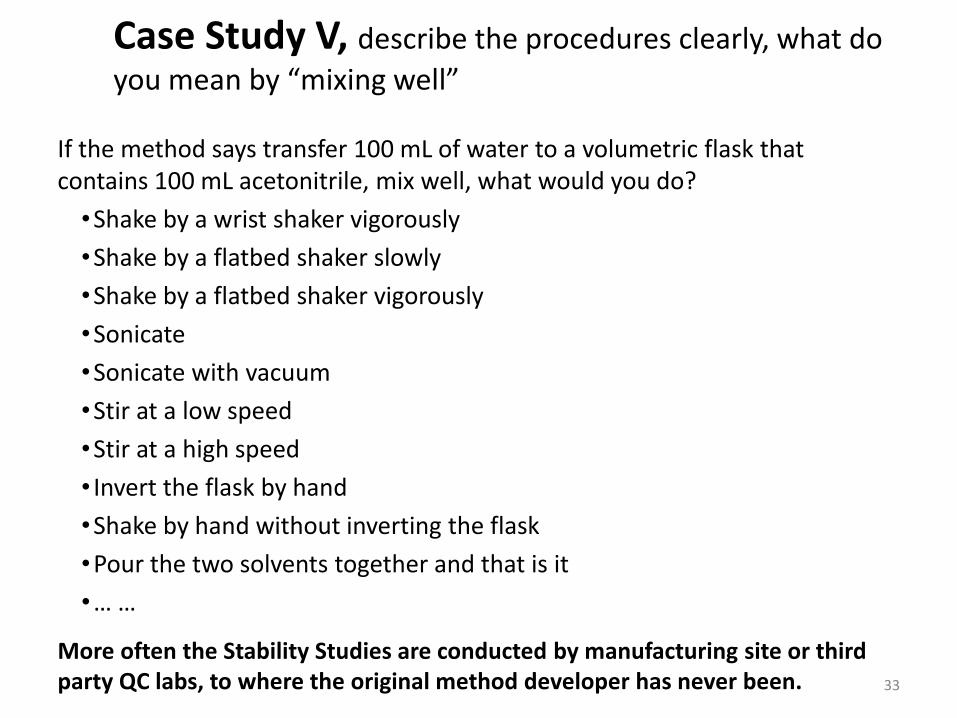
Case Study V, describe the procedures clearly, what do
you mean by “mixing well”
If the method says transfer 100 mL of water to a volumetric flask that contains 100 mL acetonitrile, mix well, what would you do?
•Shake by a wrist shaker vigorously
•Shake by a flatbed shaker slowly
•Shake by a flatbed shaker vigorously
•Sonicate
•Sonicate with vacuum
•Stir at a low speed
•Stir at a high speed
• Invert the flask by hand
•Shake by hand without inverting the flask
•Pour the two solvents together and that is it
•… …
33
More often the Stability Studies are conducted by manufacturing site or third party QC labs, to where the original method developer has never been.
Investigating OOS Test Results – Phase II: Full-Scale OOS Investigation
• This investigation consists of a production process review and/or additional laboratory work.
• The investigation should be conducted by the QCU and should involve all other departments that could be implicated, including manufacturing, process development, maintenance, and engineering.
34
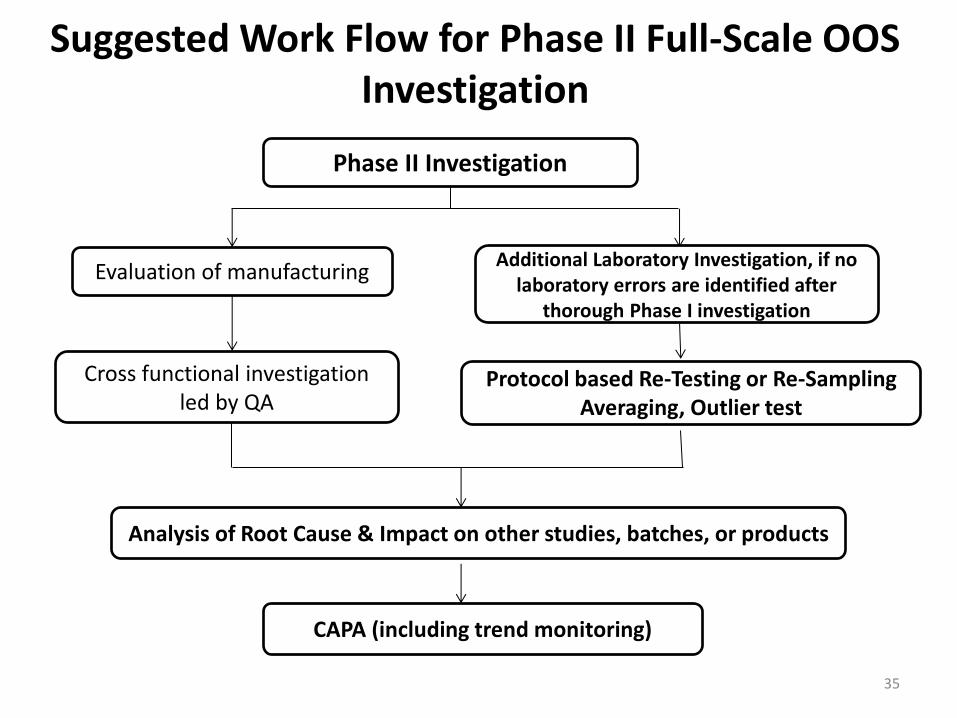
Suggested Work Flow for Phase II Full-Scale OOS Investigation
35
Phase II Investigation
Evaluation of manufacturing Additional Laboratory Investigation, if no
laboratory errors are identified after thorough Phase I investigation
Cross functional investigation led by QA
Protocol based Re-Testing or Re-Sampling Averaging, Outlier test
Analysis of Root Cause & Impact on other studies, batches, or products
CAPA (including trend monitoring)
Average Testing Results: Appropriate Uses • Averaging data can be a valid approach, depending upon the sample and its purpose. If
the sample can be assumed to be homogeneous, (i.e., an individual sample preparation designed to be homogenous), using averages can provide a more accurate result. In the case of microbiological assays, the USP prefers the use of averages because of the innate variability of the biological test system.
• A test might consist of a specific number of replicates to arrive at a result. For instance, an HPLC assay result may be determined by averaging the peak responses from a number of consecutive, replicate injections from the same preparation (usually 2 or 3). This determination is considered one test and one result. This is a distinct difference from the
analysis of different portions from a lot, intended to determine variability within the lot, and from multiple full analyses of the same homogenous sample.
• The use of replicates to arrive at a single reportable result, and the specific number of replicates used, should be specified in the written, approved test method. Acceptance limits for variability among the replicates should also be specified in the method. Unexpected variation in replicate determinations should trigger remedial action. If acceptance limits for replicate variability are not met, the test results should not be used.
• Question: why do it then?
36
Average Testing Results, Appropriate Uses, continued
• In some cases, a series of complete tests (full run-throughs of the test procedure), such as assays, are part of the test method. It may be appropriate to specify in the test method that the average of these multiple assays is considered one test and represents one reportable result. In this case, limits on acceptable variability among the individual assay results should be based on the known variability of the method and should also be specified in the test methodology. A set of assay results not meeting these limits should not be used.
• These appropriate uses of averaging test data should be used during an OOS investigation only if they were used during the original testing that produced the OOS result.
37
Average Testing Results, Inappropriate Uses
• In the context of additional testing performed during an OOS investigation, averaging the result(s) of the original test that prompted the investigation and additional retest or resample results obtained during the OOS investigation is not appropriate because it hides variability among the individual results. Relying on averages of such data can be particularly misleading when some of the results are OOS and others are within specifications. It is critical that the laboratory provide all individual results for evaluation and consideration by the QCU, which is responsible for approving or rejecting, e.g., drug products, in-process materials.
• Averaging cannot be used in cases when testing is intended to measure variability within the product, such as powder blend/mixture uniformity or dosage form content uniformity.
38
Outlier Tests
The CGMP regulations require that statistically valid quality control criteria include appropriate acceptance and/or rejection levels. On rare occasions, a value may be obtained that is markedly different from the others in a series obtained using a validated method. Such a value may qualify as a statistical outlier. An outlier may result from a deviation from prescribed test methods, or it may be the result of variability in the sample. It should never be assumed that the reason for an outlier is error in the testing procedure, rather than inherent variability in the sample being tested.
Outlier testing is a statistical procedure for identifying from an array those data that are extreme. The possible use of outlier tests should be determined in advance. This should be written into SOPs for data interpretation and be well documented. The SOPs should include the specific outlier test to be applied with relevant parameters specified in advance. The SOPs should specify the minimum number of results required to obtain a statistically significant assessment from the specified outlier test.
For validated chemical tests with relatively small variance, and if the sample being tested can be considered homogeneous (for example, an assay of a composite of a dosage form drug to determine strength), an outlier test is only a statistical analysis of the data obtained from testing and retesting. It will not identify the cause of an extreme observation and, therefore, should not be used to invalidate the suspect results.
So, in short, why bother… …
39
What If Nothing Is Wrong, Except the OOS Result, that is
• It is noteworthy in this scenario that the original, thorough laboratory investigation failed to find any assignable cause. However, if subsequent investigation nonetheless concludes that the source of the OOS result was a cause unrelated to the manufacturing process, in response to this atypical failure to detect the laboratory deviation, it is essential that the investigation include appropriate follow-up and scrutiny to prevent recurrence of the laboratory error(s) that could have led to the OOS result.
• Any decision to release a batch, in spite of an initial OOS result that has not been invalidated, should come only after a full investigation has shown that the OOS result does not reflect the quality of the batch. In making such a decision, the QCU should always err on the side of caution.
40
Case Study VI, sometimes things happen and all you can
do is, slowdown
• More than a few dozen samples were tested for dissolution in one day by one analyst, from the good intention to complete the work in a timely fashion.
• From those samples, a 200% dissolution result was obtained.
• Weighing sheets did not indicate an extra tablet was weighed.
• There was no 0% dissolution in any other vessels.
• No memory that the vessel was filled to exactly half volume.
• Dissolution vessels were cleaned and re-used during sample testing.
• … …
• No need for outlier testing, it is obvious.
• What CAPA can be placed?
41
See what you can do when you are in a rush and tired.
Wondering what can you do after the fact?
Conduct Re-testing, example considerations
• Wherever possible and meaningful, the re-testing is conducted by a second analyst.
• At least two (2) but no more than nine (9) complete re-tests should be performed with the exception of dissolution testing, in which case, a 6-vessel dissolution producing one reportable result is considered sufficient/acceptable.
• If any or all analytical values from re-testing do not comply with the specification, then the original OOS result is confirmed.
42
Conduct Re-testing, example considerations, continued
When all analytical values from retesting are within the specification:
• If all analytical values from retesting are well within the specification limit the original OOS/OOT result will be invalidated and the final reportable value will be obtained according to the testing protocol (e.g., mean of all results from the retesting).
• If all analytical values from retesting are within, but near the specification limit (i.e., “border-line pass”), rigorous assessment and cautious consideration must be given by QA in the final disposition of the product/material in question.
43
Responsibilities of the Laboratory Supervisor, during Phase II
• Besides conducting additional laboratory investigation such as create/approve/execute retesting protocols, as part of an effective quality system, a firm’s upper management should appropriately monitor these trends and ensure that any problematic areas are addressed.
• Laboratory error should be relatively rare. Frequent errors suggest a problem that might be due to inadequate training of analysts, poorly maintained or improperly calibrated equipment, or careless work. Whenever laboratory error is identified, the firm should determine the source of that error and take corrective action to prevent recurrence. To ensure full compliance with the CGMP regulations, the manufacturer also should maintain adequate documentation of the corrective action.
• In summary, when clear evidence of laboratory error exists, laboratory testing results should be invalidated. When evidence of laboratory error remains unclear, a full-scale OOS investigation should be conducted by the manufacturing firm to determine what caused the unexpected results. It should not be assumed that OOS test results are attributable to analytical error without performing and documenting an investigation. Both the initial laboratory assessment and the following OOS investigation should be documented fully.
44
Responsibilities, Beyond Your Own Lab
• For contract laboratories, the laboratory should convey its data, findings, and supporting documentation to the manufacturing firm’s quality control unit (QCU), who should then initiate the full-scale OOS investigation.
• When investigation by a contract laboratory does not determine an assignable cause, all test results should be reported to the customer on the certificate of analysis.
45
Recap, High Level but Important Points From FDA Guidance document
• The source of the OOS result should be identified either as an aberration of the measurement process or an aberration of the manufacturing process.
• Even if a batch is rejected based on an OOS result, the investigation is necessary to determine if the result is associated with other batches of the same drug product or other products.
• Batch rejection does not negate the need to perform the investigation.
• To be meaningful, the investigation should be thorough, timely, unbiased, well-documented, and scientifically sound.
• The regulations require that a written record of the investigation be made, including the conclusions and follow-up.
46
47
Further Investigation after Batch Rejection
• Impact on other batches or products.
• Develop and execute CAPA (corrective action and preventative action).
• The further investigation should review the completed manufacturing investigation and combined laboratory investigation into the suspect analytical results, and/or method validation for possible causes into the results obtained.
• To conclude the investigation all of the results must be evaluated.
• The investigation report should contain a summary of the investigations performed; and a detailed conclusion.
MHRA Phase III investigation
48
Further Investigation after Batch Rejection, continued
• Once a batch has been rejected there is no limit to further testing to determine the cause of failure, so that corrective action can be taken.
• The decision to reject cannot be reversed as a result of further testing.
• The impact of OOS result on other batches, on going stability studies, validated processes and testing procedures should be determined by Quality Control and Quality Assurance and be documented in the conclusion, along with appropriate corrective and preventive actions.
Case Study VII, And sometimes the OOS is really “real”
• Many over-the-counter medicinal products have a long history of use.
• The regulatory requirements are becoming more and more stringent, especially for degradation product analysis.
• When developing new OTC products, modernization of analytical methodology becomes a regulatory requirement.
• All of a sudden some degradation products are discovered, although according to the author’s experiences that the vast majority of the degradation products are determined to be safe (with a certain upper limit) based on toxicity evaluations.
• So there can be times that the decrease or variability observed in potencies of the APIs is truly associated with a degradation that is unknown by the historical methodology.
49
FDA Deficiency Letter examples
Laboratory controls are deficient in that your firm has established procedures that allow for the averaging of out-of-specification (OOS) and within-specification analytical test results from separate samples. The use of these approved procedures resulted in API batches being released to the U.S. market based on passing averaged assay results.
The inspection revealed that results for individual tests are calculated individually by the xxx system and then averaged by your firm's Laboratory Integrated Management System (LIMS). The averaged result (not individual results) is then corrected for water content, if necessary. The release specification is applied only to the averaged result and not to the individual results.
50
FDA Deficiency Letter examples
Your firm failed to conduct an adequate investigation that should have resulted in your implementation of corrective actions to prevent recurrence of the problem and evaluate other potentially affected lots.
Your firm failed to submit NDA/ANDA Field Alert Reports (FARs) within three working days of receipt of information concerning any bacteriological contamination, or any significant chemical, physical, or other change or deterioration in the distributed drug product, or any failure of one or more distributed batches of the drug product to meet the specification established for it in the application.
51
FDA Deficiency Letter examples
OOS investigations involved the stability failure after xx months. The specification was xx mg and the results were yy and zz mg for batches A and B, respectively. Both investigations concluded that the root cause of the failure was " .. .likely due to the combined inherent variability of the two assays generating the final results ... ". However, your firm did not include a scientific rationale for this conclusion. In addition, no corrective or preventive actions were included in the investigations.
… … The response is inadequate because your firm did not initiate corrective or preventive actions for the failures or perform a study to demonstrate the inherent variability of the assay.
52
FDA Deficiency Letter examples
Your firm failed to follow procedure xxx, “Corrective Action Preventive Action (CAPA) Procedure” in that you failed to open a CAPA when changes were made to your supplier control procedures as part of a continuous improvement project.
The investigation was not extended to the bulk manufacturing operations after investigations into laboratory and drug product manufacturing operations were inconclusive.
53
FDA Deficiency Letter examples
Examples of these deficiencies are included as follows: • Failure to thoroughly investigate the unexplained discrepancies or out of
specification results in batches of xxx and yyy manufactured at your site as required under 21 CFR 211.192. For example, on mm dd, yyyy, the x month stability interval assay test for xxx detected the presence of an unknown peak at high levels. The duplicate samples confirmed the presence of the peak. The same peak was detected in … (various samples),… The same unknown peaks were detected in each sample for each lot.
• On mm dd yyyy, your firm spiked a standard solution and a sample aliquot from Lot xyz with abc. Your previous investigations into various unknown peaks occurring in your drug products had identified abc as a packaging extractable originating from the ink used to print the package insert. However, the correlation between the abc and the unknown substance did not exist. as the abc peak and the unknown eluted at different times in your assay. Your Laboratory Investigation Report which was signed and approved on mm dd yyyy, concluded that the unknown peak was an artifact peak. However, on mm dd yyyy, during the FDA's inspection of your facility, and 5 months after the initial unknown peak was detected, your firm identified the unknown peak as efg, an extractable that potentially originated from the Nylon components used to pack the xxx drug product.
54

55
THANK YOU !