Embed Size (px)
Citation preview
Invested in Our Clients
2017 Barclays Global Financial Services Conference
September 11, 2017
1 2017 Barclays Global Financial Services Conference
• A number of statements in the accompanying slides and the responses to your questions are “forward-looking statements.” Words such as “estimate”, “forecast”, “project”, “anticipate”, “target”, “expect”, “intend”, “continue”, “seek”, “believe”, “plan”, “goal”, “could”, “should”, “may”, “will”, “strategy”, “opportunities”, “trends” and words of similar meaning signify forward-looking statements. These statements relate to, among other things, The Bank of New York Mellon Corporation’s (the “Corporation”) expectations regarding: capital plans, strategic priorities, financial goals, client experience, driving revenue growth, the business improvement process, estimated capital ratios and expectations regarding those ratios, preliminary business metrics; and statements regarding the Corporation's aspirations, as well as the Corporation’s overall plans, strategies, goals, objectives, expectations, estimates, intentions, targets, opportunities and initiatives. These forward-looking statements are based on assumptions that involve risks and uncertainties and that are subject to change based on various important factors (some of which are beyond the Corporation’s control).
• Actual outcomes may differ materially from those expressed or implied as a result of the factors described under “Forward Looking Statements” and “Risk Factors” in
the Corporation’s Annual Report on Form 10-K for the year ended December 31, 2016 (the “2016 Annual Report”) and Quarterly Report on Form 10-Q for the quarter
ended March 31, 2017 (the “1Q17 Form 10-Q”), and Quarterly Report on Form 10-Q for the quarter ended June 30, 2017 (the “2Q17 Form 10-Q”), and in other filings
of the Corporation with the Securities and Exchange Commission (the “SEC”). Such forward-looking statements speak only as of September 11, 2017, and the
Corporation undertakes no obligation to update any forward-looking statement to reflect events or circumstances after that date or to reflect the occurrence of
unanticipated events. For additional information regarding the Corporation, please refer to the Corporation's SEC filings available at
www.bnymellon.com/investorrelations.
• Non-GAAP Measures: In this presentation we may discuss some non-GAAP measures in detailing the Corporation’s performance, which exclude certain items or
otherwise include components that differ from GAAP. We believe these measures are useful to the investment community in analyzing the financial results and trends
of ongoing operations. We believe they facilitate comparisons with prior periods and reflect the principal basis on which our management monitors financial
performance. Additional disclosures relating to non-GAAP measures are contained in the Corporation’s reports filed with the SEC, including the 2016 Annual Report,
the 1Q17 Form 10-Q and the 2Q17 Form 10-Q, available at www.bnymellon.com/investorrelations.
Cautionary Statement
NOTE: All financial data for the Corporation throughout the presentation is as of June 30, 2017 unless otherwise noted.

2 2017 Barclays Global Financial Services Conference
Full range of institutional services, clearance, cash management and global payments services Institutional and retail
investment management
Wealth management for
individuals and families
$31.1 trillion AUC/A 6+ million
World’s largest custodian Average active clearing accounts (U.S. platform)
$2.5 trillion $481 billion
Average tri-party repo balances Average long-term mutual fund assets (U.S. platform)
$1.8 trillion AUM
6th Largest asset manager
4th largest
Institutional money manager
>$200 billion
Total private client assets
8th largest
U.S wealth manager
BNY Mellon
Focused on investing and servicing assets
Key Advantages:
• Diversified business model with stable recurring
revenue base
• Scale
• Low credit risk
• Significant capital generation
NOTE: Revenue and pre-tax income metrics for Investment Services and Investment Management reflect the last twelve months as of June 30, 2017. 1 Adjusted pre-tax income is a non-GAAP measure and excludes the impact of amortization of intangible assets. See Appendix for a reconciliation and additional disclosure regarding rankings.
Investment Services
$11.3B Revenue
$4.0B Pre-tax Income1
Investment Management
$3.9B Revenue
$1.2B Pre-tax Income1
Delivering Expertise and Scale Benefits at Each Stage of the Investment Lifecycle
3 2017 Barclays Global Financial Services Conference
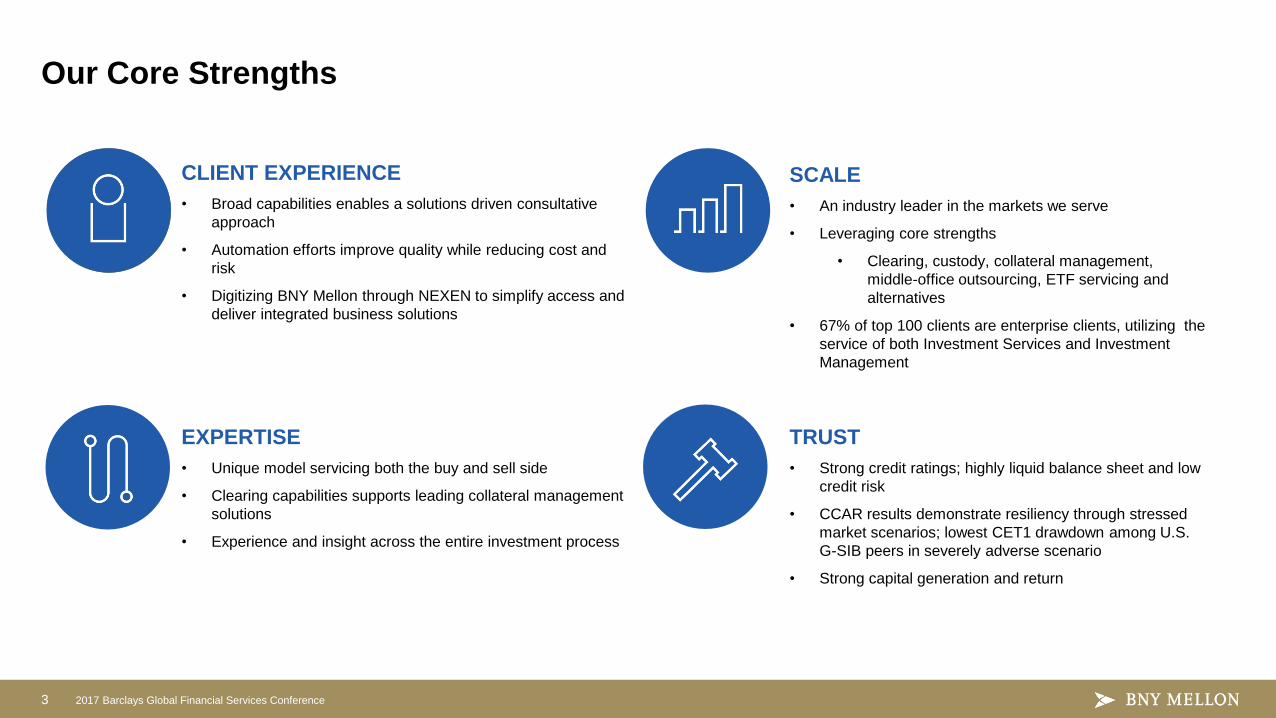
CLIENT EXPERIENCE
• Broad capabilities enables a solutions driven consultative
approach
• Automation efforts improve quality while reducing cost and
risk
• Digitizing BNY Mellon through NEXEN to simplify access and
deliver integrated business solutions
EXPERTISE
• Unique model servicing both the buy and sell side
• Clearing capabilities supports leading collateral management
solutions
• Experience and insight across the entire investment process
SCALE
• An industry leader in the markets we serve
• Leveraging core strengths
• Clearing, custody, collateral management,
middle-office outsourcing, ETF servicing and
alternatives
• 67% of top 100 clients are enterprise clients, utilizing the
service of both Investment Services and Investment
Management
TRUST
• Strong credit ratings; highly liquid balance sheet and low
credit risk
• CCAR results demonstrate resiliency through stressed
market scenarios; lowest CET1 drawdown among U.S.
G-SIB peers in severely adverse scenario
• Strong capital generation and return
Our Core Strengths
4 2017 Barclays Global Financial Services Conference
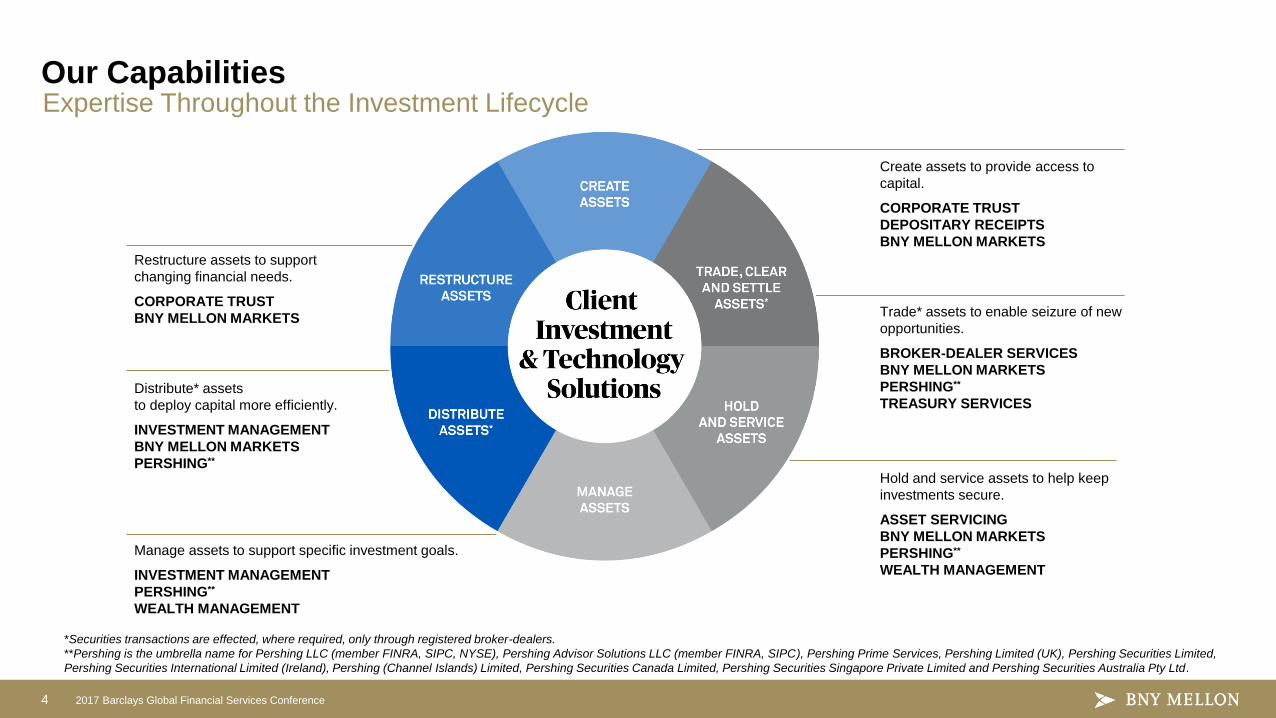
*Securities transactions are effected, where required, only through registered broker-dealers.
**Pershing is the umbrella name for Pershing LLC (member FINRA, SIPC, NYSE), Pershing Advisor Solutions LLC (member FINRA, SIPC), Pershing Prime Services, Pershing Limited (UK), Pershing Securities Limited,
Pershing Securities International Limited (Ireland), Pershing (Channel Islands) Limited, Pershing Securities Canada Limited, Pershing Securities Singapore Private Limited and Pershing Securities Australia Pty Ltd.
Expertise Throughout the Investment Lifecycle Our Capabilities
Restructure assets to support
changing financial needs.
CORPORATE TRUST
BNY MELLON MARKETS
Distribute* assets
to deploy capital more efficiently.
INVESTMENT MANAGEMENT
BNY MELLON MARKETS
PERSHING**
Manage assets to support specific investment goals.
INVESTMENT MANAGEMENT
PERSHING**
WEALTH MANAGEMENT
Create assets to provide access to
capital.
CORPORATE TRUST
DEPOSITARY RECEIPTS
BNY MELLON MARKETS
Trade* assets to enable seizure of new
opportunities.
BROKER-DEALER SERVICES
BNY MELLON MARKETS
PERSHING**
TREASURY SERVICES
Hold and service assets to help keep
investments secure.
ASSET SERVICING
BNY MELLON MARKETS
PERSHING**
WEALTH MANAGEMENT
5 2017 Barclays Global Financial Services Conference
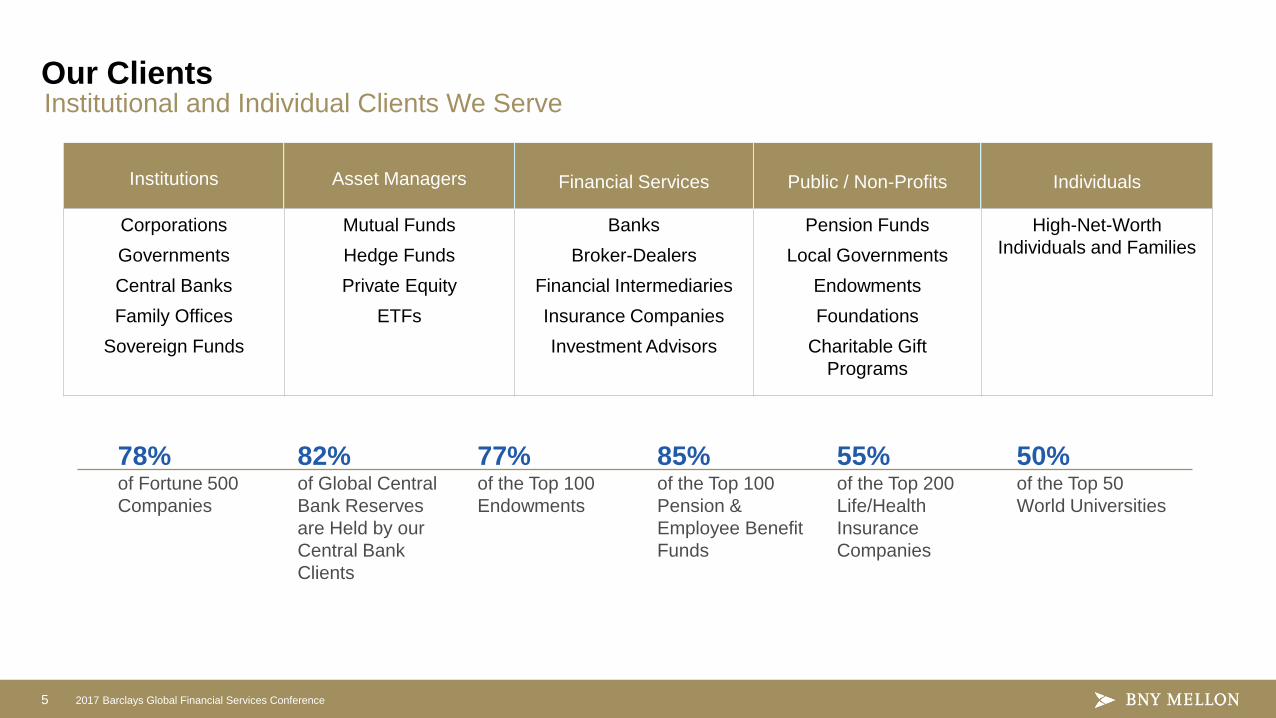
Institutional and Individual Clients We Serve
Institutions
Asset Managers
Financial Services
Public / Non-Profits
Individuals
Corporations
Governments
Central Banks
Family Offices
Sovereign Funds
Mutual Funds
Hedge Funds
Private Equity
ETFs
Banks
Broker-Dealers
Financial Intermediaries
Insurance Companies
Investment Advisors
Pension Funds
Local Governments
Endowments
Foundations
Charitable Gift
Programs
High-Net-Worth
Individuals and Families
78% of Fortune 500
Companies
82% of Global Central
Bank Reserves
are Held by our
Central Bank
Clients
77% of the Top 100
Endowments
85% of the Top 100
Pension &
Employee Benefit
Funds
55% of the Top 200
Life/Health
Insurance
Companies
50% of the Top 50
World Universities
Why Clients Choose BNY Mellon
Sophisticated and comprehensive range of investment capabilities and financial services
Servicing all investor needs along the investment lifecycle
Collaborative relationships with clients to design solutions to meet needs
Our Clients
6 2017 Barclays Global Financial Services Conference
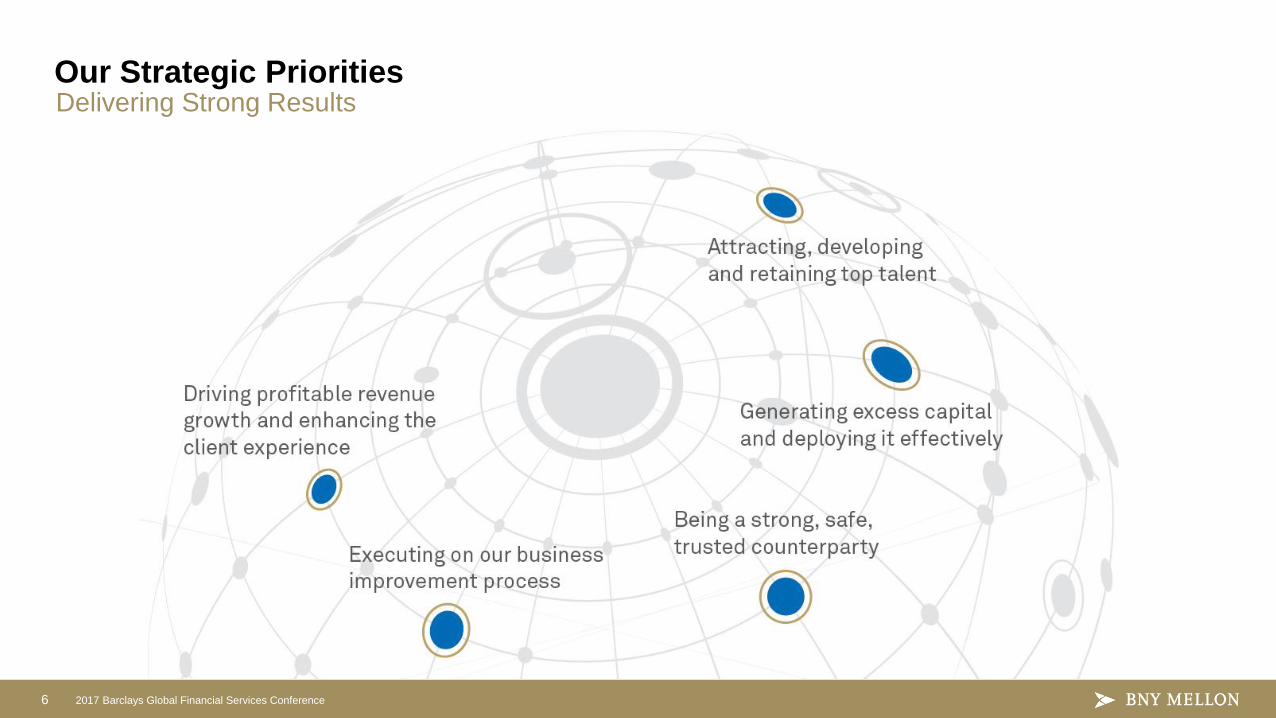
Delivering Strong Results Our Strategic Priorities
7 2017 Barclays Global Financial Services Conference
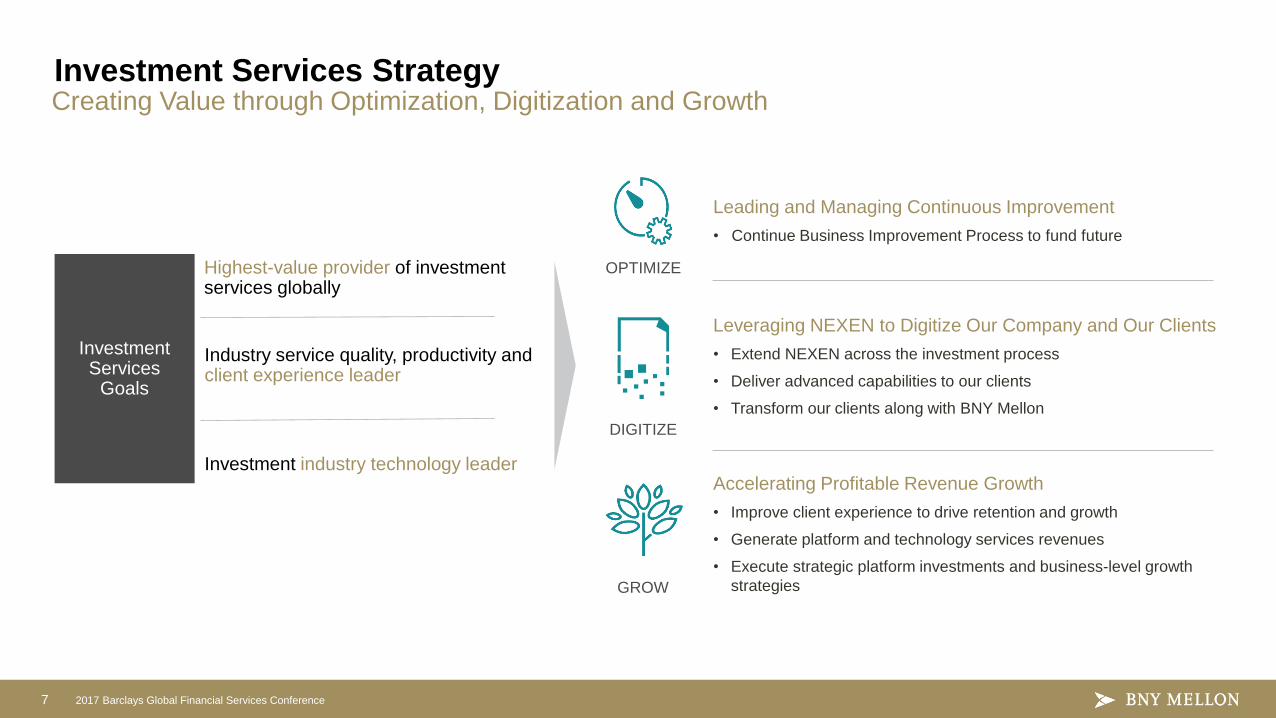
Leading and Managing Continuous Improvement
• Continue Business Improvement Process to fund future
Leveraging NEXEN to Digitize Our Company and Our Clients
• Extend NEXEN across the investment process
• Deliver advanced capabilities to our clients
• Transform our clients along with BNY Mellon
Accelerating Profitable Revenue Growth
• Improve client experience to drive retention and growth
• Generate platform and technology services revenues
• Execute strategic platform investments and business-level growth
strategies
Highest-value provider of investment services globally
Industry service quality, productivity and client experience leader
Investment industry technology leader
Investment Services
Goals
OPTIMIZE
GROW
DIGITIZE
Investment Services Strategy Creating Value through Optimization, Digitization and Growth
8 2017 Barclays Global Financial Services Conference
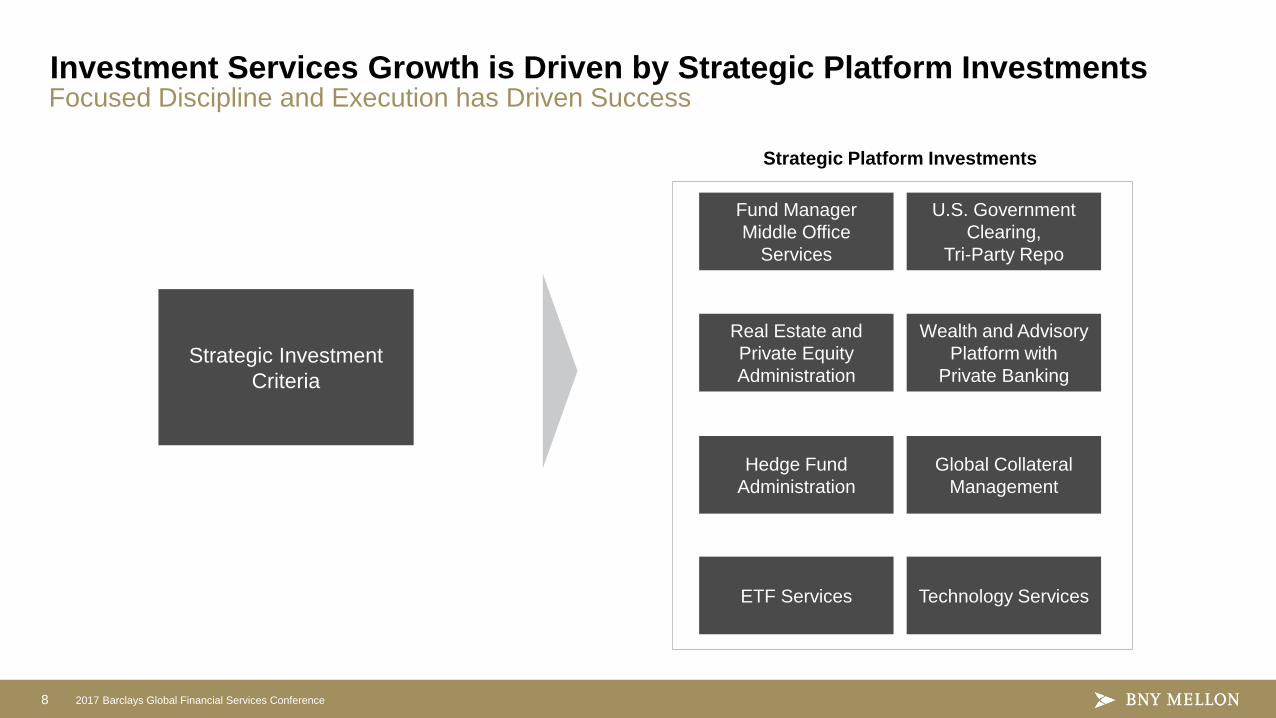
Strategic Platform Investments
Fund Manager
Middle Office
Services
U.S. Government
Clearing,
Tri-Party Repo
Real Estate and
Private Equity
Administration
Wealth and Advisory
Platform with
Private Banking
Hedge Fund
Administration
Global Collateral
Management
ETF Services Technology Services
Focused Discipline and Execution has Driven Success
Strategic Investment
Criteria
Investment Services Growth is Driven by Strategic Platform Investments
9 2017 Barclays Global Financial Services Conference
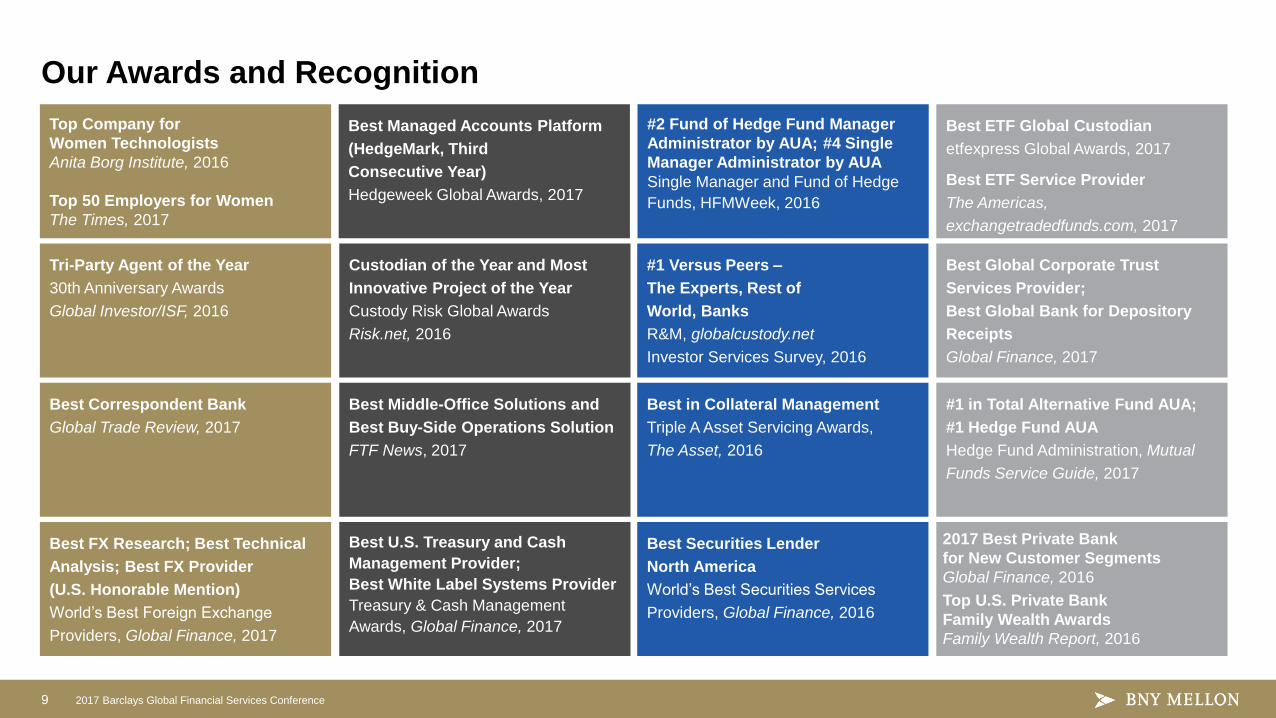
Top Company for
Women Technologists
Anita Borg Institute, 2016
Top 50 Employers for Women
The Times, 2017
Best Managed Accounts Platform
(HedgeMark, Third
Consecutive Year)
Hedgeweek Global Awards, 2017
#2 Fund of Hedge Fund Manager
Administrator by AUA; #4 Single
Manager Administrator by AUA
Single Manager and Fund of Hedge
Funds, HFMWeek, 2016
Best ETF Global Custodian
etfexpress Global Awards, 2017
Best ETF Service Provider
The Americas,
exchangetradedfunds.com, 2017
Tri-Party Agent of the Year
30th Anniversary Awards
Global Investor/ISF, 2016
Custodian of the Year and Most
Innovative Project of the Year
Custody Risk Global Awards
Risk.net, 2016
#1 Versus Peers –
The Experts, Rest of
World, Banks
R&M, globalcustody.net
Investor Services Survey, 2016
Best Global Corporate Trust
Services Provider;
Best Global Bank for Depository
Receipts
Global Finance, 2017
Best Correspondent Bank
Global Trade Review, 2017
Best Middle-Office Solutions and
Best Buy-Side Operations Solution
FTF News, 2017
Best in Collateral Management
Triple A Asset Servicing Awards,
The Asset, 2016
#1 in Total Alternative Fund AUA;
#1 Hedge Fund AUA
Hedge Fund Administration, Mutual
Funds Service Guide, 2017
Best FX Research; Best Technical
Analysis; Best FX Provider
(U.S. Honorable Mention)
World’s Best Foreign Exchange
Providers, Global Finance, 2017
Best U.S. Treasury and Cash
Management Provider;
Best White Label Systems Provider
Treasury & Cash Management
Awards, Global Finance, 2017
Best Securities Lender
North America
World’s Best Securities Services
Providers, Global Finance, 2016
Our Awards and Recognition
2017 Best Private Bank
for New Customer Segments
Global Finance, 2016
Top U.S. Private Bank
Family Wealth Awards
Family Wealth Report, 2016
10 2017 Barclays Global Financial Services Conference
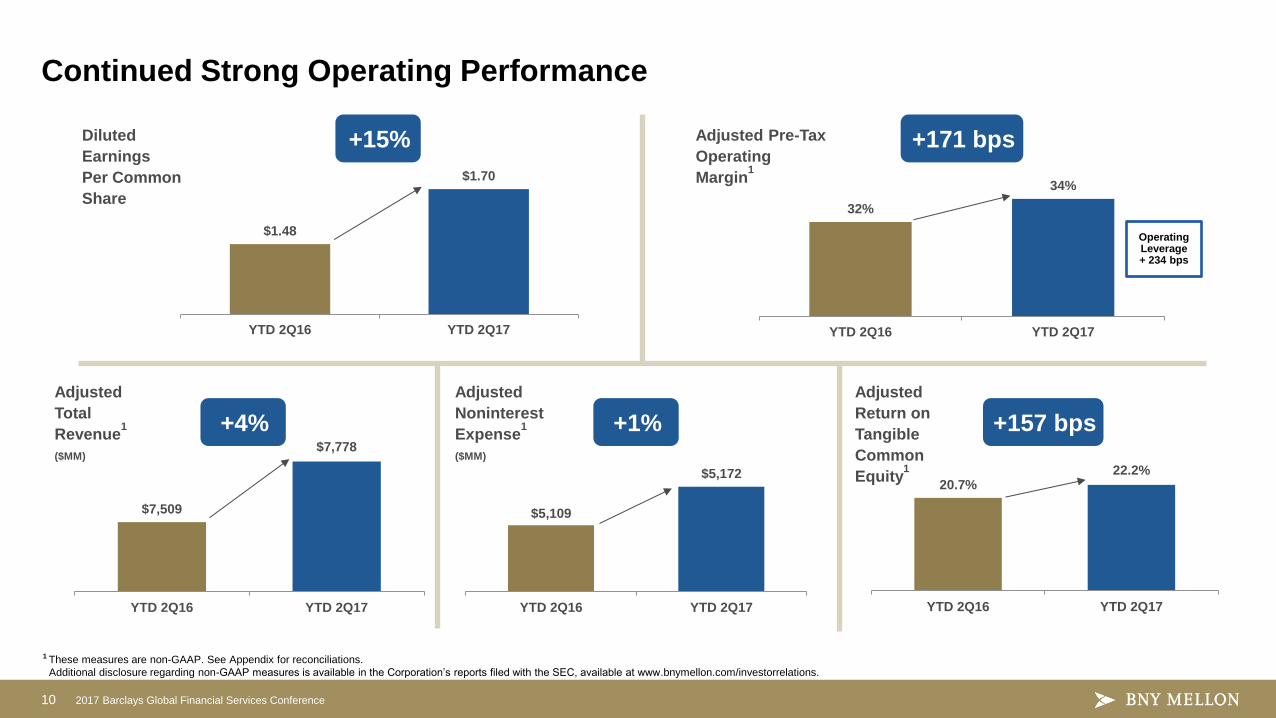
Continued Strong Operating Performance
1 These measures are non-GAAP. See Appendix for reconciliations.
Additional disclosure regarding non-GAAP measures is available in the Corporation’s reports filed with the SEC, available at www.bnymellon.com/investorrelations.
32%
34%
YTD 2Q16 YTD 2Q17
$1.48
$1.70
YTD 2Q16 YTD 2Q17
Diluted
Earnings
Per Common
Share
Adjusted Pre-Tax
Operating
Margin1
+15% +171 bps
20.7% 22.2%
YTD 2Q16 YTD 2Q17
Adjusted
Return on
Tangible
Common
Equity1
+157 bps
$5,109
$5,172
YTD 2Q16 YTD 2Q17
Adjusted
Noninterest
Expense1
($MM)
+1%
Operating Leverage + 234 bps
$7,509
$7,778
YTD 2Q16 YTD 2Q17
Adjusted
Total
Revenue1
($MM)
+4%
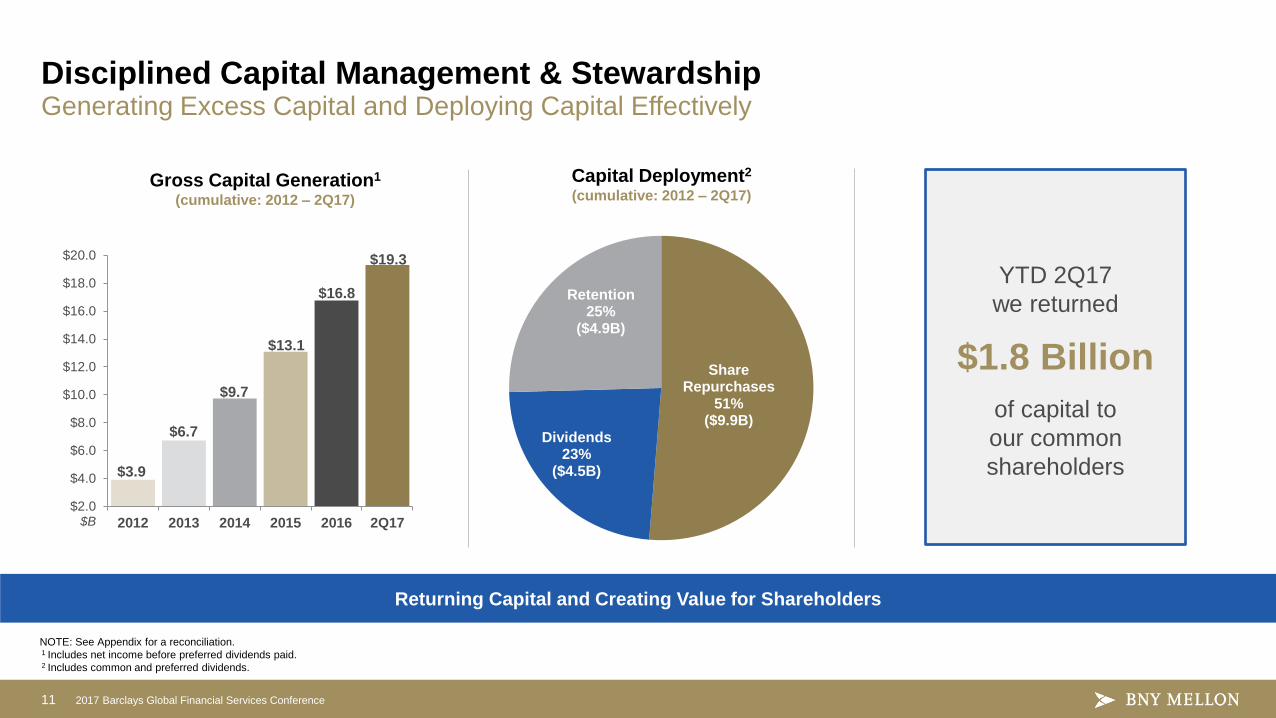
11 2017 Barclays Global Financial Services Conference
$3.9
$6.7
$9.7
$13.1
$16.8
$19.3
$2.0
$4.0
$6.0
$8.0
$10.0
$12.0
$14.0
$16.0
$18.0
$20.0
2012 2013 2014 2015 2016 2Q17
Share Repurchases
51% ($9.9B)
Dividends 23%
($4.5B)
Retention 25%
($4.9B)
Disciplined Capital Management & Stewardship
NOTE: See Appendix for a reconciliation. 1 Includes net income before preferred dividends paid. 2 Includes common and preferred dividends.
Capital Deployment2
(cumulative: 2012 – 2Q17) Gross Capital Generation1
(cumulative: 2012 – 2Q17)
$B
Returning Capital and Creating Value for Shareholders
YTD 2Q17
we returned
$1.8 Billion
of capital to
our common
shareholders
Generating Excess Capital and Deploying Capital Effectively
12 2017 Barclays Global Financial Services Conference
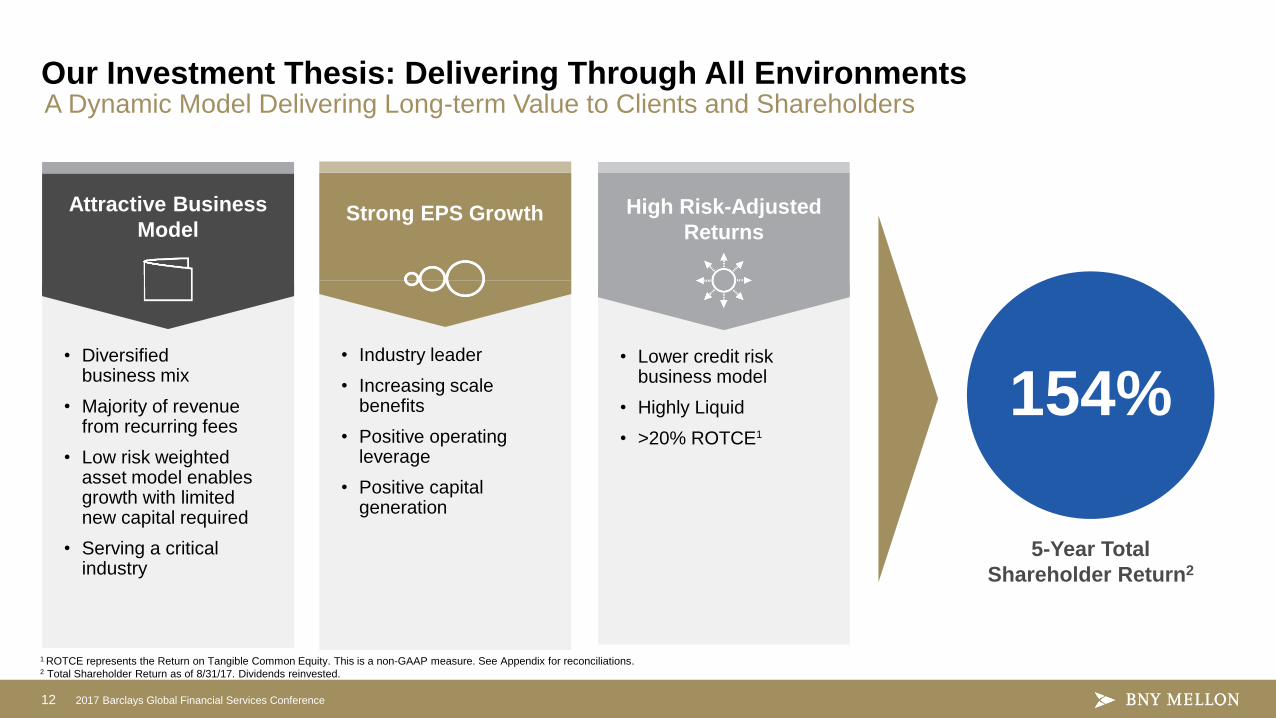
Our Investment Thesis: Delivering Through All Environments
Strong EPS Growth
• Industry leader
• Increasing scale benefits
• Positive operating leverage
• Positive capital generation
Attractive Business
Model
• Diversified business mix
• Majority of revenue from recurring fees
• Low risk weighted asset model enables growth with limited new capital required
• Serving a critical industry
High Risk-Adjusted
Returns
• Lower credit risk business model
• Highly Liquid
• >20% ROTCE1
A Dynamic Model Delivering Long-term Value to Clients and Shareholders
5-Year Total
Shareholder Return2
154%
1 ROTCE represents the Return on Tangible Common Equity. This is a non-GAAP measure. See Appendix for reconciliations. 2 Total Shareholder Return as of 8/31/17. Dividends reinvested.
Appendix
14 2017 Barclays Global Financial Services Conference
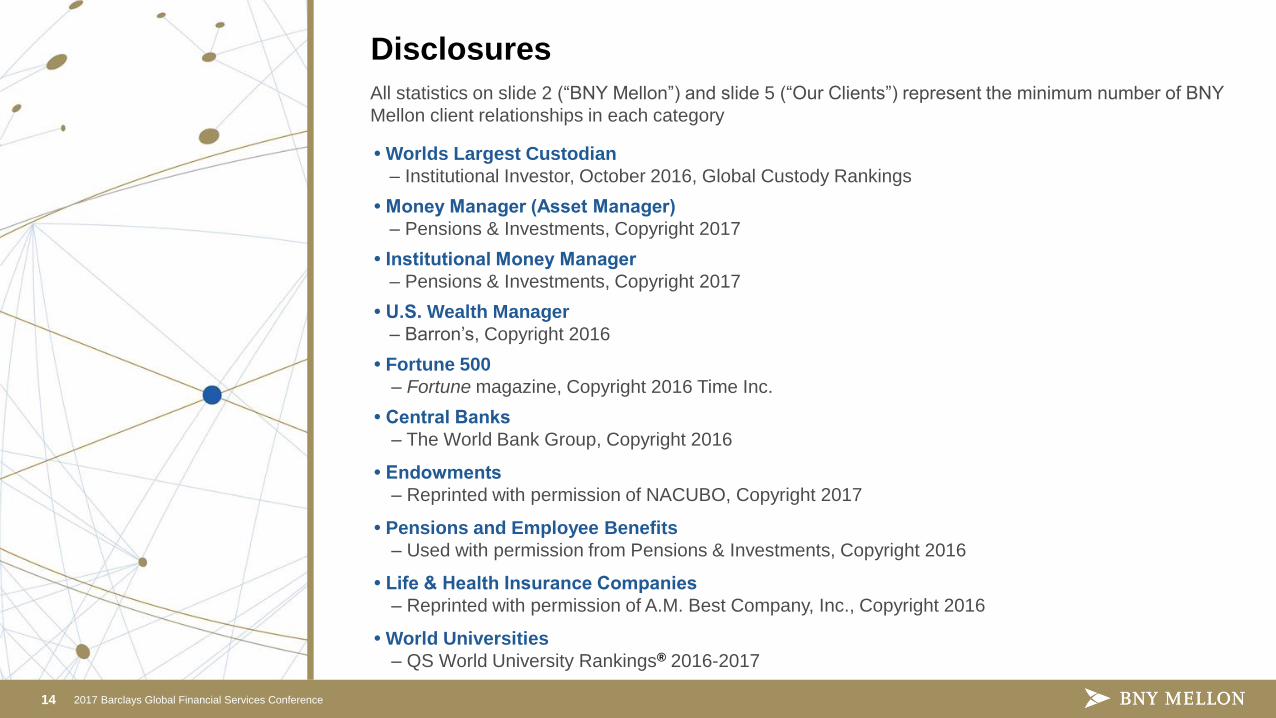
All statistics on slide 2 (“BNY Mellon”) and slide 5 (“Our Clients”) represent the minimum number of BNY
Mellon client relationships in each category
• Worlds Largest Custodian
– Institutional Investor, October 2016, Global Custody Rankings
• Money Manager (Asset Manager)
– Pensions & Investments, Copyright 2017
• Institutional Money Manager
– Pensions & Investments, Copyright 2017
• U.S. Wealth Manager
– Barron’s, Copyright 2016
• Fortune 500
– Fortune magazine, Copyright 2016 Time Inc.
• Central Banks
– The World Bank Group, Copyright 2016
• Endowments
– Reprinted with permission of NACUBO, Copyright 2017
• Pensions and Employee Benefits
– Used with permission from Pensions & Investments, Copyright 2016
• Life & Health Insurance Companies
– Reprinted with permission of A.M. Best Company, Inc., Copyright 2016
• World Universities
– QS World University Rankings® 2016-2017
Disclosures
15 2017 Barclays Global Financial Services Conference
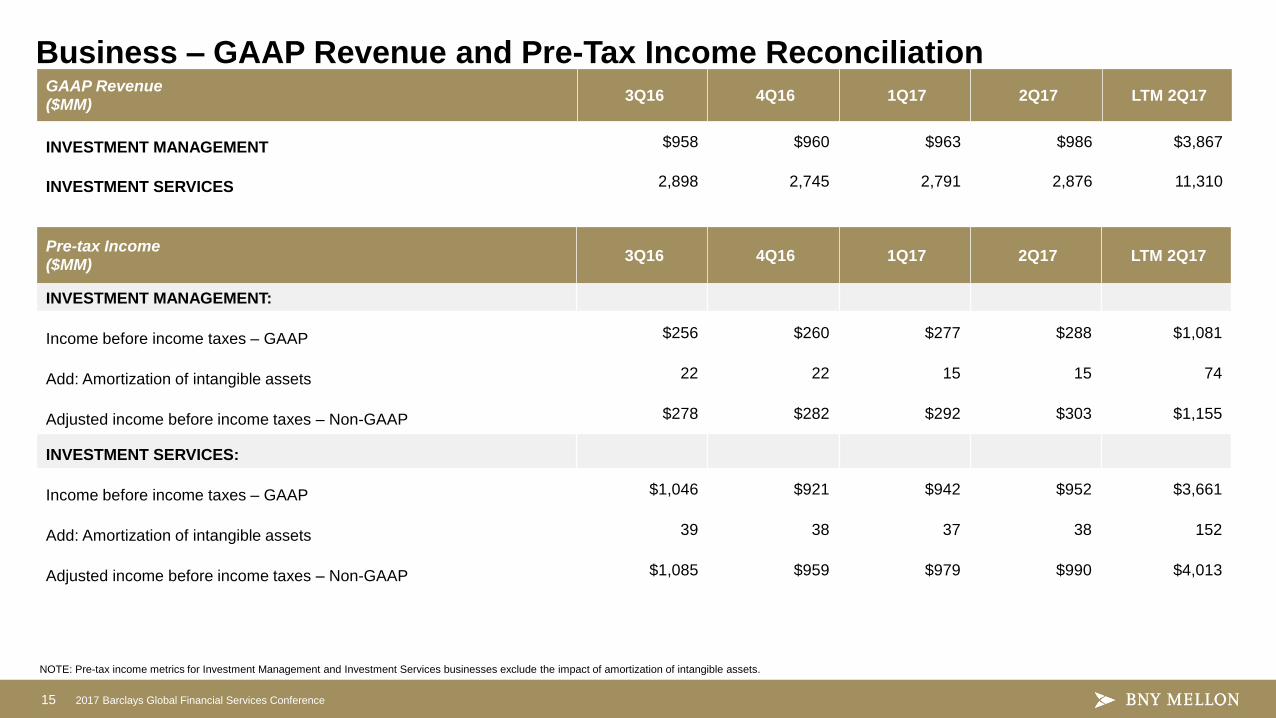
Business – GAAP Revenue and Pre-Tax Income Reconciliation
NOTE: Pre-tax income metrics for Investment Management and Investment Services businesses exclude the impact of amortization of intangible assets.
Pre-tax Income ($MM)
3Q16 4Q16 1Q17 2Q17 LTM 2Q17
INVESTMENT MANAGEMENT:
Income before income taxes – GAAP $256 $260 $277 $288 $1,081
Add: Amortization of intangible assets 22 22 15 15 74
Adjusted income before income taxes – Non-GAAP $278 $282 $292 $303 $1,155
INVESTMENT SERVICES:
Income before income taxes – GAAP $1,046 $921 $942 $952 $3,661
Add: Amortization of intangible assets 39 38 37 38 152
Adjusted income before income taxes – Non-GAAP $1,085 $959 $979 $990 $4,013
GAAP Revenue ($MM)
3Q16 4Q16 1Q17 2Q17 LTM 2Q17
INVESTMENT MANAGEMENT $958 $960 $963 $986 $3,867
INVESTMENT SERVICES 2,898 2,745 2,791 2,876 11,310
16 2017 Barclays Global Financial Services Conference
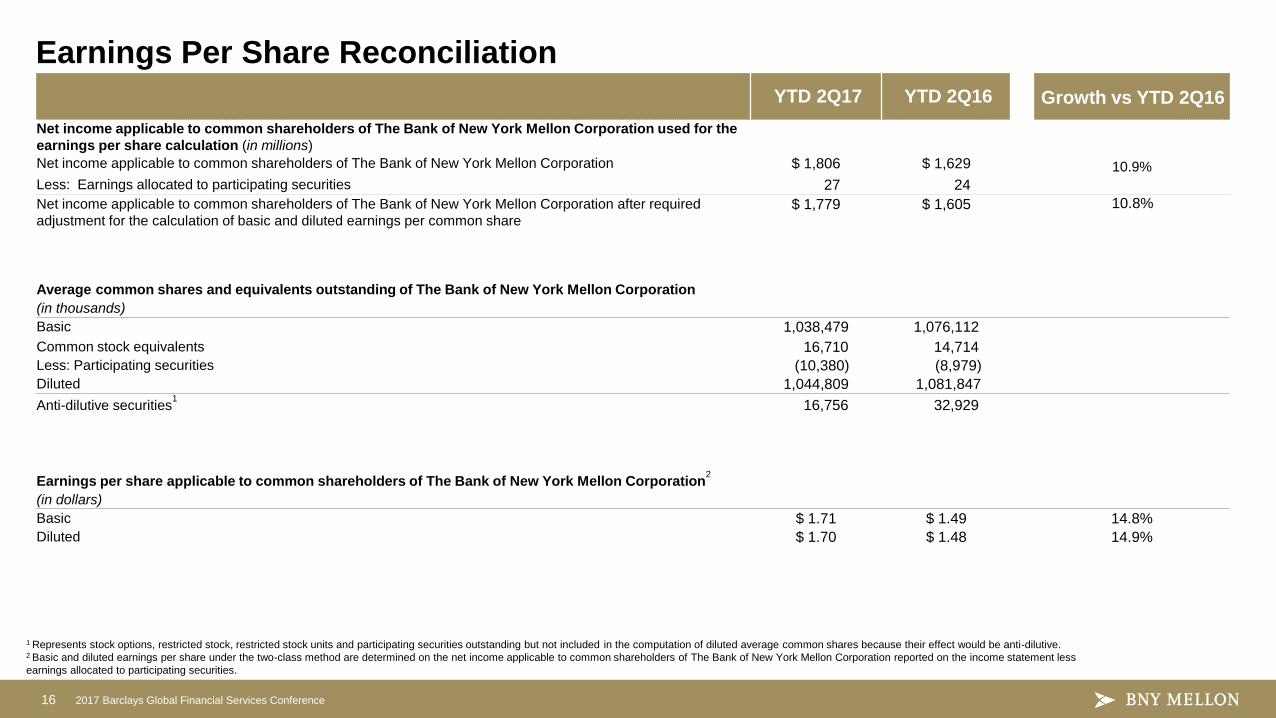
YTD 2Q17 YTD 2Q16 Growth vs YTD 2Q16
Net income applicable to common shareholders of The Bank of New York Mellon Corporation used for the
earnings per share calculation (in millions)
Net income applicable to common shareholders of The Bank of New York Mellon Corporation $ 1,806 $ 1,629 10.9%
Less: Earnings allocated to participating securities 27 24
Net income applicable to common shareholders of The Bank of New York Mellon Corporation after required
adjustment for the calculation of basic and diluted earnings per common share $ 1,779 $ 1,605 10.8%
Average common shares and equivalents outstanding of The Bank of New York Mellon Corporation
(in thousands)
Basic 1,038,479 1,076,112
Common stock equivalents 16,710 14,714
Less: Participating securities (10,380) (8,979)
Diluted 1,044,809 1,081,847
Anti-dilutive securities1
16,756 32,929
Earnings per share applicable to common shareholders of The Bank of New York Mellon Corporation2
(in dollars)
Basic $ 1.71 $ 1.49 14.8%
Diluted $ 1.70 $ 1.48 14.9%
N/A – Not applicable. 1 Represents stock options, restricted stock, restricted stock units and participating securities outstanding but not included in the computation of diluted average common shares because their effect would be anti-dilutive. 2 Basic and diluted earnings per share under the two-class method are determined on the net income applicable to common shareholders of The Bank of New York Mellon Corporation reported on the income statement less
earnings allocated to participating securities.
Earnings Per Share Reconciliation
17 2017 Barclays Global Financial Services Conference
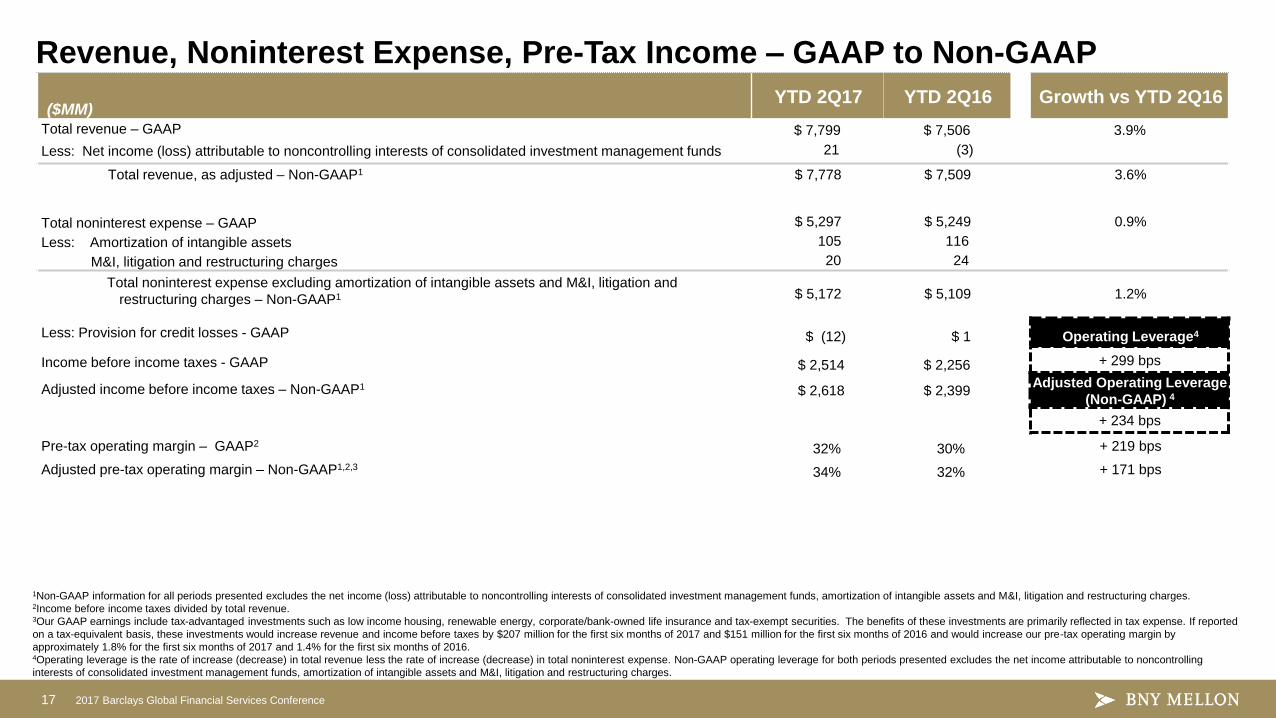
($MM) YTD 2Q17 YTD 2Q16 Growth vs YTD 2Q16
Total revenue – GAAP $ 7,799 $ 7,506 3.9%
Less: Net income (loss) attributable to noncontrolling interests of consolidated investment management funds 21 (3)
Total revenue, as adjusted – Non-GAAP1 $ 7,778 $ 7,509 3.6%
Total noninterest expense – GAAP $ 5,297 $ 5,249 0.9%
Less: Amortization of intangible assets 105 116
M&I, litigation and restructuring charges 20 24
Total noninterest expense excluding amortization of intangible assets and M&I, litigation and
restructuring charges – Non-GAAP1
$ 5,172 $ 5,109 1.2%
Less: Provision for credit losses - GAAP $ (12) $ 1 Operating Leverage4
Income before income taxes - GAAP $ 2,514 $ 2,256 + 299 bps
Adjusted income before income taxes – Non-GAAP1 $ 2,618 $ 2,399 Adjusted Operating Leverage
(Non-GAAP) 4
+ 234 bps
Pre-tax operating margin – GAAP2 32% 30% + 219 bps
Adjusted pre-tax operating margin – Non-GAAP1,2,3 34% 32% + 171 bps
1Non-GAAP information for all periods presented excludes the net income (loss) attributable to noncontrolling interests of consolidated investment management funds, amortization of intangible assets and M&I, litigation and restructuring charges. 2Income before income taxes divided by total revenue. 3Our GAAP earnings include tax-advantaged investments such as low income housing, renewable energy, corporate/bank-owned life insurance and tax-exempt securities. The benefits of these investments are primarily reflected in tax expense. If reported
on a tax-equivalent basis, these investments would increase revenue and income before taxes by $207 million for the first six months of 2017 and $151 million for the first six months of 2016 and would increase our pre-tax operating margin by
approximately 1.8% for the first six months of 2017 and 1.4% for the first six months of 2016. 4Operating leverage is the rate of increase (decrease) in total revenue less the rate of increase (decrease) in total noninterest expense. Non-GAAP operating leverage for both periods presented excludes the net income attributable to noncontrolling
interests of consolidated investment management funds, amortization of intangible assets and M&I, litigation and restructuring charges.
Revenue, Noninterest Expense, Pre-Tax Income – GAAP to Non-GAAP
18 2017 Barclays Global Financial Services Conference
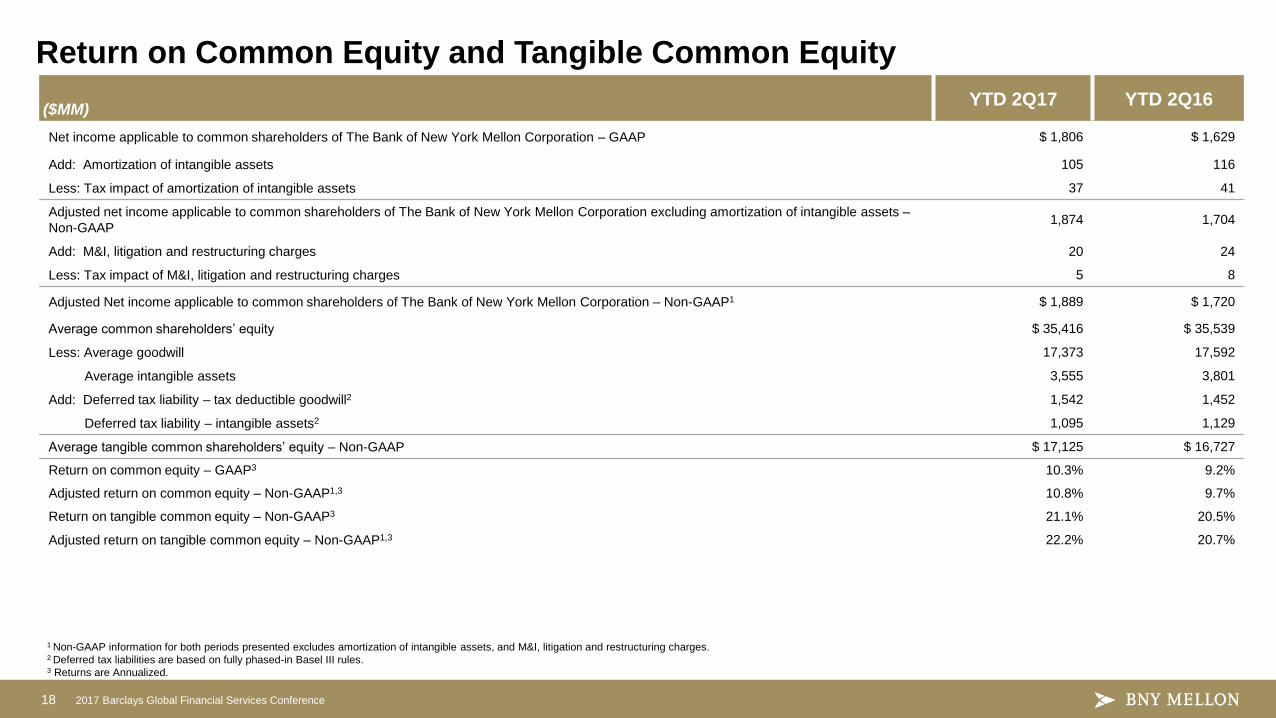
($MM) YTD 2Q17 YTD 2Q16
Net income applicable to common shareholders of The Bank of New York Mellon Corporation – GAAP $ 1,806 $ 1,629
Add: Amortization of intangible assets 105 116
Less: Tax impact of amortization of intangible assets 37 41
Adjusted net income applicable to common shareholders of The Bank of New York Mellon Corporation excluding amortization of intangible assets –
Non-GAAP 1,874 1,704
Add: M&I, litigation and restructuring charges 20 24
Less: Tax impact of M&I, litigation and restructuring charges 5 8
Adjusted Net income applicable to common shareholders of The Bank of New York Mellon Corporation – Non-GAAP1 $ 1,889 $ 1,720
Average common shareholders’ equity $ 35,416 $ 35,539
Less: Average goodwill 17,373 17,592
Average intangible assets 3,555 3,801
Add: Deferred tax liability – tax deductible goodwill2 1,542 1,452
Deferred tax liability – intangible assets2 1,095 1,129
Average tangible common shareholders’ equity – Non-GAAP $ 17,125 $ 16,727
Return on common equity – GAAP3 10.3% 9.2%
Adjusted return on common equity – Non-GAAP1,3 10.8% 9.7%
Return on tangible common equity – Non-GAAP3 21.1% 20.5%
Adjusted return on tangible common equity – Non-GAAP1,3 22.2% 20.7%
1 Non-GAAP information for both periods presented excludes amortization of intangible assets, and M&I, litigation and restructuring charges. 2 Deferred tax liabilities are based on fully phased-in Basel III rules. 3 Returns are Annualized.
Return on Common Equity and Tangible Common Equity
19 2017 Barclays Global Financial Services Conference
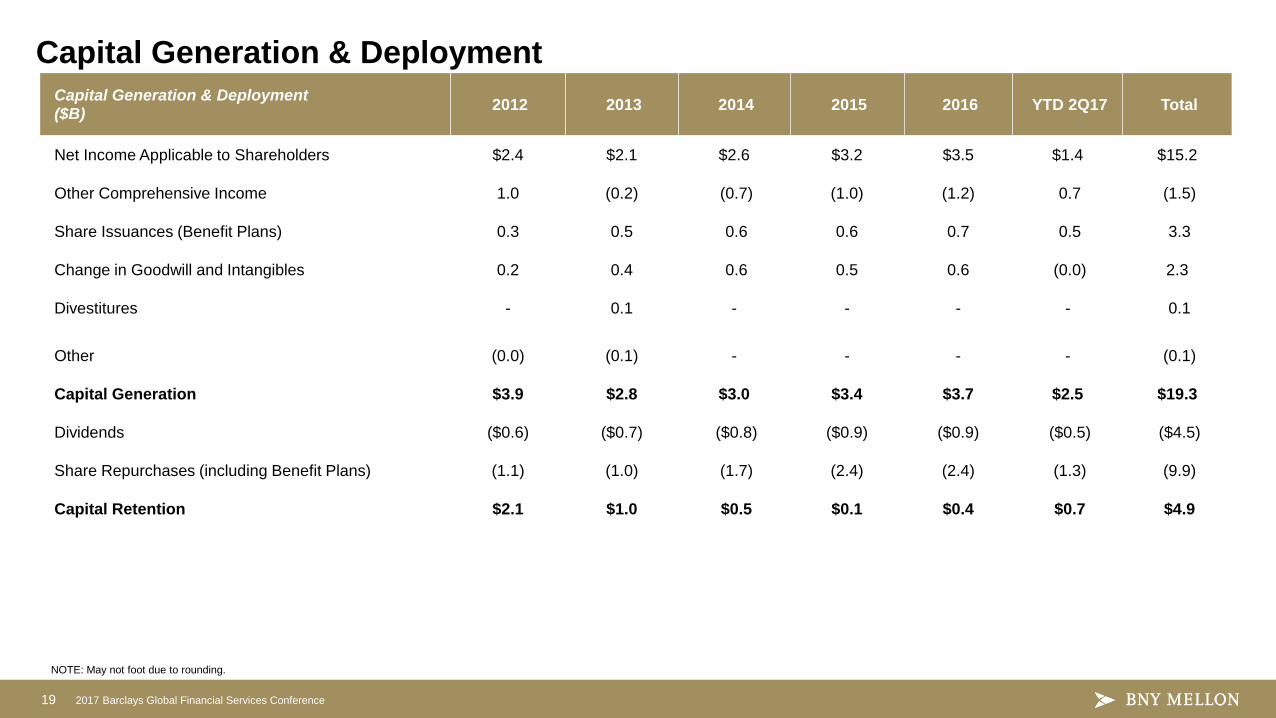
Capital Generation & Deployment ($B)
2012 2013 2014 2015 2016 YTD 2Q17 Total
Net Income Applicable to Shareholders $2.4 $2.1 $2.6 $3.2 $3.5 $1.4 $15.2
Other Comprehensive Income 1.0 (0.2) (0.7) (1.0) (1.2) 0.7 (1.5)
Share Issuances (Benefit Plans) 0.3 0.5 0.6 0.6 0.7 0.5 3.3
Change in Goodwill and Intangibles 0.2 0.4 0.6 0.5 0.6 (0.0) 2.3
Divestitures - 0.1 - - - - 0.1
Other (0.0) (0.1) - - - - (0.1)
Capital Generation $3.9 $2.8 $3.0 $3.4 $3.7 $2.5 $19.3
Dividends ($0.6) ($0.7) ($0.8) ($0.9) ($0.9) ($0.5) ($4.5)
Share Repurchases (including Benefit Plans) (1.1) (1.0) (1.7) (2.4) (2.4) (1.3) (9.9)
Capital Retention $2.1 $1.0 $0.5 $0.1 $0.4 $0.7 $4.9
NOTE: May not foot due to rounding.
Capital Generation & Deployment