Embed Size (px)
Citation preview
Index
Market Outlook
Investment Performance
Assure Fund
Income Advantage Fund
Protector Fund
Builder Fund
Balancer Fund
Enhancer Fund
Creator Fund
Magnifier Fund
Maximiser Fund
Super 20 Fund
Multiplier Fund
Platinum Plus I Fund
Platinum Plus II Fund
Platinum Plus III Fund
Platinum Plus IV Fund
Platinum Premier Fund
Platinum Advantage Fund
Foresight Single Pay
Foresight 5 Pay
Titanium I Fund
Titanium II Fund
Titanium III Fund
Pure Equity
Liquid Plus
Value & Momentum
Pg 1
Pg 3
Pg 5
Pg 6
Pg 7
Pg 8
Pg 9
Pg 10
Pg 11
Pg 12
Pg 13
Pg 14
Pg 15
Pg 16
Pg 17
Pg 18
Pg 19
Pg 20
Pg 21
Pg 22
Pg 23
Pg 24
Pg 25
Pg 26
Pg 27
Pg 28
Pg 29
Pension Growth Fund
Pension Nourish Fund
Pension Enrich Fund
Pg 30
Pg 31
Pg 32
as on 30th September 2015
Market Update
1
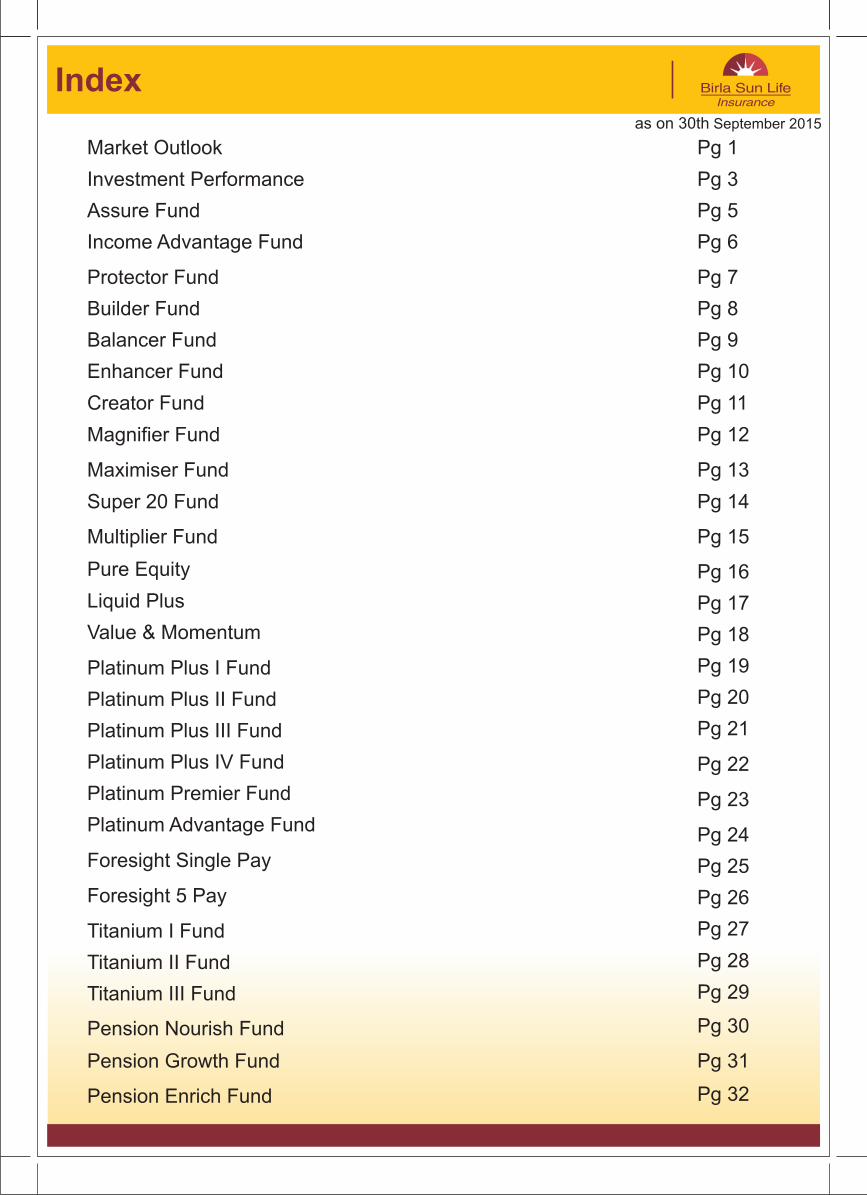
Economy Review
Volatility in equity markets continued in September 2015. Initial part of the month saw jitteriness on global
growth worries ahead of US Fed policy decision. However, RBI surprised markets with rate cut of 50 basis
points. The central bank also revised down its inflation projection from 6 per cent to 5.8 per cent for January-16.
Inflation for the month of August-2015 was recorded at 3.66 per cent, lower than 3.69 per cent recorded in the
month of July-2015. RBI mentioned that the focus will now shift to bring inflation around 5 per cent by end of
FY17.
The cumulative 125 basis points cut by RBI have turned supportive of growth. India's fiscal situation is
improving and public expenditure is increasing. Hence we believe that India's economic recovery is like to
sustain. August saw a fiscal balance surplus for the first time in the last 8 years. Strong growth in tax and non-tax
revenues resulted in a surplus of Rs. 158 bn in August. Government capital spending has risen 38% y-o-y in the
April – August months. Cumulative April-August fiscal deficit at 66% of BE (vs. 75% last year) remains one of the
lowest in 4 years. This could help government achieve its fiscal deficit target of 3.9% GDP even though
disinvestment trends remain weak.
The cumulative rainfall in 2015 was 14 per cent deficient versus 12 per cent shortfall last year. But the timely
onset of monsoon boosted sowing in kharif season which was up 1.2 per cent. As per estimates, the agriculture
ministry expects 3.1 per cent growth in food grains output in the kharif season.
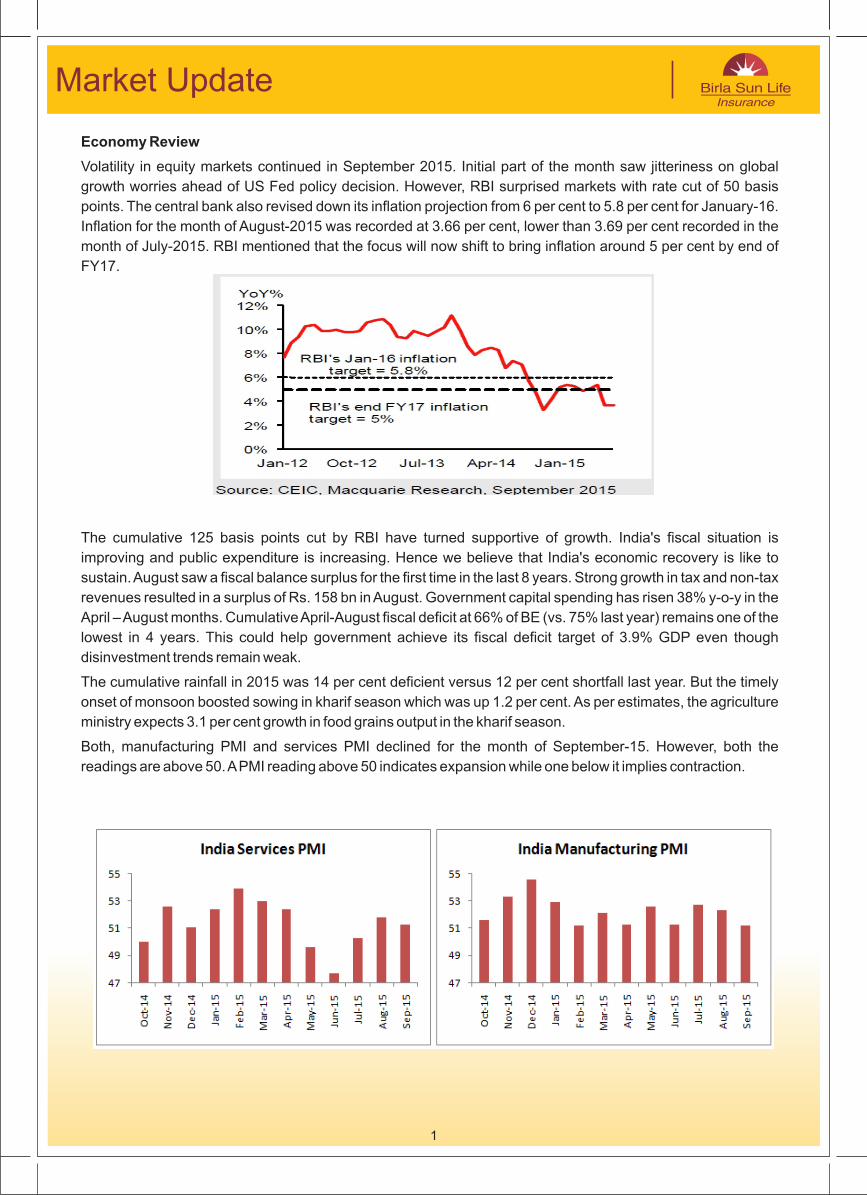
Both, manufacturing PMI and services PMI declined for the month of September-15. However, both the
readings are above 50. A PMI reading above 50 indicates expansion while one below it implies contraction.
Market Update
2
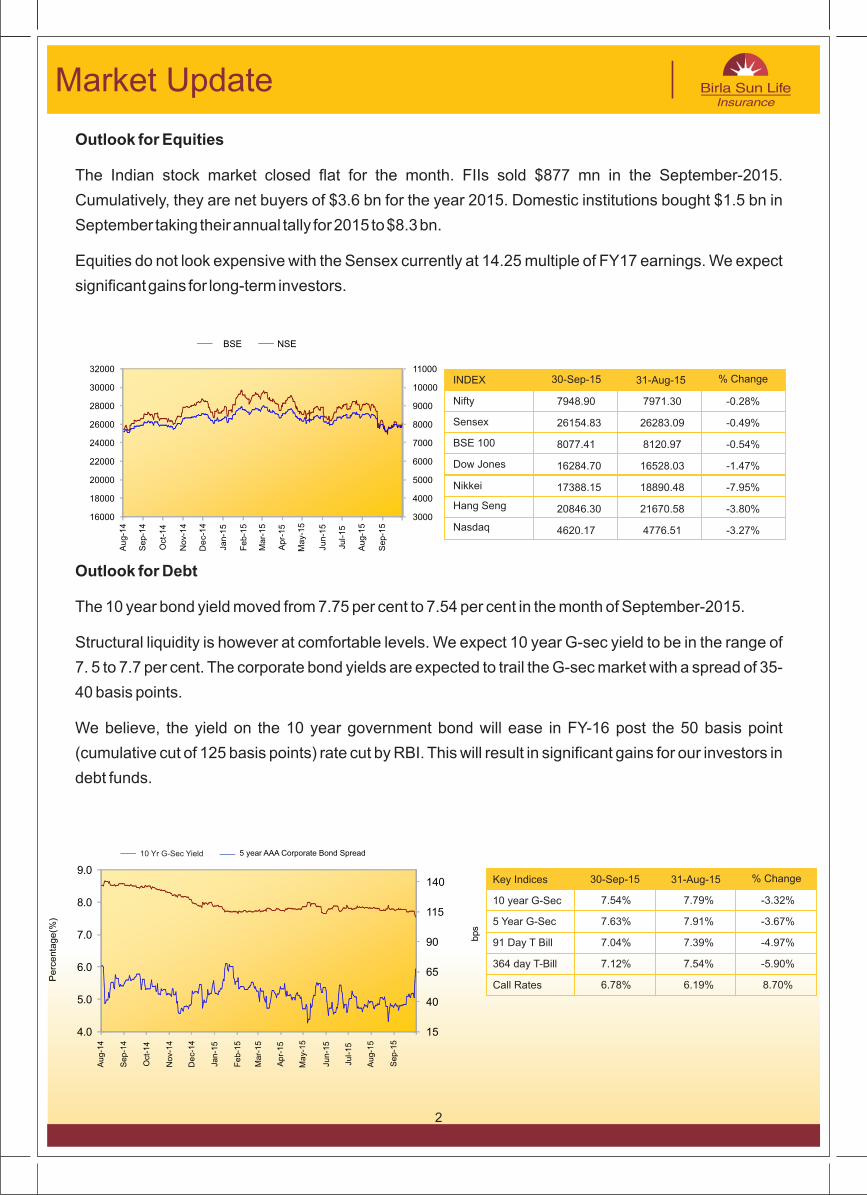
Outlook for Equities
The Indian stock market closed flat for the month. FIIs sold $877 mn in the September-2015.
Cumulatively, they are net buyers of $3.6 bn for the year 2015. Domestic institutions bought $1.5 bn in
September taking their annual tally for 2015 to $8.3 bn.
Equities do not look expensive with the Sensex currently at 14.25 multiple of FY17 earnings. We expect
significant gains for long-term investors.
Outlook for Debt
The 10 year bond yield moved from 7.75 per cent to 7.54 per cent in the month of September-2015.
Structural liquidity is however at comfortable levels. We expect 10 year G-sec yield to be in the range of
7. 5 to 7.7 per cent. The corporate bond yields are expected to trail the G-sec market with a spread of 35-
40 basis points.
We believe, the yield on the 10 year government bond will ease in FY-16 post the 50 basis point
(cumulative cut of 125 basis points) rate cut by RBI. This will result in significant gains for our investors in
debt funds.
30-Sep-15 31-Aug-15 % ChangeINDEX
Nifty
Sensex
BSE 100
Dow Jones
Hang Seng
Nikkei
Nasdaq
7948.90 7971.30 -0.28%
26154.83 26283.09 -0.49%
8077.41 8120.97 -0.54%
16284.70 16528.03 -1.47%
17388.15 18890.48 -7.95%
20846.30 21670.58 -3.80%
4620.17 4776.51 -3.27%
3000
4000
5000
6000
7000
8000
9000
10000
11000
16000
18000
20000
22000
24000
26000
28000
30000
32000
Jan-1
5
Feb-1
5
Mar-
15
Aug-1
5
Au
g-1
4
Oct
-14
Sep-1
4
Nov-
14
De
c-14
Apr-
15
Ma
y-15
Ju
n-1
5
Jul-
15
Sep-1
5
NSEBSE
bps
Key Indices
10 year G-Sec
5 Year G-Sec
91 Day T Bill
364 day T-Bill
Call Rates
30-Sep-15 31-Aug-15 % Change
Pe
rce
nta
ge
(%)
7.54% 7.79% -3.32%
7.63% 7.91% -3.67%
7.04% 7.39% -4.97%
7.12% 7.54% -5.90%
6.78% 6.19% 8.70%
15
40
65
90
115
140
4.0
5.0
6.0
7.0
8.0
9.0
Jan-1
5
Feb-1
5
Mar-
15
Aug-1
5
Au
g-1
4
Oct
-14
Sep-1
4
Nov-
14
De
c-14
Apr-
15
Ma
y-15
Ju
n-1
5
Jul-
15
Sep-1
5
5 year AAA Corporate Bond Spread10 Yr G-Sec Yield
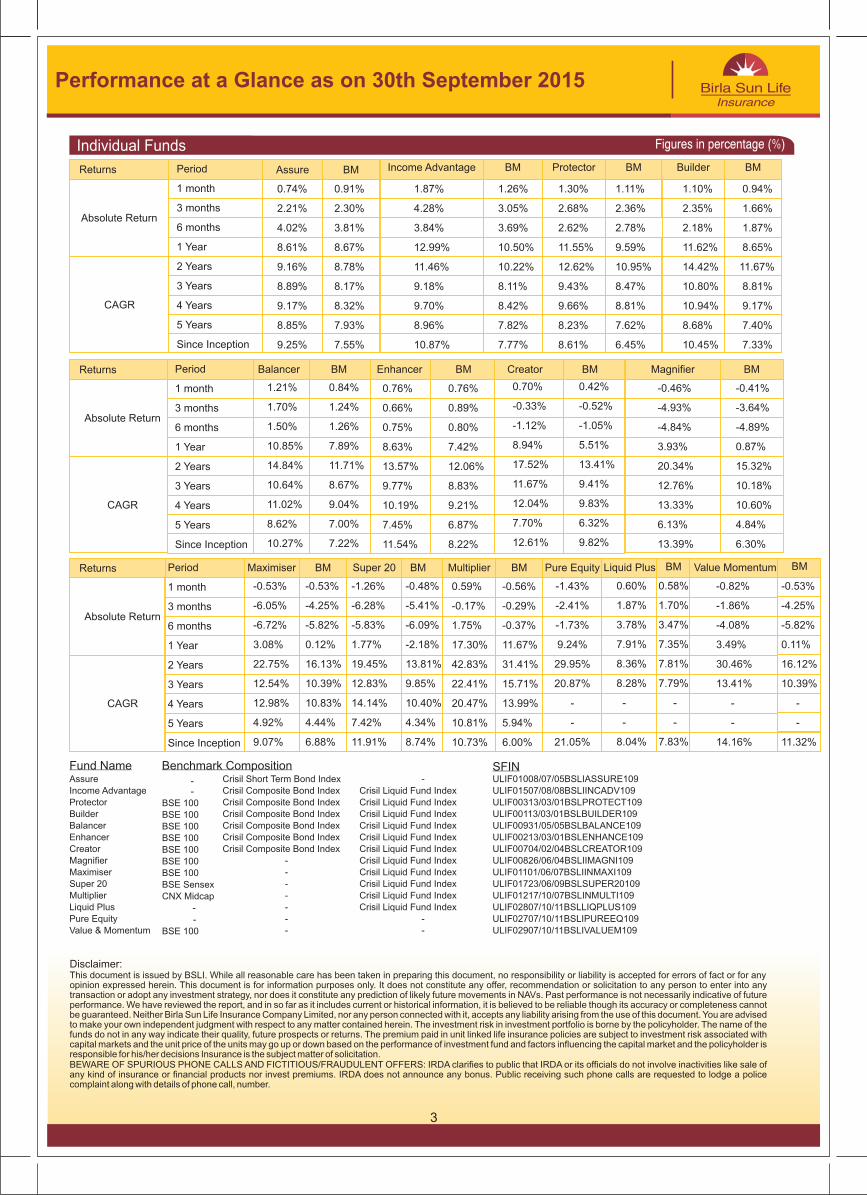
Individual Funds
Returns
Absolute Return
CAGR
BM BMCreatorBMEnhancer
1.21% 0.84%
1.70% 1.24%
1.50% 1.26%
10.85% 7.89%
14.84% 11.71%
10.64% 8.67%
11.02% 9.04%
8.62% 7.00%
10.27% 7.22%
0.70% 0.42%
-0.33% -0.52%
-1.12% -1.05%
8.94% 5.51%
17.52% 13.41%
11.67% 9.41%
12.04% 9.83%
7.70% 6.32%
12.61% 9.82%
0.59% -0.56%
-0.17% -0.29%
1.75% -0.37%
17.30% 11.67%
42.83% 31.41%
22.41% 15.71%
20.47% 13.99%
10.81% 5.94%
10.73% 6.00%
-1.26% -0.48%
-6.28% -5.41%
-5.83% -6.09%
1.77% -2.18%
19.45% 13.81%
12.83% 9.85%
14.14% 10.40%
7.42% 4.34%
11.91% 8.74%
-0.53% -0.53%
-6.05% -4.25%
-6.72% -5.82%
3.08% 0.12%
22.75% 16.13%
12.54% 10.39%
12.98% 10.83%
4.92% 4.44%
9.07% 6.88%
1.10% 0.94%
2.35% 1.66%
2.18% 1.87%
11.62% 8.65%
14.42% 11.67%
10.80% 8.81%
10.94% 9.17%
8.68% 7.40%
10.45% 7.33%
1.30% 1.11%
2.68% 2.36%
2.62% 2.78%
11.55% 9.59%
12.62% 10.95%
9.43% 8.47%
9.66% 8.81%
8.23% 7.62%
8.61% 6.45%
0.74% 0.91%
2.21% 2.30%
4.02% 3.81%
8.61% 8.67%
9.16% 8.78%
8.89% 8.17%
9.17% 8.32%
8.85% 7.93%
9.25% 7.55%
1.87% 1.26%
4.28% 3.05%
3.84% 3.69%
12.99% 10.50%
11.46% 10.22%
9.18% 8.11%
9.70% 8.42%
8.96% 7.82%
10.87% 7.77%
0.76% 0.76%
0.66% 0.89%
0.75% 0.80%
8.63% 7.42%
13.57% 12.06%
9.77% 8.83%
10.19% 9.21%
7.45% 6.87%
11.54% 8.22%
BalancerPeriod
1 month
3 months
6 months
1 Year
2 Years
3 Years
4 Years
5 Years
Since Inception
Performance at a Glance as on 30t h September 2015
Returns
Absolute Return
CAGR
Returns
Absolute Return
CAGR
Pure EquityPeriod
1 month
3 months
6 months
1 Year
2 Years
3 Years
4 Years
5 Years
Since Inception
Maximiser BM Super 20 BM Multiplier BM
Disclaimer:This document is issued by BSLI. While all reasonable care has been taken in preparing this document, no responsibility or liability is accepted for errors of fact or for any opinion expressed herein. This document is for information purposes only. It does not constitute any offer, recommendation or solicitation to any person to enter into any transaction or adopt any investment strategy, nor does it constitute any prediction of likely future movements in NAVs. Past performance is not necessarily indicative of future performance. We have reviewed the report, and in so far as it includes current or historical information, it is believed to be reliable though its accuracy or completeness cannot be guaranteed. Neither Birla Sun Life Insurance Company Limited, nor any person connected with it, accepts any liability arising from the use of this document. You are advised to make your own independent judgment with respect to any matter contained herein. The investment risk in investment portfolio is borne by the policyholder. The name of the funds do not in any way indicate their quality, future prospects or returns. The premium paid in unit linked life insurance policies are subject to investment risk associated with capital markets and the unit price of the units may go up or down based on the performance of investment fund and factors influencing the capital market and the policyholder is responsible for his/her decisions Insurance is the subject matter of solicitation.BEWARE OF SPURIOUS PHONE CALLS AND FICTITIOUS/FRAUDULENT OFFERS: IRDA clarifies to public that IRDA or its officials do not involve inactivities like sale of any kind of insurance or financial products nor invest premiums. IRDA does not announce any bonus. Public receiving such phone calls are requested to lodge a police complaint along with details of phone call, number.
Fund Name Benchmark CompositionAssure
Income Advantage
Protector
Builder
Balancer
Enhancer
Creator
Magnifier
Maximiser
Multiplier
Super 20
Pure Equity
Liquid Plus
Value & Momentum
--
BSE 100
BSE 100
BSE 100
BSE 100
BSE 100
BSE 100
BSE 100
CNX Midcap
-
BSE Sensex
-
BSE 100
Crisil Short Term Bond Index
Crisil Composite Bond Index
Crisil Composite Bond Index
Crisil Composite Bond Index
Crisil Composite Bond Index
Crisil Composite Bond Index
Crisil Composite Bond Index
-
-
-
-
-
-
-
-
Crisil Liquid Fund Index
Crisil Liquid Fund Index
Crisil Liquid Fund Index
Crisil Liquid Fund Index
Crisil Liquid Fund Index
Crisil Liquid Fund Index
Crisil Liquid Fund Index
Crisil Liquid Fund Index
Crisil Liquid Fund Index
Crisil Liquid Fund Index
Crisil Liquid Fund Index
-
-
ULIF01008/07/05BSLIASSURE109
ULIF01507/08/08BSLIINCADV109
ULIF00313/03/01BSLPROTECT109
ULIF00113/03/01BSLBUILDER109
ULIF00931/05/05BSLBALANCE109
ULIF00213/03/01BSLENHANCE109
ULIF00704/02/04BSLCREATOR109
ULIF00826/06/04BSLIIMAGNI109
ULIF01101/06/07BSLIINMAXI109
ULIF01723/06/09BSLSUPER20109
ULIF01217/10/07BSLINMULTI109
ULIF02807/10/11BSLLIQPLUS109
ULIF02707/10/11BSLIPUREEQ109
ULIF02907/10/11BSLIVALUEM109
SFIN
3
BMAssure BMProtector BMBuilderPeriod
1 month
3 months
6 months
1 Year
2 Years
3 Years
4 Years
5 Years
Since Inception
BMIncome Advantage
BM
-0.46% -0.41%
-4.93% -3.64%
-4.84% -4.89%
3.93% 0.87%
20.34% 15.32%
12.76% 10.18%
13.33% 10.60%
6.13% 4.84%
13.39% 6.30%
Magnifier
0.60% 0.58%
1.87% 1.70%
3.78% 3.47%
7.91% 7.35%
8.36% 7.81%
8.28% 7.79%
8.04% 7.83%
- -
- -
Liquid Plus BM
-1.43%
-2.41%
-1.73%
9.24%
29.95%
20.87%
-
-
21.05%
-0.82%
-1.86%
-4.08%
3.49%
30.46%
13.41%
-
-
14.16%
Value Momentum BM
-0.53%
-4.25%
-5.82%
0.11%
16.12%
10.39%
-
-
11.32%
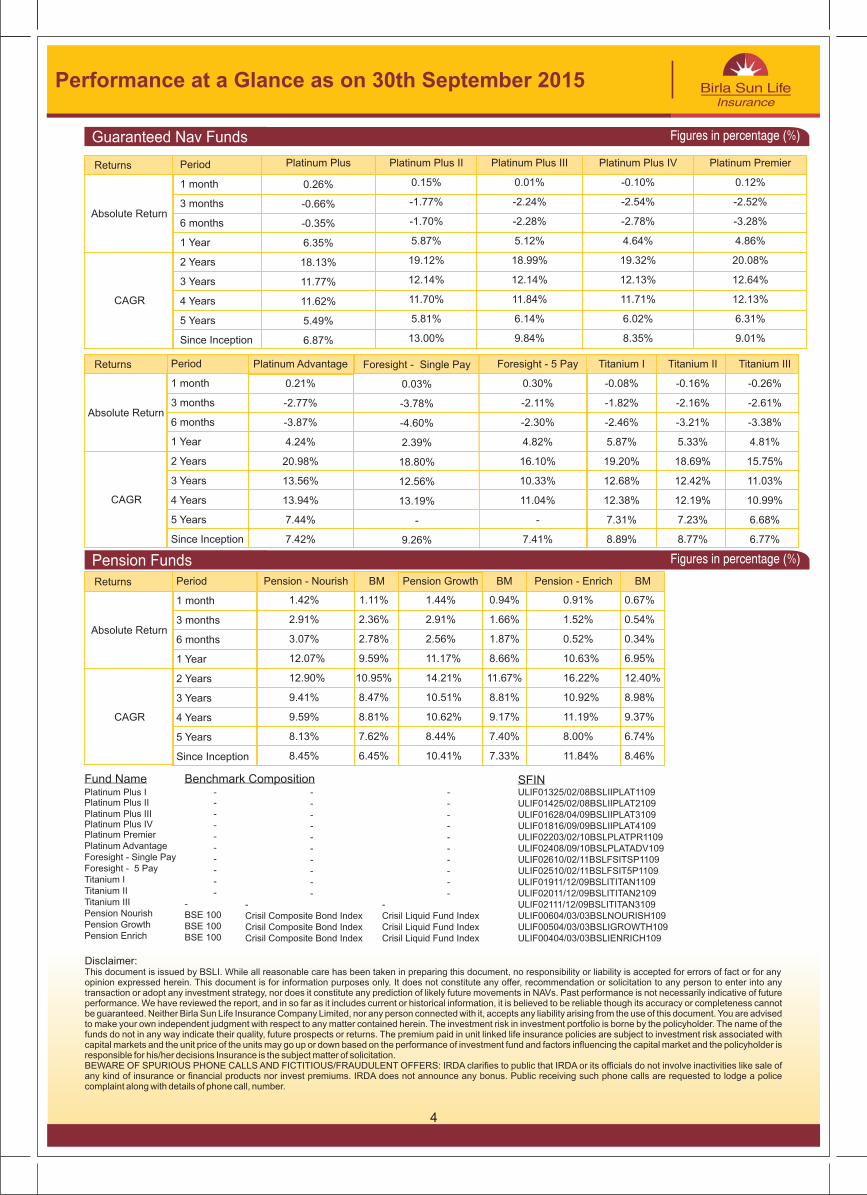
Guaranteed Nav Funds
Pension Funds
Returns
Absolute Return
CAGR
Platinum Plus
0.26%
-0.66%
-0.35%
6.35%
18.13%
11.77%
11.62%
5.49%
6.87%
Platinum Plus II
0.15%
-1.77%
-1.70%
5.87%
19.12%
12.14%
11.70%
5.81%
13.00%
Platinum Plus III
0.01%
-2.24%
-2.28%
5.12%
18.99%
12.14%
11.84%
6.14%
9.84%
Platinum Plus IV
-0.10%
-2.54%
-2.78%
4.64%
19.32%
12.13%
11.71%
6.02%
8.35%
Platinum Premier
0.12%
-2.52%
-3.28%
4.86%
20.08%
12.64%
12.13%
6.31%
9.01%
Period
1 month
3 months
6 months
1 Year
2 Years
3 Years
4 Years
5 Years
Since Inception
Returns
Absolute Return
CAGR
Disclaimer:This document is issued by BSLI. While all reasonable care has been taken in preparing this document, no responsibility or liability is accepted for errors of fact or for any opinion expressed herein. This document is for information purposes only. It does not constitute any offer, recommendation or solicitation to any person to enter into any transaction or adopt any investment strategy, nor does it constitute any prediction of likely future movements in NAVs. Past performance is not necessarily indicative of future performance. We have reviewed the report, and in so far as it includes current or historical information, it is believed to be reliable though its accuracy or completeness cannot be guaranteed. Neither Birla Sun Life Insurance Company Limited, nor any person connected with it, accepts any liability arising from the use of this document. You are advised to make your own independent judgment with respect to any matter contained herein. The investment risk in investment portfolio is borne by the policyholder. The name of the funds do not in any way indicate their quality, future prospects or returns. The premium paid in unit linked life insurance policies are subject to investment risk associated with capital markets and the unit price of the units may go up or down based on the performance of investment fund and factors influencing the capital market and the policyholder is responsible for his/her decisions Insurance is the subject matter of solicitation.BEWARE OF SPURIOUS PHONE CALLS AND FICTITIOUS/FRAUDULENT OFFERS: IRDA clarifies to public that IRDA or its officials do not involve inactivities like sale of any kind of insurance or financial products nor invest premiums. IRDA does not announce any bonus. Public receiving such phone calls are requested to lodge a police complaint along with details of phone call, number.
Platinum Plus I Platinum Plus IIPlatinum Plus III Platinum Plus IV Platinum Premier Platinum Advantage
Titanium ITitanium IITitanium IIIPension NourishPension GrowthPension Enrich
Foresight - Single Pay Foresight - 5 Pay
------
--
-BSE 100BSE 100BSE 100
--
------
--
-Crisil Composite Bond IndexCrisil Composite Bond IndexCrisil Composite Bond Index
--
------
--
-Crisil Liquid Fund IndexCrisil Liquid Fund IndexCrisil Liquid Fund Index
--
ULIF01325/02/08BSLIIPLAT1109ULIF01425/02/08BSLIIPLAT2109ULIF01628/04/09BSLIIPLAT3109ULIF01816/09/09BSLIIPLAT4109ULIF02203/02/10BSLPLATPR1109ULIF02408/09/10BSLPLATADV109ULIF02610/02/11BSLFSITSP1109ULIF02510/02/11BSLFSIT5P1109ULIF01911/12/09BSLITITAN1109ULIF02011/12/09BSLITITAN2109ULIF02111/12/09BSLITITAN3109ULIF00604/03/03BSLNOURISH109ULIF00504/03/03BSLIGROWTH109ULIF00404/03/03BSLIENRICH109
Fund Name Benchmark Composition SFIN
4
Returns
Absolute Return
CAGR
Period
1 month
3 months
6 months
1 Year
2 Years
3 Years
4 Years
5 Years
Since Inception
1.44% 0.94%
2.91% 1.66%
2.56% 1.87%
11.17% 8.66%
14.21% 11.67%
10.51% 8.81%
10.62% 9.17%
8.44% 7.40%
10.41% 7.33%
0.91% 0.67%
1.52% 0.54%
0.52% 0.34%
10.63% 6.95%
16.22% 12.40%
10.92% 8.98%
11.19% 9.37%
8.00% 6.74%
11.84% 8.46%
Pension Growth Pension - EnrichBM BM
Period
1 month
3 months
6 months
1 Year
2 Years
3 Years
4 Years
5 Years
Since Inception
Foresight - 5 Pay
0.30%
-2.11%
-2.30%
4.82%
16.10%
10.33%
11.04%
-
7.41%
Performance at a Glance as on 30th September 2015
Platinum Advantage
0.21%
-2.77%
-3.87%
4.24%
20.98%
13.56%
13.94%
7.44%
7.42%
Titanium II
-0.16%
-2.16%
-3.21%
5.33%
18.69%
12.42%
12.19%
7.23%
8.77%
Titanium I
-0.08%
-1.82%
-2.46%
5.87%
19.20%
12.68%
12.38%
7.31%
8.89%
Titanium III
-0.26%
-2.61%
-3.38%
4.81%
15.75%
11.03%
10.99%
6.68%
6.77%
Foresight - Single Pay
0.03%
-3.78%
-4.60%
2.39%
18.80%
12.56%
13.19%
-
9.26%
1.42% 1.11%
2.91% 2.36%
3.07% 2.78%
12.07% 9.59%
12.90% 10.95%
9.41% 8.47%
9.59% 8.81%
8.13% 7.62%
8.45% 6.45%
Pension - Nourish BM
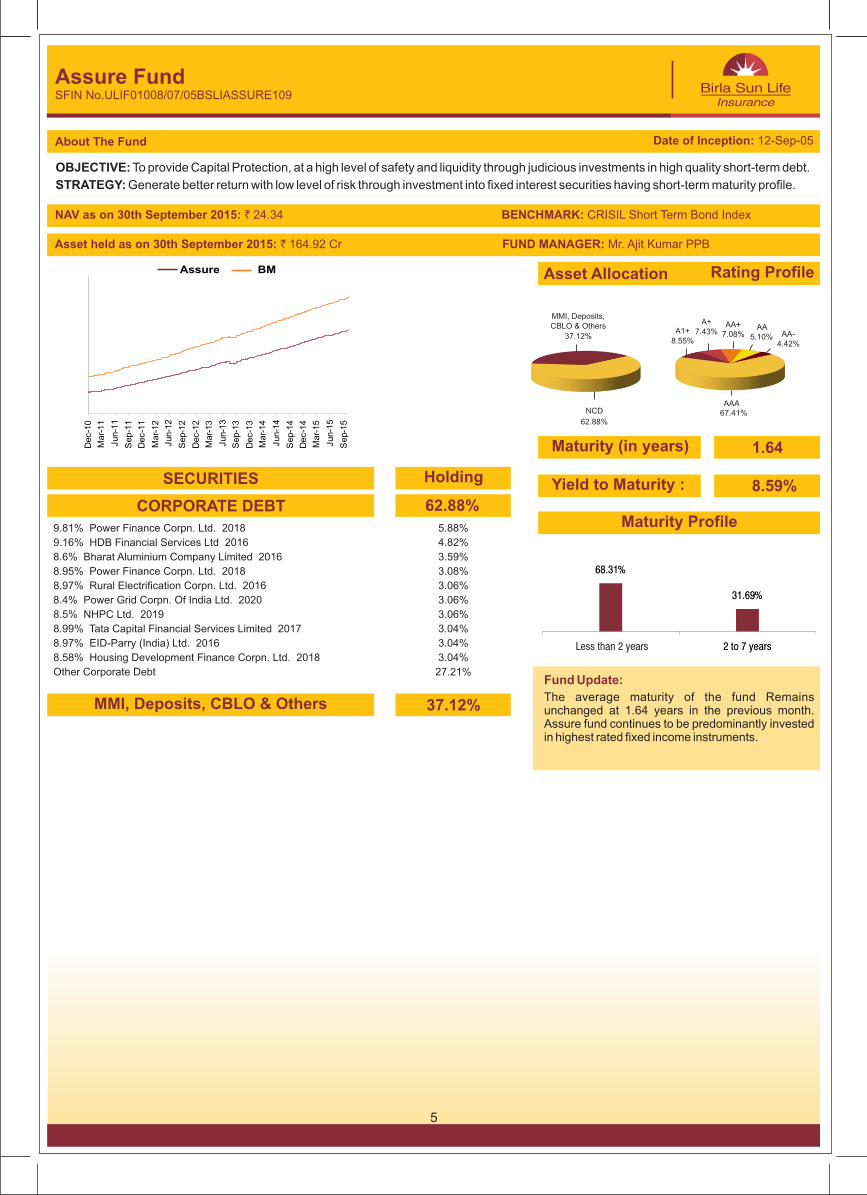
9.81% Power Finance Corpn. Ltd. 2018 5.88%
9.16% HDB Financial Services Ltd 2016 4.82%
8.6% Bharat Aluminium Company Limited 2016 3.59%
8.95% Power Finance Corpn. Ltd. 2018 3.08%
8.97% Rural Electrification Corpn. Ltd. 2016 3.06%
8.4% Power Grid Corpn. Of India Ltd. 2020 3.06%
8.5% NHPC Ltd. 2019 3.06%
8.99% Tata Capital Financial Services Limited 2017 3.04%
8.97% EID-Parry (India) Ltd. 2016 3.04%
8.58% Housing Development Finance Corpn. Ltd. 2018 3.04%
Other Corporate Debt 27.21%
OBJECTIVE:
STRATEGY: Generate better return with low level of risk through investment into fixed interest securities having short-term maturity profile.
To provide Capital Protection, at a high level of safety and liquidity through judicious investments in high quality short-term debt.
About The Fund
CORPORATE DEBT
Asset Allocation Rating Profile
62.88%
37.12%
NAV as on 30th September 2015: 24.34 BENCHMARK: CRISIL Short Term Bond Index `
Assure FundSFIN No.ULIF01008/07/05BSLIASSURE109
SECURITIES Holding
5
MMI, Deposits, CBLO & Others
Asset held as on ` 164.92 Cr FUND MANAGER: Mr. Ajit Kumar PPB 30th September 2015:
Date of Inception: 12-Sep-05
8.59%
Fund Update:
The average maturity of the fund Remains unchanged at 1.64 years in the previous month. Assure fund continues to be predominantly invested in highest rated fixed income instruments.
Maturity Profile
Yield to Maturity :
BMAssure
1.64Maturity (in years)
67.41%AAA
A1+8.55% 4.42%
AA-AA
5.10%
A+7.43% 7.08%
AA+
68.31%
31.69%
Less than 2 years 2 to 7 years
62.88%
NCD
MMI, Deposits, CBLO & Others
37.12%
Dec-1
0
Mar-
11
Jun-1
1
Sep-1
1
Dec-1
1
Mar-
12
Jun-1
2
Sep-1
2
Dec-1
2
Mar-
13
Jun-1
3
Sep-1
3
Dec-1
3
Mar-
14
Jun-1
4
Sep-1
4
Dec-1
4
Mar-
15
Jun-1
5
Sep-1
5
OBJECTIVE: quality debt instruments.
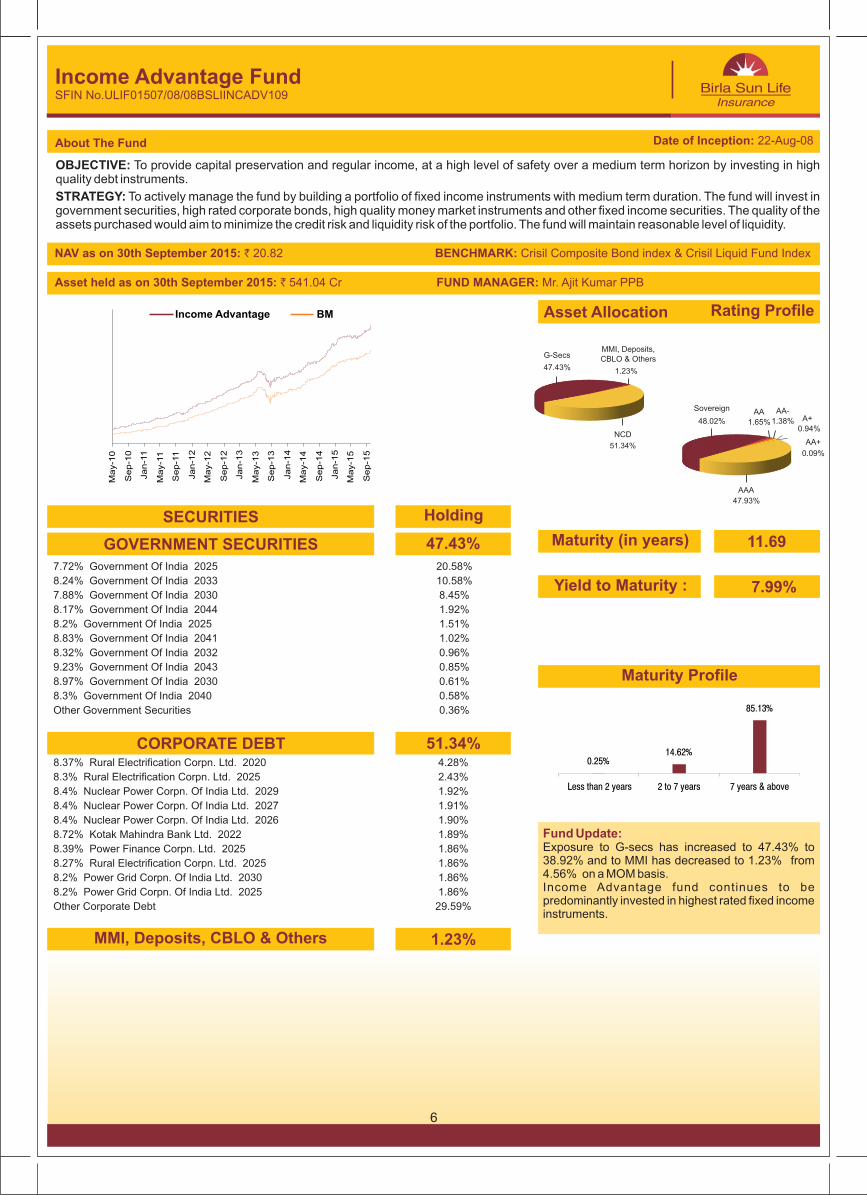
STRATEGY: To actively manage the fund by building a portfolio of fixed income instruments with medium term duration. The fund will invest in government securities, high rated corporate bonds, high quality money market instruments and other fixed income securities. The quality of the assets purchased would aim to minimize the credit risk and liquidity risk of the portfolio. The fund will maintain reasonable level of liquidity.
To provide capital preservation and regular income, at a high level of safety over a medium term horizon by investing in high
About The Fund
Income Advantage FundSFIN No.ULIF01507/08/08BSLIINCADV109
BMIncome Advantage
7.72% Government Of India 2025 20.58%
8.24% Government Of India 2033 10.58%
7.88% Government Of India 2030 8.45%
8.17% Government Of India 2044 1.92%
8.2% Government Of India 2025 1.51%
8.83% Government Of India 2041 1.02%
8.32% Government Of India 2032 0.96%
9.23% Government Of India 2043 0.85%
8.97% Government Of India 2030 0.61%
8.3% Government Of India 2040 0.58%
Other Government Securities 0.36%
8.37% Rural Electrification Corpn. Ltd. 2020 4.28%
8.3% Rural Electrification Corpn. Ltd. 2025 2.43%
8.4% Nuclear Power Corpn. Of India Ltd. 2029 1.92%
8.4% Nuclear Power Corpn. Of India Ltd. 2027 1.91%
8.4% Nuclear Power Corpn. Of India Ltd. 2026 1.90%
8.72% Kotak Mahindra Bank Ltd. 2022 1.89%
8.39% Power Finance Corpn. Ltd. 2025 1.86%
8.27% Rural Electrification Corpn. Ltd. 2025 1.86%
8.2% Power Grid Corpn. Of India Ltd. 2030 1.86%
8.2% Power Grid Corpn. Of India Ltd. 2025 1.86%
Other Corporate Debt 29.59%
GOVERNMENT SECURITIES
CORPORATE DEBT
MMI, Deposits, CBLO & Others
SECURITIES
Asset Allocation Rating Profile
47.43%
Holding
51.34%
7.99%
1.23%
NAV as on 20.82 BENCHMARK: 30th September 2015: ` Crisil Composite Bond index & Crisil Liquid Fund Index
Asset held as on ` 541.04 Cr FUND MANAGER: Mr. Ajit Kumar PPB 30th September 2015:
Fund Update: Exposure to G-secs has increased to 47.43% to 38.92% and to MMI has decreased to 1.23% from 4.56% on a MOM basis.Income Advantage fund continues to be predominantly invested in highest rated fixed income instruments.
Maturity (in years)
Yield to Maturity :
6
Date of Inception: 22-Aug-08
Income Advantage BM
11.69
Maturity Profile
0.25% 14.62%
85.13%
Less than 2 years 2 to 7 years 7 years & above
1.23%
MMI, Deposits, CBLO & OthersG-Secs
47.43%
51.34%
NCD
47.93%
AAA
AA+
0.09%
Sovereign AA
1.65%48.02%
AA-
1.38% A+
0.94%
Ma
y-1
0
Se
p-1
0
Ja
n-1
1
Ma
y-1
1
Se
p-1
1
Ja
n-1
2
Ma
y-1
2
Se
p-1
2
Ja
n-1
3
Ma
y-1
3
Se
p-1
3
Ja
n-1
4
Ma
y-1
4
Se
p-1
4
Ja
n-1
5
Ma
y-1
5
Se
p-1
5
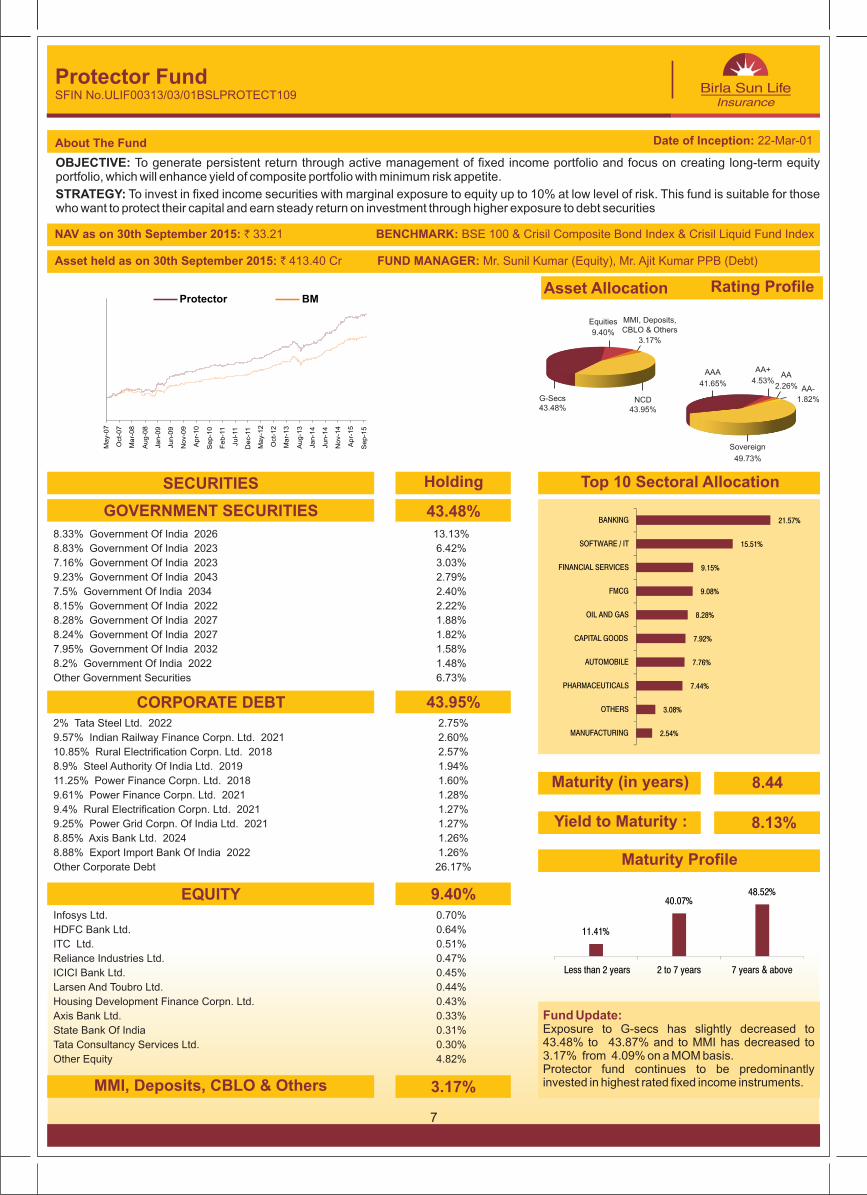
8.33% Government Of India 2026 13.13%
8.83% Government Of India 2023 6.42%
7.16% Government Of India 2023 3.03%
9.23% Government Of India 2043 2.79%
7.5% Government Of India 2034 2.40%
8.15% Government Of India 2022 2.22%
8.28% Government Of India 2027 1.88%
8.24% Government Of India 2027 1.82%
7.95% Government Of India 2032 1.58%
8.2% Government Of India 2022 1.48%
Other Government Securities 6.73%
2% Tata Steel Ltd. 2022 2.75%
9.57% Indian Railway Finance Corpn. Ltd. 2021 2.60%
10.85% Rural Electrification Corpn. Ltd. 2018 2.57%
8.9% Steel Authority Of India Ltd. 2019 1.94%
11.25% Power Finance Corpn. Ltd. 2018 1.60%
9.61% Power Finance Corpn. Ltd. 2021 1.28%
9.4% Rural Electrification Corpn. Ltd. 2021 1.27%
9.25% Power Grid Corpn. Of India Ltd. 2021 1.27%
8.85% Axis Bank Ltd. 2024 1.26%
8.88% Export Import Bank Of India 2022 1.26%
Other Corporate Debt 26.17%
Infosys Ltd. 0.70%
HDFC Bank Ltd. 0.64%
ITC Ltd. 0.51%
Reliance Industries Ltd. 0.47%
ICICI Bank Ltd. 0.45%
Larsen And Toubro Ltd. 0.44%
Housing Development Finance Corpn. Ltd. 0.43%
Axis Bank Ltd. 0.33%
State Bank Of India 0.31%
Tata Consultancy Services Ltd. 0.30%
Other Equity 4.82%
OBJECTIVE: portfolio, which will enhance yield of composite portfolio with minimum risk appetite.
STRATEGY: To invest in fixed income securities with marginal exposure to equity up to 10% at low level of risk. This fund is suitable for those who want to protect their capital and earn steady return on investment through higher exposure to debt securities
To generate persistent return through active management of fixed income portfolio and focus on creating long-term equity
About The Fund
Protector FundSFIN No.ULIF00313/03/01BSLPROTECT109
GOVERNMENT SECURITIES
CORPORATE DEBT
EQUITY
MMI, Deposits, CBLO & Others
SECURITIES
Asset Allocation Rating Profile
43.48%
Holding
43.95%
8.44
9.40%
3.17%
NAV as on 33.21 BENCHMARK: 30th September 2015: ` BSE 100 & Crisil Composite Bond Index & Crisil Liquid Fund Index
Asset held as on ` 413.40 Cr FUND MANAGER: Mr. 30th September 2015: Sunil Kumar (Equity), Mr. Ajit Kumar PPB (Debt)
Fund Update: Exposure to G-secs has slightly decreased to 43.48% to 43.87% and to MMI has decreased to 3.17% from 4.09% on a MOM basis.Protector fund continues to be predominantly invested in highest rated fixed income instruments.
Maturity Profile
Maturity (in years)
Top 10 Sectoral Allocation
7
Maturity Profile
Date of Inception: 22-Mar-01
AA+
4.53%
1.82%
AA-
AA
2.26%
AAA
41.65%
Sovereign
49.73%
8.13%Yield to Maturity :
Protector BM
2.54%
3.08%
7.44%
7.76%
7.92%
8.28%
9.08%
9.15%
15.51%
21.57%
MANUFACTURING
OTHERS
PHARMACEUTICALS
AUTOMOBILE
CAPITAL GOODS
OIL AND GAS
FMCG
FINANCIAL SERVICES
SOFTWARE / IT
BANKING
11.41%
40.07% 48.52%
Less than 2 years 2 to 7 years 7 years & above
MMI, Deposits, CBLO & Others
Equities
3.17%9.40%
43.48%G-Secs
43.95%NCD
Ma
y-0
7
Oct-
07
Ma
r-0
8
Au
g-0
8
Ja
n-0
9
Ju
n-0
9
No
v-0
9
Ap
r-1
0
Se
p-1
0
Fe
b-1
1
Ju
l-11
De
c-1
1
Ma
y-1
2
Oct-
12
Ma
r-1
3
Au
g-1
3
Ja
n-1
4
Ju
n-1
4
No
v-1
4
Ap
r-1
5
Se
p-1
5
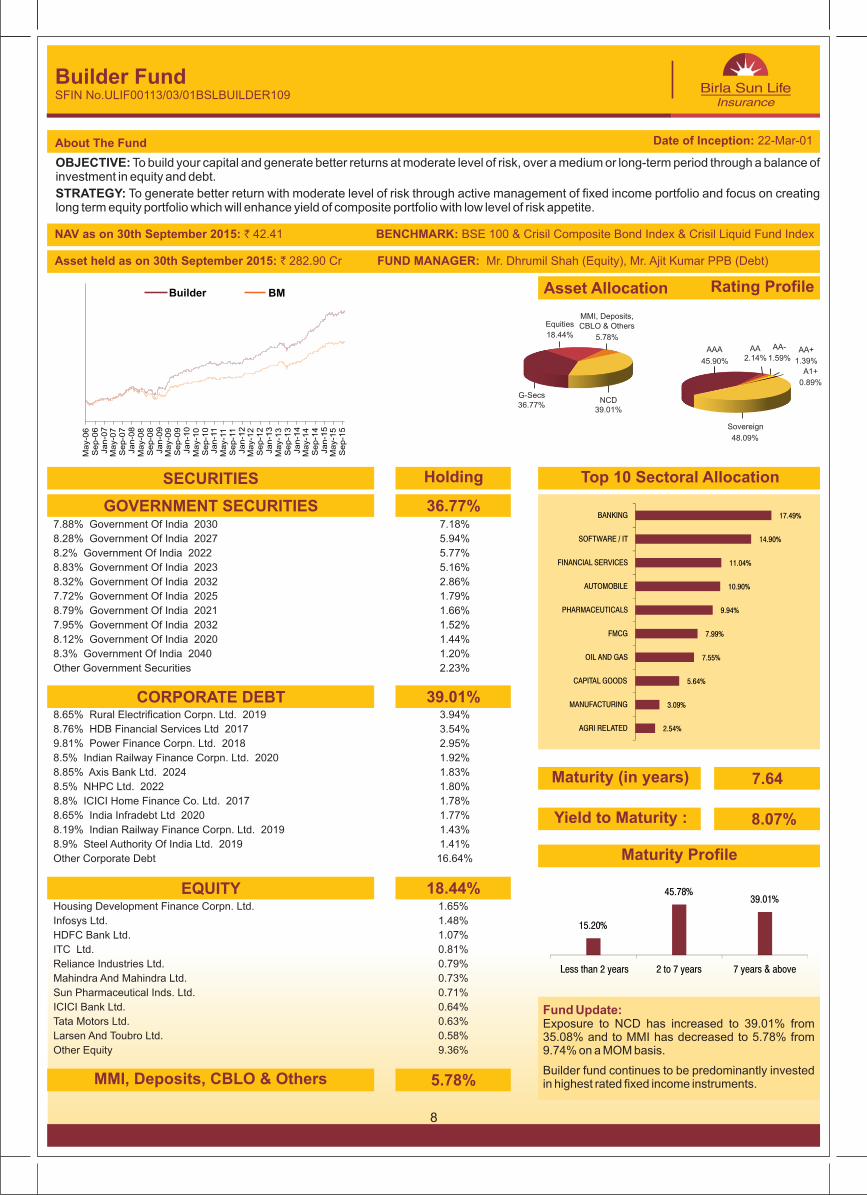
7.88% Government Of India 2030 7.18%
8.28% Government Of India 2027 5.94%
8.2% Government Of India 2022 5.77%
8.83% Government Of India 2023 5.16%
8.32% Government Of India 2032 2.86%
7.72% Government Of India 2025 1.79%
8.79% Government Of India 2021 1.66%
7.95% Government Of India 2032 1.52%
8.12% Government Of India 2020 1.44%
8.3% Government Of India 2040 1.20%
Other Government Securities 2.23%
8.65% Rural Electrification Corpn. Ltd. 2019 3.94%
8.76% HDB Financial Services Ltd 2017 3.54%
9.81% Power Finance Corpn. Ltd. 2018 2.95%
8.5% Indian Railway Finance Corpn. Ltd. 2020 1.92%
8.85% Axis Bank Ltd. 2024 1.83%
8.5% NHPC Ltd. 2022 1.80%
8.8% ICICI Home Finance Co. Ltd. 2017 1.78%
8.65% India Infradebt Ltd 2020 1.77%
8.19% Indian Railway Finance Corpn. Ltd. 2019 1.43%
8.9% Steel Authority Of India Ltd. 2019 1.41%
Other Corporate Debt 16.64%
Housing Development Finance Corpn. Ltd. 1.65%
Infosys Ltd. 1.48%
HDFC Bank Ltd. 1.07%
ITC Ltd. 0.81%
Reliance Industries Ltd. 0.79%
Mahindra And Mahindra Ltd. 0.73%
Sun Pharmaceutical Inds. Ltd. 0.71%
ICICI Bank Ltd. 0.64%
Tata Motors Ltd. 0.63%
Larsen And Toubro Ltd. 0.58%
Other Equity 9.36%
OBJECTIVE: investment in equity and debt.
STRATEGY: To generate better return with moderate level of risk through active management of fixed income portfolio and focus on creating long term equity portfolio which will enhance yield of composite portfolio with low level of risk appetite.
To build your capital and generate better returns at moderate level of risk, over a medium or long-term period through a balance of
About The Fund
Builder FundSFIN No.ULIF00113/03/01BSLBUILDER109
GOVERNMENT SECURITIES
CORPORATE DEBT
EQUITY
MMI, Deposits, CBLO & Others
SECURITIES
Asset Allocation Rating Profile
36.77%
Holding
39.01%
7.64
18.44%
5.78%
NAV as on 42.41 BENCHMARK: 30th September 2015: ` BSE 100 & Crisil Composite Bond Index & Crisil Liquid Fund Index
Asset held as on ` 282.90 Cr FUND MANAGER: Mr. 30th September 2015: Dhrumil Shah (Equity), Mr. Ajit Kumar PPB (Debt)
Fund Update: Exposure to NCD has increased to 39.01% from 35.08% and to MMI has decreased to 5.78% from 9.74% on a MOM basis.
Builder fund continues to be predominantly invested in highest rated fixed income instruments.
Maturity Profile
Maturity (in years)
Top 10 Sectoral Allocation
8
BMBuilder
Date of Inception: 22-Mar-01
8.07%Yield to Maturity :
48.09%
Sovereign
AAA AA AA-
1.59%45.90%
A1+
0.89%
2.14%AA+
1.39%
2.54%
3.09%
5.64%
7.55%
7.99%
9.94%
10.90%
11.04%
14.90%
17.49%
AGRI RELATED
MANUFACTURING
CAPITAL GOODS
OIL AND GAS
FMCG
PHARMACEUTICALS
AUTOMOBILE
FINANCIAL SERVICES
SOFTWARE / IT
BANKING
15.20%
45.78% 39.01%
Less than 2 years 2 to 7 years 7 years & above
MMI, Deposits, CBLO & OthersEquities
18.44% 5.78%
39.01%NCD
36.77%G-Secs
Ma
y-0
6S
ep
-06
Ja
n-0
7M
ay-0
7S
ep
-07
Ja
n-0
8M
ay-0
8S
ep
-08
Ja
n-0
9M
ay-0
9S
ep
-09
Ja
n-1
0M
ay-1
0S
ep
-10
Ja
n-1
1M
ay-1
1S
ep
-11
Ja
n-1
2M
ay-1
2S
ep
-12
Ja
n-1
3M
ay-1
3S
ep
-13
Ja
n-1
4M
ay-1
4S
ep
-14
Ja
n-1
5M
ay-1
5S
ep
-15
OBJECTIVE:
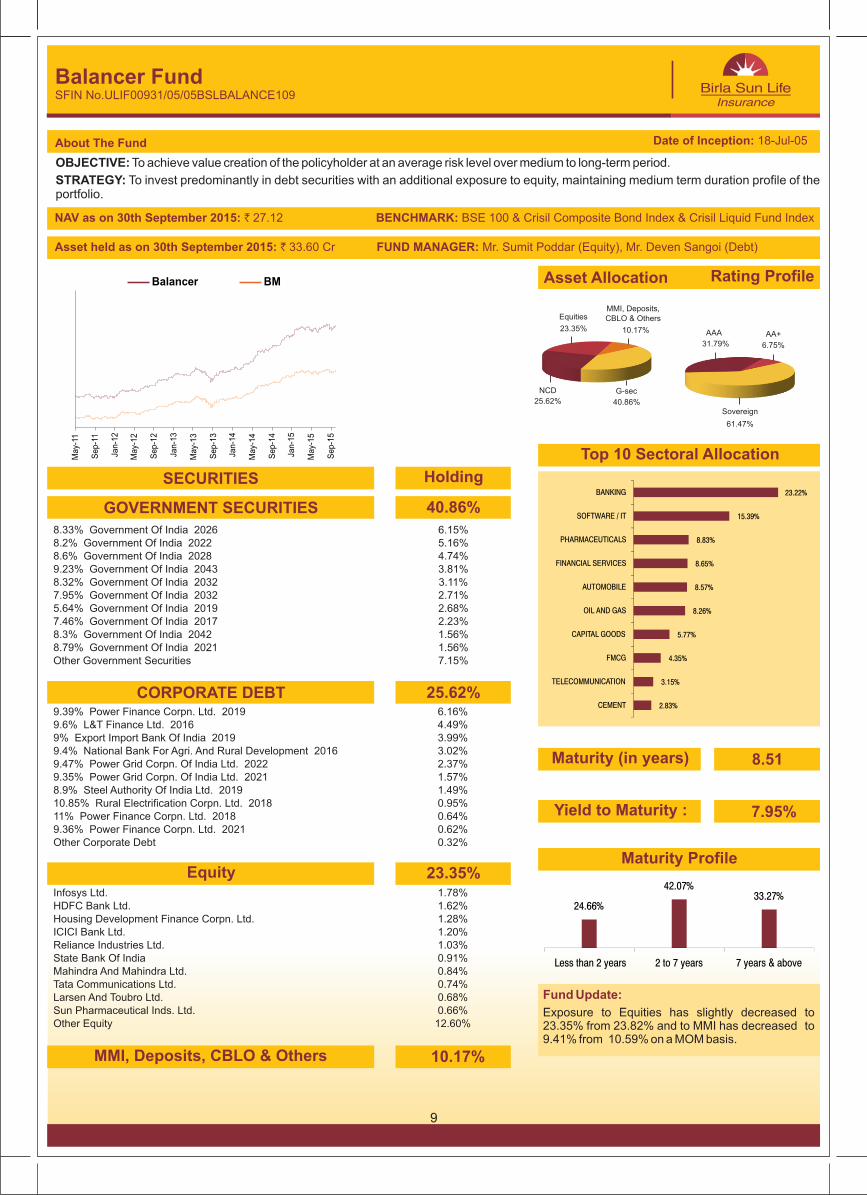
STRATEGY: To invest predominantly in debt securities with an additional exposure to equity, maintaining medium term duration profile of the portfolio.
To achieve value creation of the policyholder at an average risk level over medium to long-term period.
About The Fund
Balancer FundSFIN No.ULIF00931/05/05BSLBALANCE109
8.33% Government Of India 2026 6.15%8.2% Government Of India 2022 5.16%8.6% Government Of India 2028 4.74%9.23% Government Of India 2043 3.81%8.32% Government Of India 2032 3.11%7.95% Government Of India 2032 2.71%5.64% Government Of India 2019 2.68%7.46% Government Of India 2017 2.23%8.3% Government Of India 2042 1.56%8.79% Government Of India 2021 1.56%Other Government Securities 7.15%
9.39% Power Finance Corpn. Ltd. 2019 6.16%9.6% L&T Finance Ltd. 2016 4.49%9% Export Import Bank Of India 2019 3.99%9.4% National Bank For Agri. And Rural Development 2016 3.02%9.47% Power Grid Corpn. Of India Ltd. 2022 2.37%9.35% Power Grid Corpn. Of India Ltd. 2021 1.57%8.9% Steel Authority Of India Ltd. 2019 1.49%10.85% Rural Electrification Corpn. Ltd. 2018 0.95%11% Power Finance Corpn. Ltd. 2018 0.64%9.36% Power Finance Corpn. Ltd. 2021 0.62%Other Corporate Debt 0.32%
Infosys Ltd. 1.78%HDFC Bank Ltd. 1.62%Housing Development Finance Corpn. Ltd. 1.28%ICICI Bank Ltd. 1.20%Reliance Industries Ltd. 1.03%State Bank Of India 0.91%Mahindra And Mahindra Ltd. 0.84%Tata Communications Ltd. 0.74%Larsen And Toubro Ltd. 0.68%Sun Pharmaceutical Inds. Ltd. 0.66%Other Equity 12.60%
GOVERNMENT SECURITIES
CORPORATE DEBT
Equity
MMI, Deposits, CBLO & Others
SECURITIES
40.86%
Holding
25.62%
23.35%
10.17%
NAV as on 27.1230th September 2015: ` BENCHMARK: BSE 100 & Crisil Composite Bond Index & Crisil Liquid Fund Index
Asset held as on ` 33.60 Cr FUND MANAGER: Mr. 30th September 2015: Sumit Poddar (Equity), Mr. Deven Sangoi (Debt)
Fund Update:
Exposure to Equities has slightly decreased to 23.35% from 23.82% and to MMI has decreased to 9.41% from 10.59% on a MOM basis.
Asset Allocation Rating Profile
9
8.51Maturity (in years)
BMBalancer
Maturity Profile
Date of Inception: 18-Jul-05
61.47%
Sovereign
AAA AA+31.79% 6.75%
7.95%Yield to Maturity :
Top 10 Sectoral Allocation
25.62%
NCD
40.86%
G-sec
Equities
23.35%
MMI, Deposits, CBLO & Others
10.17%
2.83%
3.15%
4.35%
5.77%
8.26%
8.57%
8.65%
8.83%
15.39%
23.22%
CEMENT
TELECOMMUNICATION
FMCG
CAPITAL GOODS
OIL AND GAS
AUTOMOBILE
FINANCIAL SERVICES
PHARMACEUTICALS
SOFTWARE / IT
BANKING
24.66%
42.07% 33.27%
Less than 2 years 2 to 7 years 7 years & above
Ma
y-11
Se
p-1
1
Jan
-12
Ma
y-1
2
Se
p-1
2
Jan
-13
Ma
y-1
3
Se
p-1
3
Jan
-14
Ma
y-1
4
Se
p-1
4
Jan
-15
Ma
y-1
5
Se
p-1
5
8.83% Government Of India 2023 4.82%8.6% Government Of India 2028 4.06%9.23% Government Of India 2043 3.11%9.2% Government Of India 2030 2.36%8.15% Government Of India 2022 1.31%7.95% Government Of India 2032 1.22%8.2% Government Of India 2022 1.09%8.26% Government Of India 2027 0.91%7.16% Government Of India 2023 0.88%8.12% Government Of India 2020 0.76%Other Government Securities 8.12%
2% Tata Steel Ltd. 2022 0.86%
10.75% Reliance Industries Ltd. 2018 0.85%
9.05% State Bank Of India 2020 0.71%
9.8% LIC Housing Finance Ltd. 2017 0.48%
9.1% State Bank Of Mysore 2019 0.45%
8.55% Indian Railway Finance Corpn. Ltd. 2019 0.44%
9.48% Rural Electrification Corpn. Ltd. 2021 0.44%
10.85% Punjab National Bank 2023 0.42%
9.02% Rural Electrification Corpn. Ltd. 2022 0.38%
9.15% Larsen And Toubro Ltd. 2020 0.38%
Other Corporate Debt 32.62%
HDFC Bank Ltd. 2.63%Infosys Ltd. 2.40%ICICI Bank Ltd. 1.74%ITC Ltd. 1.71%Housing Development Finance Corpn. Ltd. 1.58%Reliance Industries Ltd. 1.55%Larsen And Toubro Ltd. 1.34%Tata Consultancy Services Ltd. 1.19%State Bank Of India 1.15%Tata Motors Ltd. 1.03%Other Equity 12.15%
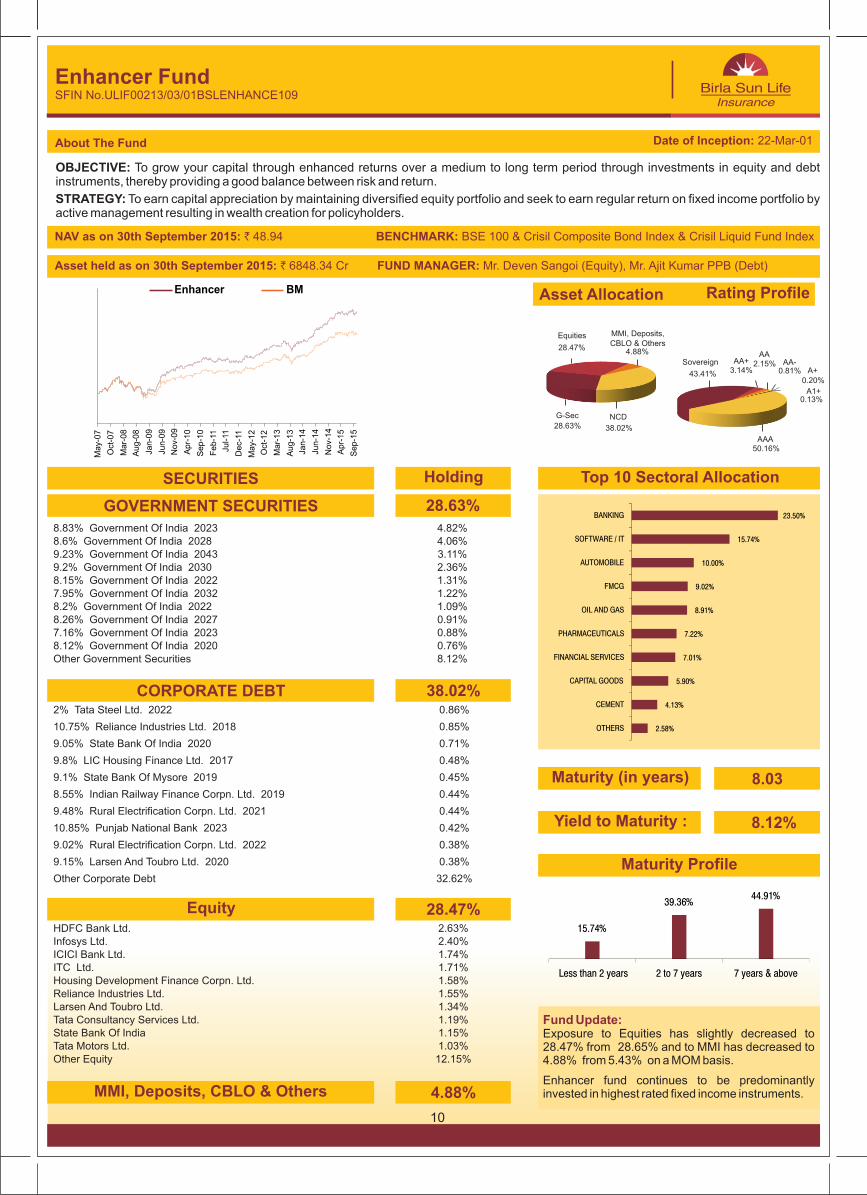
OBJECTIVE: instruments, thereby providing a good balance between risk and return.
STRATEGY: To earn capital appreciation by maintaining diversified equity portfolio and seek to earn regular return on fixed income portfolio by active management resulting in wealth creation for policyholders.
To grow your capital through enhanced returns over a medium to long term period through investments in equity and debt
About The Fund
Enhancer FundSFIN No.ULIF00213/03/01BSLENHANCE109
GOVERNMENT SECURITIES
CORPORATE DEBT
Equity
MMI, Deposits, CBLO & Others
SECURITIES
28.63%
Holding
38.02%
8.03
28.47%
4.88%
NAV as on 48.94 BENCHMARK: 30th September 2015: ` BSE 100 & Crisil Composite Bond Index & Crisil Liquid Fund Index
Asset held as on ` 6848.34 Cr FUND MANAGER: Mr. 30th September 2015: Deven Sangoi (Equity), Mr. Ajit Kumar PPB (Debt)
Fund Update: Exposure to Equities has slightly decreased to 28.47% from 28.65% and to MMI has decreased to 4.88% from 5.43% on a MOM basis.
Enhancer fund continues to be predominantly invested in highest rated fixed income instruments.
Maturity Profile
Maturity (in years)
Top 10 Sectoral Allocation
10
Asset Allocation Rating ProfileBMEnhancer
Date of Inception: 22-Mar-01
38.02%
NCDG-Sec
28.63%
28.47%
Equities MMI, Deposits, CBLO & Others
4.88%
8.12%Yield to Maturity :
Sovereign
43.41%
A1+
0.20%0.81%
AA-
0.13%
A+AA+
3.14%
AA2.15%
50.16%AAA
2.58%
4.13%
5.90%
7.01%
7.22%
8.91%
9.02%
10.00%
15.74%
23.50%
OTHERS
CEMENT
CAPITAL GOODS
FINANCIAL SERVICES
PHARMACEUTICALS
OIL AND GAS
FMCG
AUTOMOBILE
SOFTWARE / IT
BANKING
15.74%
39.36% 44.91%
Less than 2 years 2 to 7 years 7 years & above
May-
07
Oct
-07
Mar-
08
Aug-0
8
Jan-0
9
Jun-0
9
Nov-
09
Apr-
10
Sep-1
0
Feb-1
1
Jul-11
Dec-
11
May-
12
Oct
-12
Mar-
13
Aug-1
3
Jan-1
4
Jun-1
4
Nov-
14
Apr-
15
Sep-1
5
8.83% Government Of India 2023 7.69%
9.23% Government Of India 2043 5.38%
8.33% Government Of India 2026 4.35%
8.28% Government Of India 2027 3.02%
8.15% Government Of India 2022 2.97%
8.6% Government Of India 2028 1.24%
8.2% Government Of India 2025 1.20%
8.24% Government Of India 2027 0.99%
8.13% Government Of India 2022 0.77%
8.28% Government Of India 2032 0.73%
Other Government Securities 2.78%
9.4% Rural Electrification Corpn. Ltd. 2021 4.42%
11% Power Finance Corpn. Ltd. 2018 1.38%
8.85% Axis Bank Ltd. 2024 1.21%
8.82% Rural Electrification Corpn. Ltd. 2023 1.21%
8.72% Kotak Mahindra Bank Ltd. 2022 1.19%
8.5% NHPC Ltd. 2023 1.19%
8.45% Indian Railway Finance Corpn. Ltd. 2018 1.19%
8.76% HDB Financial Services Ltd 2017 1.17%
8.9% Steel Authority Of India Ltd. 2019 1.05%
9.39% Power Finance Corpn. Ltd. 2024 0.88%
Other Corporate Debt 5.11%
Infosys Ltd. 3.47%
HDFC Bank Ltd. 3.27%
ITC Ltd. 2.51%
Reliance Industries Ltd. 2.35%
ICICI Bank Ltd. 2.25%
Larsen And Toubro Ltd. 2.23%
Housing Development Finance Corpn. Ltd. 2.14%
Axis Bank Ltd. 1.62%
State Bank Of India 1.56%
Tata Consultancy Services Ltd. 1.52%
Other Equity 23.69%
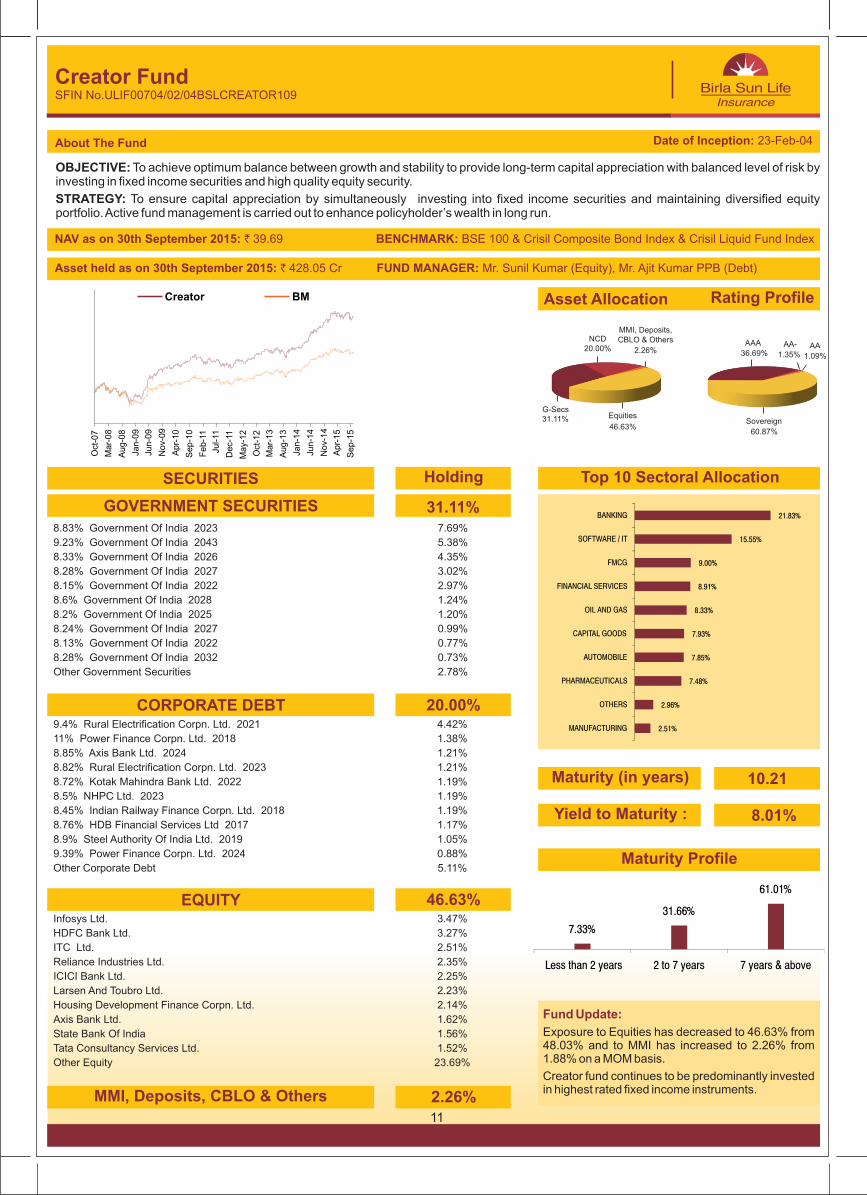
OBJECTIVE: investing in fixed income securities and high quality equity security.
STRATEGY: To ensure capital appreciation by simultaneously investing into fixed income securities and maintaining diversified equity portfolio. Active fund management is carried out to enhance policyholder’s wealth in long run.
To achieve optimum balance between growth and stability to provide long-term capital appreciation with balanced level of risk by
About The Fund
Creator FundSFIN No.ULIF00704/02/04BSLCREATOR109
GOVERNMENT SECURITIES
CORPORATE DEBT
EQUITY
MMI, Deposits, CBLO & Others
SECURITIES
31.11%
Holding
20.00%
10.21
46.63%
2.26%
NAV as on 39.69 BENCHMARK: 30th September 2015: ` BSE 100 & Crisil Composite Bond Index & Crisil Liquid Fund Index
Asset held as on ` 428.05 Cr FUND MANAGER: Mr. 30th September 2015: Sunil Kumar (Equity), Mr. Ajit Kumar PPB (Debt)
Fund Update:
Exposure to Equities has decreased to 46.63% from 48.03% and to MMI has increased to 2.26% from 1.88% on a MOM basis.
Creator fund continues to be predominantly invested in highest rated fixed income instruments.
Maturity Profile
Maturity (in years)
Top 10 Sectoral Allocation
Asset Allocation Rating Profile
11
Creator BM
Date of Inception: 23-Feb-04
8.01%Yield to Maturity :
46.63%
Equities
MMI, Deposits, CBLO & Others
2.26%20.00%NCD
31.11%G-Secs
60.87%
Sovereign
AA-
1.35%
AAA
36.69%AA
1.09%
2.51%
2.96%
7.48%
7.85%
7.93%
8.33%
8.91%
9.00%
15.55%
21.83%
MANUFACTURING
OTHERS
PHARMACEUTICALS
AUTOMOBILE
CAPITAL GOODS
OIL AND GAS
FINANCIAL SERVICES
FMCG
SOFTWARE / IT
BANKING
7.33%
31.66%
61.01%
Less than 2 years 2 to 7 years 7 years & above
Oct
-07
Ma
r-0
8
Au
g-0
8
Jan
-09
Jun
-09
No
v-0
9
Ap
r-1
0
Se
p-1
0
Fe
b-1
1
Jul-11
De
c-11
Ma
y-1
2
Oct
-12
Ma
r-1
3
Au
g-1
3
Jan
-14
Jun
-14
No
v-1
4
Ap
r-1
5
Se
p-1
5
8.99% Tata Capital Financial Services Limited 2017 0.61%
9.6% Housing Development Finance Corpn. Ltd. 2017 0.47%
10.18% LIC Housing Finance Ltd. 2016 0.14%
8.84% Power Grid Corpn. Of India Ltd. 2016 0.14%
9.7% National Bank For Agri. And Rural Development 2016 0.08%
8.8% HDB Financial Services Ltd 2016 0.06%
Infosys Ltd. 7.30%
HDFC Bank Ltd. 7.23%
ICICI Bank Ltd. 4.91%
Reliance Industries Ltd. 4.87%
ITC Ltd. 4.52%
Housing Development Finance Corpn. Ltd. 4.42%
Larsen And Toubro Ltd. 3.84%
Tata Consultancy Services Ltd. 3.28%
State Bank Of India 3.00%
Tata Motors Ltd. 2.86%
Other Equity 39.95%
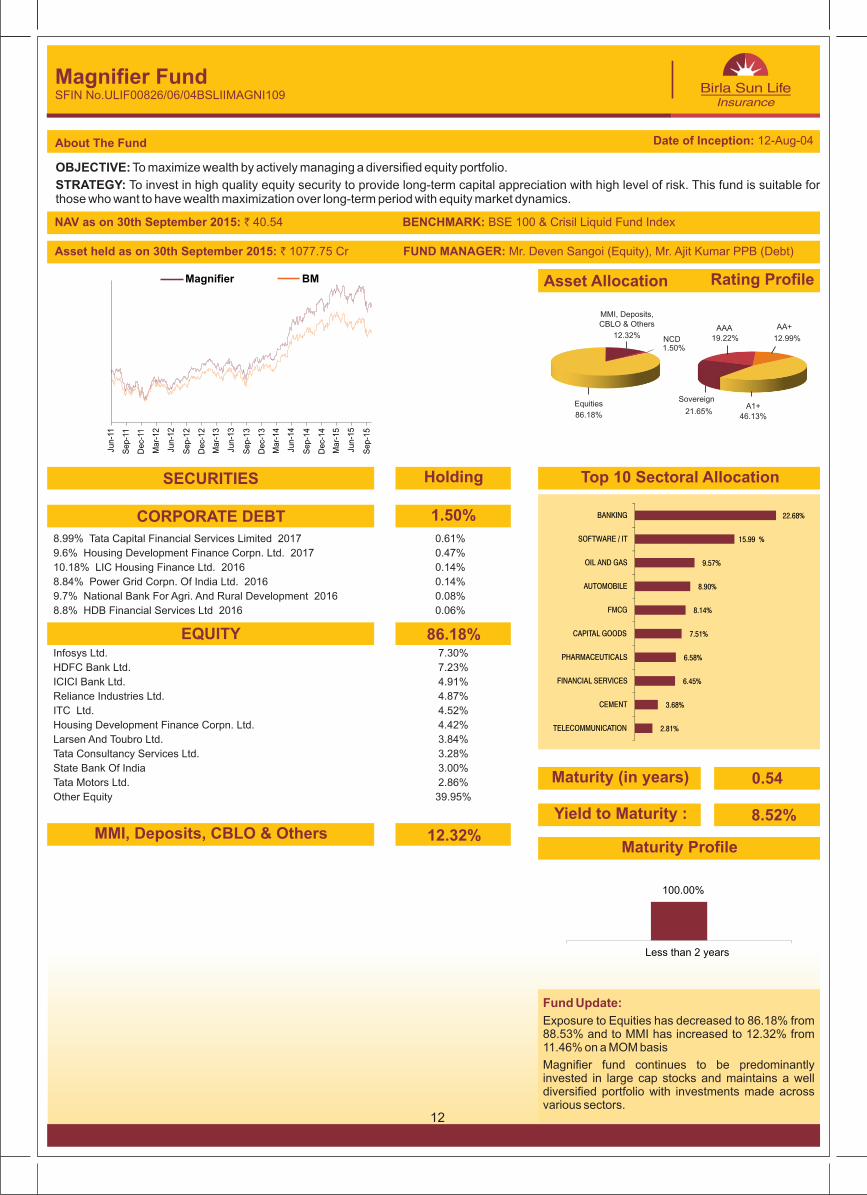
OBJECTIVE:
STRATEGY: To invest in high quality equity security to provide long-term capital appreciation with high level of risk. This fund is suitable for those who want to have wealth maximization over long-term period with equity market dynamics.
To maximize wealth by actively managing a diversified equity portfolio.
About The Fund
Magnifier FundSFIN No.ULIF00826/06/04BSLIIMAGNI109
CORPORATE DEBT
EQUITY
MMI, Deposits, CBLO & Others
SECURITIES
Asset Allocation Rating Profile
1.50%
Holding
86.18%
0.54
12.32%
NAV as on 40.54 BENCHMARK: 30th September 2015: ` BSE 100 & Crisil Liquid Fund Index
Asset held as on ` 1077.75 Cr FUND MANAGER: Mr. 30th September 2015: Deven Sangoi (Equity), Mr. Ajit Kumar PPB (Debt)
Fund Update:
Exposure to Equities has decreased to 86.18% from 88.53% and to MMI has increased to 12.32% from 11.46% on a MOM basis
Magnifier fund continues to be predominantly invested in large cap stocks and maintains a well diversified portfolio with investments made across various sectors.
Maturity Profile
Maturity (in years)
Top 10 Sectoral Allocation
12
Date of Inception: 12-Aug-04
100.00%
Less than 2 years
Magnifier BM
8.52%Yield to Maturity :
2.81%
3.68%
6.45%
6.58%
7.51%
8.14%
8.90%
9.57%
15.99 %
22.68%
TELECOMMUNICATION
CEMENT
FINANCIAL SERVICES
PHARMACEUTICALS
CAPITAL GOODS
FMCG
AUTOMOBILE
OIL AND GAS
SOFTWARE / IT
BANKING
MMI, Deposits, CBLO & Others
12.32% NCD1.50%
86.18%
EquitiesSovereign
21.65%
12.99%
AA+
46.13%
A1+
19.22%
AAA
Jun
-11
Se
p-1
1
De
c-11
Ma
r-1
2
Jun
-12
Se
p-1
2
De
c-1
2
Ma
r-1
3
Jun
-13
Se
p-1
3
De
c-1
3
Ma
r-1
4
Jun
-14
Se
p-1
4
De
c-1
4
Ma
r-1
5
Jun
-15
Se
p-1
5
Infosys Ltd. 8.01%
HDFC Bank Ltd. 6.66%
Reliance Industries Ltd. 5.55%
ICICI Bank Ltd. 5.49%
Larsen And Toubro Ltd. 5.12%
Housing Development Finance Corpn. Ltd. 4.18%
Tata Consultancy Services Ltd. 4.04%
State Bank Of India 3.43%
Maruti Suzuki India Ltd. 3.32%
Axis Bank Ltd. 3.15%
Other Equity 45.44%
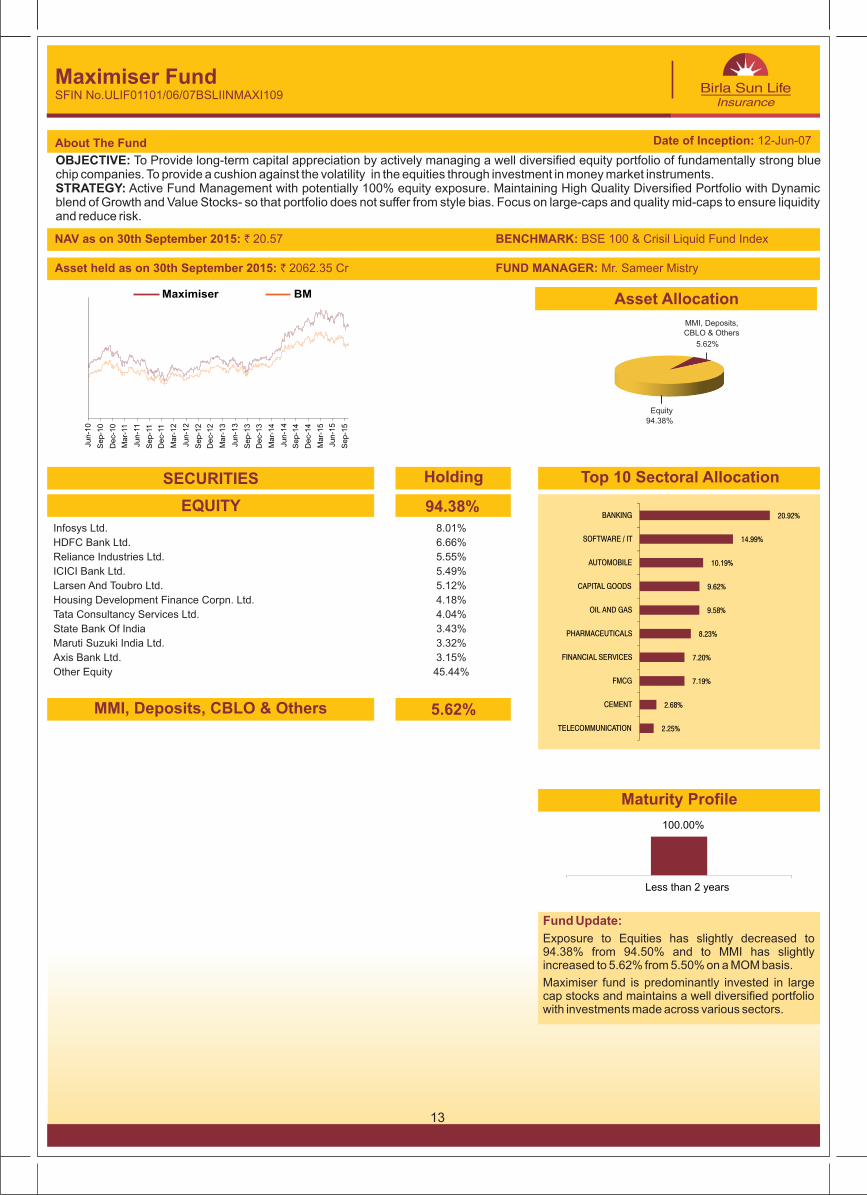
OBJECTIVE: chip companies. To provide a cushion against the volatility in the equities through investment in money market instruments.STRATEGY: Active Fund Management with potentially 100% equity exposure. Maintaining High Quality Diversified Portfolio with Dynamic blend of Growth and Value Stocks- so that portfolio does not suffer from style bias. Focus on large-caps and quality mid-caps to ensure liquidity and reduce risk.
To Provide long-term capital appreciation by actively managing a well diversified equity portfolio of fundamentally strong blue
About The Fund
Maximiser FundSFIN No.ULIF01101/06/07BSLIINMAXI109
EQUITY
MMI, Deposits, CBLO & Others
SECURITIES
94.38%
Holding
5.62%
NAV as on 20.57 BENCHMARK: 30th September 2015: ` BSE 100 & Crisil Liquid Fund Index
Asset held as on ` 2062.35 Cr FUND MANAGER: Mr. 30th September 2015: Sameer Mistry
Fund Update:
Exposure to Equities has slightly decreased to 94.38% from 94.50% and to MMI has slightly increased to 5.62% from 5.50% on a MOM basis.
Maximiser fund is predominantly invested in large cap stocks and maintains a well diversified portfolio with investments made across various sectors.
Maturity Profile
Top 10 Sectoral Allocation
13
Maximiser BM
Date of Inception: 12-Jun-07
100.00%
Less than 2 years
Asset Allocation
94.38%
Equity
5.62%
MMI, Deposits, CBLO & Others
2.25%
2.68%
7.19%
7.20%
8.23%
9.58%
9.62%
10.19%
14.99%
20.92%
TELECOMMUNICATION
CEMENT
FMCG
FINANCIAL SERVICES
PHARMACEUTICALS
OIL AND GAS
CAPITAL GOODS
AUTOMOBILE
SOFTWARE / IT
BANKING
Ju
n-1
0
Se
p-1
0
De
c-1
0
Ma
r-11
Ju
n-1
1
Se
p-1
1
De
c-1
1
Ma
r-1
2
Ju
n-1
2
Se
p-1
2
De
c-1
2
Ma
r-1
3
Ju
n-1
3
Se
p-1
3
De
c-1
3
Ma
r-1
4
Ju
n-1
4
Se
p-1
4
De
c-1
4
Ma
r-1
5
Ju
n-1
5
Se
p-1
5
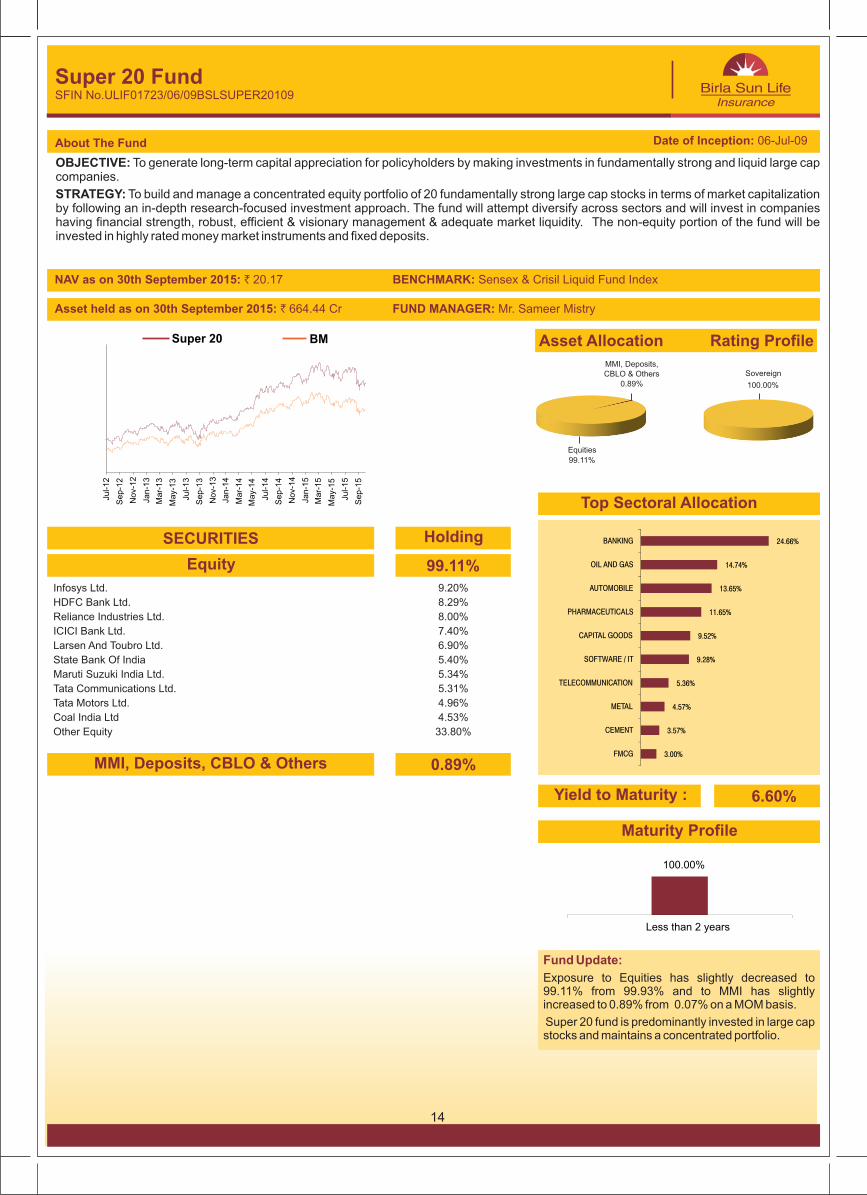
Infosys Ltd. 9.20%
HDFC Bank Ltd. 8.29%
Reliance Industries Ltd. 8.00%
ICICI Bank Ltd. 7.40%
Larsen And Toubro Ltd. 6.90%
State Bank Of India 5.40%
Maruti Suzuki India Ltd. 5.34%
Tata Communications Ltd. 5.31%
Tata Motors Ltd. 4.96%
Coal India Ltd 4.53%
Other Equity 33.80%
OBJECTIVE: companies.
STRATEGY: To build and manage a concentrated equity portfolio of 20 fundamentally strong large cap stocks in terms of market capitalization by following an in-depth research-focused investment approach. The fund will attempt diversify across sectors and will invest in companies having financial strength, robust, efficient & visionary management & adequate market liquidity. The non-equity portion of the fund will be invested in highly rated money market instruments and fixed deposits.
To generate long-term capital appreciation for policyholders by making investments in fundamentally strong and liquid large cap
About The Fund
Super 20 FundSFIN No.ULIF01723/06/09BSLSUPER20109
Equity
MMI, Deposits, CBLO & Others
SECURITIES
99.11%
Holding
0.89%
NAV as on 20.17 BENCHMARK: Sensex & 30th September 2015: ` Crisil Liquid Fund Index
Asset held as on ` 664.44 Cr FUND MANAGER: Mr. 30th September 2015: Sameer Mistry
Fund Update:
Exposure to Equities has slightly decreased to 99.11% from 99.93% and to MMI has slightly increased to 0.89% from 0.07% on a MOM basis.
Super 20 fund is predominantly invested in large cap stocks and maintains a concentrated portfolio.
Top Sectoral Allocation
14
100.00%
Less than 2 years
Asset Allocation
Maturity Profile
Date of Inception: 06-Jul-09
Super 20 BM
99.11%
Equities
MMI, Deposits, CBLO & Others
0.89%
3.00%
3.57%
4.57%
5.36%
9.28%
9.52%
11.65%
13.65%
14.74%
24.66%
FMCG
CEMENT
METAL
TELECOMMUNICATION
SOFTWARE / IT
CAPITAL GOODS
PHARMACEUTICALS
AUTOMOBILE
OIL AND GAS
BANKING
6.60%Yield to Maturity :
Rating Profile
Sovereign
100.00%
Ju
l-1
2
Se
p-1
2
No
v-1
2
Ja
n-1
3
Ma
r-1
3
Ma
y-1
3
Ju
l-1
3
Se
p-1
3
No
v-1
3
Ja
n-1
4
Ma
r-1
4
Ma
y-1
4
Ju
l-1
4
Se
p-1
4
No
v-1
4
Ja
n-1
5
Ma
r-1
5
Ma
y-1
5
Ju
l-1
5
Se
p-1
5
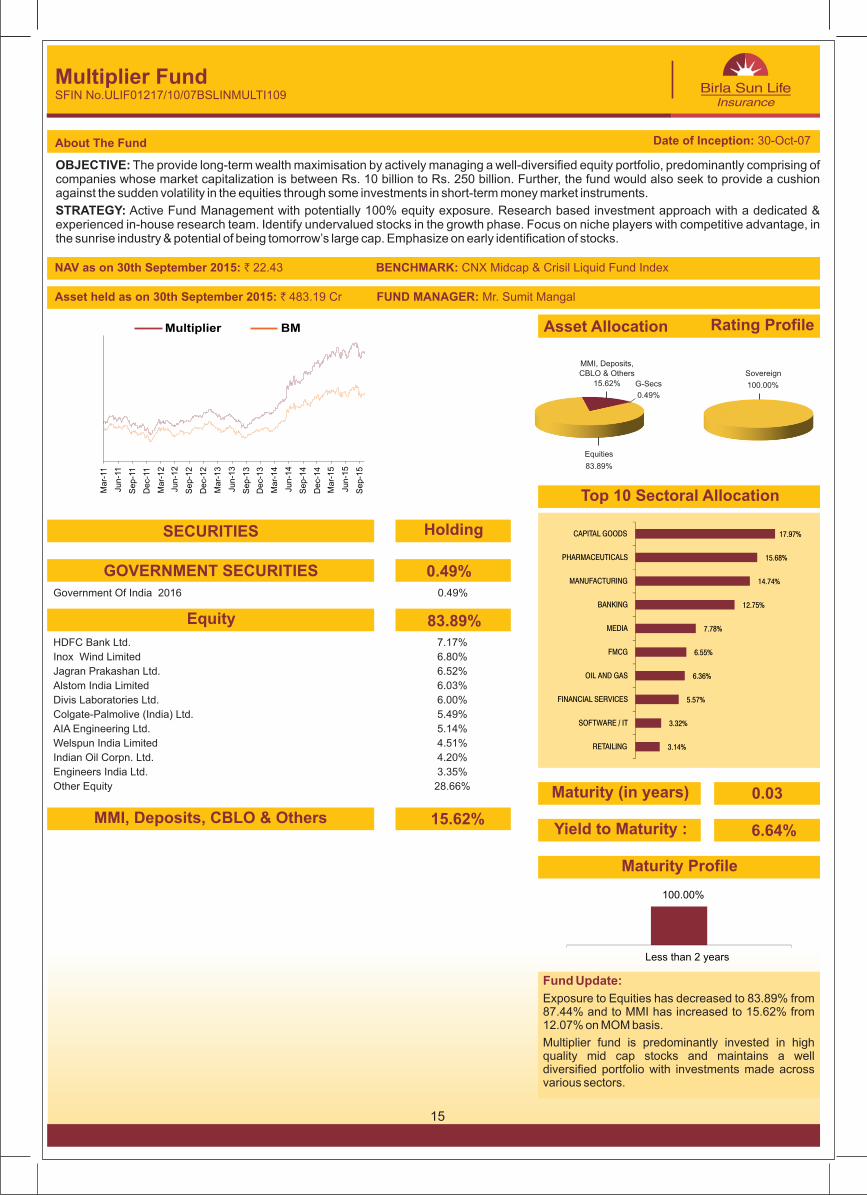
HDFC Bank Ltd. 7.17%
Inox Wind Limited 6.80%
Jagran Prakashan Ltd. 6.52%
Alstom India Limited 6.03%
Divis Laboratories Ltd. 6.00%
Colgate-Palmolive (India) Ltd. 5.49%
AIA Engineering Ltd. 5.14%
Welspun India Limited 4.51%
Indian Oil Corpn. Ltd. 4.20%
Engineers India Ltd. 3.35%
Other Equity 28.66%
OBJECTIVE: companies whose market capitalization is between Rs. 10 billion to Rs. 250 billion. Further, the fund would also seek to provide a cushion against the sudden volatility in the equities through some investments in short-term money market instruments.
STRATEGY: Active Fund Management with potentially 100% equity exposure. Research based investment approach with a dedicated & experienced in-house research team. Identify undervalued stocks in the growth phase. Focus on niche players with competitive advantage, in the sunrise industry & potential of being tomorrow’s large cap. Emphasize on early identification of stocks.
The provide long-term wealth maximisation by actively managing a well-diversified equity portfolio, predominantly comprising of
About The Fund
Multiplier FundSFIN No.ULIF01217/10/07BSLINMULTI109
Equity
MMI, Deposits, CBLO & Others
SECURITIES
Asset Allocation Rating Profile
83.89%
Holding
15.62%
NAV as on 22.43 BENCHMARK: CNX Midcap & 30th September 2015: ` Crisil Liquid Fund Index
Asset held as on ` 483.19 Cr FUND MANAGER: Mr. Sumit Mangal30th September 2015:
Fund Update:
Exposure to Equities has decreased to 83.89% from 87.44% and to MMI has increased to 15.62% from 12.07% on MOM basis.
Multiplier fund is predominantly invested in high quality mid cap stocks and maintains a well diversified portfolio with investments made across various sectors.
Maturity Profile
Top 10 Sectoral Allocation
Multiplier BM
15
100.00%
Less than 2 years
Date of Inception: 30-Oct-07
Government Of India 2016 0.49%
GOVERNMENT SECURITIES 0.49%
6.64%Yield to Maturity :
0.03Maturity (in years)
Sovereign
100.00%
3.14%
3.32%
5.57%
6.36%
6.55%
7.78%
12.75%
14.74%
15.68%
17.97%
RETAILING
SOFTWARE / IT
FINANCIAL SERVICES
OIL AND GAS
FMCG
MEDIA
BANKING
MANUFACTURING
PHARMACEUTICALS
CAPITAL GOODS
MMI, Deposits, CBLO & Others
15.62% G-Secs
0.49%
83.89%
Equities
Mar-
11
Jun-1
1
Sep-1
1
Dec-
11
Mar-
12
Jun-1
2
Sep-1
2
Dec-
12
Mar-
13
Jun-1
3
Sep-1
3
Dec-
13
Mar-
14
Jun-1
4
Sep-1
4
Dec-
14
Mar-
15
Jun-1
5
Sep-1
5
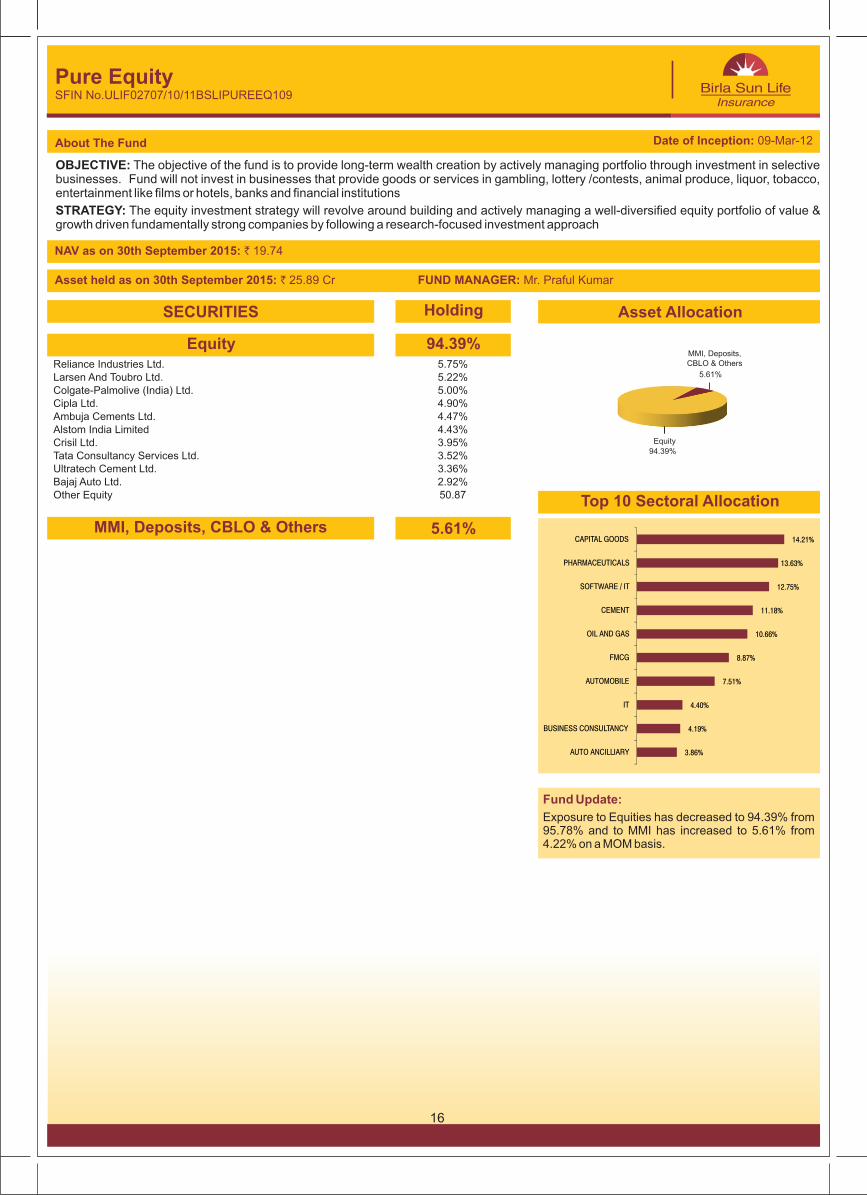
OBJECTIVE: The objective of the fund is to provide long-term wealth creation by actively managing portfolio through investment in selective businesses. Fund will not invest in businesses that provide goods or services in gambling, lottery /contests, animal produce, liquor, tobacco, entertainment like films or hotels, banks and financial institutions
STRATEGY: The equity investment strategy will revolve around building and actively managing a well-diversified equity portfolio of value & growth driven fundamentally strong companies by following a research-focused investment approach
About The Fund
Pure EquitySFIN No.ULIF02707/10/11BSLIPUREEQ109
NAV as on 19.7430th September 2015: `
Asset held as on ` 25.89 Cr FUND MANAGER: Mr. 30th September 2015: Praful Kumar
Fund Update:
Exposure to Equities has decreased to 94.39% from 95.78% and to MMI has increased to 5.61% from 4.22% on a MOM basis.
SECURITIES Holding
Reliance Industries Ltd. 5.75%Larsen And Toubro Ltd. 5.22%Colgate-Palmolive (India) Ltd. 5.00%Cipla Ltd. 4.90%Ambuja Cements Ltd. 4.47%Alstom India Limited 4.43%Crisil Ltd. 3.95%Tata Consultancy Services Ltd. 3.52%Ultratech Cement Ltd. 3.36%Bajaj Auto Ltd. 2.92%Other Equity 50.87
Equity 94.39%
MMI, Deposits, CBLO & Others 5.61%
Asset Allocation
Top 10 Sectoral Allocation
16
Date of Inception: 09-Mar-12
94.39%
Equity
5.61%
MMI, Deposits, CBLO & Others
3.86%
4.19%
4.40%
7.51%
8.87%
10.66%
11.18%
12.75%
13.63%
14.21%
AUTO ANCILLIARY
BUSINESS CONSULTANCY
IT
AUTOMOBILE
FMCG
OIL AND GAS
CEMENT
SOFTWARE / IT
PHARMACEUTICALS
CAPITAL GOODS
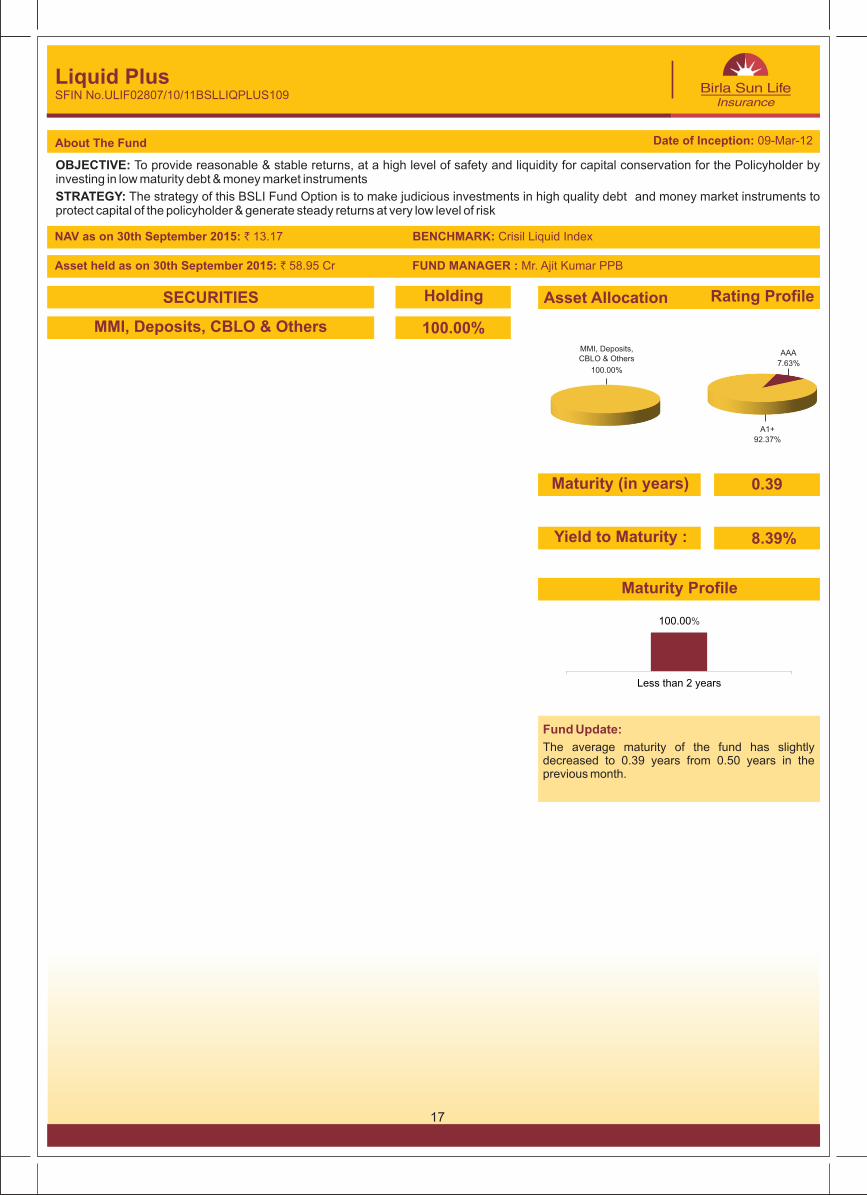
OBJECTIVE: To provide reasonable & stable returns, at a high level of safety and liquidity for capital conservation for the Policyholder by investing in low maturity debt & money market instruments
STRATEGY: The strategy of this BSLI Fund Option is to make judicious investments in high quality debt and money market instruments to protect capital of the policyholder & generate steady returns at very low level of risk
About The Fund
Liquid PlusSFIN No.ULIF02807/10/11BSLLIQPLUS109
MMI, Deposits, CBLO & Others
SECURITIES Holding
100.00%
NAV as on 13.17 BENCHMARK: 30th September 2015: ` Crisil Liquid Index
Asset held as on ` 58.95 Cr FUND MANAGER : Mr. 30th September 2015: Ajit Kumar PPB
Fund Update:
The average maturity of the fund has slightly decreased to 0.39 years from 0.50 years in the previous month.
Asset Allocation Rating Profile
Maturity Profile
17
0.39Maturity (in years)
100.00%
Less than 2 years
MMI, Deposits, CBLO & Others
100.00%
Date of Inception: 09-Mar-12
A1+
92.37%
AAA
7.63%
8.39%Yield to Maturity :
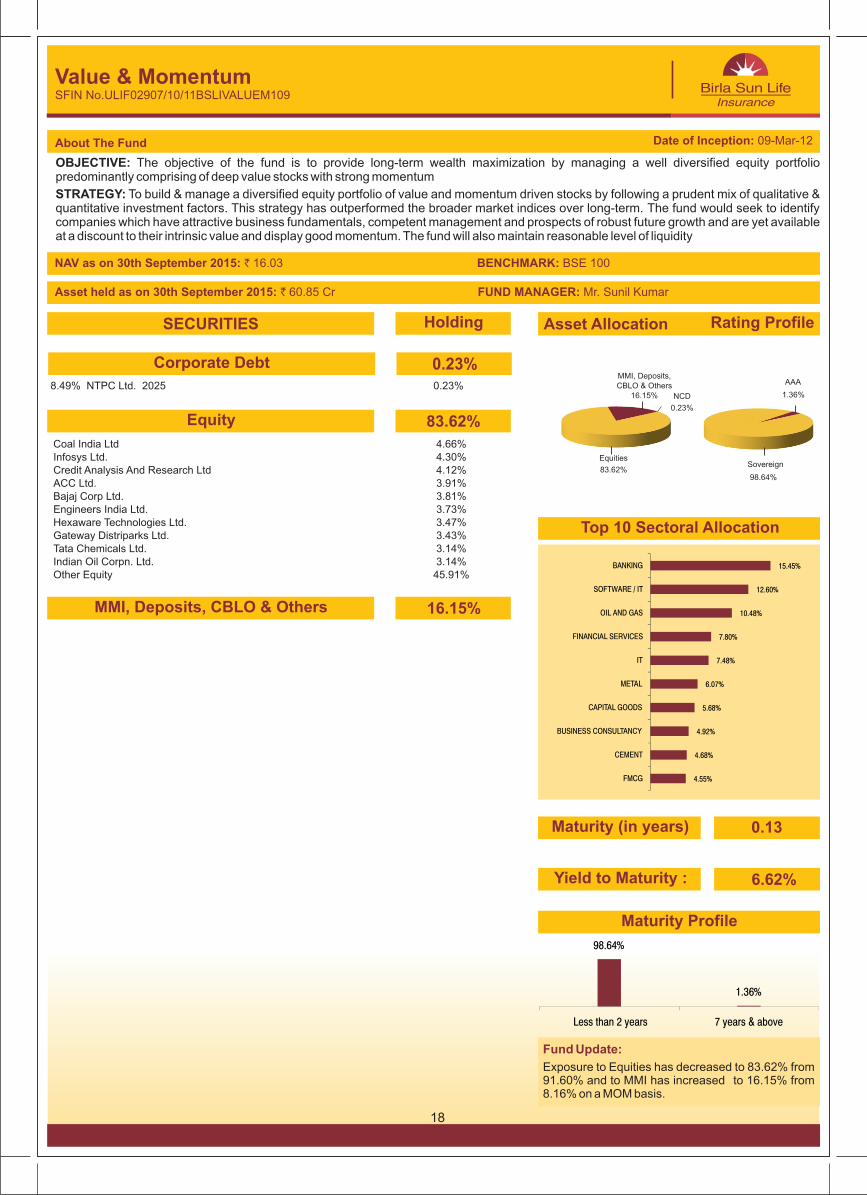
OBJECTIVE: The objective of the fund is to provide long-term wealth maximization by managing a well diversified equity portfolio predominantly comprising of deep value stocks with strong momentum
STRATEGY: To build & manage a diversified equity portfolio of value and momentum driven stocks by following a prudent mix of qualitative & quantitative investment factors. This strategy has outperformed the broader market indices over long-term. The fund would seek to identify companies which have attractive business fundamentals, competent management and prospects of robust future growth and are yet available at a discount to their intrinsic value and display good momentum. The fund will also maintain reasonable level of liquidity
About The Fund
Value & MomentumSFIN No.ULIF02907/10/11BSLIVALUEM109
NAV as on 16.03 BENCHMARK: 30th September 2015: ` BSE 100
Asset held as on ` 60.85 Cr FUND MANAGER: Mr. 30th September 2015: Sunil Kumar
Fund Update:
Exposure to Equities has decreased to 83.62% from 91.60% and to MMI has increased to 16.15% from 8.16% on a MOM basis.
SECURITIES Holding
Coal India Ltd 4.66%Infosys Ltd. 4.30%Credit Analysis And Research Ltd 4.12%ACC Ltd. 3.91%Bajaj Corp Ltd. 3.81%Engineers India Ltd. 3.73%Hexaware Technologies Ltd. 3.47%Gateway Distriparks Ltd. 3.43%Tata Chemicals Ltd. 3.14%Indian Oil Corpn. Ltd. 3.14%Other Equity 45.91%
Equity 83.62%
MMI, Deposits, CBLO & Others
Corporate Debt
16.15%
0.23%
Asset Allocation Rating Profile
Top 10 Sectoral Allocation
18
Maturity Profile
Date of Inception: 09-Mar-12
0.13Maturity (in years)
8.49% NTPC Ltd. 2025 0.23%
Sovereign
98.64%
AAA
1.36%
6.62%Yield to Maturity :
4.55%
4.68%
4.92%
5.68%
6.07%
7.48%
7.80%
10.48%
12.60%
15.45%
FMCG
CEMENT
BUSINESS CONSULTANCY
CAPITAL GOODS
METAL
IT
FINANCIAL SERVICES
OIL AND GAS
SOFTWARE / IT
BANKING
98.64%
1.36%
Less than 2 years 7 years & above
83.62%
Equities
0.23%
NCD
MMI, Deposits, CBLO & Others
16.15%
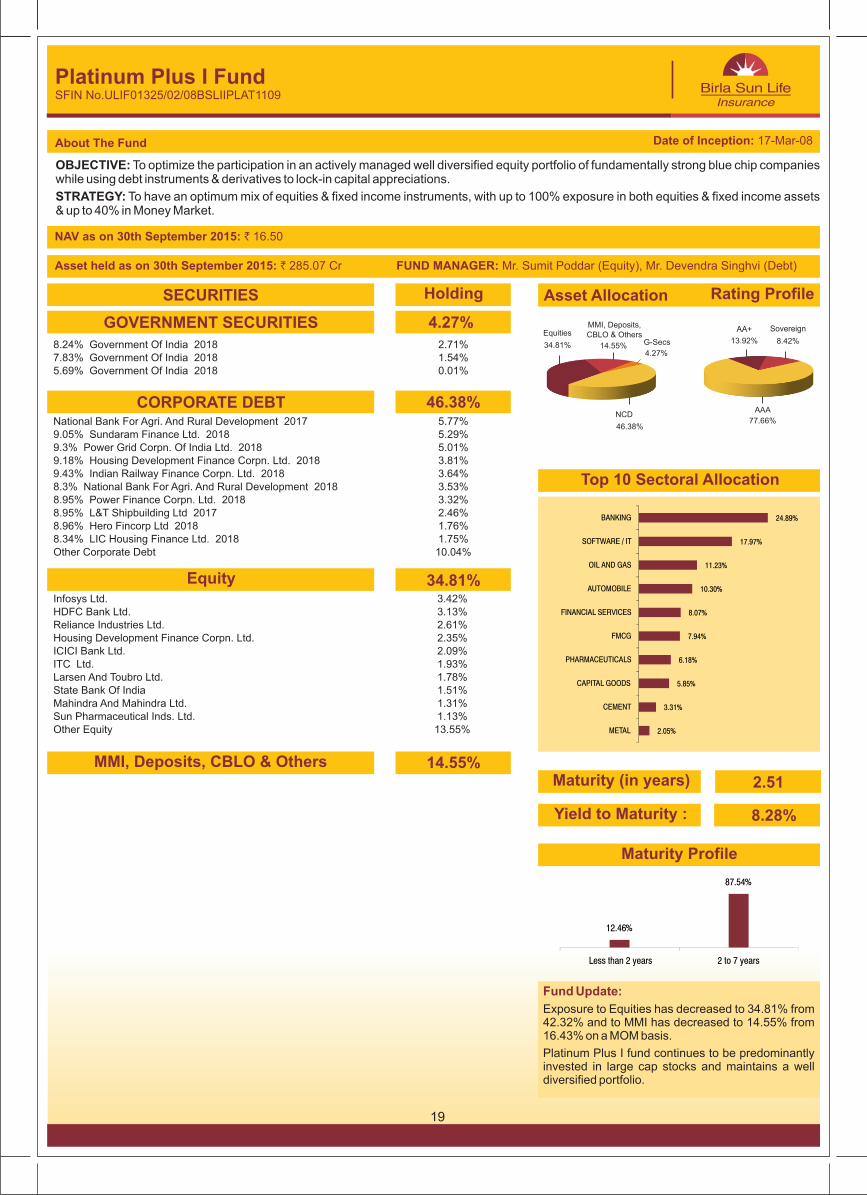
OBJECTIVE: while using debt instruments & derivatives to lock-in capital appreciations.
STRATEGY: To have an optimum mix of equities & fixed income instruments, with up to 100% exposure in both equities & fixed income assets & up to 40% in Money Market.
To optimize the participation in an actively managed well diversified equity portfolio of fundamentally strong blue chip companies
About The Fund
Platinum Plus I FundSFIN No.ULIF01325/02/08BSLIIPLAT1109
8.24% Government Of India 2018 2.71%7.83% Government Of India 2018 1.54%5.69% Government Of India 2018 0.01%
National Bank For Agri. And Rural Development 2017 5.77%9.05% Sundaram Finance Ltd. 2018 5.29%9.3% Power Grid Corpn. Of India Ltd. 2018 5.01%9.18% Housing Development Finance Corpn. Ltd. 2018 3.81%9.43% Indian Railway Finance Corpn. Ltd. 2018 3.64%8.3% National Bank For Agri. And Rural Development 2018 3.53%8.95% Power Finance Corpn. Ltd. 2018 3.32%8.95% L&T Shipbuilding Ltd 2017 2.46%8.96% Hero Fincorp Ltd 2018 1.76%8.34% LIC Housing Finance Ltd. 2018 1.75%Other Corporate Debt 10.04%
Infosys Ltd. 3.42%HDFC Bank Ltd. 3.13%Reliance Industries Ltd. 2.61%Housing Development Finance Corpn. Ltd. 2.35%ICICI Bank Ltd. 2.09%ITC Ltd. 1.93%Larsen And Toubro Ltd. 1.78%State Bank Of India 1.51%Mahindra And Mahindra Ltd. 1.31%Sun Pharmaceutical Inds. Ltd. 1.13%Other Equity 13.55%
GOVERNMENT SECURITIES
CORPORATE DEBT
Equity
MMI, Deposits, CBLO & Others
SECURITIES
4.27%
Holding
46.38%
34.81%
14.55%
NAV as on 16.5030th September 2015: `
Asset held as on ` 285.07 Cr FUND MANAGER: Mr. 30th September 2015: Sumit Poddar (Equity), Mr. Devendra Singhvi (Debt)
Fund Update:
Exposure to Equities has decreased to 34.81% from 42.32% and to MMI has decreased to 14.55% from 16.43% on a MOM basis.
Platinum Plus I fund continues to be predominantly invested in large cap stocks and maintains a well diversified portfolio.
Asset Allocation Rating Profile
Top 10 Sectoral Allocation
Maturity Profile
19
2.51Maturity (in years)
Date of Inception: 17-Mar-08
77.66%
AAA
13.92%
AA+ Sovereign
8.42%
8.28%Yield to Maturity :
2.05%
3.31%
5.85%
6.18%
7.94%
8.07%
10.30%
11.23%
17.97%
24.89%
METAL
CEMENT
CAPITAL GOODS
PHARMACEUTICALS
FMCG
FINANCIAL SERVICES
AUTOMOBILE
OIL AND GAS
SOFTWARE / IT
BANKING
12.46%
87.54%
Less than 2 years 2 to 7 years
46.38%
NCD
MMI, Deposits, CBLO & Others
G-Secs14.55%4.27%
Equities
34.81%
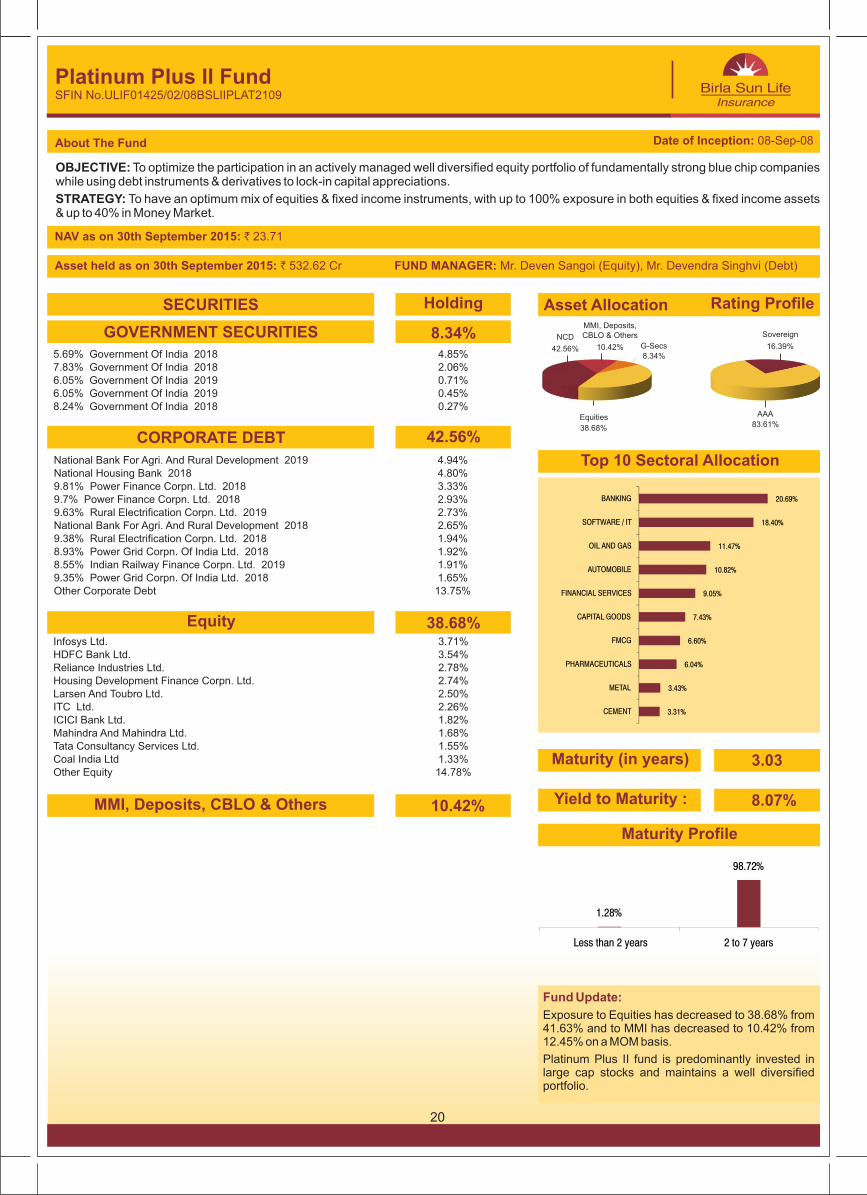
OBJECTIVE: while using debt instruments & derivatives to lock-in capital appreciations.
STRATEGY: To have an optimum mix of equities & fixed income instruments, with up to 100% exposure in both equities & fixed income assets & up to 40% in Money Market.
To optimize the participation in an actively managed well diversified equity portfolio of fundamentally strong blue chip companies
About The Fund
Platinum Plus II FundSFIN No.ULIF01425/02/08BSLIIPLAT2109
5.69% Government Of India 2018 4.85%7.83% Government Of India 2018 2.06%6.05% Government Of India 2019 0.71%6.05% Government Of India 2019 0.45%8.24% Government Of India 2018 0.27%
National Bank For Agri. And Rural Development 2019 4.94%National Housing Bank 2018 4.80%9.81% Power Finance Corpn. Ltd. 2018 3.33%9.7% Power Finance Corpn. Ltd. 2018 2.93%9.63% Rural Electrification Corpn. Ltd. 2019 2.73%National Bank For Agri. And Rural Development 2018 2.65%9.38% Rural Electrification Corpn. Ltd. 2018 1.94%8.93% Power Grid Corpn. Of India Ltd. 2018 1.92%8.55% Indian Railway Finance Corpn. Ltd. 2019 1.91%9.35% Power Grid Corpn. Of India Ltd. 2018 1.65%Other Corporate Debt 13.75%
Infosys Ltd. 3.71%HDFC Bank Ltd. 3.54%Reliance Industries Ltd. 2.78%Housing Development Finance Corpn. Ltd. 2.74%Larsen And Toubro Ltd. 2.50%ITC Ltd. 2.26%ICICI Bank Ltd. 1.82%Mahindra And Mahindra Ltd. 1.68%Tata Consultancy Services Ltd. 1.55%Coal India Ltd 1.33%Other Equity 14.78%
GOVERNMENT SECURITIES
CORPORATE DEBT
Equity
MMI, Deposits, CBLO & Others
SECURITIES
8.34%
Holding
42.56%
38.68%
10.42%
NAV as on 23.7130th September 2015: `
Asset held as on ` 532.62 Cr FUND MANAGER: Mr. 30th September 2015: Deven Sangoi (Equity), Mr. Devendra Singhvi (Debt)
Fund Update:
Exposure to Equities has decreased to 38.68% from 41.63% and to MMI has decreased to 10.42% from 12.45% on a MOM basis.
Platinum Plus II fund is predominantly invested in large cap stocks and maintains a well diversified portfolio.
Maturity Profile
Asset Allocation Rating Profile
Top 10 Sectoral Allocation
20
3.03Maturity (in years)
Date of Inception: 08-Sep-08
83.61%
AAA
Sovereign
16.39%
8.07%Yield to Maturity :
38.68%
Equities
NCD
42.56% G-Secs
MMI, Deposits, CBLO & Others
10.42%8.34%
3.31%
3.43%
6.04%
6.60%
7.43%
9.05%
10.82%
11.47%
18.40%
20.69%
CEMENT
METAL
PHARMACEUTICALS
FMCG
CAPITAL GOODS
FINANCIAL SERVICES
AUTOMOBILE
OIL AND GAS
SOFTWARE / IT
BANKING
1.28%
98.72%
Less than 2 years 2 to 7 years
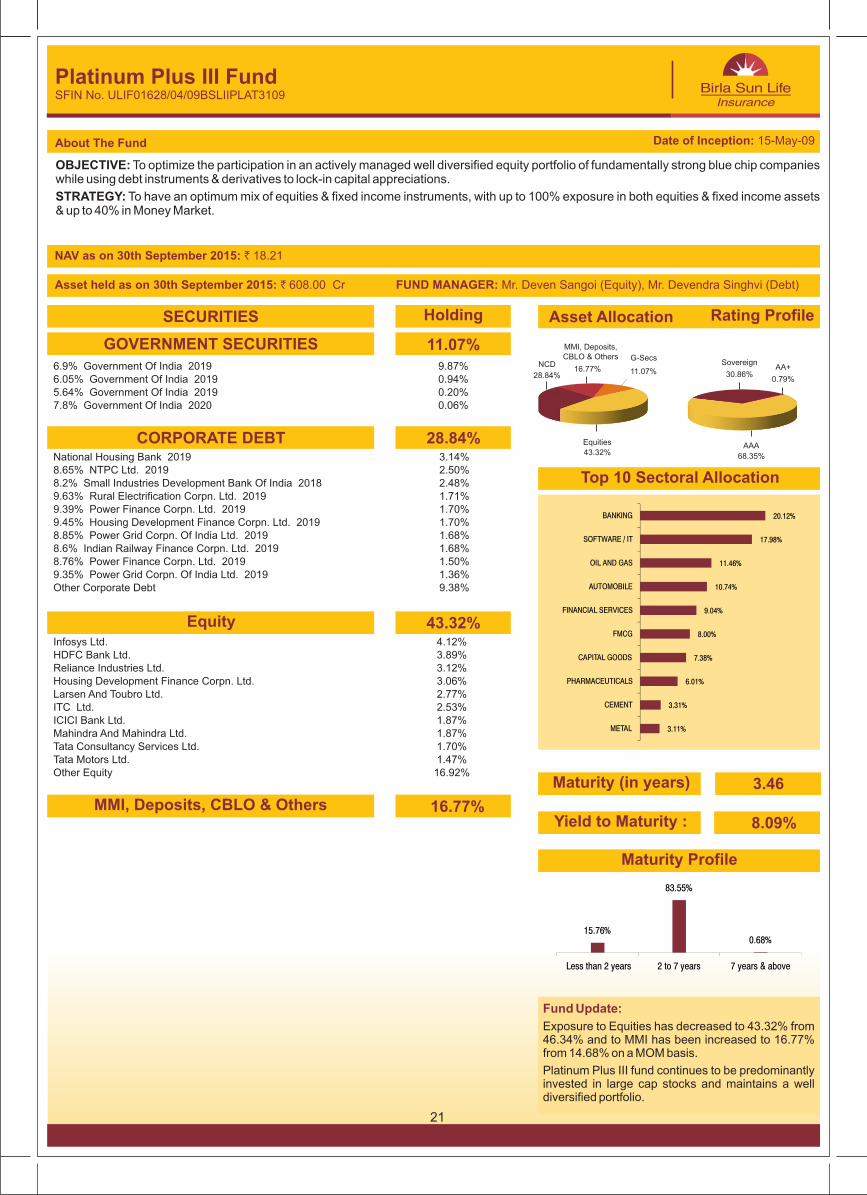
OBJECTIVE: while using debt instruments & derivatives to lock-in capital appreciations.
STRATEGY: To have an optimum mix of equities & fixed income instruments, with up to 100% exposure in both equities & fixed income assets & up to 40% in Money Market.
To optimize the participation in an actively managed well diversified equity portfolio of fundamentally strong blue chip companies
About The Fund
Platinum Plus III FundSFIN No. ULIF01628/04/09BSLIIPLAT3109
6.9% Government Of India 2019 9.87%6.05% Government Of India 2019 0.94%5.64% Government Of India 2019 0.20%7.8% Government Of India 2020 0.06%
National Housing Bank 2019 3.14%8.65% NTPC Ltd. 2019 2.50%8.2% Small Industries Development Bank Of India 2018 2.48%9.63% Rural Electrification Corpn. Ltd. 2019 1.71%9.39% Power Finance Corpn. Ltd. 2019 1.70%9.45% Housing Development Finance Corpn. Ltd. 2019 1.70%8.85% Power Grid Corpn. Of India Ltd. 2019 1.68%8.6% Indian Railway Finance Corpn. Ltd. 2019 1.68%8.76% Power Finance Corpn. Ltd. 2019 1.50%9.35% Power Grid Corpn. Of India Ltd. 2019 1.36%Other Corporate Debt 9.38%
Infosys Ltd. 4.12%HDFC Bank Ltd. 3.89%Reliance Industries Ltd. 3.12%Housing Development Finance Corpn. Ltd. 3.06%Larsen And Toubro Ltd. 2.77%ITC Ltd. 2.53%ICICI Bank Ltd. 1.87%Mahindra And Mahindra Ltd. 1.87%Tata Consultancy Services Ltd. 1.70%Tata Motors Ltd. 1.47%Other Equity 16.92%
GOVERNMENT SECURITIES
CORPORATE DEBT
Equity
MMI, Deposits, CBLO & Others
SECURITIES
11.07%
Holding
28.84%
43.32%
16.77%
NAV as on 18.2130th September 2015: `
Asset held as on ` 608.00 Cr FUND MANAGER: Mr. 30th September 2015: Deven Sangoi (Equity), Mr. Devendra Singhvi (Debt)
Fund Update:
Exposure to Equities has decreased to 43.32% from 46.34% and to MMI has been increased to 16.77% from 14.68% on a MOM basis.
Platinum Plus III fund continues to be predominantly invested in large cap stocks and maintains a well diversified portfolio.
Maturity Profile
Asset Allocation Rating Profile
Top 10 Sectoral Allocation
21
3.46Maturity (in years)
Date of Inception: 15-May-09
68.35%
AAA
Sovereign
30.86%AA+
0.79%
8.09%Yield to Maturity :
43.32%
Equities
NCD11.07%
28.84%
G-Secs
16.77%
MMI, Deposits, CBLO & Others
3.11%
3.31%
6.01%
7.38%
8.00%
9.04%
10.74%
11.46%
17.98%
20.12%
METAL
CEMENT
PHARMACEUTICALS
CAPITAL GOODS
FMCG
FINANCIAL SERVICES
AUTOMOBILE
OIL AND GAS
SOFTWARE / IT
BANKING
15.76%
83.55%
0.68%
Less than 2 years 2 to 7 years 7 years & above
OBJECTIVE: while using debt instruments & derivatives to lock-in capital appreciations.
STRATEGY: To have an optimum mix of equities & fixed income instruments, with up to 100% exposure in both equities & fixed income assets & up to 40% in Money Market.
To optimize the participation in an actively managed well diversified equity portfolio of fundamentally strong blue chip companies
About The Fund
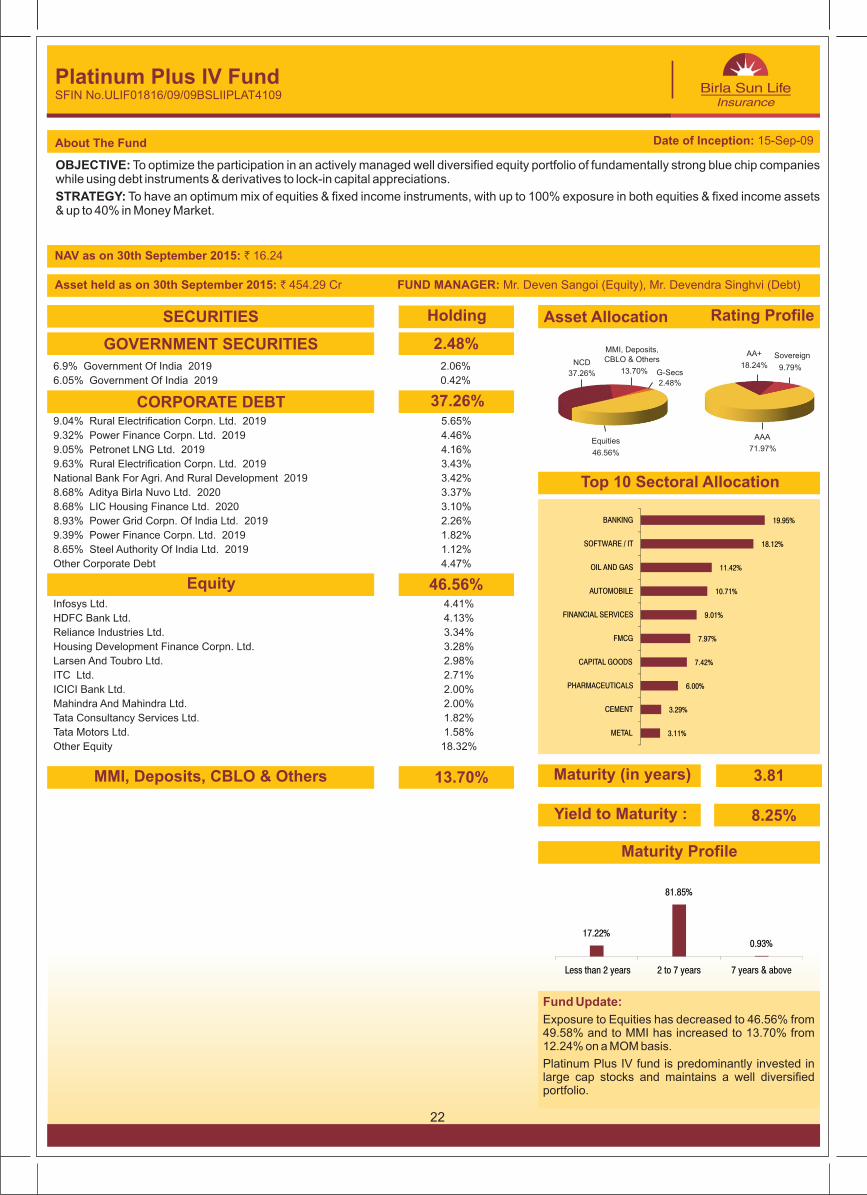
Platinum Plus IV FundSFIN No.ULIF01816/09/09BSLIIPLAT4109
6.9% Government Of India 2019 2.06%
6.05% Government Of India 2019 0.42%
9.04% Rural Electrification Corpn. Ltd. 2019 5.65%
9.32% Power Finance Corpn. Ltd. 2019 4.46%
9.05% Petronet LNG Ltd. 2019 4.16%
9.63% Rural Electrification Corpn. Ltd. 2019 3.43%
National Bank For Agri. And Rural Development 2019 3.42%
8.68% Aditya Birla Nuvo Ltd. 2020 3.37%
8.68% LIC Housing Finance Ltd. 2020 3.10%
8.93% Power Grid Corpn. Of India Ltd. 2019 2.26%
9.39% Power Finance Corpn. Ltd. 2019 1.82%
8.65% Steel Authority Of India Ltd. 2019 1.12%
Other Corporate Debt 4.47%
Infosys Ltd. 4.41%
HDFC Bank Ltd. 4.13%
Reliance Industries Ltd. 3.34%
Housing Development Finance Corpn. Ltd. 3.28%
Larsen And Toubro Ltd. 2.98%
ITC Ltd. 2.71%
ICICI Bank Ltd. 2.00%
Mahindra And Mahindra Ltd. 2.00%
Tata Consultancy Services Ltd. 1.82%
Tata Motors Ltd. 1.58%
Other Equity 18.32%
GOVERNMENT SECURITIES
CORPORATE DEBT
Equity
MMI, Deposits, CBLO & Others
SECURITIES
2.48%
Holding
37.26%
46.56%
13.70%
NAV as on 16.2430th September 2015: `
Asset held as on ` 454.29 Cr FUND MANAGER: Mr. 30th September 2015: Deven Sangoi (Equity), Mr. Devendra Singhvi (Debt)
Fund Update:
Exposure to Equities has decreased to 46.56% from 49.58% and to MMI has increased to 13.70% from 12.24% on a MOM basis.
Platinum Plus IV fund is predominantly invested in large cap stocks and maintains a well diversified portfolio.
Maturity Profile
Asset Allocation Rating Profile
Top 10 Sectoral Allocation
22
3.81Maturity (in years)
Date of Inception: 15-Sep-09
71.97%
AAA
Sovereign18.24%
AA+
9.79%
8.25%Yield to Maturity :
46.56%
Equities
MMI, Deposits, CBLO & Others
G-Secs
2.48%37.26%
NCD13.70%
3.11%
3.29%
6.00%
7.42%
7.97%
9.01%
10.71%
11.42%
18.12%
19.95%
METAL
CEMENT
PHARMACEUTICALS
CAPITAL GOODS
FMCG
FINANCIAL SERVICES
AUTOMOBILE
OIL AND GAS
SOFTWARE / IT
BANKING
17.22%
81.85%
0.93%
Less than 2 years 2 to 7 years 7 years & above
OBJECTIVE: while using debt instruments and derivatives to lock-in capital appreciations. The use of derivatives will be for hedging purposes only and as approved by the IRDA.
STRATEGY: To dynamically manage the allocation between equities and fixed income instruments, while using derivatives when necessary and for hedging purposes only. The equity investment strategy will revolve around building and actively managing a well-diversified equity portfolio of value & growth driven fundamentally strong blue chip companies by following a research-focused investment approach. On the fixed income side, investments will be made in government securities, high rated corporate bonds and money market instruments.
To optimise the participation in an actively managed well-diversified equity portfolio of fundamentally strong blue chip companies
About The Fund
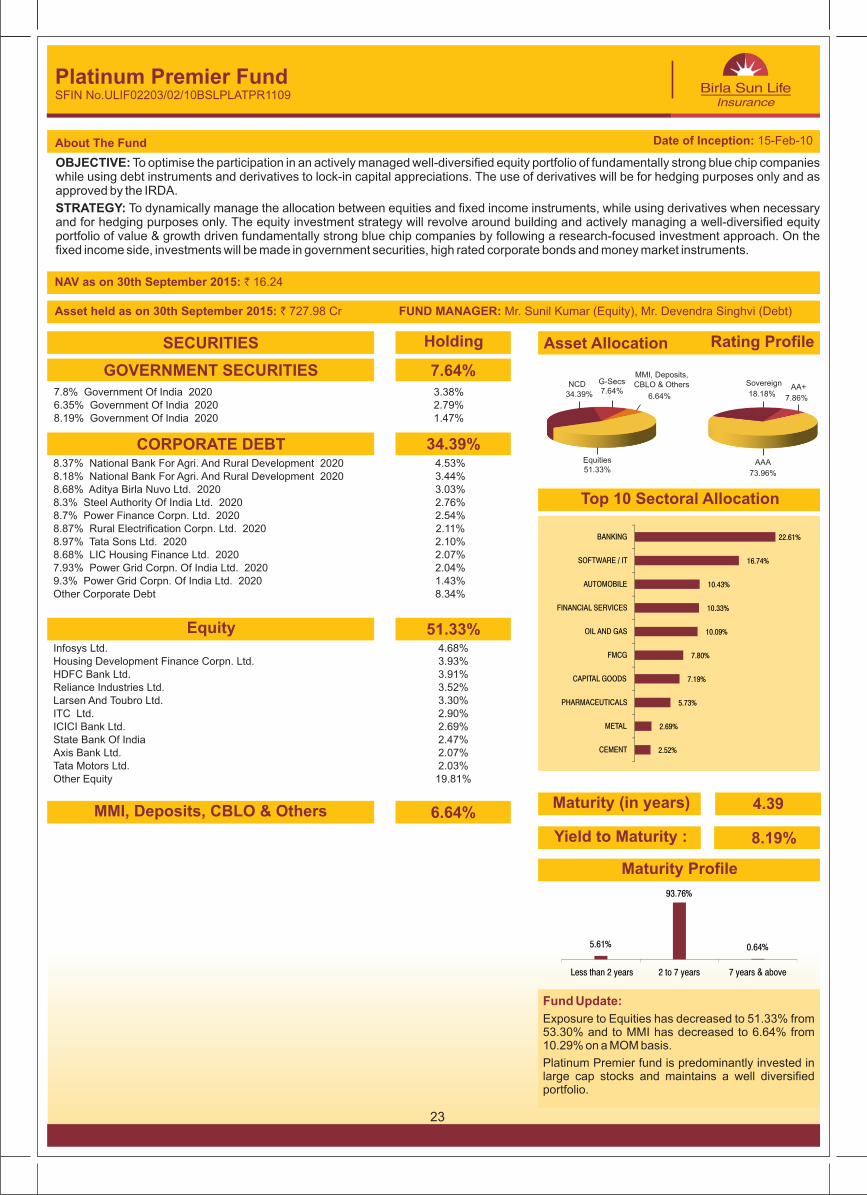
Platinum Premier FundSFIN No.ULIF02203/02/10BSLPLATPR1109
7.8% Government Of India 2020 3.38%6.35% Government Of India 2020 2.79%8.19% Government Of India 2020 1.47%
8.37% National Bank For Agri. And Rural Development 2020 4.53%8.18% National Bank For Agri. And Rural Development 2020 3.44%8.68% Aditya Birla Nuvo Ltd. 2020 3.03%8.3% Steel Authority Of India Ltd. 2020 2.76%8.7% Power Finance Corpn. Ltd. 2020 2.54%8.87% Rural Electrification Corpn. Ltd. 2020 2.11%8.97% Tata Sons Ltd. 2020 2.10%8.68% LIC Housing Finance Ltd. 2020 2.07%7.93% Power Grid Corpn. Of India Ltd. 2020 2.04%9.3% Power Grid Corpn. Of India Ltd. 2020 1.43%Other Corporate Debt 8.34%
Infosys Ltd. 4.68%Housing Development Finance Corpn. Ltd. 3.93%HDFC Bank Ltd. 3.91%Reliance Industries Ltd. 3.52%Larsen And Toubro Ltd. 3.30%ITC Ltd. 2.90%ICICI Bank Ltd. 2.69%State Bank Of India 2.47%Axis Bank Ltd. 2.07%Tata Motors Ltd. 2.03%Other Equity 19.81%
GOVERNMENT SECURITIES
CORPORATE DEBT
Equity
MMI, Deposits, CBLO & Others
SECURITIES
7.64%
Holding
34.39%
51.33%
6.64%
NAV as on 16.2430th September 2015: `
Asset held as on ` 727.98 Cr FUND MANAGER: Mr. 30th September 2015: Sunil Kumar (Equity), Mr. Devendra Singhvi (Debt)
Fund Update:
Exposure to Equities has decreased to 51.33% from 53.30% and to MMI has decreased to 6.64% from 10.29% on a MOM basis.
Platinum Premier fund is predominantly invested in large cap stocks and maintains a well diversified portfolio.
Maturity Profile
Asset Allocation Rating Profile
Top 10 Sectoral Allocation
23
4.39Maturity (in years)
Date of Inception: 15-Feb-10
73.96%
AAA
Sovereign
18.18%AA+
7.86%
8.19%Yield to Maturity :
51.33%Equities
NCD G-Secs
34.39% 6.64%
MMI, Deposits, CBLO & Others
7.64%
2.52%
2.69%
5.73%
7.19%
7.80%
10.09%
10.33%
10.43%
16.74%
22.61%
CEMENT
METAL
PHARMACEUTICALS
CAPITAL GOODS
FMCG
OIL AND GAS
FINANCIAL SERVICES
AUTOMOBILE
SOFTWARE / IT
BANKING
5.61%
93.76%
0.64%
Less than 2 years 2 to 7 years 7 years & above
OBJECTIVE: while using debt instruments and derivatives to lock-in capital appreciations. The use of derivatives will be for hedging purposes only and as approved by the IRDA.
STRATEGY: To dynamically manage the allocation between equities and fixed income instruments, while using derivatives when necessary and for hedging purposes only. The equity investment strategy will revolve around building and actively managing a well-diversified equity portfolio of value & growth driven fundamentally strong blue-chip companies by following a research-focused investment approach. On the fixed income side, investments will be made in government securities, high rated corporate bonds and money market instruments.
To optimize the participation in an actively managed well-diversified equity portfolio of fundamentally strong blue chip companies
About The Fund
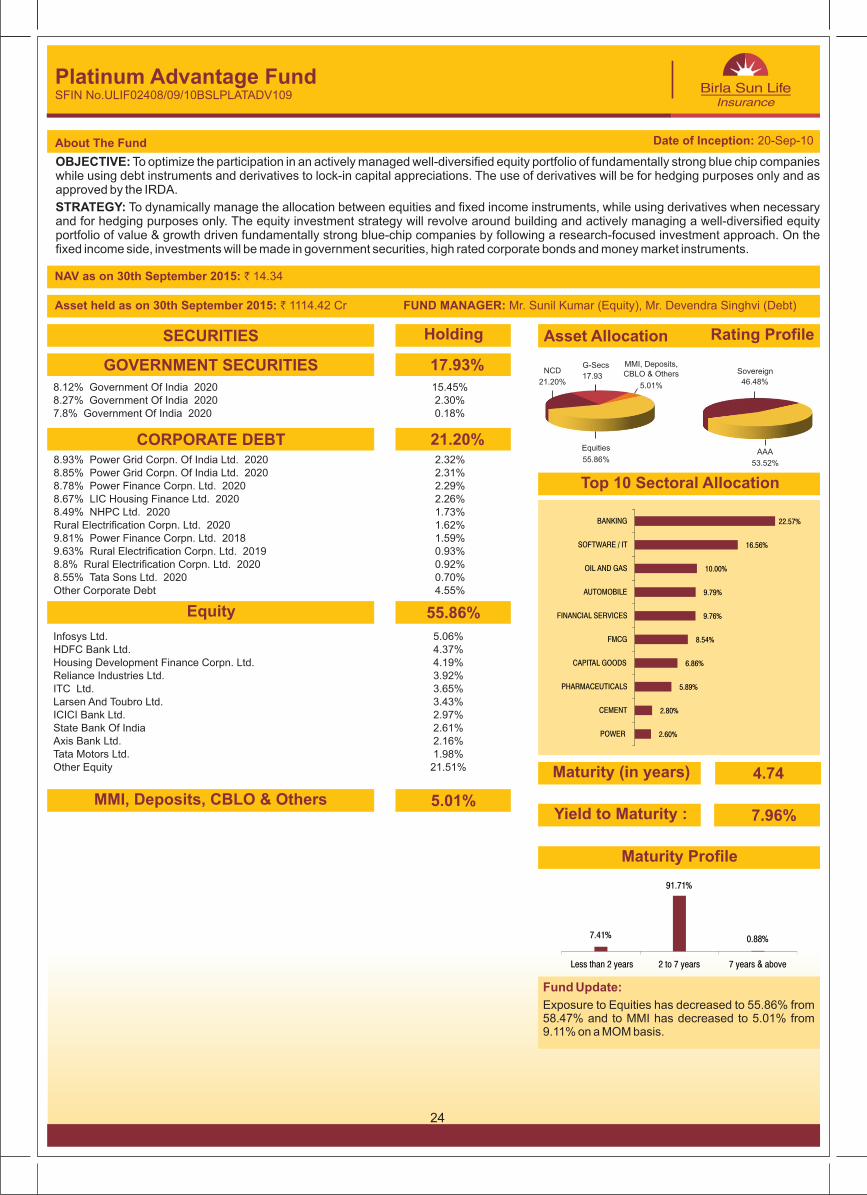
Platinum Advantage FundSFIN No.ULIF02408/09/10BSLPLATADV109
8.12% Government Of India 2020 15.45%8.27% Government Of India 2020 2.30%7.8% Government Of India 2020 0.18%
8.93% Power Grid Corpn. Of India Ltd. 2020 2.32%8.85% Power Grid Corpn. Of India Ltd. 2020 2.31%8.78% Power Finance Corpn. Ltd. 2020 2.29%8.67% LIC Housing Finance Ltd. 2020 2.26%8.49% NHPC Ltd. 2020 1.73%Rural Electrification Corpn. Ltd. 2020 1.62%9.81% Power Finance Corpn. Ltd. 2018 1.59%9.63% Rural Electrification Corpn. Ltd. 2019 0.93%8.8% Rural Electrification Corpn. Ltd. 2020 0.92%8.55% Tata Sons Ltd. 2020 0.70%Other Corporate Debt 4.55%
Infosys Ltd. 5.06%HDFC Bank Ltd. 4.37%Housing Development Finance Corpn. Ltd. 4.19%Reliance Industries Ltd. 3.92%ITC Ltd. 3.65%Larsen And Toubro Ltd. 3.43%ICICI Bank Ltd. 2.97%State Bank Of India 2.61%Axis Bank Ltd. 2.16%Tata Motors Ltd. 1.98%Other Equity 21.51%
GOVERNMENT SECURITIES
CORPORATE DEBT
Equity
MMI, Deposits, CBLO & Others
SECURITIES
17.93%
Holding
21.20%
55.86%
5.01%
NAV as on 14.3430th September 2015: `
Asset held as on ` 1114.42 Cr FUND MANAGER: Mr. 30th September 2015: Sunil Kumar (Equity), Mr. Devendra Singhvi (Debt)
Fund Update:
Exposure to Equities has decreased to 55.86% from 58.47% and to MMI has decreased to 5.01% from 9.11% on a MOM basis.
Maturity Profile
Asset Allocation Rating Profile
Top 10 Sectoral Allocation
24
4.74Maturity (in years)
Date of Inception: 20-Sep-10
53.52%
AAA
Sovereign
46.48%
7.96%Yield to Maturity :
2.60%
2.80%
5.89%
6.86%
8.54%
9.76%
9.79%
10.00%
16.56%
22.57%
POWER
CEMENT
PHARMACEUTICALS
CAPITAL GOODS
FMCG
FINANCIAL SERVICES
AUTOMOBILE
OIL AND GAS
SOFTWARE / IT
BANKING
7.41%
91.71%
0.88%
Less than 2 years 2 to 7 years 7 years & above
G-Secs
17.93NCD
21.20%
MMI, Deposits, CBLO & Others
5.01%
55.86%
Equities
OBJECTIVE: while using debt instruments and derivatives to lock-in capital appreciation. Derivatives would be used for hedging purpose only and as approved by IRDA.
STRATEGY: To dynamically manage the allocation between equities and fixed income instruments, while using derivatives when necessary and for hedging purposes only. The equity investment strategy will revolve around building and actively managing a well-diversified equity portfolio of value & growth driven fundamentally strong blue-chip companies by following a research-focused investment approach. On the fixed income side, investments will be made in government securities, high rated corporate bonds and money market instruments.
To optimise the participation in an actively managed well-diversified equity portfolio of fundamentally strong blue chip companies
About The Fund
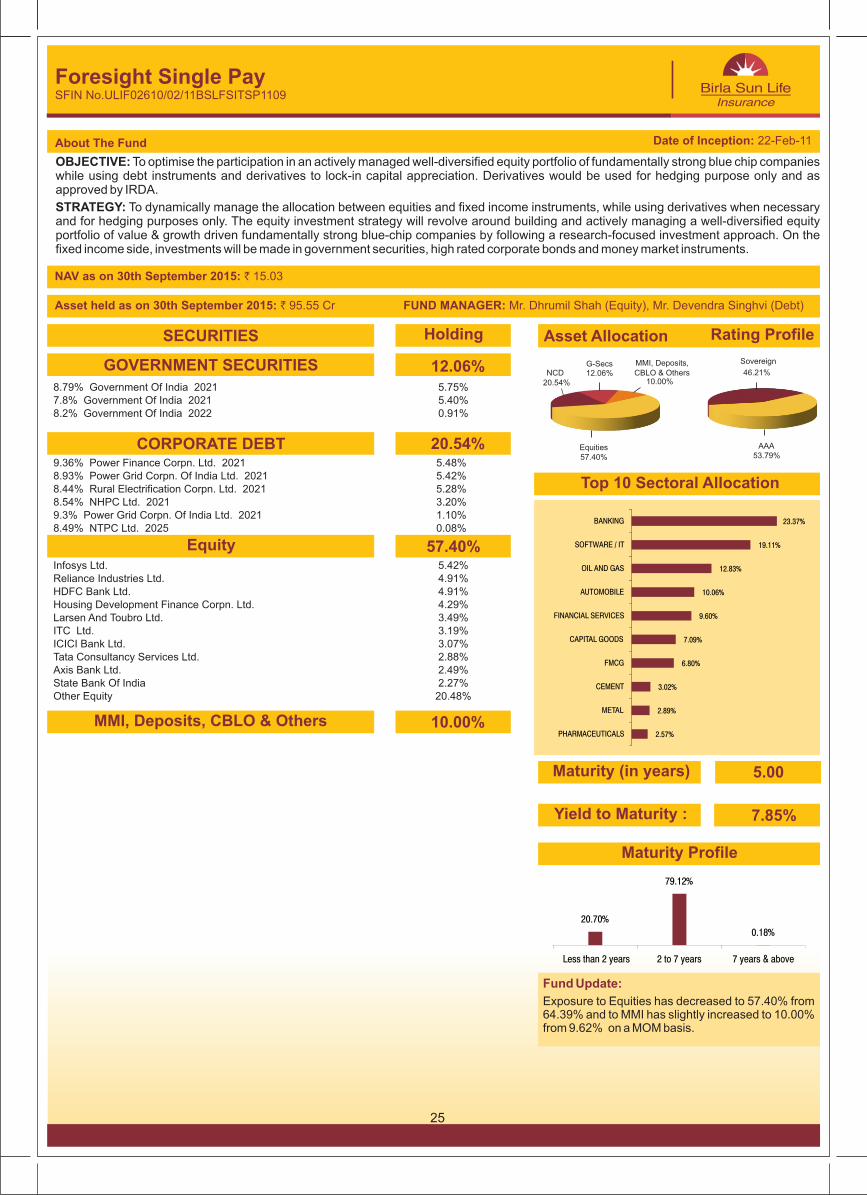
Foresight Single PaySFIN No.ULIF02610/02/11BSLFSITSP1109
8.79% Government Of India 2021 5.75%7.8% Government Of India 2021 5.40%8.2% Government Of India 2022 0.91%
9.36% Power Finance Corpn. Ltd. 2021 5.48%8.93% Power Grid Corpn. Of India Ltd. 2021 5.42%8.44% Rural Electrification Corpn. Ltd. 2021 5.28%8.54% NHPC Ltd. 2021 3.20%9.3% Power Grid Corpn. Of India Ltd. 2021 1.10%8.49% NTPC Ltd. 2025 0.08%
Infosys Ltd. 5.42%Reliance Industries Ltd. 4.91%HDFC Bank Ltd. 4.91%Housing Development Finance Corpn. Ltd. 4.29%Larsen And Toubro Ltd. 3.49%ITC Ltd. 3.19%ICICI Bank Ltd. 3.07%Tata Consultancy Services Ltd. 2.88%Axis Bank Ltd. 2.49%State Bank Of India 2.27%Other Equity 20.48%
GOVERNMENT SECURITIES
CORPORATE DEBT
Equity
MMI, Deposits, CBLO & Others
SECURITIES
12.06%
Holding
20.54%
57.40%
10.00%
NAV as on 15.0330th September 2015: `
Asset held as on ` 95.55 Cr FUND MANAGER: Mr. 30th September 2015: Dhrumil Shah (Equity), Mr. Devendra Singhvi (Debt)
Fund Update:
Exposure to Equities has decreased to 57.40% from 64.39% and to MMI has slightly increased to 10.00% from 9.62% on a MOM basis.
Maturity Profile
Asset Allocation Rating Profile
Top 10 Sectoral Allocation
25
5.00Maturity (in years)
Date of Inception: 22-Feb-11
Sovereign
46.21%
53.79%AAA
7.85%Yield to Maturity :
2.57%
2.89%
3.02%
6.80%
7.09%
9.60%
10.06%
12.83%
19.11%
23.37%
PHARMACEUTICALS
METAL
CEMENT
FMCG
CAPITAL GOODS
FINANCIAL SERVICES
AUTOMOBILE
OIL AND GAS
SOFTWARE / IT
BANKING
20.70%
79.12%
0.18%
Less than 2 years 2 to 7 years 7 years & above
57.40%Equities
MMI, Deposits, CBLO & Others
10.00%NCD
20.54%12.06%G-Secs
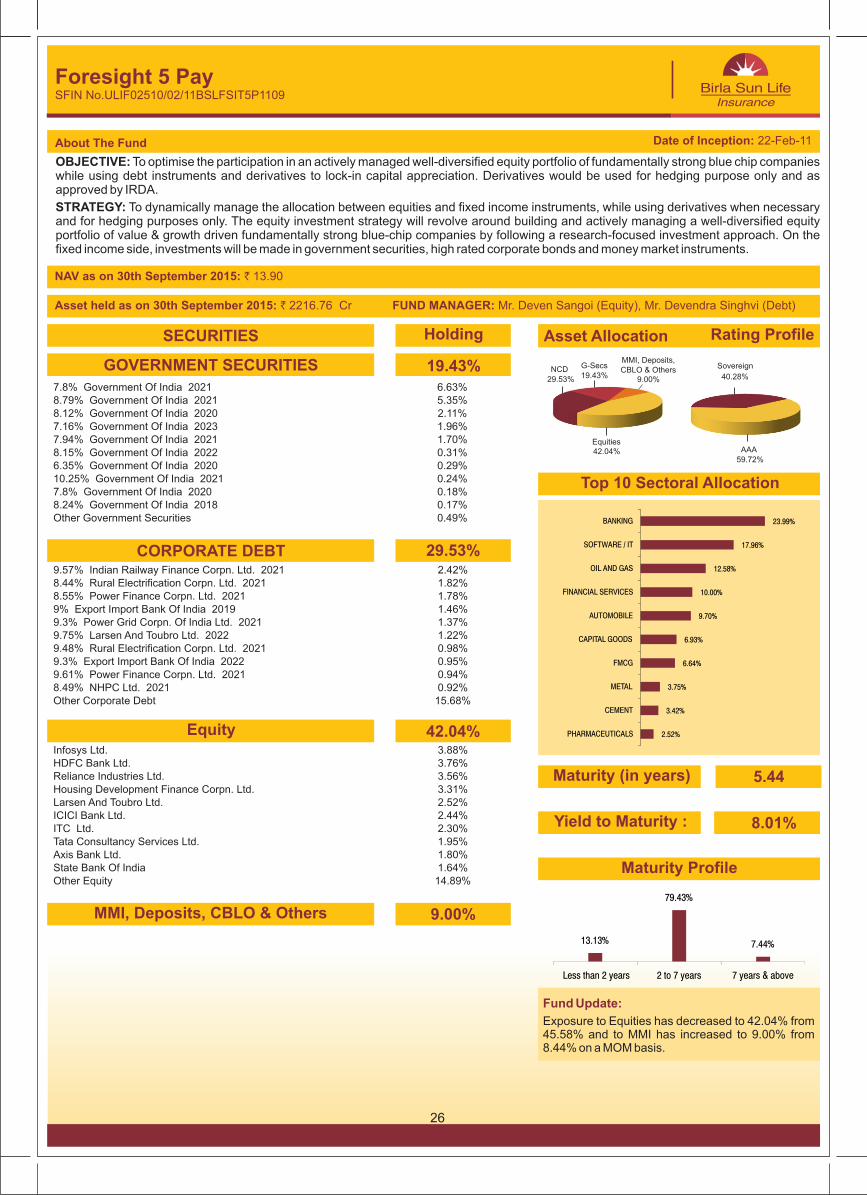
OBJECTIVE: while using debt instruments and derivatives to lock-in capital appreciation. Derivatives would be used for hedging purpose only and as approved by IRDA.
STRATEGY: To dynamically manage the allocation between equities and fixed income instruments, while using derivatives when necessary and for hedging purposes only. The equity investment strategy will revolve around building and actively managing a well-diversified equity portfolio of value & growth driven fundamentally strong blue-chip companies by following a research-focused investment approach. On the fixed income side, investments will be made in government securities, high rated corporate bonds and money market instruments.
To optimise the participation in an actively managed well-diversified equity portfolio of fundamentally strong blue chip companies
About The Fund
Foresight 5 PaySFIN No.ULIF02510/02/11BSLFSIT5P1109
7.8% Government Of India 2021 6.63%8.79% Government Of India 2021 5.35%8.12% Government Of India 2020 2.11%7.16% Government Of India 2023 1.96%7.94% Government Of India 2021 1.70%8.15% Government Of India 2022 0.31%6.35% Government Of India 2020 0.29%10.25% Government Of India 2021 0.24%7.8% Government Of India 2020 0.18%8.24% Government Of India 2018 0.17%Other Government Securities 0.49%
9.57% Indian Railway Finance Corpn. Ltd. 2021 2.42%8.44% Rural Electrification Corpn. Ltd. 2021 1.82%8.55% Power Finance Corpn. Ltd. 2021 1.78%9% Export Import Bank Of India 2019 1.46%9.3% Power Grid Corpn. Of India Ltd. 2021 1.37%9.75% Larsen And Toubro Ltd. 2022 1.22%9.48% Rural Electrification Corpn. Ltd. 2021 0.98%9.3% Export Import Bank Of India 2022 0.95%9.61% Power Finance Corpn. Ltd. 2021 0.94%8.49% NHPC Ltd. 2021 0.92%Other Corporate Debt 15.68%
Infosys Ltd. 3.88%HDFC Bank Ltd. 3.76%Reliance Industries Ltd. 3.56%Housing Development Finance Corpn. Ltd. 3.31%Larsen And Toubro Ltd. 2.52%ICICI Bank Ltd. 2.44%ITC Ltd. 2.30%Tata Consultancy Services Ltd. 1.95%Axis Bank Ltd. 1.80%State Bank Of India 1.64%Other Equity 14.89%
GOVERNMENT SECURITIES
CORPORATE DEBT
Equity
MMI, Deposits, CBLO & Others
SECURITIES
19.43%
Holding
29.53%
42.04%
9.00%
NAV as on 13.9030th September 2015: `
Asset held as on ` 2216.76 Cr FUND MANAGER: Mr. 30th September 2015: Deven Sangoi (Equity), Mr. Devendra Singhvi (Debt)
Fund Update:
Exposure to Equities has decreased to 42.04% from 45.58% and to MMI has increased to 9.00% from 8.44% on a MOM basis.
Maturity Profile
Asset Allocation Rating Profile
Top 10 Sectoral Allocation
26
5.44Maturity (in years)
Date of Inception: 22-Feb-11
AAA59.72%
Sovereign
40.28%
8.01%Yield to Maturity :
42.04%Equities
MMI, Deposits, CBLO & OthersNCD
19.43%G-Secs
29.53% 9.00%
2.52%
3.42%
3.75%
6.64%
6.93%
9.70%
10.00%
12.58%
17.96%
23.99%
PHARMACEUTICALS
CEMENT
METAL
FMCG
CAPITAL GOODS
AUTOMOBILE
FINANCIAL SERVICES
OIL AND GAS
SOFTWARE / IT
BANKING
13.13%
79.43%
7.44%
Less than 2 years 2 to 7 years 7 years & above
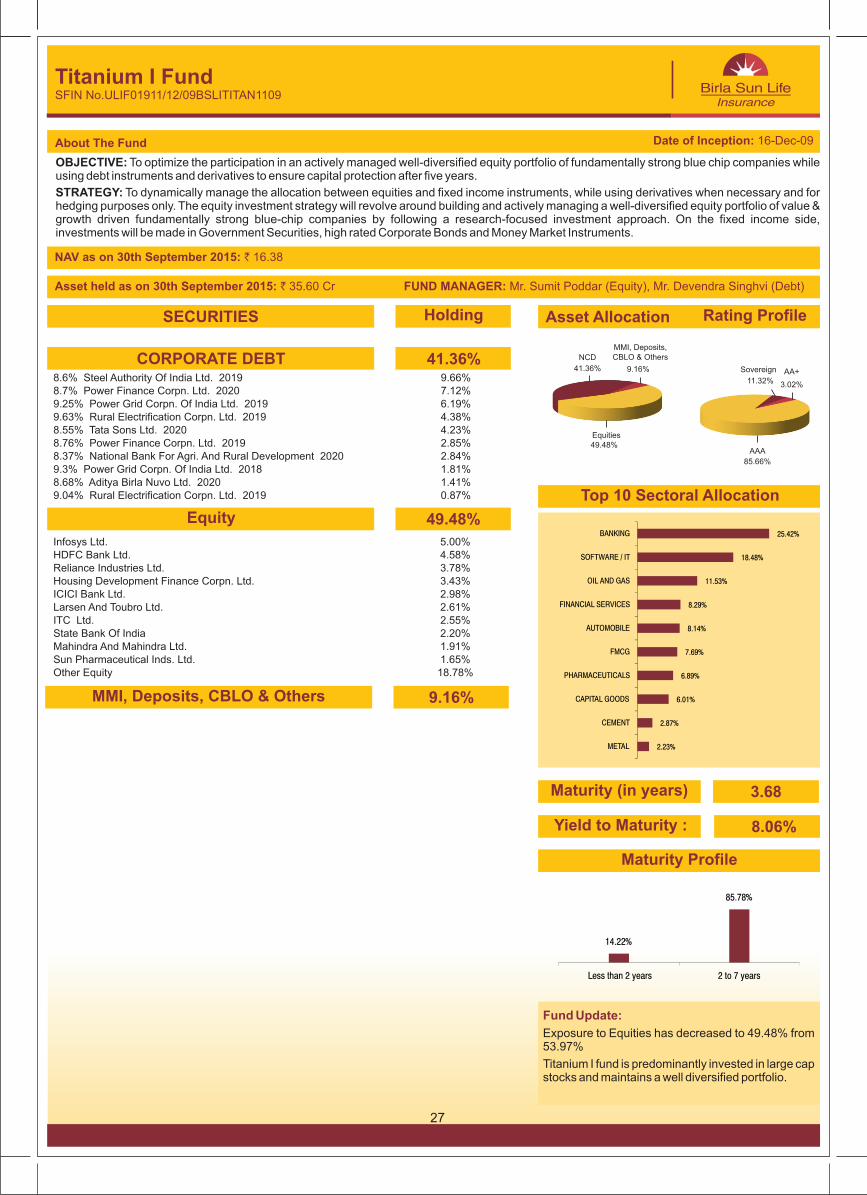
OBJECTIVE: using debt instruments and derivatives to ensure capital protection after five years.
STRATEGY: To dynamically manage the allocation between equities and fixed income instruments, while using derivatives when necessary and for hedging purposes only. The equity investment strategy will revolve around building and actively managing a well-diversified equity portfolio of value & growth driven fundamentally strong blue-chip companies by following a research-focused investment approach. On the fixed income side, investments will be made in Government Securities, high rated Corporate Bonds and Money Market Instruments.
To optimize the participation in an actively managed well-diversified equity portfolio of fundamentally strong blue chip companies while
About The Fund
Titanium I FundSFIN No.ULIF01911/12/09BSLITITAN1109
8.6% Steel Authority Of India Ltd. 2019 9.66%8.7% Power Finance Corpn. Ltd. 2020 7.12%9.25% Power Grid Corpn. Of India Ltd. 2019 6.19%9.63% Rural Electrification Corpn. Ltd. 2019 4.38%8.55% Tata Sons Ltd. 2020 4.23%8.76% Power Finance Corpn. Ltd. 2019 2.85%8.37% National Bank For Agri. And Rural Development 2020 2.84%9.3% Power Grid Corpn. Of India Ltd. 2018 1.81%8.68% Aditya Birla Nuvo Ltd. 2020 1.41%9.04% Rural Electrification Corpn. Ltd. 2019 0.87%
Infosys Ltd. 5.00%HDFC Bank Ltd. 4.58%Reliance Industries Ltd. 3.78%Housing Development Finance Corpn. Ltd. 3.43%ICICI Bank Ltd. 2.98%Larsen And Toubro Ltd. 2.61%ITC Ltd. 2.55%State Bank Of India 2.20%Mahindra And Mahindra Ltd. 1.91%Sun Pharmaceutical Inds. Ltd. 1.65%Other Equity 18.78%
CORPORATE DEBT
Equity
SECURITIES Holding
41.36%
49.48%
NAV as on 16.3830th September 2015: `
Asset held as on ` 35.60 Cr FUND MANAGER: Mr. 30th September 2015: Sumit Poddar (Equity), Mr. Devendra Singhvi (Debt)
Fund Update:
Exposure to Equities has decreased to 49.48% from 53.97%
Titanium I fund is predominantly invested in large cap stocks and maintains a well diversified portfolio.
Maturity Profile
Asset Allocation Rating Profile
Top 10 Sectoral Allocation
27
3.68Maturity (in years)
MMI, Deposits, CBLO & Others 9.16%
Date of Inception: 16-Dec-09
8.06%Yield to Maturity :
49.48%Equities
NCD
41.36% 9.16%
MMI, Deposits, CBLO & Others
AAA
85.66%
11.32%
Sovereign
3.02%
AA+
2.23%
2.87%
6.01%
6.89%
7.69%
8.14%
8.29%
11.53%
18.48%
25.42%
METAL
CEMENT
CAPITAL GOODS
PHARMACEUTICALS
FMCG
AUTOMOBILE
FINANCIAL SERVICES
OIL AND GAS
SOFTWARE / IT
BANKING
14.22%
85.78%
Less than 2 years 2 to 7 years
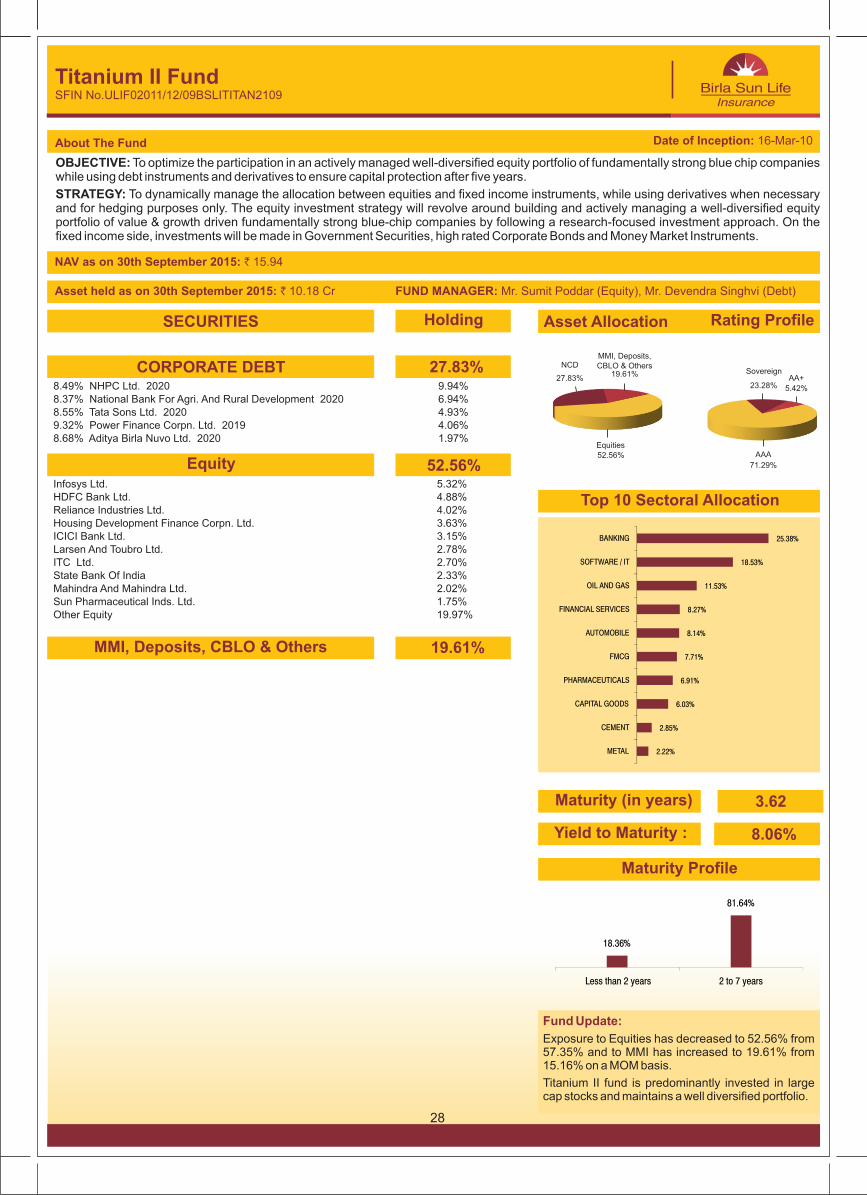
OBJECTIVE: while using debt instruments and derivatives to ensure capital protection after five years.
STRATEGY: To dynamically manage the allocation between equities and fixed income instruments, while using derivatives when necessary and for hedging purposes only. The equity investment strategy will revolve around building and actively managing a well-diversified equity portfolio of value & growth driven fundamentally strong blue-chip companies by following a research-focused investment approach. On the fixed income side, investments will be made in Government Securities, high rated Corporate Bonds and Money Market Instruments.
To optimize the participation in an actively managed well-diversified equity portfolio of fundamentally strong blue chip companies
About The Fund
Titanium II FundSFIN No.ULIF02011/12/09BSLITITAN2109
8.49% NHPC Ltd. 2020 9.94%8.37% National Bank For Agri. And Rural Development 2020 6.94%8.55% Tata Sons Ltd. 2020 4.93%9.32% Power Finance Corpn. Ltd. 2019 4.06%8.68% Aditya Birla Nuvo Ltd. 2020 1.97%
Infosys Ltd. 5.32%HDFC Bank Ltd. 4.88%Reliance Industries Ltd. 4.02%Housing Development Finance Corpn. Ltd. 3.63%ICICI Bank Ltd. 3.15%Larsen And Toubro Ltd. 2.78%ITC Ltd. 2.70%State Bank Of India 2.33%Mahindra And Mahindra Ltd. 2.02%Sun Pharmaceutical Inds. Ltd. 1.75%Other Equity 19.97%
CORPORATE DEBT
Equity
MMI, Deposits, CBLO & Others
SECURITIES Holding
27.83%
52.56%
19.61%
NAV as on 15.9430th September 2015: `
Asset held as on ` 10.18 Cr FUND MANAGER: 30th September 2015: Mr. Sumit Poddar (Equity), Mr. Devendra Singhvi (Debt)
Fund Update:
Exposure to Equities has decreased to 52.56% from 57.35% and to MMI has increased to 19.61% from 15.16% on a MOM basis.
Titanium II fund is predominantly invested in large cap stocks and maintains a well diversified portfolio.
Maturity Profile
Asset Allocation Rating Profile
Top 10 Sectoral Allocation
28
3.62Maturity (in years)
Date of Inception: 16-Mar-10
52.56%Equities
27.83%
NCD19.61%
MMI, Deposits, CBLO & Others
8.06%Yield to Maturity :
AAA
71.29%
23.28%
Sovereign
5.42%
AA+
2.22%
2.85%
6.03%
6.91%
7.71%
8.14%
8.27%
11.53%
18.53%
25.38%
METAL
CEMENT
CAPITAL GOODS
PHARMACEUTICALS
FMCG
AUTOMOBILE
FINANCIAL SERVICES
OIL AND GAS
SOFTWARE / IT
BANKING
18.36%
81.64%
Less than 2 years 2 to 7 years
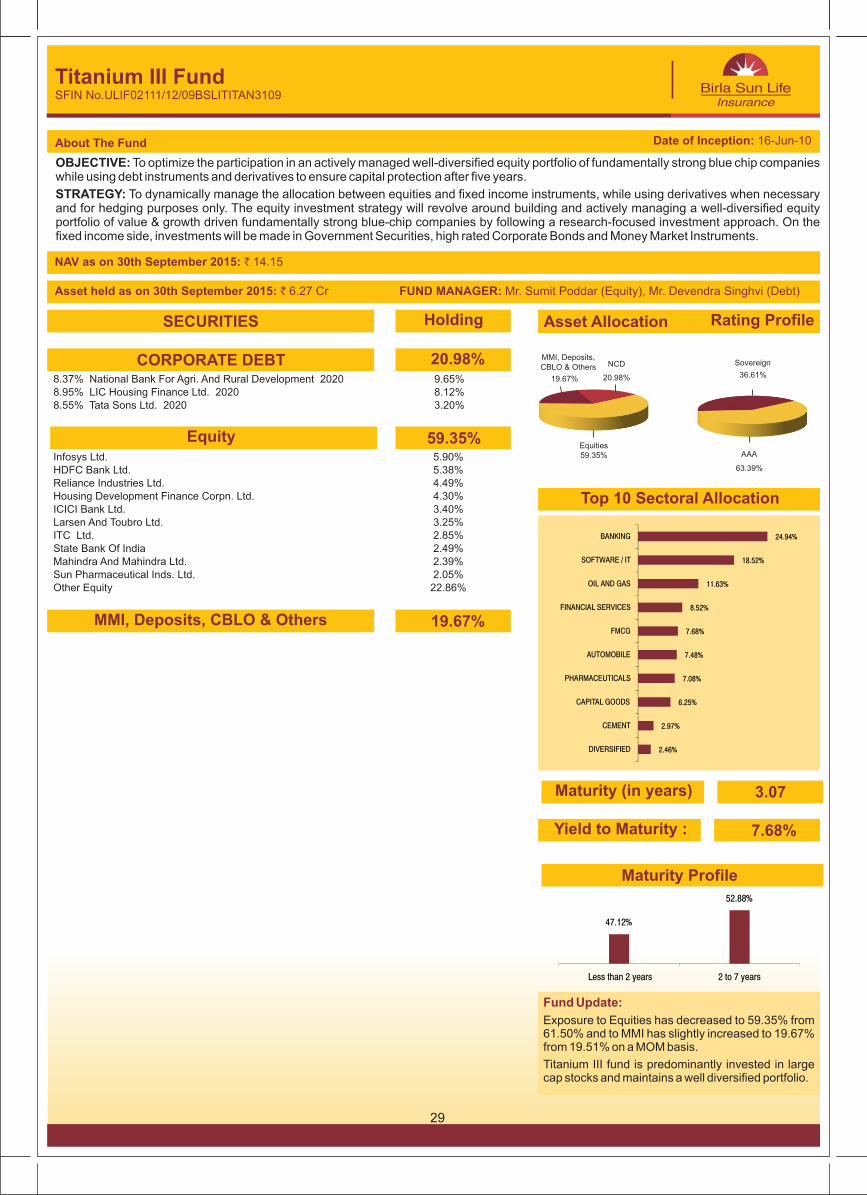
OBJECTIVE: while using debt instruments and derivatives to ensure capital protection after five years.
STRATEGY: To dynamically manage the allocation between equities and fixed income instruments, while using derivatives when necessary and for hedging purposes only. The equity investment strategy will revolve around building and actively managing a well-diversified equity portfolio of value & growth driven fundamentally strong blue-chip companies by following a research-focused investment approach. On the fixed income side, investments will be made in Government Securities, high rated Corporate Bonds and Money Market Instruments.
To optimize the participation in an actively managed well-diversified equity portfolio of fundamentally strong blue chip companies
About The Fund
Titanium III FundSFIN No.ULIF02111/12/09BSLITITAN3109
8.37% National Bank For Agri. And Rural Development 2020 9.65%8.95% LIC Housing Finance Ltd. 2020 8.12%8.55% Tata Sons Ltd. 2020 3.20%
Infosys Ltd. 5.90%HDFC Bank Ltd. 5.38%Reliance Industries Ltd. 4.49%Housing Development Finance Corpn. Ltd. 4.30%ICICI Bank Ltd. 3.40%Larsen And Toubro Ltd. 3.25%ITC Ltd. 2.85%State Bank Of India 2.49%Mahindra And Mahindra Ltd. 2.39%Sun Pharmaceutical Inds. Ltd. 2.05%Other Equity 22.86%
CORPORATE DEBT
Equity
MMI, Deposits, CBLO & Others
SECURITIES Holding
20.98%
59.35%
19.67%
NAV as on 14.1530th September 2015: `
Asset held as on ` Cr FUND MANAGER: 30th September 2015: 6.27 Mr. Sumit Poddar (Equity), Mr. Devendra Singhvi (Debt)
Fund Update:
Exposure to Equities has decreased to 59.35% from 61.50% and to MMI has slightly increased to 19.67% from 19.51% on a MOM basis.
Titanium III fund is predominantly invested in large cap stocks and maintains a well diversified portfolio.
Maturity Profile
Asset Allocation Rating Profile
Top 10 Sectoral Allocation
29
3.07Maturity (in years)
Date of Inception: 16-Jun-10
59.35%Equities
20.98%
NCDMMI, Deposits, CBLO & Others
19.67%
7.68%Yield to Maturity :
63.39%
AAA
Sovereign
36.61%
2.46%
2.97%
6.25%
7.08%
7.48%
7.68%
8.52%
11.63%
18.52%
24.94%
DIVERSIFIED
CEMENT
CAPITAL GOODS
PHARMACEUTICALS
AUTOMOBILE
FMCG
FINANCIAL SERVICES
OIL AND GAS
SOFTWARE / IT
BANKING
47.12%
52.88%
Less than 2 years 2 to 7 years
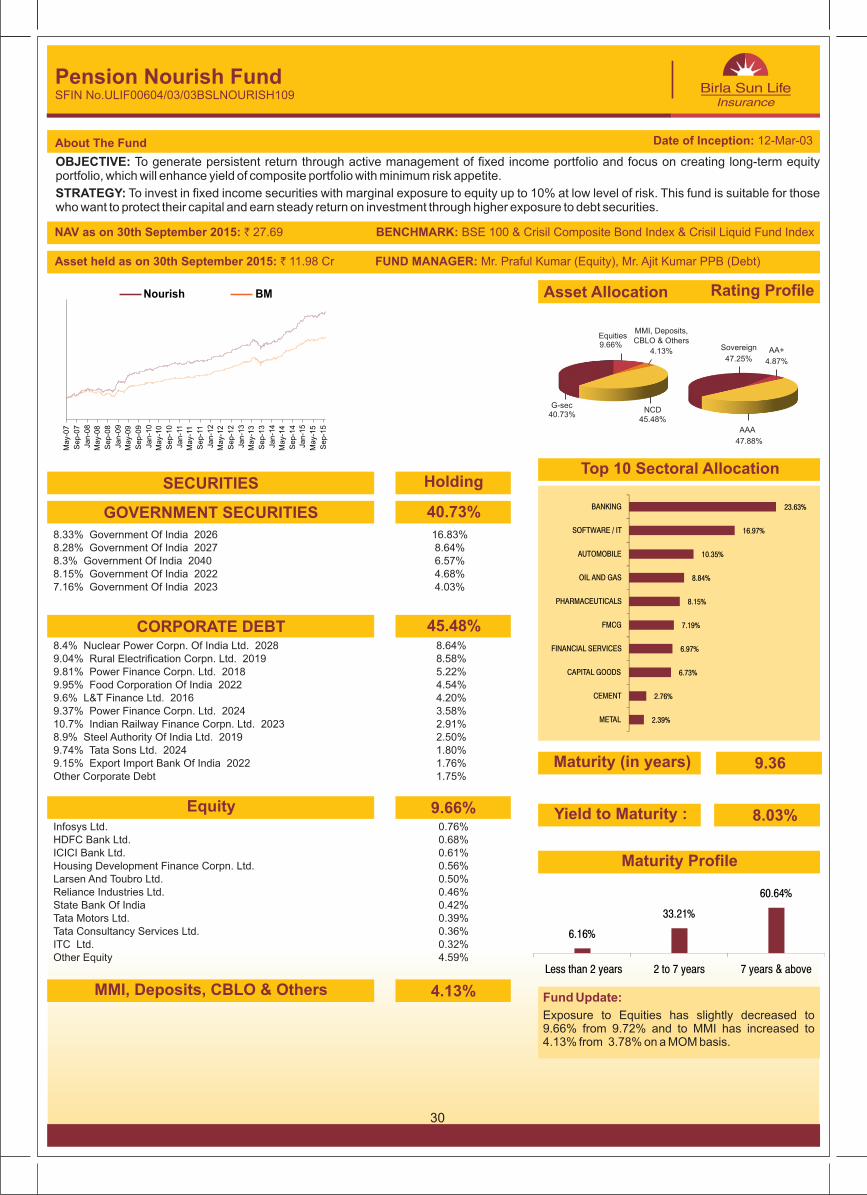
OBJECTIVE: portfolio, which will enhance yield of composite portfolio with minimum risk appetite.
STRATEGY: To invest in fixed income securities with marginal exposure to equity up to 10% at low level of risk. This fund is suitable for those who want to protect their capital and earn steady return on investment through higher exposure to debt securities.
To generate persistent return through active management of fixed income portfolio and focus on creating long-term equity
About The Fund
Pension Nourish FundSFIN No.ULIF00604/03/03BSLNOURISH109
8.33% Government Of India 2026 16.83%8.28% Government Of India 2027 8.64%8.3% Government Of India 2040 6.57%8.15% Government Of India 2022 4.68%7.16% Government Of India 2023 4.03%
8.4% Nuclear Power Corpn. Of India Ltd. 2028 8.64%9.04% Rural Electrification Corpn. Ltd. 2019 8.58%9.81% Power Finance Corpn. Ltd. 2018 5.22%9.95% Food Corporation Of India 2022 4.54%9.6% L&T Finance Ltd. 2016 4.20%9.37% Power Finance Corpn. Ltd. 2024 3.58%10.7% Indian Railway Finance Corpn. Ltd. 2023 2.91%8.9% Steel Authority Of India Ltd. 2019 2.50%9.74% Tata Sons Ltd. 2024 1.80%9.15% Export Import Bank Of India 2022 1.76%Other Corporate Debt 1.75%
Infosys Ltd. 0.76%HDFC Bank Ltd. 0.68%ICICI Bank Ltd. 0.61%Housing Development Finance Corpn. Ltd. 0.56%Larsen And Toubro Ltd. 0.50%Reliance Industries Ltd. 0.46%State Bank Of India 0.42%Tata Motors Ltd. 0.39%Tata Consultancy Services Ltd. 0.36%ITC Ltd. 0.32%Other Equity 4.59%
GOVERNMENT SECURITIES
CORPORATE DEBT
Equity
MMI, Deposits, CBLO & Others
SECURITIES
40.73%
Holding
45.48%
9.66%
NAV as on 27.6930th September 2015: ` BENCHMARK: BSE 100 & Crisil Composite Bond Index & Crisil Liquid Fund Index
Asset held as on ` 11.98 Cr FUND MANAGER: Mr. 30th September 2015: Praful Kumar (Equity), Mr. Ajit Kumar PPB (Debt)
Fund Update:
Exposure to Equities has slightly decreased to 9.66% from 9.72% and to MMI has increased to 4.13% from 3.78% on a MOM basis.
Maturity Profile
Asset Allocation Rating Profile
Top 10 Sectoral Allocation
30
9.36Maturity (in years)
Nourish BM
Date of Inception: 12-Mar-03
Sovereign
47.25%AA+
47.88%
4.87%
AAA
4.13%
40.73%NCD
45.48%
G-sec
Equities9.66%
MMI, Deposits, CBLO & Others
4.13%
8.03%Yield to Maturity :
2.39%
2.76%
6.73%
6.97%
7.19%
8.15%
8.84%
10.35%
16.97%
23.63%
METAL
CEMENT
CAPITAL GOODS
FINANCIAL SERVICES
FMCG
PHARMACEUTICALS
OIL AND GAS
AUTOMOBILE
SOFTWARE / IT
BANKING
6.16%
33.21%
60.64%
Less than 2 years 2 to 7 years 7 years & above
May-
07
Sep-0
7
Jan-0
8
May-
08
Sep-0
8
Jan-0
9
May-
09
Sep-0
9
Jan-1
0
May-
10
Sep-1
0
Jan-1
1
May-
11
Sep-1
1
Jan-1
2
May-
12
Sep-1
2
Jan-1
3
May-
13
Sep-1
3
Jan-1
4
May-
14
Sep-1
4
Jan-1
5
May-
15
Sep-1
5
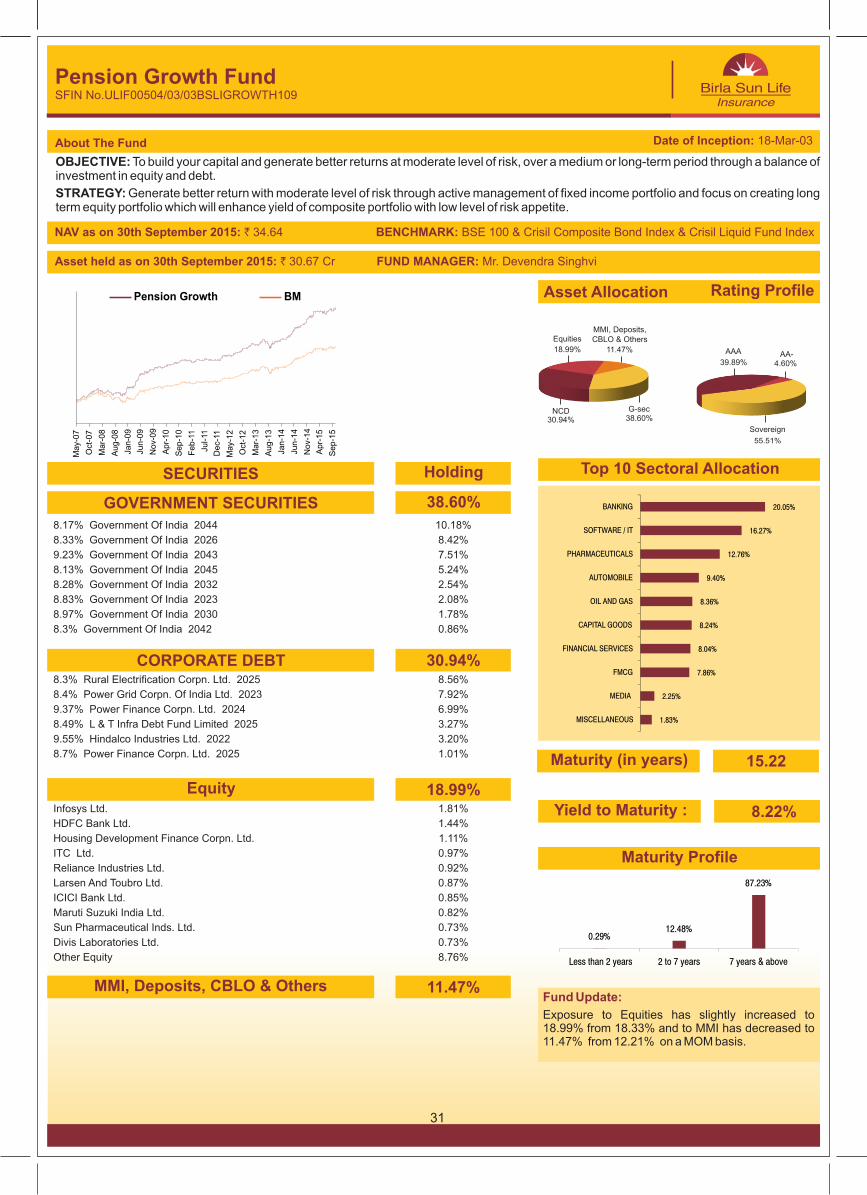
OBJECTIVE: investment in equity and debt.
STRATEGY: Generate better return with moderate level of risk through active management of fixed income portfolio and focus on creating long term equity portfolio which will enhance yield of composite portfolio with low level of risk appetite.
To build your capital and generate better returns at moderate level of risk, over a medium or long-term period through a balance of
About The Fund
Pension Growth FundSFIN No.ULIF00504/03/03BSLIGROWTH109
8.17% Government Of India 2044 10.18%
8.33% Government Of India 2026 8.42%
9.23% Government Of India 2043 7.51%
8.13% Government Of India 2045 5.24%
8.28% Government Of India 2032 2.54%
8.83% Government Of India 2023 2.08%
8.97% Government Of India 2030 1.78%
8.3% Government Of India 2042 0.86%
8.3% Rural Electrification Corpn. Ltd. 2025 8.56%
8.4% Power Grid Corpn. Of India Ltd. 2023 7.92%
9.37% Power Finance Corpn. Ltd. 2024 6.99%
8.49% L & T Infra Debt Fund Limited 2025 3.27%
9.55% Hindalco Industries Ltd. 2022 3.20%
8.7% Power Finance Corpn. Ltd. 2025 1.01%
Infosys Ltd. 1.81%
HDFC Bank Ltd. 1.44%
Housing Development Finance Corpn. Ltd. 1.11%
ITC Ltd. 0.97%
Reliance Industries Ltd. 0.92%
Larsen And Toubro Ltd. 0.87%
ICICI Bank Ltd. 0.85%
Maruti Suzuki India Ltd. 0.82%
Sun Pharmaceutical Inds. Ltd. 0.73%
Divis Laboratories Ltd. 0.73%
Other Equity 8.76%
GOVERNMENT SECURITIES
CORPORATE DEBT
Equity
MMI, Deposits, CBLO & Others
SECURITIES
38.60%
Holding
30.94%
18.99%
11.47%
NAV as on 34.6430th September 2015: ` BENCHMARK: BSE 100 & Crisil Composite Bond Index & Crisil Liquid Fund Index
Asset held as on ` 30.67 Cr FUND MANAGER: Mr. 30th September 2015: Devendra Singhvi
Fund Update:
Exposure to Equities has slightly increased to 18.99% from 18.33% and to MMI has decreased to 11.47% from 12.21% on a MOM basis.
Maturity Profile
Asset Allocation Rating Profile
Top 10 Sectoral Allocation
31
15.22Maturity (in years)
Pension Growth BM
Date of Inception: 18-Mar-03
8.22%Yield to Maturity :
MMI, Deposits, CBLO & OthersEquities
18.99% 11.47%
30.94% 38.60%NCD G-sec
39.89%
AAA AA-4.60%
Sovereign
55.51%
1.83%
2.25%
7.86%
8.04%
8.24%
8.36%
9.40%
12.76%
16.27%
20.05%
MISCELLANEOUS
MEDIA
FMCG
FINANCIAL SERVICES
CAPITAL GOODS
OIL AND GAS
AUTOMOBILE
PHARMACEUTICALS
SOFTWARE / IT
BANKING
0.29% 12.48%
87.23%
Less than 2 years 2 to 7 years 7 years & above
May-
07
Oct
-07
Mar-
08
Aug-0
8
Jan-0
9
Jun-0
9
Nov-
09
Apr-
10
Sep-1
0
Feb-1
1
Jul-11
Dec-
11
May-
12
Oct
-12
Mar-
13
Aug-1
3
Jan-1
4
Jun-1
4
Nov-
14
Apr-
15
Sep-1
5

OBJECTIVE: instruments, thereby providing a good balance between risk and return.
STRATEGY: To earn capital appreciation by maintaining diversified equity portfolio and seek to earn regular return on fixed income portfolio by active management resulting in wealth creation for policyholders.
To grow your capital through enhanced returns over a medium to long term period through investments in equity and debt
About The Fund
Pension Enrich FundSFIN No.ULIF00404/03/03BSLIENRICH109
8.33% Government Of India 2026 10.31%8.83% Government Of India 2023 8.28%8.28% Government Of India 2027 8.07%7.16% Government Of India 2023 6.44%8.3% Government Of India 2042 4.59%9.15% Government Of India 2024 1.35%8.6% Government Of India 2028 1.33%8.32% Government Of India 2032 1.30%8.79% Government Of India 2021 0.03%
9.81% Power Finance Corpn. Ltd. 2018 2.41%9.95% Food Corporation Of India 2022 2.03%9.18% Housing Development Finance Corpn. Ltd. 2018 1.90%8.9% Steel Authority Of India Ltd. 2019 1.87%9.55% Hindalco Industries Ltd. 2022 1.84%9.37% Power Finance Corpn. Ltd. 2024 1.34%9.24% Rural Electrification Corpn. Ltd. 2018 1.29%10.15% Kotak Mahindra Prime Ltd. 2017 1.27%9.9% Cholamandalam Investment And Finance Co. Ltd. 2016 1.26%8.76% HDB Financial Services Ltd 2017 1.25%Other Corporate Debt 5.56%
Housing Development Finance Corpn. Ltd. 2.68%Infosys Ltd. 2.61%HDFC Bank Ltd. 1.78%ITC Ltd. 1.47%Reliance Industries Ltd. 1.36%Larsen And Toubro Ltd. 1.31%Mahindra And Mahindra Ltd. 1.25%Sun Pharmaceutical Inds. Ltd. 1.23%ICICI Bank Ltd. 1.12%Tata Motors Ltd. 1.09%Other Equity 16.56%
GOVERNMENT SECURITIES
CORPORATE DEBT
Equity
MMI, Deposits, CBLO & Others
SECURITIES
41.70%
Holding
22.00%
32.48%
3.81%
NAV as on 40.7930th September 2015: ` BENCHMARK: BSE 100 & Crisil Composite Bond Index & Crisil Liquid Fund Index
Asset held as on ` 160.33 Cr FUND MANAGER: 30th September 2015: Mr. Dhrumil Shah (Equity), Mr. Ajit Kumar PPB (Debt)
Fund Update:
Exposure to Equities has decreased to 32.48% from 33.97% and to MMI has increased to 3.81% from 2.76% on a MOM basis.
Maturity Profile
Asset Allocation Rating Profile
Top 10 Sectoral Allocation
32
9.40Maturity (in years)
Date of Inception: 12-Mar-03
Enrich BM
41.70%
G-secEquities
32.48
NCD22.00%
MMI, Deposits, CBLO & Others
3.81%
8.07%Yield to Maturity :
Sovereign
65.46%
AA-AAA
29.69% 2.88%AA
1.97%
2.40%
3.10%
6.63%
7.47%
7.61%
10.07%
10.42%
10.77%
15.66%
17.17%
OTHERS
MANUFACTURING
CAPITAL GOODS
OIL AND GAS
FMCG
PHARMACEUTICALS
FINANCIAL SERVICES
AUTOMOBILE
SOFTWARE / IT
BANKING
9.68% 20.66%
69.67%
Less than 2 years 2 to 7 years 7 years & above
Oct
-07
Mar-
08
Aug-0
8
Jan-0
9
Jun-0
9
Nov-
09
Apr-
10
Sep-1
0
Feb-1
1
Jul-11
Dec-
11
May-
12
Oct
-12
Mar-
13
Aug-1
3
Jan-1
4
Jun-1
4
Nov-
14
Apr-
15
Sep-1
5