Embed Size (px)
Citation preview

Invest Malaysia
Sustainable value creation through internet growth
9 June 2014

Malaysia offers opportunities for continued growth
30 million population
144% mobile penetration
38% smartphone penetration
Basic and advanced Internet segments
> 85% are prepaid users
Malaysia [1]
3rd largest mobile operator with 11 million subscribers
82% 3G population coverage
DiGi [2]
2 Source: [1] Department of Statistics Malaysia and 4Q13 SKMM report; [2] DiGi’s data as at 1Q14 MYR 1 = USD 0.31
MYR 42 billion market cap

5.41 5.96
6.36 6.73 6.80
2010 2011 2012 2013 1Q14 (4Q rolling) Revenue
25.7% 27.1% 27.4% 28.1% 28.5%
RMS
DiGi has consistently outperformed the industry to take revenue market share despite gap in 3G coverage
• Solid Y-o-Y revenue development consistently outperforming the industry
• #1 in prepaid and steadily unlocking the growth opportunity from mobile Internet
• 1Q14 (4Q rolling) revenue market share rose to 28.5% backed by
– Stronger network with significantly narrowed data coverage gap
– Relentless focus on Internet for All
• Network swap to deliver cost efficient closure of 3G gap and quality improvement
3
Revenue and market share
3G population coverage %
76% 81% 84% 85% 85%
47% 54%
67% 80% 82%
2010 2011 2012 2013 1Q14
Competitors DiGi
MYR bn CAGR: 5.9%

… and managed the transition to data while keeping healthy margins
4.0 4.0 4.1 4.0 4.0
1.2 1.6 1.8 2.1 2.2 0.2 0.3 0.5 0.6 0.6 5.4 6.0 6.4 6.7 6.8
2010 2011 2012 2013 1Q14 (4Q rolling)
Voice Data Device & others
Revenue breakdown
MYR bn
Margins development %
44% 46% 46% 45% 45%
31% 36% 35% 34% 35%
2010 2011 2012 2013 1Q14 (4Q rolling)
EBITDA Margin Ops Cash Flow Margin
• Mobile data grew 14% in 2013 driven by mobile Internet
– Internet revenue grew 47%
– Messaging revenue fell 14%, although well cushioned by gains from Internet revenue
• Successfully retained voice revenue
• Enabled growth and transition to data with sustained healthy margins through
– Effective pricing to stimulate data growth while balancing monetisation
– Strong cost discipline to realize efficiencies
4
DiGi set its direction to deliver ‘Internet for All’ in 2011
• Proactive strategy to take position and capture the growth from Internet
• Internal transformation to build key capabilities and mindset
• External position to clarify and communicate our impact to society
5
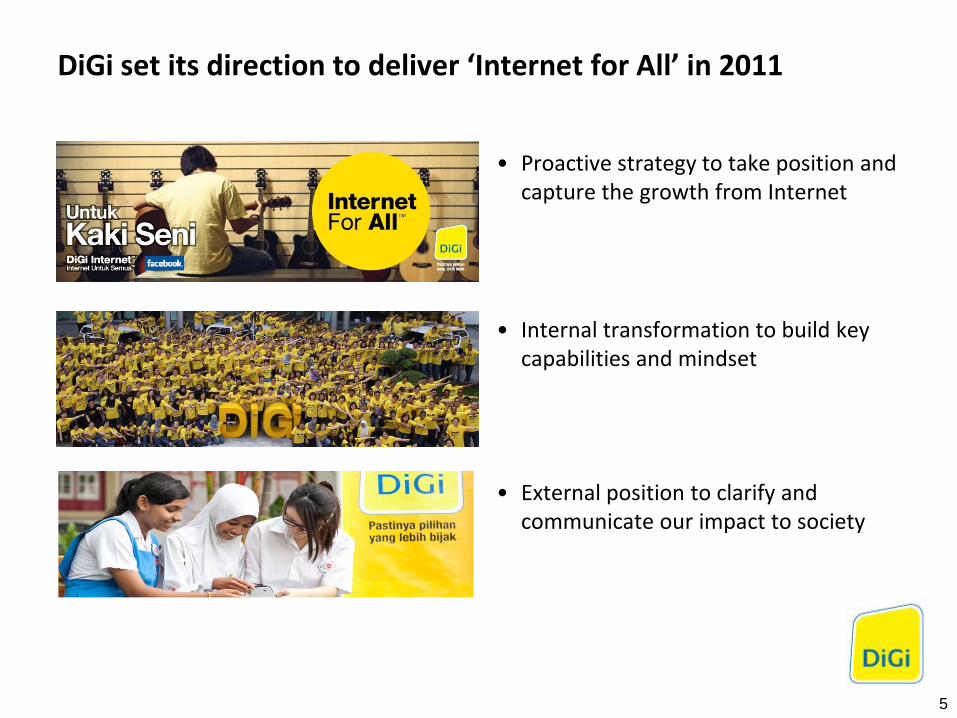
Four elements materialize as part of our formula for success in driving profitable internet penetration
6
Pricing
Devices
Partners
Network Building efficient networks quickly, but smartly
Driving device quality and adoption in base
Getting pricing and packaging right
Leveraging digital services and partnerships for fast adoption

Driving higher smartphone penetration through affordable device bundles
13.0%
21.8% 26.4%
38.1% 38.4%
2010 2011 2012 2013 1Q14
Smartphone penetration % • Majority of devices are sold in the open market
• Stimulated solid increase in smartphone penetration through
– Affordable smartphones bundles
– Government youth program
• Proliferation of smartphone users spurred higher mobile internet take up
• Partnership with Google to deliver MyAndroid Hub experience in retail
7
DiGi Android Hub
Competitors: btw 35% - 56%

Actively using digital services and partnerships to drive data penetration and spur increased usage
• 32% y-o-y increase to reach 4.0 million active Internet users, i.e. 37% penetration
• Driving Internet penetration through digital services providing reason to use
– Facebook continues to be a strong driver of penetration
– Social messaging apps drive low quota ‘always on’ demand
– Opera Mini partnership has driven penetration with basic offering
• Proactively piloting and trying out for relevance and experience
Growth in active Internet users [1]
Leveraging digital services opportunities
3.0 3.4 3.6 3.9 4.0
1Q13 2Q13 3Q13 4Q13 1Q14
Internet subs
# mn
8 [1] Active Internet users with at least 50KB/month

Leading innovation in data pricing to balance data uptake and usage with monetization
• 55% y-o-y growth in data traffic – with 87% growth in prepaid data and 29% in postpaid
• Healthy monetization with 47% growth in Internet revenues in 2013
• Successful data pricing:
– Daily, weekly, monthly bite-sized add-ons
– Weekly social messaging pass
– Separate postpaid quota for smart apps
– Prepaid daily max cap
– Broadband day plan to leverage off-peak
– Extra quota with short validity for campaigns
Growth in data traffic and Internet revenue
9
Data pricing innovations
-
5
10
1Q13 2Q13 3Q13 4Q13 1Q14
Prepaid Postpaid ‘000 TB
41% 53% 52% 43% 41% Internet rev. growth

Leveraging strength in distribution to drive sales and Internet penetration in new coverage areas
• Leveraging more than 15,000 distribution touch points to drive Internet campaigns
• Insights and execution by 228 clusters to identify opportunities and manage actions
• Expansion of postpaid dealers to cater for Internet growth demands
• Online channel integration with retail
10

DiGi has managed to grow from data while modernizing the network and expanding 3G coverage at healthy capex to sales
11
• Healthy capex to sales ratio through network modernisation and 3G expansion
• Relentless drive for operational efficiency and sourcing synergies to manage capex
• Fibre collaboration with Celcom and TM
– Securing quick access to fibre
– Capitalizing on joint built – sharing synergies to optimize cost
Industry collaboration on fibre network
Capex /sales %
13%
10% 11% 11% 12%
2010 2011 2012 2013 1Q14
Capex/sales

Consistently driving solid shareholders return over the years
1,681
2,154 2,229 2,301 2,349
2010 2011 2012 2013 1Q14 (4Q rolling)
Ops Cash-Flow
MYR bn
• Delivered healthy Ops Cash-Flow whilst investing strategically on growth opportunities
• EPS rose steadily as a flow through from continuous revenue growth
• 16% [1] higher dividend payout totalling to MYR 1.7 billion in 2013 alongside with
– Solid balance sheet with sizeable cash-pile and net debt/EBITDA within 0.1x
– On-going drive on capital management efficiency
• YTD share price gained 10.7% [2]
– Positively reflecting DiGi’s consistent solid performance
16.3 17.5 26.3 21.3 23.7
- 10.0 20.0 30.0
2010 2011 2012 2013 1Q14 (4Q rolling)
Dividend Special Dividend EPS
143% 108% 170% 97% 99% Payout Ratio
sen/per share
Dividend and EPS development
[1] Excluding special dividend of 8.0 sen in 2012; [2] Updated as at 3 June 2014
CAGR: 9.2%

Winning the high-value Internet savvy customers
• Ensure data experience and coverage on par
• Deliver best end-to-end Internet experience
• Manage quota, speed and monetization
• Ensure attractive partners and leading services
Growing penetration and usage among majority
• Trigger penetration and frequency by giving reason to use
• Leverage partnerships incl. messaging for ‘always on’
• Leverage bite sized pricing and BTL campaigns
• Push right smartphones
Truly taking Internet to ALL Malaysians
• Entry level offerings and packaging of digital services
• Targeted campaigns and free trials
• Push low end smartphones
• Explore verticals, e.g. education, health
DiGi will continue to capture the Internet growth opportunity in Malaysia through a segmented but inclusive approach
1 2 3
13

1. With 40% mobile Internet penetration Malaysia continues to offer opportunities for growth
2. It is possible to capture growth from mobile Internet profitably
3. Success requires solid execution across pricing, devices, partnerships and network
4. Capturing the next wave of growth will require a segmented approach
14
2014 Guidance 4 – 6% Revenue growth Sustain EBITDA margin at
2013 level

Disclaimer
16
This presentation and the following discussion may contain forward looking statements by DiGi.Com Berhad (DiGi) related to financial trends for future periods. Some of the statements contained in this presentation or arising from this discussion which are not of historical facts are statements of future expectations with respect to financial conditions, results of operations and businesses, and related plans and objectives. Such forward looking statements are based on DiGi’s current views and assumptions including, but not limited to, prevailing economic and market conditions and currently available information. These statements involve known and unknown risks and uncertainties that could cause actual results, performance or achievements to differ materially from those in the forward looking statements. Such statements are not and, should not be construed, as a representation as to future performance or achievements of DiGi. In particular, such statements should not be regarded as a forecast or projection of future performance of DiGi. It should be noted that the actual performance or achievements of DiGi may vary significantly from such statements.

720 747
766
810 778
1Q13 2Q13 3Q13 4Q13 1Q14
529 561 532 680
576
1Q13 2Q13 3Q13 4Q13 1Q14
32% 34% 31% 39% 34% 44% 45% 45% 47% 45%
1,647 1,653 1,700 1,733 1,718
1,476 1,526 1,553 1,577 1,554
1Q13 2Q13 3Q13 4Q13 1Q14
Revenue Service Revenue
Revenue development
17
RM mn
Performance summary at a glance
36.7% active internet subscribers [1] ‘000
10,372 10,548 10,827 10,995 10,885
3,035 3,410 3,620 3,856 3,993
1Q13 2Q13 3Q13 4Q13 1Q14
Total Subs Internet Subs
329 380
449 548
485
1Q13 2Q13 3Q13 4Q13 1Q14
28% PAT margin
-11.7%
+47.4%
45% EBITDA margin
-4.0%
+8.1%
34% Ops Cash-Flow margin
-15.3%
+8.9%
[1] Refined to excl. unique subs with usage below 50kB /month
-0.9%
+4.3%
-1.0%
+4.9%