Embed Size (px)
Citation preview

INVEST IN THE
Q U A R T E R L Y R E P O R T S E P T E M B E R - 2 0 2 1
GROWTH POTENTIALOF PAKISTAN


FUND INFORMATION
CONDENSED INTERIM STATEMENT OF ASSETS AND LIABILITIES
CONDENSED INTERIM INCOME STATEMENT
CONDENSED INTERIM STATEMENT OF COMPREHENSIVE INCOME
CONDENSED INTERIM STATEMENT OF MOVEMENT IN UNITHOLDERS’ FUND
CONDENSED INTERIM CASH FLOW STATEMENT
NOTES TO AND FORMING PART OF THE CONDENSED INTERIM FINANCIAL STATEMENTS
WHO WE ARE
CORE VALUES
VISION AND MISSION
DIRECTOR’S REPORT
05
07
09
14
TABLE OF CONTENT

MIF
AM
MF
KMIF
MEF
MPE
TF
MBF
MA
AF
MD
EF
MG
F
MIIF
MSF
MC
F
MRA
F
MFP
F
MSA
F
MSA
F-II
MSA
F-III
MTP
F
TABLE OF CONTENT
MD
IF
38 55 70 85 100 114 132 148 164 178 197 211 232 246 264 286 312 332 345
39 56 71 86 101 115 133 149 165 179 198 212 233 247 264 287 313 333 346
40 57 72 87 102 116 134 150 166 180 199 213 234 248 267 289 315 334 347
41 58 73 88 103 117 135 1 51 167 181 200 214 235 249 269 291 317 335 348
42 59 74 89 104 118 136 1 52 168 182 201 215 236 250 270 292 318 336 349
43 60 75 90 105 119 137 1 53 169 183 202 216 237 251 272 296 320 337 -
44 61 76 91 106 120 138 154 170 184 203 217 238 252 274 298 322 338 352

WHO WE AREWe began our journey in 1995. The objective of the journey was simple, to bring ShariahCompliant investment options to the people of Pakistan. In over 26 years since then, Al Meezan Investment Management Limited, due to the trust our customers hold in us, has now become the Largest Shariah Compliant Asset Manager in Pakistan. With an innate culture of innovation and the purpose of making Shariah Compliant investing every Pakistani’s first investment avenue of choice, Al Meezan has achieved assets under management base of over Rs. 189 Billion (as on June 30, 2021).
Al Meezan offers a full breadth of Shariah Compliant investment solutions ranging from equity, sector, balanced, asset allocation, fixed income, money market, capital preservation, fund of funds, commodity, exchange traded and voluntary pension schemes. Depending on each investor’s need, we provide expert guidance enabling them to reach their financial goals.
As Pakistan’s only full-fledgedShariah Compliant Asset Management Company
with the sole mandate to provide Shariah Compliant investment solutions to our valued clients, we have
enabled our customers towards achieving their financial objectives.


Our values are not about what we do or how we do it in fact they are about who we are and why we exist. These values, which fuel our drive to achieve newer milestones at
every step of our journey to success are:
Our Core Values are the 5 pillars of our foundation. They reflect and reinforce our character and standing as an organization. These values depict the paradigm of our internal and external expectations: Our dealings with members of the organization, our customers, the shareholders and the communities we serve. Our corporate culture is
based on these values and serves as a beacon of guidance for all our employees.
OURCORE VALUES

SHARIAH COMPLIANCEWe ensure that all business operations and activities are Shariah Compliant. As a Shariah Compliant entity we are also accountable for ensuring that rulings and decisions made by the regulators, Shariah Board and Shariah Advisors are complied with across the organization.
PROFESSIONAL EXCELLENCEProfessional excellence is about achieving excellence as an employee. It is at the core of being a “professional.” Ensuring our approach to work and the people we work with – supervisors, colleagues and/or customers – is in a professional and respectful manner.
SOCIAL RESPONSIBILITYWe work in an ethical framework, which suggests that as an entity we have an obligation to act for the benefit of our society at large. We want to contribute towards sustainable development not only through our products but also through the way we conduct business.
ETHICAL STANDARDSWe practice high ethical standards at work and in our services. Maintaining high ethical standards in the workplace translates in prioritizing the interest of the client, acting with integrity, competence and diligence, and respecting our dealings with the public, clients, prospective clients and colleagues.
SERVICE EXCELLENCEService excellence is an attitude engrained in every department and employee. From support staff to the CEO, we simply go beyond delivering products and helping customers achieve their financial objectives. It is essential that we provide a unique customer experience by proactively anticipating and exceeding customers’ needs every time. Excellence is a consistent, premium service at every point of contact which is set by our service-oriented tone that drives our company’s strategy at every level.

To make
Shariah Compliant Investinga first choice for investors.
VISION

MISSION
To establish Al Meezan as a
for savings and investments by offeringleading and trusted brandinnovative Shariah Compliant investment solutionsthrough ethical conduct, value added services & optimalreturns, while protecting the interest of all stakeholders.

OUR BRANCH NETWORK

FTC Branch, Karachi:Ground Floor, Finance and Trade Centre, Shahrah-e-Faisal, Karachi Tel: (92-21) 111-633-926, 35630722-26
Sales Hub, Karachi:Banglow # 43-5-E/2, Shah Abdul Latif Road, PECHS Block 6, Karachi. Tel: (92-21) 34559262-5
North Nazimabad Branch, Karachi:Shop # G-1, G-2, Ground Floor, Ajwa Residency, B-1, Block-L, North Nazimabad, Karachi Tel: (92-21) 36641491-4
Bahadurabad Branch, Karachi:Shop # 4, Ground floor, Adam Arcade, B.M.C.H Society, Shaheed-e-Millat Road, Block #3, Karachi Tel: (92-21) 34923112-6
DHA Branch, Karachi:Shop # 01 Ground Floor, Sunset Commercial St-02, Khayaban e Jami, Near Baitussalam Masjid, Phase IV, D.H.A Karachi. Tel: (92-21) 35802411-4
Gulshan-e-Iqbal Branch, Karachi:Shop # 02, Ground Floor, Shelozon Center, Block 15, Gulshan-e-Iqbal Karachi. Tel: (92-21) 34990491-4
Site Area Branch, Karachi:Shop # 05, plot # B/9-D, Main Estate Avenue, Site Area Karachi. Tel: (92-21) 32570051-4
DHA, Badar Commercial Branch, Karachi:Plot # 8C, Shop # 03 , Street # 10, Badar Commercial, DHA phase V, Karachi. Tel: (92-21) 35171381-4, 021-37131680–1, 021-37131683-4
Gulistan-e-Jauhar Branch, Karachi:Plot # B11, Shop # 06, Ground Floor, Alam Shah Bukhari Apartment (Right Opposite Hilltop Banquet Hall), Block -19, Gulistan-e-Jauhar, Karachi. Tel: (92-21) 34187181-84
Clifton Branch, Karachi:Shop # 3, ground Floor, Plot # D-39 , Tabba
Tower Gizri Road, Karachi Tel: (92-21) 35155219, 021-35155220
021-35155221
Hyderabad Branch:Shop # A-1, 1 & 2, Mezzanine Floor Shifa
Heaven, Main Auto Bhan Road Hyderabad Tel:(92-22) 3821277-80
Gulberg Branch, Lahore:Ground Floor, Leeds Centre, Gulberg III
Main Boulevard, LahoreTel: (92-42) 111-633-926, 042-35783608-12
042-32560548
DHA Branch, Lahore:1st Floor, Meezan Bank T Block Branch, Plot No. 7, CCA-2, T Block, Phase II, DHA Lahore
Tel: (92-42) 35747060-3, 042-32560125
Johar Town Branch, Lahore:Plot No.39, Block-L, M.A. Johar Town
Scheme, Abdul Haq Road, LahoreTel: (92-42) 35290585-6, 042-35290588
Islamabad Branch:O�ce No 7 Ground Floor, Buland Markaz
Jinnah Avenue Blue Area, IslamabadTel: (92-51) 2801471-73
Rawalpindi Branch:Plot # 17, Zubair Plaza, 1st Floor, Chaklala
Scheme III,Main Commercial Area Rawalpindi Cantt, Rawalpindi
Tel: (92-51) 5766364-6
Faisalabad Branch (Susan Road) :Shop # 27, First Floor Plot # 27, Susan Road
Near Chenab Market FaisalabadTel: 041-8503267, 041-8503268041-8503269, (92-41)5250001
Peshawar Branch: O�ce No 6-D, Ground Floor, 6 Saddar Road
, Peshawar Cantt, Peshawar Tel: (92-91) 5271911-14

Multan Branch:1st Floor, Meezan Bank Rasheedabad Chowk Branch, Aneesa Plaza Rasheedabad Chowk, Khanewal Road Multan.Tel: (92- 61) 6305911-5
Abbottabad Branch:O�ce No 2, 3rd Floor Zaman Plaza, Near Ayub Medical Complex, Mansehra Road, Abbottabad.Tel: (0992)-414123-24
Gujranwala Branch:Ground Floor, 387-A, Model Town, Gujranwala Tel: (92-55) 842205-8
Swat Branch:Mezzanine Floor, Sultan e Room Plaza, Main G.T Road, Mingora Swat Tel: (92-946) 714023-6
Sialkot Branch:Second floor Meezan Bank, Qayum plaza, Aziz Shaheed Road, Sialkot Cant, Sialkot
Tel: (92-52) 4290460-2
Gujrat Branch:P-1037, Ground Floor, G.T Road,
IX Block, Gujrat Tel: (92-53) 3724766-67
Bahawalpur Branch:Shop # 27, Ground Floor Liberty Square,
Fuji Basti Chowk, Airport Road, Bahawalpur Cantt
Tel: (92-301) 1121912
Quetta Branch:1st floor Mega Trade Center, Ward No.18,
Tappa Urban No.1, Shahrah-e-iqbal, Manan Chowk, Tehsil & District Quetta
Tel: (92-81) 2824156-58

____________________________________________________________________________________________________
1st Floor, Block ‘C’, Finance & Trade Centre, Shahrah-e-Faisal, Karachi 74400, Pakistan. UAN: (92-21) 111-633-926 (111-MEEZAN) Fax: (92-21) 35676143
E-mail: [email protected] Web Site: www.almeezangroup.com
DIRECTORS’ REPORT –
FUNDS UNDER MANAGEMENT COMPANY
The Board of Directors of Al Meezan Investment Management Limited is pleased to present the financial statements of the following open-end funds and a voluntary pension scheme for the period ended September 30, 2021.
Equity Funds
· Meezan Islamic Fund
· Al Meezan Mutual Fund
· KSE-Meezan Index Fund
· Meezan Pakistan Exchange Traded Fund
· Meezan Dedicated Equity Fund
Sector Specific Fund
· Meezan Energy Fund
Income Funds
· Meezan Islamic Income Fund
· Meezan Sovereign Fund
· Meezan Daily Income Fund
Money Market Fund
· Meezan Cash Fund
Meezan Rozana Amdani Fund
Balanced Fund
· Meezan Balanced Fund
Funds of Funds
· Meezan Financial Planning Fund of Fund
· Meezan Strategic Allocation Fund
· Meezan Strategic Allocation Fund-II
· Meezan Strategic Allocation Fund-III
Commodity Fund
· Meezan Gold Fund
Asset Allocation Fund
· Meezan Asset Allocation Fund
Pension Fund
· Meezan Tahaffuz Pension Fund
Economic Review During the first quarter of FY22, apart from the external account, all major macroeconomic indicators continued to show moderate improvement. In this respect, most high-frequency domestic demand indicators such as sales of automobiles, petroleum, and cement along with electricity generation continue to depict significant improvement. The SBP expects the GDP growth during FY22 to be between 4-5%, which will be the highest economic growth rate in current regime.
During the first quarter of fiscal year, inflation averaged 8.6% YoY from 8.8% during the same period last year, within the projected range of 7.0%-9.0%, as guided by the State Bank of Pakistan. Core inflation readings remained soft around 6.5% during the period, which indicates that demand-side pressures in the economy remained under control. However, the SBP increased the policy rate by 25bps to 7.25% in the September Monetary Policy meeting, in order to reign in the widening imbalances in the external account. This was the first increase since the onset of COVID-19, where the decision showed that the SBP considered the pandemic to be a more manageable risk for Pakistan, given infection ratio fell below 4% by the end of September and more than 70% of the adult population has had at least the first dose of vaccination.
The Current Account balance swelled to USD 2.3 billion during July-August 2021 from a surplus of USD 0.8 billion during same period last year. While Remittances and Goods Exports continued to clock in near all-time levels of around USD 2.7 billion and USD 2.3 billion per month, respectively. There was 68% YoY growth in Goods Imports to over USD 6.0 billion per month, which worsened the Current Account balance. The sharp growth in Imports was because of broad-based growth in the Economy, led by imports of machinery, petroleum, food and chemicals; this was exacerbated by a surge in international commodity prices, including that of crude oil. As a result, the PKR depreciated about 8% against the USD during the quarter and closed at a level of 170.7/USD. The devaluation occurred despite the SBP holding record level of Forex reserves of USD 19- 20 billion during the quarter; as the SBP has significantly reduced intervention in the currency market and was using the exchange rate to be the first line of defense against external account pressures, before adjusting the monetary policy. The government has complemented the rate hike with measures to discourage non-essential or luxury imports.
The fiscal side, however, seemed more promising, where FBR tax collection surged 38% YoY to PKR 1.395 trillion during 1QFY22, predominantly on the back of significantly higher imports, which contributed 52% of the collection, aided further by the overall economic growth. Meanwhile, there has been minimal slippages on the expenditure side; the development expenditure remains moderate as hitherto the government has smartly incentivized the private sector to lead construction activity. Pakistan government targets to further improve its fiscal performance in FY22, which will be corroborated by the resumption of IMF EFF program following negotiations between the government and IMF in October 2021. The Finance Minister in particular has expressed his resolve to continue the program, even if it entails tough measures such as power tariff hikes.
Money Market Review SBP in its latest monetary policy meeting decided to raise the policy rate by 25bps and keep it at 7.25% for the next two months. The central bank cited rising inflation number, increasing pressure on current account and currency devaluation as the main drivers for this change in the policy rate. During the start of fiscal year, money market participants expected no change in the monetary stance of the central bank, which was also evident from the secondary market T-bills and PIB yields, that showed a decline in the range of 5bps to 25bps. However, after the reversal in monetary stance of SBP, the secondary market yields adjusted sharply to reflect the change in policy rate. During the 1QFY22, KIBOR rates witnessed an increase in the range of 33 bps to 85 bps, whereby 3-months, 6-months and 12-months KIBOR rates were up by 33bps, 46 bps and 85

bps, clocking in at 7.78%, 8.15% and 8.93%, respectively. On the other hand, in the secondary market, both T-bills and PIB yields also showed an upward trend. PIB yields rose in the range of 45 bps to 75 bps, whereby 3-year bond yield closed at 9.72% (up by 73 bps), 5-year bond yield closed at 9.95% (up by 46 bps), and 10-year bond yield closed at 10.45% (up by 51 bps). In the shorter tenor, government paper yields were up in the range of 30 bps to 90 bps. On the liquidity front, the money market remained stable due to continuous Open Market operations (OMO) injections from SBP, where the Central Bank ensured that the overnight money market remains close to the policy rate. During FY22 so far, SBP borrowed Rs. 3.15 trillion through T-Bills against the maturity of Rs. 3.90 trillion. On the other hand, SBP accepted Rs. 566 billion through long term PIBs (Fixed + Floater) against the maturity of Rs. 1 trillion.
On the Shariah Compliant instrument front, GoP Ijarah/Sukuk prices also showed an upward trend due to immense interest shown by Islamic Market participants. The table below summarizes details of Ijarah/Sukuk:
The central bank also conducted the much awaited GoP Ijarah auction during the month of September after a gap of seven months. The market participants welcomed this auction with heavy participation of Rs 247bn against a target of Rs. 100bn. SBP also supported the Islamic side of money market by accepting Rs. 203bn in both Floating Rate and Fixed Rate Ijarah and maintained the cut-off spread of minus 10bps for the Floating Rate Ijarah and for Fixed Rate Ijarah the cut-off clocked in at 9.70% (+0.25%). The corporate sector continued facing some challenges in raising money through long tenor Sukuk, however, an increase in the issuance of shorter tenor instruments was witnessed which played a crucial role in absorbing some portion of excess liquidity available with Islamic institutions.
Equity Review During first quarter of FY22, the market remained under pressure with the KMI-30 index shedding 5.6% during the quarter to close at 72,316 points, while the KSE-100 index dropped by 5.2%, to reach at 44,900 points.
The market remained range bound during the first two months of the quarter; where, expectation of strong corporate result defied the worsening of Current Account deficit and rising Covid cases, thus limiting the market fall. The KSE-100 touched its peak level of the period in late-August, at 48,112 points. Subsequently, the downgrade of Pakistan by MSCI from Emerging Market (EM) to Frontier Market (FM) amid emerging macroeconomic concerns and signs of weakening of US-Pakistan relations, led to the worst market rout of the year in September where the KSE-100 Index fell by 5.3%. Active Covid cases rose initially during the quarter from around 31,000 at June end to its peak of around 95,000 as the country experienced its fourth wave of Covid-19. However, due to timely restrictions placed by the government and substantial increase in rate of vaccination, active cases declined substantially to around 48,000 level at September end, with infection ratio declining to around 3% from peak 9% witnessed during the quarter.
30-Jun 30-Sep YTM
XX Floater 6.40% 30-Oct-21 76.39 30-Apr-25 97.12 97.80 7.40% 0.68
XXI Floater 7.47% 29-Nov-21 74.62 29-May-25 100.63 100.76 7.59% 0.13
XXII Floater 7.47% 24-Jun-21 47.24 24-Jun-25 100.60 100.83 7.57% 0.23
XXIII Floater 7.32% 29-Jan-22 186.91 29-Jul-25 100.50 100.61 7.51% 0.11
XXIII Fixed 8.37% N/A 44.60 29-Jul-25 99.48 99.89 8.40% 0.41
XXIV Floater 7.48% 9-Dec-21 227.26 9-Dec-25 100.92 101.06 7.53% 0.14
XXIV Fixed 9.45% N/A 8.25 20-Jan-26 101.23 101.25 9.09% 0.02
PES I Floater 8.34% 1-Mar-22 200.00 1-Mar-29 106.75 106.75 7.54% 0.00
PES II Floater 7.59% 21-Nov-21 199.97 21-May-30 100.80 101.50 7.58% 0.70
Total 1,065.22
Ijarah Type Coupon MaturityIssue Size (bn)Next ResetReval
Change

With external account pressure building up due to rising current account deficit during the quarter, PKR witnessed hefty devaluation of around 8% versus USD, while the SBP also shifted from its accommodative monetary policy stance, in place since the advent of Covid-19, by raising policy rate by 25bps to 7.25%. The MPC noted that over the last few months the burden of adjusting to the rising current account deficit had fallen primarily on the exchange rate and it was appropriate for other adjustment tools, including interest rates, to also play their due role. In a widely expected outcome, the MSCI on September 07, 2021, announced its decision to downgrade Pakistan to FM status with effect during its November review, as Pakistan had a negligible weight of 2bps in MSCI EM Index. The reason for reclassification is the steady decline in market capitalization of Pakistan constituents since 2017 leading towards ineligibility on meeting the criteria in the market classification framework for EM. Although the index continuity rule had been applied for MSCI Pakistan since November 2018 to artificially maintain the MSCI Pak index in EM, none of the three companies in MSCI EM has met the EM classification framework since November 2019. Trading activity in the market declined significantly during the first quarter of FY22. Total volumes traded in the KMI-30 index stocks dipped by 71% YoY to 50 million shares, while volumes in the KSE-100 index stocks decreased by 53% to 141 million shares. Meanwhile, valuations of the overall market remained attractive, around 5.3x forward P/E, below the historical mean level of about 8.4x. After witnessing slowdown in corporate profitability during peak Covid-19 quarters of March and June 2020, the corporate profitability has witnessed a healthy surge since then. We have witnessed strong corporate results during the June-21 quarter, with decent cash payouts as well. The allure of equities over the fixed income asset class remains; this is depicted by the substantial difference between the market’s earnings yield and the yield on benchmark government securities despite the recent rise in fixed income yields. On the global front, flows into MSCI EM remained upbeat with inflows of USD 3.9bn into EM asset classes, which is in continuation of inflows of USD 41.5 billion through EM ETFs in last fiscal year. Flows continued to remain concentrated in Equities, which attracted USD 3.2 billion, deployed across key EM markets. The MSCI EM Index was under pressure during the first quarter FY22 despite continued inflows into the EMs with the index losing 9% in USD terms during the period; however, the MSCI World Index sustained its position and remained relatively unchanged during the quarter under review. Unabated rise in key inputs, namely, coal, RLNG and oil, is expected to keep the key EM and DM economies under stress as inflationary pressures mount. Supply shortages in key products and commodities were quite visible in the first quarter FY22 as demand normalized back to pre-Covid levels while COVID restrictions in some key supply centers disrupted global supply chains. International oil prices continued to rise with Brent surging by 5% during first quarter FY22 on the back of supply shortages and unwillingness of oil producers to raise production levels. Brent crude ended the period at USD 78.5 per barrel.
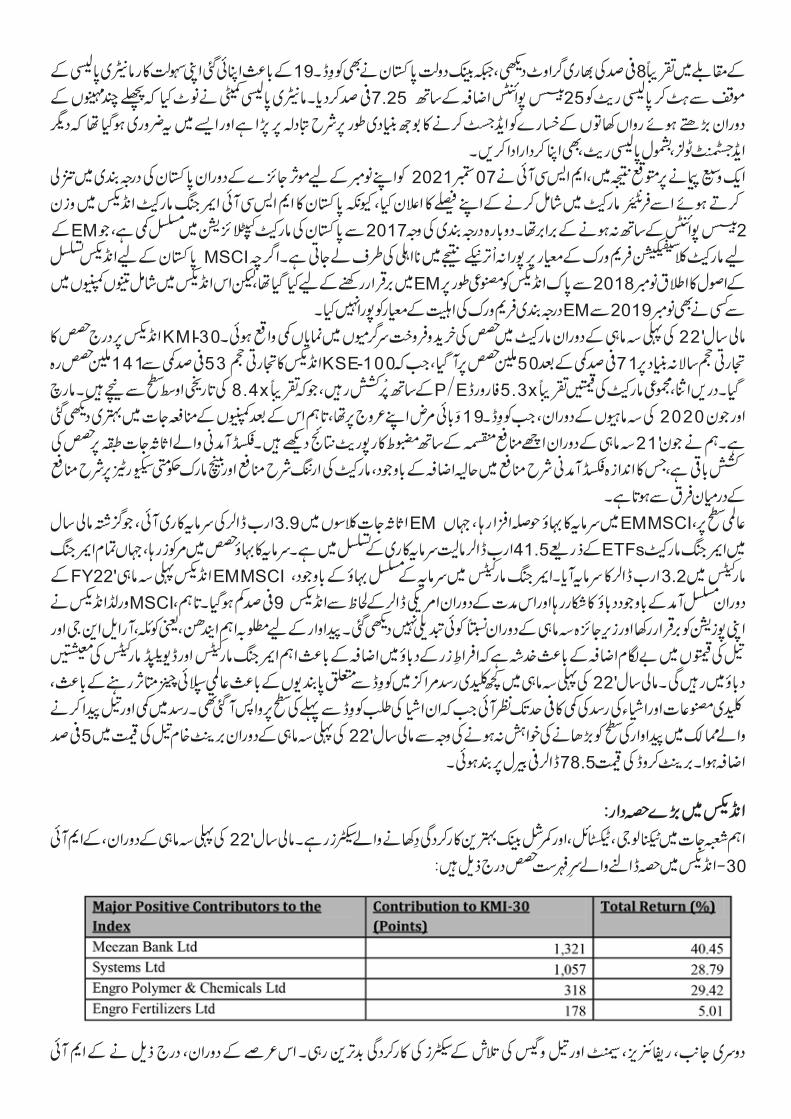
Major contributors to the Index: Among the key sectors, Technology, Textile and Commercial Banks were the best performing sectors. The top contributing stocks in the KMI-30 index during first quarter FY22 were:
Major Positive Contributors to the
Index
Contribution to KMI-30
(Points)
Total Return (%)
Meezan Bank Ltd 1,321 40.45
Systems Ltd 1,057 28.79
Engro Polymer & Chemicals Ltd 318 29.42
Engro Fertilizers Ltd 178 5.01

On the flip side, Refineries, Cement and Oil & Gas Exploration sectors were amongst the worst performing sectors. The key laggards in the KMI-30 index during the period were:
Major Negative Contributors to the
Index
Contribution to KMI-30
(Points)
Total Return (%)
Lucky Cement Ltd -1,494 -18.59
Pakistan Petroleum Ltd -736 -15.57
Oil & Gas Development Co Ltd -643 -12.94
Unity Foods Ltd -636 -31.77
Equity Flows Foreigners again remained net sellers during the first quarter of FY22, generating a total net outflow of around USD 83.4 million. Sell off mainly concentrated in the Commercial Banking (USD 46.3 million), Cement (USD 12.0 million) and Fertilizer (USD 4.5 million). In line with trends recently, Individuals continued to support the market with fresh inflows of USD 32.5 million. This was followed by significant buying by others (mainly government pension funds) and Banks/DFI of USD 26.8 million and USD 21.3 million, respectively. Broker prop books remained main sellers of stocks with a total outflow of USD 15.0 million worth of securities. Mutual Funds activity remained subdued with marginal selling of USD 7.4 million. The following graph shows the movement of the KMI-30 during the period and key driving factors:

Mutual Fund Industry Review During the first two months of FY22, AUMs of the Mutual Funds industry increased by 1.6% to Rs. 1,066 bn. Shariah Compliant AUMs increased by 1.1% to Rs. 444 bn which brings the share of Shariah Compliant funds at 41.7% in the industry. Al Meezan’s share in the Mutual Funds industry stood at 16.2%; while amongst the Shariah Compliant Funds, it had a share of 38.8% as of August 31, 2021. Meezan Tahaffuz Pension Fund market share in the Pension Fund category stood at 34.8% while amongst the Shariah Compliant Funds, it held 52.9% market share by end of August. 2021.
Performance Review (Funds)
The table provided below depicts a summary of 1QFY22 performance of funds under our management:
Funds Type
Net Assets
Rs. in millions
Growth in Net
Assets for
1QFY22 (%)
Returns for
1QFY22
(%)
Benchmark
for 1QFY22
(%)
Al Meezan Mutual Fund (AMMF) Equity 4,471 -9.09 -2.7 -5.6Meezan Islamic Fund (MIF) Equity 32,264 -5.87 -2.7 -5.6KSE Meezan Index Fund (KMIF) Equity 2,776 2.94 -5.2 -5.6Meezan Energy Fund (MEF) Equity 507 -13.21 -6.6 -5.6Meezan Dedicated Equity Fund (MDEF) Equity 885 -12.87 -4.6 -5.6
Meezan Islamic Income Fund (MIIF) Income 30,219 10.91 8.3 3.1Meezan Daily Income Plan - I* Income 2,282 - 7.1 3.1Meezan Cash Fund (MCF) Money Market 13,412 -1.07 7.9 3.3Meezan Sovereign Fund (MSF) Income 10,743 8.09 9.5 3.1Meezan Rozana Amdani Fund (MRAF) Money Market 47,835 -35.97 7.8 3.3
Meezan Balanced Fund (MBF) Balanced 4,620 -1.98 -1.2 -2.3
Meezan Pakistan Exchange Traded Fund (MZNP-ETF) Exchange Traded 81 105.16 -13.6 -13.2
Meezan Financial Planning Fund of Fund
Aggressive 343 -1.54 0.01 -4.0Moderate 166 13.78 1.2 -2.4Conservative 229 2.23 1.7 -0.8MAAP-I 159 2.04 3.0 -4.0
Meezan Strategic Allocation Fund
MSAP-I 617 -8.34 -0.6 -4.0MSAP-II 409 -9.65 -1.2 -4.1MSAP-III 409 -18.26 -1.6 -4.0MSAP-IV 173 -18.77 -0.7 -4.0MSAP-V 61 -2.69 -1.6 -4.1MSAP-MCPP-III 257 -3.09 1.3 -0.4
Meezan Strategic Allocation Fund - II
MSAP-II -MCPP-IV 746 -2.74 -0.6 -2.1MSAP-II -MCPP-V 90 -4.31 1.5 -0.2MSAP-II -MCPP-VI 88 -4.97 2.3 0.8MSAP-II -MCPP-VII 102 -2.12 1.7 0.4MSAP-II -MCPP-VIII ** 31 -10.85 1.7 0.5
Meezan Strategic Allocation Fund - III
MSAP-II -MCPP-IX 95 -4.49 -0.8 -2.1
Meezan Gold Fund (MGF) Commodity 487 -0.03 0.1 -0.2
Meezan Asset Allocation Fund (MAAF) Asset Allocation 1,505 -10.02 -4.8 -4.7
Meezan Tahaffuz Pension Fund
Equity sub Fund 5,278 -4.24 -2.6Debt sub Fund 4,466 3.03 8.4Money Market sub Fund 3,440 1.80 7.3Gold Sub Fund 120 -10.82 -0.3
* Launched September 13, 2021, ** Matured on August 27, 2021
Equity Funds
Fixed Income Funds
Balanced Fund
Exchange Traded
Fund of Funds
Fund of Fund
Commodity Fund
Asset Allocation Fund
Pension Fund Scheme
Pension Fund SchemeNA

Meezan Islamic Fund The net assets of Meezan Islamic Fund (MIF) as at September 30, 2021 stood at Rs. 32,264 million compared to Rs. 34,274 million at the end of June 30, 2021, a decrease of 6%. The net asset value (NAV) per unit as at September 30, 2021 was Rs. 61.6634 in comparison to Rs. 63.3761 per unit as on June 30, 2021 translating into negative return of 2.7% during the period compared to the benchmark negative return of KSE Meezan Index (KMI 30) of 5.6%. Al Meezan Mutual Fund
The net assets of Al Meezan Mutual Fund (AMMF) as at September 30, 2021 were Rs. 4,471 million compared to Rs. 4,918 million at the end of June 30, 2021, a decrease of 9%. The net asset value (NAV) per unit as at September 30, 2021 was Rs. 17.1627 compared to Rs. 17.6466 per unit on June 30, 2021 translating into negative return of 2.7% during the period compared to the benchmark negative return of KSE Meezan Index (KMI 30) of 5.6%.
KSE Meezan Index Fund The net assets of KSE Meezan Index Fund (KMIF) as at September 30, 2021 were Rs. 2,776 million compared to Rs. 2,697 million at June 30, 2021, an increase of 3%. The net asset value (NAV) per unit at September 30, 2021 was Rs. 69.0735 as compared to Rs. 72.8711 per unit on June 30, 2021 translating into a negative return of 5.2% during the period compared to the benchmark negative return of KSE Meezan Index (KMI 30) of 5.6%.
Meezan Dedicated Equity Fund The net assets of Meezan Dedicated Equity Fund (MDEF) as at September 30, 2021 were Rs. 885 million compared to Rs. 1,015 million at June 30, 2021, a decrease of 13%. The net asset value per unit (NAV) at September 30, 2021 was Rs. 44.7274 as compared to Rs. 46.9066 per unit on June 30, 2021 translating into a negative return of 4.6% during the period compared to the benchmark negative return of KSE Meezan Index (KMI 30) of 5.6%.
Meezan Energy Fund The net assets of Meezan Energy Fund (MEF) as at September 30, 2021 were Rs. 507 million compared to Rs. 584 million in June 2021, a decrease of 13%. The net asset value (NAV) per unit as at September 30, 2021 was Rs. 32.0211 as compared to Rs. 34.2992 per unit on June 30, 2021, translating into a negative return of 6.6% during the period compared to the benchmark negative return of KSE Meezan Index (KMI 30) of 5.6%. Meezan Pakistan Exchange Traded Fund The net assets of Meezan Pakistan Exchange Traded Fund (MPETF) as at September 30, 2021 were Rs. 81 million compared to Rs. 39 million in June 2021, an increase of 107%. The net asset value (NAV) per unit as at September 30, 2021 was Rs. 8.9358 per unit as compared to Rs. 10.3387 translating into a negative return of 13.6% during the period compared to the benchmark negative return of MZNPI of 13.2%. Meezan Asset Allocation Fund The net assets of Meezan Asset Allocation Fund (MAAF) as at September 30, 2021 were Rs. 1,505 million compared to Rs. 1,672 million at June 30, 2021, a decrease of 10%. The net asset value (NAV) per unit as at September 30, 2021 was Rs. 47.1081 as compared to Rs. 49.4600 per unit on June 30, 2021 translating into a negative return of 4.8% during the period compared to the benchmark negative return of 4.7%.

Meezan Islamic Income Fund The net assets of Meezan Islamic Income Fund (MIIF) as at September 30, 2021 were Rs. 30,219 million compared to Rs. 27,246 million at June 30, 2021, an increase of 11%. The net asset value (NAV) per unit as at September 30, 2021 was Rs. 52.5521 compared to Rs. 51.4736 per unit on June 30, 2021 translating into an annualized return of 8.3% compared to the benchmark annualized return of 3.1%. At period end, the fund was 15% invested in Islamic Corporate Sukuks, 1% in Commercial Papers, 39% in GoP Ijarah / Govt. Guaranteed Sukuks, 4% in Certificate of Musharaka and 39% of the net assets were placed with Islamic Banks or windows of Islamic banks. Meezan Sovereign Fund The net assets of Meezan Sovereign Fund (MSF) as at September 30, 2021 were Rs. 10,743 million compared to Rs. 9,939 million at June 30, 2021, an increase of 8%. The net asset value (NAV) per unit at September 30, 2021 was Rs. 52.8209 as compared to Rs. 51.5918 per unit on June 30, 2021 translating into an annualized return of 9.5% compared to the benchmark annualized return of 3.1%. At period end, the fund was 71% invested in GoP Ijarah/Govt. Guaranteed Sukuks, and 27% of the net assets were placed with Islamic Banks or windows of Islamic banks. Meezan Cash Fund The net assets of Meezan Cash Fund (MCF) at September 30, 2021 were Rs. 13,412 million compared to Rs. 13,557 million at June 30, 2021, a decline of 1%. The net asset value (NAV) per unit at September 30, 2021 was Rs. 51.5436 as compared to Rs. 50.5379 on June 30, 2021 translating into an annualized return of 7.9 % as compared to the benchmark annualized return of 3.3%. At period end 18% of the fund was placed in Term Deposit Receipts, 6% of the fund was placed in Commercial Papers and 76% of the net assets were placed with Islamic Banks or windows of Islamic banks.
Meezan Rozana Amdani Fund The net assets of Meezan Rozana Amdani Fund (MRAF) at September 30, 2021 were Rs. 47,835 million compared to Rs. 74,704 million at June 30, 2021, a decline of 36%. The net asset value (NAV) per unit at September 30, 2021 was Rs. 50.0000. During the period fund provides an annualized return of 7.8% as compared to the benchmark annualized return of 3.3%. At period end 12% of the fund was placed in Term Deposit Receipts, 4% in Commercial Papers, 1% in Islamic Corporate Sukuks, 23% in Bai-muajjal and 60% of the net assets were placed with Islamic Banks or windows of Islamic banks.
Meezan Daily Income Fund – MDIP – I Meezan Daily Income Fund – MDIP – I was launched on September 13, 2021. The net assets of the plan at September 30, 2021 were Rs. 2,282. The net asset value (NAV) per unit at September 30, 2021 was Rs. 50.0000. During the period plan provides an annualized return of 7.1% as compared to the benchmark annualized return of 3.1%. At period end 100% of the fund were placed with Islamic Banks or windows of Islamic banks.
Meezan Balanced Fund The net assets of Meezan Balanced Fund (MBF) as at September 30, 2021 were Rs. 4,620 million compared to Rs. 4,713 million at June 30, 2021, a decrease of 2%. The net asset value (NAV) per unit as at September 30, 2021 was Rs. 16.0123 as compared to Rs. 16.2002 per unit on June 30, 2021 translating into a negative return of 1.2% during the period compared to the benchmark negative return of 2.3%.

Meezan Financial Planning Fund of Funds
Aggressive Allocation Plan The net assets of the plan were Rs. 343 million as at September 30, 2021 compared to Rs. 348 million at June 30, 2021. The plan provided a return of 0.01% during the period compared to the benchmark negative return of 4.0%.
Moderate Allocation Plan The net assets of the plan were Rs. 166 million as at September 30, 2021 compared to Rs. 146 million at June 30, 2021. The plan provided a return of 1.2% during the period compared to the benchmark negative return of 2.4%.
Conservative Allocation Plan The net assets of the plan as at September 30, 2021 were Rs. 229 million compared to Rs. 224 million at June 30, 2021. The plan provided a return of 1.7% during the period compared to the benchmark negative return of 0.8%.
Meezan Asset Allocation Plan-I The net assets of the plan as at September 30, 2021 were Rs. 159 million compared to Rs. 156 million at June 30, 2021. The plan provided a return of 3.0% during the period compared to the benchmark negative return of 4.0%.
Meezan Strategic Allocation Fund
Meezan Strategic Allocation Plan-I The net assets of the plan as at September 30, 2021 were Rs. 617 million compared to 674 million at June 30, 2021. The plan provided a negative return of 0.6% during the period compared to the benchmark negative return of 4.0%.
Meezan Strategic Allocation Plan-II The net assets of the plan as at September 30, 2021 were Rs. 409 million compared to Rs. 452 million at June 30, 2021. The plan provided a negative return of 1.2% during the period compared to the benchmark negative return of 4.1%.
Meezan Strategic Allocation Plan-III The net assets of the plan as at September 30, 2021 were Rs. 409 million compared to Rs. 501 million at June 30, 2021. The plan provided a negative return of 1.6% during the period compared to the benchmark negative return of 4.0%.
Meezan Strategic Allocation Plan-IV The net assets of the plan as at September 30, 2021 were Rs. 173 million compared to Rs. 213 million at June 30, 2021. The plan provided a negative return of 0.7% during the period compared to the benchmark negative return of 4.0%.
Meezan Strategic Allocation Plan-V The net assets of the plan as at September 30, 2021 were Rs. 61 million compared to Rs. 63 million at June 30, 2021. The plan provided a negative return of 1.6% during the period compared to the benchmark negative return of 4.1%.
Meezan Capital Preservation Plan-III

The net assets of the plan as at September 30, 2021 were Rs. 257 million compared to Rs. 265 million at June 30, 2021. The plan provided a return of 1.3% during the period compared to the benchmark negative return of 0.4%.
Meezan Strategic Allocation Fund -II
Meezan Capital Preservation Plan-IV The net assets of the plan as at September 30, 2021 were Rs. 746 million compared to Rs. 767 million at June 30, 2021. The plan provided a negative return of 0.6% during the period compared to the benchmark negative return of 2.1%.
Meezan Capital Preservation Plan-V The net assets of the plan as at September 30, 2021 were Rs. 90 million compared to Rs. 94 million at June 30, 2021. The plan provided a return of 1.5% during the period compared to the benchmark negative return of 0.2%.
Meezan Capital Preservation Plan-VI The net assets of the plan as at September 30, 2021 were Rs. 88 million compared to Rs. 93 million at June 30, 2021. The plan provided a return of 2.3% during the period compared to the benchmark return of 0.8%.
Meezan Capital Preservation Plan-VII The net assets of the plan as at September 30, 2021 were Rs. 102 million compared to Rs. 104 million at June 30, 2021. The plan provided a return of 1.7% during the period compared to the benchmark return of 0.4%.
Meezan Capital Preservation Plan-VIII The plan was matured on August 27, 2021.
Meezan Strategic Allocation Fund -III
Meezan Capital Preservation Plan-IX The net assets of the plan as at September 30, 2021 were Rs. 95 million compared to Rs. 100 million at June 30, 2021. The plan provided a negative return of 0.8% during the period compared to the benchmark negative return was 2.1%.
Meezan Gold Fund (MGF) The net assets of the fund as at September 30, 2021 were 487 million compared to Rs. 488 million at June 30, 2021, a decline of 0.03%. The net asset value (NAV) per unit at September 30, 2021 was Rs. 83.6927 as compared to Rs. 83.6357 per unit on June 30, 2021 translating into a return of 0.1% during the period compared to the benchmark negative return of 0.2%.
Meezan Tahaffuz Pension Fund (MTPF) MTPF comprises of four sub-funds, namely Equity sub-fund, Debt sub-fund, Money Market sub-fund and Gold sub-fund. For the period ended September 30, 2021, the equity sub-fund provided a negative return of 2.6% and gold sub-fund provided a negative return of 0.3%, while the debt and money market sub-funds provided annualized returns of 8.4% and 7.3% respectively. Performance review for each sub fund is given as under:
Equity Sub Fund The net assets of this sub fund stood at Rs. 5,278 million at September 30, 2021 compared to Rs. 5,511 million at June 30, 2021, a decrease of 4%. The net asset value (NAV) per unit of the plan was Rs. 525.1235 at the end of September 30, 2021 as compare to Rs. 539.0946 as at June 30, 2021.

Debt Sub Fund The net assets of this sub fund stood at Rs. 4,466 million at September 30, 2021 compared to Rs. 4,334 million at June 30, 2021, an increase of 3%. The net asset value per (NAV) unit of the plan was Rs. 287.147 at the end of September 30, 2021 as compare to Rs. 281.2267 as at June 30, 2021.
Money Market Sub Fund The net assets of this sub fund stood at Rs. 3,440 million at September 30, 2021 compared to Rs. 3,379 million at June 30, 2021, an increase of 2%. The net asset value (NAV) per unit of the plan was Rs. 275.683 at the end of September 30, 2021 as compare to Rs. 270.7037 as at June 30, 2021.
Gold Sub Fund The net assets of this sub fund stood at Rs. 120 million at September 30, 2021 compared to Rs. 135 million at June 30, 2021, a decrease of 11%. The net asset value (NAV) per unit of the plan was Rs. 158.4779 at the end of September 30, 2021 as compare to Rs. 158.9588 as at June 30, 2021.
Outlook Key economic indicators along with impressive growth in FBR revenues shows that government is likely to achieve its GDP growth target. With expected hike in electricity & gas tariff and food price rise on account of the commodity boom cycle, we expect inflation to remain on higher end of SBP’s projection of 7-9% for FY22. Going ahead, rising import bill, global commodity prices are expected to maintain pressure on the current account deficit. Further, due to transition phase in Afghanistan, pressure on PKR can continue in short term.
On the Ijarah front, Government has budgeted to issue additional fixed and floating rate Ijarah Sukuk of approx. Rs 1.2 trillion in the local market, which will further enhance market participants’ ability to deploy funds at attractive yields. We also expect the corporate sector to continue raising funds through Sukuks and Islamic Commercial Papers.
For the equity market, we expect positive outlook to continue on the back of robust corporate earnings growth and attractive valuations. While there are some concerns emerging on the external side due to high trade deficit in recent months. Nonetheless, the external situation is much more comfortable compared to what we saw in FY18-19 as SBP’s forex reserves are near its all-time high level of around USD 19.3bn as of September, 2021 compared to just USD 7.3 billion in June 2019. The government is also engaged with IMF team for resumption of IMF program and working on a road map to improve tax collection and curb circular debt.
Acknowledgement We take this opportunity to thank our valued investors for reposing their faith in Al Meezan Investments, one of the largest asset management company in Pakistan. We also thank the regulator, the Securities and Exchange Commission of Pakistan and our Trustee, the Central Depository Company of Pakistan for their support. Likewise, we would like to thank the members of the Shariah Supervisory Board of Meezan Bank for their continued assistance and support on Shariah aspects of fund management.
For and on behalf of the Board
Muhammad Asad Acting CEO Date: October 11, 2021