Embed Size (px)
Citation preview

January 31, 2021
The current investment strategy is subject to change. HDFC Mutual Fund/AMC is not guaranteeing/offering any indicativeyields or returns on investments made in the Scheme. The product positioning is based on current view and is subject tochange. For complete portfolio details refer www.hdfcfund.com
To know more, contact your Mutual Fund Distributor /Registered Investment Adviser or give a missed call on 73974 12345.
Asset allocation is important for financial planning, more so in a dynamic world,where financial markets are subject to uncertainties. HDFC Multi-Asset Fund, whichinvests in 3 asset classes viz Equity, Debt and Gold related instruments, aims tomitigate volatility of returns arising from such uncertainties. Invest Now!
Invest in 3 asset classes through 1 scheme with anaim to mitigate the impactof market volatility
Presenting HDFC Multi-Asset Fund
*Investors should consult their financial advisers, if in doubt about whether the product is suitable for them.
• To generate long-term capital appreciation/income
• Investments in a diversified portfolio of equity and equity related instruments, debt & money market instruments and Gold related instruments
HDFC Multi-Asset Fund (An Open-ended Scheme Investing In Equity And Equity Related Instruments, Debt & Money Market Instruments And Gold related instruments) is suitable for investors who are seeking*:
INVESTORS UNDERSTAND THAT THEIR PRINCIPAL WILL BE AT VERY HIGH RISK
For latest riskometers, please refer www.hdfcfund.com

2 January 2021
Fund ManagerAn employee of the asset management company such as a mutual fund or life insurer, who manages investments of the scheme. He is usually part of a larger team of fund managers and research analysts.
Application Amount for Fresh SubscriptionThis is the minimum investment amount for a new investor in a mutual fund scheme.
Minimum Additional AmountThis is the minimum investment amount for an existing investor in a mutual fund scheme.
Yield to MaturityThe Yield to Maturity or the YTM is the rate of return anticipated on a bond if held until maturity. YTM is expressed as an annual rate. The YTM factors in the bond’s current market price, par value, coupon interest rate and time to maturity.
SIPSIP or systematic investment plan works on the principle of making periodic investments of a fixed sum. It works similar to a recurring bank deposit. For instance, an investor may opt for an SIP that invests Rs 500 every 15th of the month in an equity fund for a period of three years.
NAVThe NAV or the net asset value is the total asset value per unit of the mutual fund after deducting all related and permissible expenses. The NAV is calculated at the end of every business day. It is the value at which the investor enters or exits the mutual fund.
BenchmarkA group of securities, usually a market index, whose performance is used as a standard or benchmark to measure investment performance of mutual funds, among other investments. Some typical benchmarks include the NIFTY, SeNSex, BSe200, BSe500, 10-Year Gsec.
Entry LoadA mutual fund may have a sales charge or load at the time of entry and/or exit to compensate the distributor/agent. entry load is charged at the time an investor purchases the units of a mutual fund.
The entry load is added to the prevailing NAV at the time of investment. For instance, if the NAV is Rs. 100 and the entry load is 1 %, the investor will enter the fund at Rs. 101. (Note: SeBI, vide circular dated June 30, 2009 has abolished entry load and mandated that the upfront commission to distributors will be paid by the investor directly to the distributor, based on his assessment of various factors including the service rendered by the distributor).
Exit Loadexit load is charged at the time an investor redeems the units of a mutual fund. The exit load is reduced from the prevailing NAV at the time of redemption. The investor will receive redemption proceed at net value of NAV less Exit Load. For instance if the NAV is Rs. 100 and the exit load is 1%, the investor will receive Rs. 99.
Modified DurationModified duration is the price sensitivity and the percentage change in price for a unit change in yield.
Standard Deviation
Standard deviation is a statistical measure of the range of an investment’s performance. When a mutual fund has a high standard deviation, its means its range of performance is wide, implying greater volatility.
Sharpe Ratio
The Sharpe Ratio, named after its founder, the Nobel Laureate William Sharpe, is a measure of risk-adjusted returns. It is calculated using standard deviation and excess return to determine reward per unit of risk.
Beta Ratio (Portfolio Beta)
Beta is a measure of an investment’s volatility vis-a-vis the market. Beta of less than 1 means that the security will be less volatile than the market. A beta of greater than 1 implies that the security’s price will be more volatile than the market.
Average portfolio PE (Average P/E)
It is price to earnings ratio of the stocks calculated for the entire portfolio on a weighted average basis.
Average portfolio price to book ratio (Average P/BV)
It is price to book value of the stocks calculated for the entire portfolio on a weighted average basis.
Average portfolio dividend yield (Average Dividend Yield)
It is dividend yield of the stocks calculated for the entire portfolio on a weighted average basis.
Net Equity
Net equity level is the net equity exposure percentage adjusted for any derivative positions in stocks or index for hedging or rebalancing purpose.
R Squared
It is a statistical measure of how closely the portfolio returns are correlated with its benchmark.
AUM
AUM or assets under management refers to the recent / updated cumulative market value of investments managed by a mutual fund or any investment firm.
Holdings
The holdings or the portfolio is a mutual fund’s latest or updated reported statement of investments/securities. These are usually displayed in terms of percentage to net assets or the rupee value or both. The objective is to give investors an idea of where their money is being invested by the fund manager.
Nature of Scheme
The investment objective and underlying investments determine the nature of the mutual fund scheme. For instance, a mutual fund that aims at generating capital appreciation by investing in stock markets is an equity fund or growth fund. Likewise, a mutual fund that aims at capital preservation by investing in debt markets is a debt fund or income fund. each of these categories may have sub-categories.
Rating Profile
Mutual funds invest in securities after evaluating their creditworthiness as disclosed by the ratings. A depiction of the mutual fund in various investments based on their ratings becomes the rating profile of the fund. Typically, this is a feature of debt funds.
HOW TO READ FACTSHEET
Sharpe RatioSharpe Ratio is a risk to reward ratio, it measures portfolio returns generated in excess to the investment in risk-free asset, for per unit of total risk taken. While, positive Sharpe ratio indicates, portfolio compensating investors with excess returns (over risk-free rate) for the commensurate risk taken; negative Sharpe ratio indicates, investors are better off investing in risk-free assets.
BetaBeta (ß) of a portfolio is a number indicating the relation between portfolio returns with that of the market index i.e. it measure the volatility, or systematic risk, of a portfolio in comparison to the market as a whole.
Standard DeviationA statistical measure that defines expected volatility/risk associated with a portfolio. This explains the variation/deviation from the average returns delivered by the portfolio. A higher standard deviation means higher volatility (risk) and a lower standard deviation means lower volatility.
Risk Free ReturnThe theoretical rate of return of an investment with safest (zero risk) investment in a country.
4 Indexation Benefit
l Long Term Capital Gains (holding period of over 3 years) from Debt Mutual Funds are taxed at 20% plus applicable surcharge and cess with the benefit of indexation.
l Government notifies Cost Inflation Index (CII) for each financial year taking into consideration the prevailing inflation levels.
l The cost of acquistion for computation of tax is adjusted for inflation using CII, thereby reducing the capital gains from tax perspective.
l An investment made into a debt fund towards the end of a financial year (say, in March 2020) and held for a little over 3 years (say, in April 2023) would be eligible for application of CII over 5 financial years, resulting in 4 indexation benefit.
Total Expense RatioTotal expenses charged to scheme for the month expressed as a percentage to average monthly net assets.
Tracking ErrorTracking error indicates how closely the portfolio return is tracking the benchmark Index return. It measures the deviation between portfolio return and benchmark index return. A lower tracking error indicates portfolio closely tracking benchmark index and higher tracking error indicates portfolio returns with higher deviation from benchmark index returns.
Average MaturityWeighted average maturity of the securities in scheme.
Portfolio Yield (Yield To Maturity)Weighted average yield of the securities in scheme portfolio.
Portfolio Turnover RatioPortfolio Turnover Ratio is the percentage of a fund’s holdings that have changed in a given year. This ratio measures the fund’s trading activity, which is computed by taking the lesser of purchases or sales and dividing by average monthly net assets.
Modified DurationA formula that expresses the measurable change in the value of a security in response to a change in interest rates. Modified duration of portfolio can be used to anticipate the change in market value of portfolio for every change in portfolio yield.
Macaulay Duration (Duration)Macaulay Duration (Duration) measures the price volatility of fixed income securities. It is often used in the comparison of interest rate risk between securities with different coupons and different maturities. It is defined as the weighted average time to cash flows of a bond where the weights are nothing but the present value of the cash flows themselves. It is expressed in years/days. The duration of a fixed income security is always shorter than its term to maturity, except in the case of zero coupon securities where they are the same.
GLOSSARY

January 2021 3
Market Review
Market Review continued on next page
Source for various data points: Bloomberg, NSDL, CMIE, RBI, Kotak Institutional Research, Worldometers.info, World Bank, Daily valuation provided by ICRA/CRISIL.
Macroeconomic Update
Global economic recovery continues to strengthen supported by US and China. However, China saw rise in number of COVID-19 cases which prompted Chinese Government to implement measures like targeted lockdown, mass testing, tracing etc. In view of the approaching Chinese New Year holidays and recent rise in new infections, the recovery momentum is likely to slowdown, to a certain extent. Indian economy has also recovered over the past few months with most economic indicators growing at healthy pace.
Update on Spread of COVID-19: The infected cases continue to rise with global count of cases crossing 100 million by 31 January 2021 (31 December 2020: ~85 million). However, the pace of daily addition of new cases moderated in major countries like US, UK, France, Germany, etc. However, some countries have extended restrictions to curb the spread further. Further, the vaccination drive which started in advanced economies in late December 2020 or early January 2021 has started to pick up pace and many of them are likely to achieve herd immunity by end of CY21. In India, while the number of cases increased, the pace of addition slowed down significantly with average daily addition of new cases falling to ~15,000 per day in January 2021 from ~26,500 cases a month ago. Further, on back of good recovery rate, active cases have fallen from ~0.26 million as of 31 December 2020 to ~0.17 million as on 31 January 2021. Also, India’s fatality rate is less than 1.4% compared to global average of 2.2%.
Economic recovery momentum stable: The recovery in economic activity remained steady with majority of high frequency indicators expanding on YoY basis. GST collections (recorded highest monthly collection in January 2021), power demand, volume of goods movement by railway, e-way bills, etc. grew at a healthy rate. Manufacturing and services PMI have also remained in expansion zone in last 4 months. Further, key consumption indicators like retail e-transactions (UPI+ IMPS), unemployment rate, retail auto registrations (except 2W), etc. improved or remained stable.
YoY Growth (%) Apr-20 Jun-20 Sep-20 Oct-20 Nov-20 Dec-20 Jan-21Railway tonnage movement -35.2 -7.8 15.3 15.2 8.8 8.6 8.8Power demand -24.0 -10.5 4.6 12.1 3.5 5.0 4.8Average E-Way bill generated -83.6 -12.7 9.6 21.4 8.1 15.9 10.5Average Daily import duty collection -49.4 -30.1 -2.7 11.1 21.3 41.3 27.3
Manufacturing PMI* 27.4 47.2 56.8 58.9 56.3 56.4 57.7Services PMI* 5.4 33.7 49.8 54.1 53.7 52.3 52.8Gross GST Collection -71.6 -9.0 3.9 10.2 1.4 11.6 8.1Unemployment rate 23.5 10.2 6.7 7.0 6.5 9.1 6.5Average Daily Retail E-transactions^ -12.6 46.7 67.4 58.3 70.2 65.8 60.8
PV registration@ -90.2 -26.3 31.9 4.2 10.9 35.0 2.52W registration@ -75.9 -37.8 -11.0 -25.6 -20.8 13.5 -8.7Tractor registration@ -84.2 6.9 88.1 62.1 12.9 42.3 15.0
Source: Raildrishti.com, MOFSL, gstn.org.in, www.icegate.gov.in, CMIE, PIB, RBI, vaahan.parivahan.gov.in,
* Does not reflect yoy change; number >50 reflects expansions and number <50 reflects contraction compared to previous month; ^ sum of UPI+IMPS; @ January 2021 figures are preliminary data and are subject to revision.
The good recovery seen over the past few months indicates that economy is normalising at a fast pace. However, contact intensive services sector, especially activities in aviation, entertainment, hospitality etc. continue to be relatively more impacted. and are likely to pick up in due course. We expect recovery to continue strengthening supported by normalisation in economic activity.
Union budget 2020-21: Government presented a pro-growth pro-reform budget with a push on infrastructure spending and focus on supply side reforms to stimulate investments and boost sustainable growth. The Government is prioritising growth over fiscal consolidation by focussing on higher capital spending and allowing the widening of fiscal deficit (refer next section for more on fiscal deficit).
Key proposals announced in the budget are
l Setting up of asset reconstruction company for NPAs of public sector banks
l Setting up a Development Financial Institution with initial capital of INR 200 billion to fund infrastructure projects
l Setting up a pipeline for monetization of infrastructure assets and PSU asset monetisation
l Allowed tax efficient zero coupon bonds for Infrastructure Development Funds (IDFs)
l Government to retain ownership in PSUs, operate in 4 identified strategic sectors and will privatise all other PSUs.
l Liberalised FDI norms for Insurance companies upto 74% from current limit of 49%
l Push for make in India by raising custom duties on select items
l Setting up of 7 mega textile parks over next 3 years.
l Hike in capital spending to 2.5% of GDP in FY22 from 1.7% between FY16-20
For our detailed comment on budget, please refer our note titled “Union Budget 2021-22: India means Business” available on our website www.hdfcfund.com
Withgrowthinmind,Governmentdefersfiscalconsolidation:In a clear break from earlier path of fiscal consolidation, Government announced widening of FY21 and FY22 fiscal deficit to 9.5% and 6.8% of GDP respectively. It also relaxed the glide path of fiscal consolidation and now targets deficit to come down to less than 4.5% of GDP by FY26 (as against earlier target of ~3% by FY23). It also allowed states’ fiscal deficit to widen till 4% of GSDP for FY22 and additional 0.5% subject to meeting certain conditions. This should provide Government elbow room to use fiscal as tool for taking counter cyclical measures and revive growth.
Central Government fiscal deficit
Source: CMIE, Kotak Institutional Equities
INR billion FY20A 2021RE 2022BE FY21RE /FY20A
FY22BE / FY21RE
Gross tax collection 20,101 19,003 22,171 -5.5% 16.7%Total Direct Tax 10,554 9,108 11,151 -13.7% 22.4%Total Indirect Tax 9,547 9,895 11,020 3.6% 11.4%
Less: State shares & Others 6,532 5,548 6,717 -15.1% 21.1%Net Tax collection 13,569 13,455 15,454 -0.8% 14.9%Non- Tax Revenue 3,272 2,107 2,430 -35.6% 15.4%Total Revenue Receipts 16,841 15,562 17,884 -7.6% 14.9%Total Capital Receipts 686 465 1,880 -32.2% 304.3%Total Receipts 17,527 16,027 19,764 -8.6% 23.3% Total Revenue Expenditures 23,506 30,111 29,290 28.1% -2.7%Total Capital Expenditures 3,357 4,392 5,542 30.8% 26.2%Total expenditure 26,863 34,503 34,832 28.4% 1.0% Gross Fiscal Deficit 9,337 18,477 15,068 97.9% -18.4%FiscalDeficitas%ofGDP 4.6% 9.5% 6.8%

4 January 2021
Three primary reasons of deficit widening are:
l Off budget subsidy payments and dues in food and fertilizer heads have been brought into budget, signaling transparency and timely clearance of dues. This alone constitutes ~2% of GDP.
l Estimated capital spends in FY21 and FY22 is likely to be ~2.3% and 2.5% of GDP respectively as against average 1.7% in past 5 years. RBI study suggests that growth multiplier of capital expenditure is higher than revenue expenditure. Thus, Government is spending where it matters and it should bear fruit over medium to long term, in our opinion.
l Revenue projections, especially tax projections, have been made conservatively despite a good real and nominal growth recovery expected in FY22.
We believe given the need to revive growth, increase in fiscal stimulus is a welcome move. Also given the focus on capital spending it can trigger a virtuous cycle of growth, jobs, tax collections and can ultimately result in lowering fiscal deficit. For understanding the impact of higher borrowings on fixed income, please refer the section of Debt Market update.
InflationmoderatessignificantlyinDecember2020,likelytoremainrangeboundgoing forward: CPI moderated sharply to 4.6% in December 2020 driven by high base effect and also due to sequential moderation of food items especially vegetables and cereals. Core CPI remained at elevated level on back of YoY growth in precious metals (gold, silver etc.), airfares, porter charges, etc. Apart from supply side disruption, cost push pressure, demand recovery, margin expansion, etc. are keeping core inflation at elevated levels. Rise in diesel and petrol prices also put upward pressure on CPI.
The outlook for inflation remains uncertain as there are opposite forces at work. Food inflation is likely to remain range bound as the benefit of lower vegetable prices and favourable base effect is likely to be partially offset by price pressure in in edible oil, pulses etc. Further, recent rise in international crude prices can keep fuel inflation high. Also, the core inflation is unlikely to moderate significantly as the good demand recovery is likely to result in pass through in consumer prices. Thus, in our view, the CPI is likely to remain rangebound.
YoY,% Nov-20 Dec-20 Change in %CPI 6.93 4.59 -2.34Food & beverages 8.89 3.87 -5.02Fuel and Light 1.62 2.99 1.38Housing 3.19 3.21 0.01Core CPI@ 5.71 5.55 -0.16
Source: CMIE; @-CPI excluding food, fuel, transportation & housing
TradeDeficitcontinuestowiden,likelytoremainaroundsimilarrangeinnearterm:Trade deficit in January 2021 moderated slightly compared to last month driven by lower net gold imports*. The net oil imports inched up slightly driven by rise in oil prices. Non-Oil Non-Gold (NONG) Imports increased driven by rise in imports of electronics, chemical and related products, base metals, etc. This was largely offset by rise in exports of engineering goods, agriculture products, electronics, etc.
Amount in USD billion Dec-20 Jan-21# Change (%)Trade Deficit / (Surplus) 15.4 14.8 -3.9Net Oil imports 7.2 7.4 2.8Net Gold imports* 4.3 3.4 -20.9Trade deficit ex oil & gold 3.9 4.0 2.6
Source: CMIE, PIB; # Based on preliminary data * includes net imports of gold, silver and precious stones adjusted for gems and jewellery exports.
Given the normalisation in economy and improvement in aggregate demand, trade deficit might remain at elevated level going forward. However, on full year basis (FY21), the trade deficit is likely to be significantly lower than FY20 and consequently current account is likely to be in surplus as the net services exports remains resilient. We expect that current account is likely to turn into deficit, going forward, driven by improvement in aggregate demand and rise in oil prices. However, given the good foreign exchange reserves (USD 590 billion as on 29 January 2021) and robust capital flows, outlook on Balance of Payment (BoP) is comfortable. INR gained 0.2% and ended the month at 72.95 against USD.
Commoditypricestakesabreather:The price movement in major commodities was mixed driven by optimism of good demand, possible large fiscal stimulus by US, slower than expected roll out of vaccine etc. Gold prices declined during the month on back of improved risk sentiments.
Apart from weakness in demand, oil prices witnessed one of the sharpest falls due to breakdown of OPEC plus alliance during early part of pandemic. However, alliance eventually agreed for the production cuts which led to recovery in prices. This was further supported by easing of restrictions and improvement in demand. Outlook on oil demand remains uncertain due to reduced mobility as work from home and reduced travel needs might persist, to a certain extent, in the medium term.
% Change Marketprice
(USD)*Jan-21
(m-o-m) FYTD21^
Brent Crude (per barrel) 56 7.9 145.7Gold (per ounce) 1,848 (2.7) 17.1Steel (per tonne) 4,524 (1.1) 33.1Zinc (per tonne) 2,565 (5.8) 37.3Copper (per tonne) 7,877 1.8 64.2Aluminium (per tonne) 1,982 0.4 32.8Lead (per tonne) 2,013 2.1 17.6
Source: Bloomberg; *Market prices as on January 31, 2021; ^ change in prices since end-March 2020, m-o-m- Month on Month
Summary and Conclusion
Economic activity continues to normalise at a fast pace and growth is getting entrenched in our view. We expect the growth momentum to continue supported by global economic recovery, fast pace rollout of vaccination, easing of restrictions and fiscal and monetary measures. Further, the pro-growth budget announced should also support the recovery. In addition to the above, while current account is likely to deteriorate sequentially, outlook of BoP is comfortable supported by good capital flows and large forex reserves.
Apart from the above, the likely increase in share of global manufacturing of India due to conducive environment and proactive steps taken by Indian Government is also supportive of economic growth.
Market Review Contd...
Market Review continued on next page
Source for various data points: Bloomberg, NSDL, CMIE, RBI, Kotak Institutional Research, Worldometers.info, World Bank, Daily valuation provided by ICRA/CRISIL.
January 2021 5
Equity Market Update
After rising over the past few months, equity markets took a breather and NIFTY 50 ended the month ~3% lower compared to last month. The market was influenced by uncertainty around budget, new strain of virus, fresh lockdowns in advanced economies, optimism around additional fiscal stimulus by US, continued demand of domestic economic activity etc. The midcaps and smallcaps outperformed largecaps during the month. Amongst sectoral indices, Auto, Capital goods and IT ended the month in positive while healthcare, metal and banks closed in negative.
Globally, the performance was mixed with key US and European market indices ending the month in negative while Asian indices delivered positive returns. The tables below give the details of performance of key domestic and global indices.
% Change in Indices Jan-21 FYTD21
S&P BSE India Auto 6.3 105.9
S&P BSE India Bankex (3.4) 57.2
S&P BSE India Capital Goods 3.9 77.4
S&P BSE India FMCG (3.1) 19.1
S&P BSE India Healthcare (4.9) 69.8
S&P BSE India Metal (4.9) 93.1
S&P BSE India Power (2.8) 45.5
S&P BSE India Oil & Gas (2.0) 37.8
S&P BSE India IT 2.4 93.3
S&PBSESENSEX (3.1) 57.1
NIFTY 50 (2.5) 58.6
NIFTY Midcap 100 0.3 78.7
NIFTY Smallcap 1.3 99.7
% Change Jan-21 FYTD21
S&P 500 (1.1) 43.7
FTSE (0.8) 13.0
DAX (2.1) 35.2
CAC (2.7) 22.8
Nikkei 0.8 46.2
Hang Seng 3.9 19.8
KOSPI 3.6 69.6
Shanghai 0.3 26.6
MSCI Emerging Market Index 3.0 56.7
^ change since end-March 2020
During the month, FPIs bought equity worth USD 2.7 billion, as compared to net inflows of USD 9.3 billion in the previous month. Cumulative FPI inflows into equity increased to USD 29 billion in 10MFY21 as against net inflows of USD 10.8 billion in similar period last year.
Domestic equity oriented mutual funds recorded net outflows of INR 14,901 crore in January 2021 compared to net outflow of INR 18,486 crore a month ago. In first ten months of FY21, net outflows from domestic equity oriented mutual fund schemes was INR 69,217 crore as against net inflows of INR 42,927 crore during the same period last year.
Out of the results declared for Q3FY21, results for Banks, NBFCs, consumer staples, metals and consumer durables were better than expected. Results of Oil and gas, Pharma, Telecom, Auto, Infrastructure and Industrials were largely in line with expectations.
Outlook
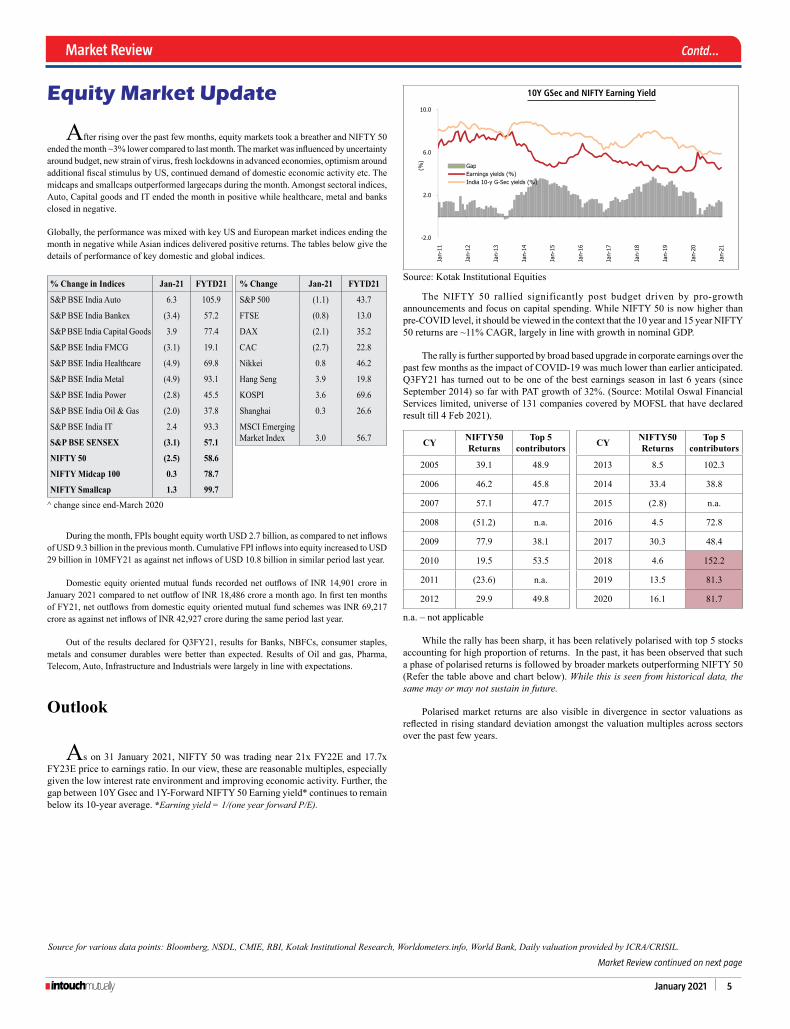
As on 31 January 2021, NIFTY 50 was trading near 21x FY22E and 17.7x FY23E price to earnings ratio. In our view, these are reasonable multiples, especially given the low interest rate environment and improving economic activity. Further, the gap between 10Y Gsec and 1Y-Forward NIFTY 50 Earning yield* continues to remain below its 10-year average. *Earning yield = 1/(one year forward P/E).
10Y GSec and NIFTY Earning Yield
Source: Kotak Institutional Equities
The NIFTY 50 rallied significantly post budget driven by pro-growth announcements and focus on capital spending. While NIFTY 50 is now higher than pre-COVID level, it should be viewed in the context that the 10 year and 15 year NIFTY 50 returns are ~11% CAGR, largely in line with growth in nominal GDP.
The rally is further supported by broad based upgrade in corporate earnings over the past few months as the impact of COVID-19 was much lower than earlier anticipated. Q3FY21 has turned out to be one of the best earnings season in last 6 years (since September 2014) so far with PAT growth of 32%. (Source: Motilal Oswal Financial Services limited, universe of 131 companies covered by MOFSL that have declared result till 4 Feb 2021).
CY NIFTY50 Returns
Top 5 contributors CY NIFTY50
ReturnsTop 5
contributors
2005 39.1 48.9 2013 8.5 102.3
2006 46.2 45.8 2014 33.4 38.8
2007 57.1 47.7 2015 (2.8) n.a.
2008 (51.2) n.a. 2016 4.5 72.8
2009 77.9 38.1 2017 30.3 48.4
2010 19.5 53.5 2018 4.6 152.2
2011 (23.6) n.a. 2019 13.5 81.3
2012 29.9 49.8 2020 16.1 81.7
n.a. – not applicable
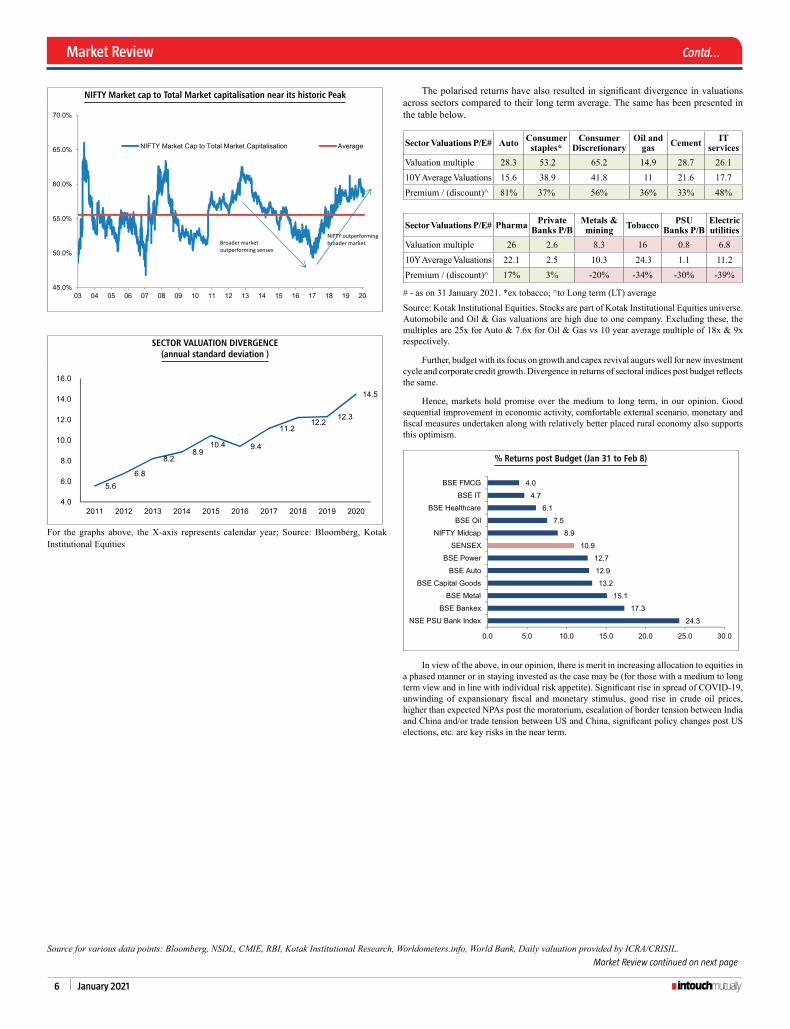
While the rally has been sharp, it has been relatively polarised with top 5 stocks accounting for high proportion of returns. In the past, it has been observed that such a phase of polarised returns is followed by broader markets outperforming NIFTY 50 (Refer the table above and chart below). While this is seen from historical data, the same may or may not sustain in future.
Polarised market returns are also visible in divergence in sector valuations as reflected in rising standard deviation amongst the valuation multiples across sectors over the past few years.
Market Review Contd...
Market Review continued on next page
Source for various data points: Bloomberg, NSDL, CMIE, RBI, Kotak Institutional Research, Worldometers.info, World Bank, Daily valuation provided by ICRA/CRISIL.
6 January 2021
NIFTY Market cap to Total Market capitalisation near its historic Peak
SECTor ValuaTIoN DIVErGENCE(annual standard deviation )
For the graphs above, the X-axis represents calendar year; Source: Bloomberg, Kotak Institutional Equities
The polarised returns have also resulted in significant divergence in valuations across sectors compared to their long term average. The same has been presented in the table below.
SectorValuationsP/E# Auto Consumer staples*
Consumer Discretionary
Oil and gas Cement IT
servicesValuation multiple 28.3 53.2 65.2 14.9 28.7 26.110Y Average Valuations 15.6 38.9 41.8 11 21.6 17.7Premium / (discount)^ 81% 37% 56% 36% 33% 48%
SectorValuationsP/E# Pharma PrivateBanksP/B
Metals & mining Tobacco PSU
BanksP/BElectric utilities
Valuation multiple 26 2.6 8.3 16 0.8 6.810Y Average Valuations 22.1 2.5 10.3 24.3 1.1 11.2Premium / (discount)^ 17% 3% -20% -34% -30% -39%
# - as on 31 January 2021. *ex tobacco; ^to Long term (LT) averageSource: Kotak Institutional Equities. Stocks are part of Kotak Institutional Equities universe. Automobile and Oil & Gas valuations are high due to one company. Excluding these, the multiples are 25x for Auto & 7.6x for Oil & Gas vs 10 year average multiple of 18x & 9x respectively.
Further, budget with its focus on growth and capex revival augurs well for new investment cycle and corporate credit growth. Divergence in returns of sectoral indices post budget reflects the same.
Hence, markets hold promise over the medium to long term, in our opinion. Good sequential improvement in economic activity, comfortable external scenario, monetary and fiscal measures undertaken along with relatively better placed rural economy also supports this optimism.
% returns post Budget (Jan 31 to Feb 8)
In view of the above, in our opinion, there is merit in increasing allocation to equities in a phased manner or in staying invested as the case may be (for those with a medium to long term view and in line with individual risk appetite). Significant rise in spread of COVID-19, unwinding of expansionary fiscal and monetary stimulus, good rise in crude oil prices, higher than expected NPAs post the moratorium, escalation of border tension between India and China and/or trade tension between US and China, significant policy changes post US elections, etc. are key risks in the near term.
Market Review Contd...
Source for various data points: Bloomberg, NSDL, CMIE, RBI, Kotak Institutional Research, Worldometers.info, World Bank, Daily valuation provided by ICRA/CRISIL.Market Review continued on next page

January 2021 7
Market Review Contd...
Source for various data points: Bloomberg, NSDL, CMIE, RBI, Kotak Institutional Research, Worldometers.info, World Bank, Daily valuation provided by ICRA/CRISIL.
Debt Market Update
The yield of 10-year benchmark Gsec ended the month at 5.91%, up 4 bps over the previous month end. The Gsec yields traded largely within a narrow range during the month supported by high liquidity, Operation TWIST, etc. The spread between 10 Year AAA rated corporate bond and 10Y Gsec was largely stable during the month.
Dec-20 Jan-21 Change (%)
10Yr G-Sec Yield (%, 5.85 GoI 2030)^ 5.87 5.91 0.04AAA 10Year Corporate Bond Yields (%)# 6.54 6.58 0.04AAA 10Y corporate bond spread against 10Y benchmark (bps)@ 67 67 -
Average net liquidity absorbed / (infused) by RBI* (INR billion) (approx.) 5,565 5,623 1.0
MIBOR Overnight Rate (%) 3.51 3.47 -0.04*Average net daily liquidity infused / absorbed through Liquidity Adjustment Facility, exports refinance, marginal standing facility and term repos/reverse repos; ̂ bi-annual yield; # annualised yields; @ Spreads have been calculated by subtracting non-annualised Gsec yields from annualised corporate bond yields.
Average net interbank liquidity surplus was largely similar to last month supported by higher Government spending, OMO purchases, foreign exchange purchases by RBI and soft credit growth vis-a-vis deposit growth.
The FPI flows in Indian debt markets have been relatively muted in the current financial year. In January 2021, FPI flows in debt (including Voluntary Retention Route) turned marginally negative and recorded a net outflow of USD 0.7 billion compared to net inflow of USD 0.3 billion a month ago. On a cumulative basis, in 10MFY21, net FPI outflows from debt markets was USD 2.9 billion compared to net inflows of USD 1.5 billion during the same period last year.
In its Union Budget 2021-22, against market expectations, Government announced additional borrowing of INR 800 billion for FY21 and projected a high budgeted fiscal deficit of 6.8% for FY22. Further, Government relaxed fiscal consolidation timeline and fiscal deficit is expected to be below 4.5% by FY26 (Earlier estimate: ~3% by FY23). These resulted in Gsec yields rising sharply across the board since budget.
In its meeting concluded on 5 February 2021, MPC unanimously voted in favour of keeping the policy Repo Rate and Reverse Repo rate unchanged at 4.0% and 3.35%. It also voted in favour of maintaining an accommodative stance as long as it is necessary - at least during the current financial year and into the next financial year - to revive growth on a durable basis and mitigate the impact of COVID-19 on the economy, while ensuring that inflation remains within the target going forward. However, as against earlier plan of restoring the CRR to 4% (from 3%) of NDTL by 27 March 2021, RBI announced that it will happen in a staggered manner. Now, banks are required to maintain CRR of 3.5% by 27 March 2021 and 4% by 22 May 2021.
Earlier, RBI had increased the limits under the HTM category for banks to 22% of NDTL from 19.5% for the SLR securities acquired between 1 September 2020 to 31 March 2021. This dispensation was allowed till 31 March 2022. Keeping in mind the increased Government borrowing program, RBI extended this dispensation to SLR securities acquired in FY22 too and also announced that restoration of HTM limits will happen in a gradual manner starting 30 June 2023.
Outlook
RBI’s decision of leaving the policy repo rate and accommodative stance unchanged was largely in line with market consensus. However, given the large borrowing program announced by Government in Union Budget 2021-22, the expectations that RBI will announce some measures to ease the borrowing pressure were high. In absence of any such steps, market was disappointed and yields rose significantly.
Since the last couple of months, multiple factors have impacted the debt markets adversely. These include - International crude prices have inched up significantly, 10Y US treasury yields have gone up, higher than anticipated Government borrowing, relaxation of fiscal consolidation timeline, domestic fuel prices being all-time highs, etc. All these factors have resulted in Gsec yields rising significantly, especially in last couple of weeks. We expect that these factors will continue to impact Gsec yields, atleast in the near term and thus, yields are likely to trade with an upward bias. Further, high SLR holding of banks and signs of broad based improvement in economic activity can also push yields higher.
However, as has been the case over the past year or so, we believe RBI will continue to use conventional and unconventional tools going forward as well, thus, limiting the increase in Gsec yields. Further, RBI Governor mentioned in his speech on 5 February 2021 that RBI will maintain ample system liquidity and “normalisation of CRR opens up space for a variety of market operations to inject additional liquidity”. Also, statement by RBI Governor that it will manage the Government borrowing program in a non-disruptive manner provides some comfort. These factors should have some moderating impact on yields. Again, comfortable outlook on Balance of Payment, low global rates and ample global liquidity also bode well for yields in India.
In view of the above, we expect yields to trade with upward bias though the upside should be limited, to a certain extent. The risk to this view is that the fiscal deficit turns out to be lower than anticipated either due to lower expenditure or better than expected tax collections along with lower inflation from Q2FY22 onwards. Considering the above, we continue to recommend investment in short to medium duration debt funds, albeit in a staggered manner over a period of time, depending on investors’ risk appetite.
While credit environment still warrants caution, measures by RBI have eased the spreads on AAA rated bonds significantly. However, opportunities exist in select pockets of non-AAA rated bonds as their spreads relative to AAA rated bonds are trading at attractive level. Hence, allocation to credit oriented schemes or funds with some non-AAA exposure can be maintained / increased in a phased manner, in line with individual risk appetite.
Spread of aa over aaa Corporate bonds
Long Term Average spread of AA over AAA over 10 years
GlOSSARYCPI Consumer Price IndexCRR Cash Reserve RatioFDI Foreign Direct InvestmentFPI Foreign Portfolio Investment
GDP Gross Domestic ProductGSDP Gross State Domestic ProductHTM Held To MaturityIMPS Immediate Payment System
M-o-M Month on MonthMPC Monetary Policy CommitteeNBFC Non-Banking Financial CompanyNDTL Net Demand and Time LiabilitiesNPA Non-Performing AssetsOMO Open Market OperationPAT Profit After TaxPMI Purchasing Managers’ IndexPSU Public Sector UndertakingSLR Statutory Liquidity RatioUPI United Payment Interface

8 January 2021
CONTENTS
PAGE NO.
WEAlTH CREATION
HDFC Flexi Cap Fund (Erstwhile HDFC Equity Fund) .............................. 9
HDFC Capital Builder Value Fund ........................................................ 10
HDFC Top 100 Fund ........................................................................... 11
HDFC Mid-Cap Opportunities Fund ..................................................... 12
HDFC Small Cap Fund ........................................................................ 13
HDFC Growth Opportunities Fund ...................................................... 14
HDFC Focused 30 Fund ...................................................................... 15
HDFC Infrastructure Fund .................................................................. 16
HDFC Balanced Advantage Fund ........................................................ 17-18
HDFC Hybrid Equity Fund ................................................................... 19-20
HDFC Multi-Asset Fund ...................................................................... 21-22
HDFC NIFTY 50 ETF ............................................................................ 23
HDFC Index Fund - NIFTY 50 Plan ....................................................... 24
HDFC SENSEx ETF .............................................................................. 25
HDFC Index Fund - SeNSex Plan ......................................................... 26
HDFC Gold ETF .................................................................................. 62
HDFC Gold Fund ................................................................................ 63
HDFC Banking ETF ............................................................................. 64
HDFC Dividend Yield Fund ................................................................. 65
HDFC Housing Opportunities Fund ..................................................... 66
TAx SAVINGS
HDFC Taxsaver .................................................................................. 27
RETIREMENT PLANNING
HDFC Retirement Savings Fund - Equity Plan ....................................... 30
HDFC Retirement Savings Fund - Hybrid Equity Plan ............................ 31-32
HDFC Retirement Savings Fund - Hybrid Debt Plan .............................. 33
PAGE NO.
CHIlDREN'S FUTURE
HDFC Children’s Gift Fund ................................................................. 28-29
REgUlAR INCOME
HDFC Equity Savings Fund ................................................................. 34-35
HDFC Hybrid Debt Fund ..................................................................... 36-37
HDFC Arbitrage Fund ......................................................................... 38-39
HDFC Corporate Bond Fund ............................................................... 40-41
HDFC Credit Risk Debt Fund ............................................................... 42-43
HDFC Banking and PSU Debt Fund ..................................................... 44-45
HDFC Gilt Fund.................................................................................. 46
HDFC Dynamic Debt Fund .................................................................. 47
HDFC Income Fund ........................................................................... 48
HDFC Medium Term Debt Fund .......................................................... 49-50
HDFC Short Term Debt Fund .............................................................. 51-52
HDFC Low Duration Fund ................................................................... 53-54
HDFC Money Market Fund ................................................................. 55
HDFC Floating Rate Debt Fund ........................................................... 56
HDFC Ultra Short Term Fund .............................................................. 57-58
HDFC Liquid Fund .............................................................................. 59-60
HDFC Overnight Fund ........................................................................ 61
Performance details of schemes managed by respective fund managers ............................................. 67
Scheme performance summary - Regular Plans ................................. 68-72
Scheme performance summary - Direct Plans .................................... 73-80
Performance of Permitted Category FPI Portfolio ............................... 81
Dividend History ............................................................................... 82-83
Disclaimer ....................................................................................... 84
gOAl BASED SOlUTIONS
WEAlTH CREATION These schemes aim to increase wealth over the long term by investing predominantly in equity instruments and are suitable for investors with high risk appetite and relatively higher investment horizon.
TAx SAVINGS This scheme is eligible to provide tax deduction under Section 80C and also aims to increase wealth over the long term. This is an ideal solution for investors who would like to create wealth and save tax.
CHIlDREN'S FUTURE This scheme aims to help you achieve your specific financial goal of planning for child’s future expenses like higher education, etc.
RETIREMENT PLANNING These schemes aim to help you achieve your specific financial goal of retirement planning.
REgUlAR INCOME These schemes aim to provide stable income and are ideal for investors with low to medium risk appetite who wish to receive regular income to meet their periodic expenses.
Disclaimer: Investors are requested to note that the above goal based solutions should not be construed as financial planning solution/recommendation by the Fund/AMC. It does not in any manner, indicate or imply either the quality of any particular Scheme or guarantee any specific performance/returns. Such solutions must be tailored to investor’s individual situation and objectives and therefore, investors should consult their financial advisors to ascertain whether a product is suitable for them.

January 2021 9
SIP PERFORMANCE ^ - Regular Plan - growth OptionSince Inception
SIP15 year
SIP10 year
SIP5 year
SIP3 year
SIP1 year
SIPTotal Amount Invested (` ‘000) 3,130.00 1,800.00 1,200.00 600.00 360.00 120.00 Mkt Value As on January 29, 2021 (` ‘000) 78,525.67 4,810.93 2,140.46 761.37 422.52 152.53 Returns (%) 20.15 12.12 11.14 9.47 10.70 54.26 Benchmark Returns (%) # 14.40 11.64 12.58 12.59 14.83 53.73 Additional Benchmark Returns (%) ## 13.43 11.51 12.33 13.49 15.30 51.56
Assuming ` 10,000 invested systematically on the first Business Day of every month over a period of time. CAGR returns are computed after accounting for the cash flow by using xIRR method (investment internal rate of return) for Regular Plan - Growth Option. The above investment simulation is for illustrative purposes only and should not be construed as a promise on minimum returns and safeguard of capital.
Face Value per Unit: ` 10 unless otherwise specified, + Industry Classification as recommended by AMFI, Data is as of January 31, 2021 unless otherwise specified.
PERFORMANCE ^ - Regular Plan - growth OptionDate Period Scheme
Returns (%)
Benchmark Returns
(%)#
Additional Benchmark
Returns (%) ##
Value of ` 10,000 investedScheme (`) Benchmark
(`)#Additional
Benchmark (`)##
Jan 31, 20 Last 1 Year 8.99 15.82 15.22 10,896 11,578 11,518Jan 31, 18 Last 3 Years 2.26 6.49 8.70 10,693 12,073 12,841Jan 29, 16 Last 5 Years 12.09 13.61 13.94 17,706 18,938 19,214Jan 01, 95 Since Inception 17.80 11.51 11.07 718,924 171,473 154,688
Returns greater than 1 year period are compounded annualized (CAGR). Performance of dividend option under the schemes for the investors would be net of distribution tax, if any. N.A. Not Available. For performance of other schemes managed by Prashant Jain, please refer page 67. Different plans viz. Regular Plan and Direct Plan have a different expense structure. The expenses of the Direct Plan under the Scheme will be lower to the extent of the distribution expenses / commission charged in the Regular Plan. As NIFTY 50 TRI data is not available since inception of the scheme, additional benchmark performance is calculated using composite CAGR of NIFTY 50 PRI values from January 1, 1995 to June 29, 1999 and TRI values since June 30, 1999. For Performance of Direct Plan, refer page no. 73. For FPI Portfolio, refer page no. 81.
This product is suitable for investors who are seeking ~
l to generate long-term capital appreciation / income
l investment predominantly in equity & equity related instruments
VeryHigh
Low to
Moderate
Low
Moderate ModeratelyHigh High
RISKOMETERInvestors understand that their principal will be at
very high risk
~ Investors should consult their financial advisers, if in doubt about whether the product is suitable for them.
^Past performance may or may not be sustained in the future. Load is not taken into consideration for computation of performance.
(An open ended dynamic equity scheme investingacross large cap, mid cap, small cap stocks)
Company Industry+ % to NAV
EqUITY & EqUITY RElATED
• State Bank of India Banks 9.99
• ICICI Bank Ltd. Banks 9.13
• Larsen and Toubro Ltd. Construction Project 6.40
• Infosys Ltd. Software 6.07
• ITC Ltd. Consumer Non Durables 5.20
• Coal India Ltd. Minerals/Mining 4.39
• Axis Bank Ltd. Banks 4.16
• NTPC Ltd. Power 4.14
• Power Finance Corporation Ltd. Finance 3.26
• REC Ltd. Finance 3.20
Lupin Ltd. Pharmaceuticals 3.19
Bharti Airtel Ltd. Telecom - Services 2.92
Power Grid Corporation of India Ltd. Power 2.53
Sun Pharmaceutical Industries Ltd. Pharmaceuticals 2.21
GAIL (India) Ltd. Gas 2.10
Bharat Petroleum Corporation Ltd. Petroleum Products 2.09
Reliance Industries Ltd. Petroleum Products 1.98
Tata Motors Ltd. Auto 1.95
Aurobindo Pharma Ltd. Pharmaceuticals 1.80
Cipla Ltd. Pharmaceuticals 1.76
CeSC Ltd. Power 1.52
Bank of Baroda Banks 1.49
HDFC Bank Ltd. Banks 1.49
Ambuja Cements Ltd. Cement 1.32
Indian Railways Finance Corporation Ltd. Finance 1.21
Hindustan Aeronautics Ltd. Aerospace & Defence 1.12
Bharat Dynamics Ltd. Aerospace & Defence 1.05
SBI Cards and Payment Services Ltd. Finance 1.02
Mahindra & Mahindra Ltd. Auto 1.01
Kalpataru Power Transmission Ltd. Power 0.98
Hindustan Petroleum Corporation Ltd. Petroleum Products 0.96
Praj Industries Ltd. Industrial Capital Goods 0.80
BeML Ltd. Industrial Capital Goods 0.79
HCL Technologies Ltd. Software 0.76
Vedanta Ltd. Non - Ferrous Metals 0.75
CG Power and Industrial Solutions Ltd. Industrial Capital Goods 0.69
Company Industry+ % to NAV
Wipro Ltd. Software 0.68
ABB India Ltd. Industrial Capital Goods 0.57
Ramco Systems Ltd. Software 0.49
SKF India Ltd. Industrial Products 0.36
Time Technoplast Ltd. Industrial Products 0.24
Hindustan Construction Company Ltd. Construction Project 0.14
L&T Technology Services Ltd. Software 0.11
Simplex Infrastructures Ltd. Construction 0.08
InterGlobe Aviation Ltd. Transportation 0.07Sub Total 98.17Preference SharesZee entertainment enterprises Ltd. Media & entertainment 0.01Sub Total 0.01Total 98.18Cash, Cash equivalents and Net Current Assets 1.82
Grand Total 100.00
• Top Ten Holdings
PORTFOLIO
Industry Allocation of Equity Holding (% of Net Assets)
0.010.070.080.600.751.322.102.172.852.922.96
4.395.035.206.54
8.118.698.969.17
26.26
0 5 10 15 20 25 30
Media & EntertainmentTransportation
ConstructionIndustrial Products
Non - Ferrous MetalsCement
GasAerospace & Defence
Industrial Capital GoodsTelecom - Services
AutoMinerals/Mining
Petroleum ProductsConsumer Non Durables
Construction ProjectSoftware
FinancePharmaceuticals
PowerBanks
KEY FACTS
INVESTMENT OBjECTIVETo generate capital appreciation / income from a portfolio, predominantly invested in equity & equity related instruments.There is no assurance that the investment objective of the Scheme will be realized.
FUND MANAgER § ¥
Prashant Jain (since June 20, 2003)
Total experience: Over 27 years
INCEPTION DATE (Date of Allotment)January 1, 1995
NAV (AS ON JANUARY 29, 2021) NAV PER UNIT (`)Regular Plan - Growth Option 718.924Regular Plan - Dividend Option 46.878Direct Plan - Growth Option 763.468Direct Plan - Dividend Option 51.464
ASSETS UNDER MANAgEMENT (`) IN CROREAs on January 31, 2021 21,240.51Average for Month of January 2021 22,227.05
qUANTITATIVE DATAPortfolio Turnover Ratio (Last 1 year) 35.04%Risk Ration Standard Deviation 7.156%n Beta 1.041n Sharpe Ratio* 0.022Computed for the 3-yr period ended January 29, 2021. Based on month-end NAV. * Risk free rate: 3.47%(Source: FIMMDA MIBOR)
TOTAL ExPENSE RATIO (As on January 31, 2021)Including Additional expenses and Goods and Service Tax on Management FeesRegular: 1.73% Direct: 1.18%
#BENCHMARK INDEX: NIFTY 500 (Total Returns Index)##ADDl. BENCHMARK INDEX: NIFTY 50 (Total Returns Index)
EXIT lOADl In respect of each purchase / switch-in of Units, an exit Load
of 1.00% is payable if Units are redeemed / switched-out within 1 year from the date of allotment.
l No exit Load is payable if Units are redeemed / switched-out after 1 year from the date of allotment.
For further details, please refer to para ‘Exit Load’ on Pg 67.
PLANS & OPTIONSRegular Plan, Direct Plan. Under each Plan : Growth & Dividend. The Dividend Option offers Dividend Payout and Reinvestment facility.
MINIMUM APPlICATION AMOUNTPurchase : ` 5,000 and any amount thereafter.Additional Purchase : ` 1,000 and any amount thereafter.
SEgMENT-WISE BREAK-UP OF EqUITY HOlDINg (% OF NET ASSETS)Large Cap 81.17%Mid Cap 8.63%Small Cap 8.35%
¥ Dedicated Fund Manager for Overseas Investments: Mr. Sankalp Baid (since January 22, 2021) (Total experience: Over 13 years).
§ Date of migration from Zurich India Mutual Fund (Close of business hours - June 19, 03).
CATEgORY OF SCHEME: FLExI CAP FUND
HDFC Flexi Cap Fund (Erstwhile HDFC Equity Fund) (w.e.f January 29, 2021)

10 January 2021
SIP PERFORMANCE ^ - Regular Plan - growth Option
Since Inception SIP
15 year SIP
10 year SIP
5 year SIP
3 year SIP
1 year SIP
Total Amount Invested (` ‘000) 3,240.00 1,800.00 1,200.00 600.00 360.00 120.00 Mkt Value As on January 29, 2021 (` ‘000) 48,385.59 5,017.01 2,255.88 757.68 422.17 152.82 Returns (%) 16.53 12.61 12.13 9.28 10.64 54.78 Benchmark Returns (%) # N.A. 11.64 12.58 12.59 14.83 53.73 Additional Benchmark Returns (%) ## 13.11 11.51 12.33 13.49 15.30 51.56
Assuming ` 10,000 invested systematically on the first Business Day of every month over a period of time. CAGR returns are computed after accounting for the cash flow by using xIRR method (investment internal rate of return). The above investment simulation is for illustrative purposes only and should not be construed as a promise on minimum returns and safeguard of capital.
PERFORMANCE ^ - Regular Plan - growth OptionDate Period Scheme
Returns (%)
Benchmark Returns
(%)#
Additional Benchmark
Returns (%) ##
Value of ` 10,000 invested
Scheme (`) Benchmark (`)#
Additional Benchmark
(`)##Jan 31, 20 Last 1 Year 13.44 15.82 15.22 11,340 11,578 11,518Jan 31, 18 Last 3 Years 1.57 6.49 8.70 10,477 12,073 12,841Jan 29, 16 Last 5 Years 11.19 13.61 13.94 17,007 18,938 19,214Feb 01, 94 Since Inception 13.72 N.A. 10.51 322,541 N.A. 148,695
Returns greater than 1 year period are compounded annualized (CAGR). Performance of dividend option under the schemes for the investors would be net of distribution tax, if any. N.A. Not Available. For performance of other schemes managed by Amit B. Ganatra, please refer page 67. Different plans viz. Regular Plan and Direct Plan have a different expense structure. The expenses of the Direct Plan under the Scheme will be lower to the extent of the distribution expenses / commission charged in the Regular Plan. As NIFTY 50 TRI data is not available since inception of the scheme, additional benchmark performance is calculated using composite CAGR of NIFTY 50 PRI values from February 1, 1994 to June 29, 1999 and TRI values since June 30, 1999. For Performance of Direct Plan, refer page no. 78.
Face Value per Unit: ` 10 unless otherwise specified, + Industry Classification as recommended by AMFI, Data is as of January 31, 2021 unless otherwise specified.
This product is suitable for investors who are seeking ~
l to generate long-term capital appreciation / income in the long term
l investment primarily in undervalued stocks
VeryHigh
Low to
Moderate
Low
Moderate ModeratelyHigh High
RISKOMETERInvestors understand that their principal will be at
very high risk
~ Investors should consult their financial advisers, if in doubt about whether the product is suitable for them.
^Past performance may or may not be sustained in the future. Load is not taken into consideration for computation of performance.
(An open ended equity scheme following a value investment strategy)HDFC Capital Builder Value Fund
Company Industry+ % to NAVEqUITY & EqUITY RElATED• HDFC Bank Ltd. Banks 9.58• ICICI Bank Ltd. Banks 9.29• Infosys Ltd. Software 9.10• Bharti Airtel Ltd. Telecom - Services 5.49• Axis Bank Ltd. Banks 5.19• HCL Technologies Ltd. Software 2.30• Reliance Industries Ltd. Petroleum Products 2.24• NTPC Ltd. Power 2.20• Larsen and Toubro Ltd. Construction Project 2.11• Sun Pharmaceutical
Industries Ltd. Pharmaceuticals 2.09Cipla Ltd. Pharmaceuticals 1.82State Bank of India Banks 1.79SBI Life Insurance Company Ltd. Finance 1.64Voltas Ltd. Consumer Durables 1.63Lupin Ltd. Pharmaceuticals 1.58Bharat Petroleum Corporation Ltd. Petroleum Products 1.57Mahindra & Mahindra Ltd. Auto 1.56MphasiS Ltd. Software 1.49Godrej Consumer Products Ltd. Consumer Non Durables 1.38Maruti Suzuki India Ltd. Auto 1.38ITC Ltd. Consumer Non Durables 1.30Bajaj Auto Ltd. Auto 1.27Aurobindo Pharma Ltd. Pharmaceuticals 1.25United Breweries Ltd. Consumer Non Durables 1.24L&T Technology Services Ltd. Software 1.21Cholamandalam Investment & Finance Finance 1.08Ambuja Cements Ltd. Cement 1.07CanFin Homes Ltd. Finance 1.07Bharat electronics Ltd. Industrial Capital Goods 1.04United Spirits Ltd. Consumer Non Durables 1.03Radico Khaitan Ltd. Consumer Non Durables 1.02Petronet LNG Ltd. Gas 1.01The Phoenix Mills Ltd. Construction 1.00UltraTech Cement Ltd. Cement 0.93endurance Technologies Ltd. Auto Ancillaries 0.92Aditya Birla Fashion and Retail Ltd. Retailing 0.91Muthoot Finance Ltd. Finance 0.91Tech Mahindra Ltd. Software 0.86Cadila Healthcare Ltd. Pharmaceuticals 0.78Central Depository Services (India) Ltd. Finance 0.78Ashoka Buildcon Ltd. Construction Project 0.77Bosch Ltd. Auto Ancillaries 0.77TCI express Ltd. Transportation 0.77Dilip Buildcon Ltd. Construction Project 0.75UTI Asset Management Company Ltd. Finance 0.73Hindalco Industries Ltd. Non - Ferrous Metals 0.72Chambal Fertilizers & Chemicals Ltd. Fertilisers 0.67Gujarat Pipavav Port Ltd. Transportation 0.67
Company Industry+ % to NAVMishra Dhatu Nigam Ltd. Ferrous Metals 0.64Bharat Dynamics Ltd. Aerospace & Defence 0.60Advanced enzyme Technologies Ltd. Consumer Non Durables 0.58Indoco Remedies Ltd. Pharmaceuticals 0.57Equitas Small Finance Bank Ltd. Banks 0.53Apollo Hospitals enterprise Ltd. Healthcare Services 0.52CG Power and Industrial Solutions Ltd. Industrial Capital Goods 0.50Multi Commodity exchange of India Ltd. Finance 0.50Jamna Auto Industries Ltd. Auto Ancillaries 0.49Just Dial Ltd. Software 0.49Prestige estates Projects Ltd. Construction 0.48Quess Corp Ltd. Services 0.45Zee entertainment enterprises Ltd. Media & entertainment 0.42AIA engineering Ltd. Industrial Products 0.23Container Corporation of India Ltd. Transportation 0.13Siti Networks Ltd. Media & entertainment 0.09Sadbhav Infrastructure Project Ltd. (Corporate Guarantee of Sadbhav engineering Ltd.) Construction Project 0.07Sub Total 99.25Cash, Cash equivalents and Net Current Assets 0.75Grand Total 100.00• Top Ten Holdings
PORTFOLIO
Industry Allocation of Equity Holding (% of Net Assets)
0.230.450.510.520.600.640.670.720.911.011.481.541.571.632.002.182.20
3.703.814.21
5.496.556.71
8.0915.45
26.38
0 5 10 15 20 25 30Industrial Products
ServicesMedia & Entertainment
Healthcare ServicesAerospace & Defence
Ferrous MetalsFertilisers
Non - Ferrous MetalsRetailing
GasConstruction
Industrial Capital GoodsTransportation
Consumer DurablesCement
Auto AncillariesPower
Construction ProjectPetroleum Products
AutoTelecom - Services
Consumer Non DurablesFinance
PharmaceuticalsSoftware
Banks
KEY FACTS
INVESTMENT OBjECTIVE
To achieve capital appreciation/income in the long term by primarily investing in undervalued stocks.
There is no assurance that the investment objective of the Scheme will be realized.
FUND MANAgER ¥
Amit B. Ganatra (since May 21, 2020)
Total experience: Over 17 years
INCEPTION DATE (Date of Allotment)
February 1, 1994
NAV (AS ON JANUARY 29, 2021) NAV PER UNIT (`)
Regular Plan - Growth Option 322.541Regular Plan - Dividend Option 24.189Direct Plan - Growth Option 346.245Direct Plan - Dividend Option 26.953
ASSETS UNDER MANAgEMENT (`) IN CRORE
As on January 31, 2021 4,204.45Average for Month of January 2021 4,391.69
qUANTITATIVE DATA
Portfolio Turnover Ratio (Last 1 year) 106.83%
Risk Ration Standard Deviation 6.841%n Beta 1.022n Sharpe Ratio* 0.012
Computed for the 3-yr period ended January 29, 2021. Based on month-end NAV. * Risk free rate: 3.47%(Source: FIMMDA MIBOR)
TOTAL ExPENSE RATIO (As on January 31, 2021)Including Additional expenses and Goods and Service Tax on Management Fees
Regular: 2.28% Direct: 1.18%
#BENCHMARK INDEX: NIFTY 500 (Total Returns Index)
##ADDl. BENCHMARK INDEX: NIFTY 50 (Total Returns Index)
EXIT lOAD
l In respect of each purchase / switch-in of Units, an exit Load of 1.00% is payable if Units are redeemed / switched-out within 1 year from the date of allotment.
l No exit Load is payable if Units are redeemed / switched-out after 1 year from the date of allotment.
For further details, please refer to para ‘Exit Load’ on Pg 67.
PLANS & OPTIONS
Regular Plan, Direct Plan. Under each Plan : Growth & Dividend. The Dividend Option offers Dividend Payout and Reinvestment facility.
MINIMUM APPlICATION AMOUNT
Purchase : ` 5,000 and any amount thereafter.Additional Purchase : ` 1,000 and any amount thereafter.
¥ Dedicated Fund Manager for Overseas Investments: Mr. Sankalp Baid (since January 22, 2021) (Total experience: Over 13 years).
CATEgORY OF SCHEME: VALUE FUND

January 2021 11
CATEgORY OF SCHEME: LARGE-CAP FUND
Face Value per Unit: ` 10 unless otherwise specified, + Industry Classification as recommended by AMFI, Data is as of January 31, 2021 unless otherwise specified.
KEY FACTS
INVESTMENT OBjECTIVETo provide long-term capital appreciation/income by investing predominantly in Large-Cap companies.There is no assurance that the investment objective of the Scheme will be realized.
FUND MANAgER § ¥
Prashant Jain (since June 20, 2003)
Total experience: Over 27 years
INCEPTION DATE (Date of Allotment)October 11, 1996
NAV (AS ON JANUARY 29, 2021) NAV PER UNIT (`)Regular Plan - Growth Option 529.273Regular Plan - Dividend Option 44.685Direct Plan - Growth Option 557.536Direct Plan - Dividend Option 48.421
ASSETS UNDER MANAgEMENT (`) IN CROREAs on January 31, 2021 17,715.25Average for Month of January 2021 18,613.67
qUANTITATIVE DATAPortfolio Turnover Ratio (Last 1 year) 36.52%Risk Ration Standard Deviation 6.644%n Beta 1.012n Sharpe Ratio* 0.029Computed for the 3-yr period ended January 29, 2021. Based on month-end NAV. * Risk free rate: 3.47%(Source: FIMMDA MIBOR)
TOTAL ExPENSE RATIO (As on January 31, 2021)Including Additional expenses and Goods and Service Tax on Management FeesRegular: 1.74% Direct: 1.19%
#BENCHMARK INDEX: NIFTY 100 (Total Returns Index)
##ADDl. BENCHMARK INDEX: S&P BSe SeNSex (Total Returns Index)
EXIT lOADl In respect of each purchase / switch-in of Units, an exit Load
of 1.00% is payable if Units are redeemed / switched-out within 1 year from the date of allotment.
l No exit Load is payable if Units are redeemed / switched-out after 1 year from the date of allotment.
For further details, please refer to para ‘Exit Load’ on Pg 67.
PLANS & OPTIONSRegular Plan, Direct Plan. Under each Plan : Growth & Dividend. The Dividend Option offers Dividend Payout and Reinvestment facility.
MINIMUM APPlICATION AMOUNTPurchase : ` 5,000 and any amount thereafter.Additional Purchase : ` 1,000 and any amount thereafter.
SEgMENT-WISE BREAK-UP OF EqUITY HOlDINg (% OF NET ASSETS)Large Cap 90.76%Mid Cap 5.82% Small Cap 0.97%§ Date of migration from Zurich India Mutual Fund (Close
of business hours - June 19, 03).
¥ Dedicated Fund Manager for Overseas Investments: Mr. Sankalp Baid (since January 22, 2021) (Total experience: Over 13 years).
This product is suitable for investors who are seeking ~
l to generate long-term capital appreciation / income
l investment predominantly in Large-Cap companies
VeryHigh
Low to
Moderate
Low
Moderate ModeratelyHigh High
RISKOMETERInvestors understand that their principal will be at
very high risk
~ Investors should consult their financial advisers, if in doubt about whether the product is suitable for them.
SIP PERFORMANCE ^ - Regular Plan - growth OptionSince Inception
SIP15 year
SIP10 year
SIP5 year
SIP3 year
SIP1 year
SIPTotal Amount Invested (` ‘000) 2,920.00 1,800.00 1,200.00 600.00 360.00 120.00 Mkt Value As on January 29, 2021 (` ‘000) $$ 41,575.97 4,608.54 2,091.05 758.65 419.23 149.61 Returns (%) $$ 18.20 11.62 10.71 9.33 10.16 49.13 Benchmark Returns (%) # N.A. 11.86 12.53 12.93 14.61 50.16 Additional Benchmark Returns (%) ## 14.26 11.87 12.88 14.61 16.22 50.95
Assuming ` 10,000 invested systematically on the first Business Day of every month over a period of time. CAGR returns are computed after accounting for the cash flow by using xIRR method (investment internal rate of return) for Regular Plan - Growth Option. The above investment simulation is for illustrative purposes only and should not be construed as a promise on minimum returns and safeguard of capital.
PERFORMANCE ^ - Regular Plan - growth OptionDate Period Scheme
Returns (%) $$
Benchmark Returns
(%)#
Additional Benchmark
Returns (%) ##
Value of ` 10,000 investedScheme (`)
$$Benchmark
(`)#Additional
Benchmark (`)##
Jan 31, 20 Last 1 Year 8.83 14.92 15.05 10,881 11,487 11,500Jan 31, 18 Last 3 Years 3.18 7.78 10.08 10,983 12,519 13,336Jan 29, 16 Last 5 Years 12.08 13.85 14.65 17,698 19,139 19,826Oct 11, 96 Since Inception 18.69 N.A. 13.47 645,347 N.A. 216,277
Returns greater than 1 year period are compounded annualized (CAGR). Performance of dividend option under the schemes for the investors would be net of distribution tax, if any. N.A. Not Available. $$ All dividends declared prior to the splitting of the Scheme into Dividend & Growth Options are assumed to be reinvested in the units of the Scheme at the then prevailing NAV (ex-dividend NAV). For performance of other schemes managed by Prashant Jain, please refer page 67. Different plans viz. Regular Plan and Direct Plan have a different expense structure. The expenses of the Direct Plan under the Scheme will be lower to the extent of the distribution expenses / commission charged in the Regular Plan. For Performance of Direct Plan, refer page no. 73. For FPI Portfolio, refer page no. 81.
^Past performance may or may not be sustained in the future. Load is not taken into consideration for computation of performance.
(An open ended equity scheme predominantly investing in large cap stocks)HDFC Top 100 Fund
Company Industry+ % to NAV
EqUITY & EqUITY RElATED• HDFC Bank Ltd. Banks 8.30
• ICICI Bank Ltd. Banks 8.25
• Infosys Ltd. Software 6.01
• State Bank of India Banks 5.94
• Larsen and Toubro Ltd. Construction Project 4.70
• Reliance Industries Ltd. Petroleum Products 4.66
• ITC Ltd. Consumer Non Durables 4.57
• Axis Bank Ltd. Banks 4.42
• Housing Development Finance Corporation Ltd.£ Finance 4.21
• Bharti Airtel Ltd. Telecom - Services 3.68
NTPC Ltd. Power 3.22
Coal India Ltd. Minerals/Mining 2.84
Lupin Ltd. Pharmaceuticals 2.34
Hindustan Petroleum Corporation Ltd. Petroleum Products 2.13
Tata Motors Ltd. Auto 2.10
Tata Consultancy Services Ltd. Software 1.99
Power Grid Corporation of India Ltd. Power 1.97
Power Finance Corporation Ltd. Finance 1.95
ReC Ltd. Finance 1.94
Sun Pharmaceutical Industries Ltd. Pharmaceuticals 1.93
Bharat Petroleum Corporation Ltd. Petroleum Products 1.77
Cipla Ltd. Pharmaceuticals 1.35
HCL Technologies Ltd. Software 1.21
Ambuja Cements Ltd. Cement 1.16
Aurobindo Pharma Ltd. Pharmaceuticals 1.05
Mahindra & Mahindra Ltd. Auto 1.02
GAIL (India) Ltd. Gas 0.99
CeSC Ltd. Power 0.97
SBI Cards and Payment Services Ltd. Finance 0.89
Siemens Ltd. Industrial Capital Goods 0.85
Bharat electronics Ltd. Industrial Capital Goods 0.84
Hero MotoCorp Ltd. Auto 0.81
Tech Mahindra Ltd. Software 0.77
Oil & Natural Gas Corporation Ltd. Oil 0.76
Maruti Suzuki India Ltd. Auto 0.73
Bajaj Auto Ltd. Auto 0.71
Wipro Ltd. Software 0.64
SBI Life Insurance Company Ltd. Finance 0.54
Indian Oil Corporation Ltd. Petroleum Products 0.51
Company Industry+ % to NAV
Vedanta Ltd. Non - Ferrous Metals 0.50
Indus Towers Ltd. Telecom - equipment & Accessories 0.48
InterGlobe Aviation Ltd. Transportation 0.32
Hindalco Industries Ltd. Non - Ferrous Metals 0.26
ABB India Ltd. Industrial Capital Goods 0.24
Bank of Baroda Banks 0.24
Bank of India Banks 0.24
NHPC Ltd. Power 0.24
Tata Steel Ltd. Ferrous Metals 0.19
Container Corporation of India Ltd. Transportation 0.10
LIC Housing Finance Ltd. Finance 0.03
Sub Total 97.56Preference SharesZee entertainment enterprises Ltd. Media & entertainment 0.01
Sub Total 0.01Total 97.57Cash, Cash equivalents and Net Current Assets 2.43
Grand Total 100.00• Top Ten Holdings, £ Co-sponsor
PORTFOLIO
Industry Allocation of Equity Holding (% of Net Assets)
0.010.190.420.480.760.760.991.161.932.843.684.574.705.376.406.67
9.079.5610.62
27.39
0 5 10 15 20 25 30
Media & EntertainmentFerrous MetalsTransportation
Telecom - Equipment & AccessoriesNon - Ferrous Metals
OilGas
CementIndustrial Capital Goods
Minerals/MiningTelecom - Services
Consumer Non DurablesConstruction Project
AutoPower
PharmaceuticalsPetroleum Products
FinanceSoftware
Banks

12 January 2021
Company Industry+ / Rating % to NAVEqUITY & EqUITY RElATED• Cholamandalam Investment
& Finance Finance 5.44• Balkrishna Industries Ltd. Auto Ancillaries 5.07• Aarti Industries Ltd. Chemicals 3.63• Crompton Greaves Consumer
elec. Ltd. Consumer Durables 3.37• Sundram Fasteners Ltd. Auto Ancillaries 3.35• Bharat Electronics Ltd. Industrial Capital Goods 3.30• Voltas Ltd. Consumer Durables 3.14• Ipca Laboratories Ltd. Pharmaceuticals 2.88• Max Financial Services Ltd. Finance 2.77• Atul Ltd. Chemicals 2.74City Union Bank Ltd. Banks 2.33Indian Hotels Company Ltd. Hotels/Resorts & Other
Recreational Activities 2.16Supreme Industries Ltd. Industrial Products 2.10Aurobindo Pharma Ltd. Pharmaceuticals 2.05Tata Consumer Products Ltd. Consumer Non Durables 2.05Apollo Tyres Ltd. Auto Ancillaries 1.96Whirlpool of India Ltd. Consumer Durables 1.89Carborundum Universal Ltd. Industrial Products 1.72Tube Investments of India Ltd. Auto Ancillaries 1.71AIA engineering Ltd. Industrial Products 1.65exide Industries Ltd. Auto Ancillaries 1.59VST Industries Ltd. Consumer Non Durables 1.55Cholamandalam Financial Holdings Ltd. Finance 1.54Tata Chemicals Ltd. Chemicals 1.49SKF India Ltd. Industrial Products 1.41KNR Construction Ltd. Construction 1.38Oracle Financial Ser Software Ltd. Software 1.37KeC International Ltd. Construction Project 1.35Nippon Life India Asset Management Ltd. Finance 1.32Persistent Systems Ltd. Software 1.30Torrent Pharmaceuticals Ltd. Pharmaceuticals 1.23The Federal Bank Ltd. Banks 1.22Jindal Steel & Power Ltd. Ferrous Metals 1.19RBL Bank Ltd. Banks 1.17Glenmark Pharmaceuticals Ltd. Pharmaceuticals 1.12ReC Ltd. Finance 1.10Dilip Buildcon Ltd. Construction Project 1.06Redington (India) Ltd. Transportation 1.00Power Finance Corporation Ltd. Finance 0.99Blue Star Ltd. Consumer Durables 0.98Solar Industries India Ltd. Chemicals 0.87Trent Ltd. Retailing 0.87Symphony Ltd. Consumer Durables 0.72Mahindra & Mahindra Financial Services Ltd. Finance 0.71Gujarat Fluorochemicals Ltd. Chemicals 0.63Schaeffler India Ltd. Industrial Products 0.62Greenlam Industries Ltd. Consumer Durables 0.61RITeS Ltd. engineering Services 0.59Delta Corp Ltd. Hotels/Resorts & Other
Recreational Activities 0.57Karur Vysya Bank Ltd. Banks 0.57
Company Industry+ / Rating % to NAVNavneet education Ltd. Media & entertainment 0.55Grindwell Norton Ltd. Industrial Products 0.54Greenpanel Industries Ltd. Consumer Durables 0.51Indian Bank Banks 0.49Coforge Ltd. Software 0.45Edelweiss Financial Services Ltd. Finance 0.45Cummins India Ltd. Industrial Products 0.44Strides Pharma Science Ltd. Pharmaceuticals 0.38Union Bank of India Banks 0.38Greenply Industries Ltd. Consumer Durables 0.37Vesuvius India Ltd. Industrial Products 0.37Mahindra Holidays & Resorts Ind Ltd.
Hotels/Resorts & Other Recreational Activities 0.35
Vardhman Textiles Ltd. Textiles - Cotton 0.35Dhanuka Agritech Ltd. Pesticides 0.33Jagran Prakashan Ltd. Media & entertainment 0.29Arvind Ltd. Textile Products 0.27Arvind Fashions Ltd. Retailing 0.17The Anup engineering Ltd. Industrial Capital Goods 0.15GFL Ltd. Chemicals 0.10Divis Laboratories Ltd. Pharmaceuticals 0.09Sub Total 94.46Preference SharesZee entertainment enterprises Ltd. Media & entertainment @Sub Total @Total 94.46Cash, Cash equivalents and Net Current Assets 5.54Grand Total 100.00• Top Ten Holdings, @ Less than 0.01%
CATEgORY OF SCHEME: MID CAP FUND
KEY FACTS
INVESTMENT OBjECTIVETo provide long-term capital appreciation/income by investing predominantly in Mid-Cap companies.There is no assurance that the investment objective of the Scheme will be realized.
FUND MANAgER ¥
Chirag Setalvad (since June 25, 2007)
Total experience: Over 21 years
INCEPTION DATE (Date of Allotment)June 25, 2007
NAV (AS ON JANUARY 29, 2021) NAV PER UNIT (`)Regular Plan - Growth Option 64.972Regular Plan - Dividend Option 29.469Direct Plan - Growth Option 69.421Direct Plan - Dividend Option 37.624
ASSETS UNDER MANAgEMENT (`) IN CROREAs on January 31, 2021 23,988.37Average for Month of January 2021 25,052.27
qUANTITATIVE DATAPortfolio Turnover Ratio (Last 1 year) 16.77%Risk Ration Standard Deviation 7.458%n Beta 0.892n Sharpe Ratio* 0.039Computed for the 3-yr period ended January 29, 2021. Based on month-end NAV. * Risk free rate: 3.47%(Source: FIMMDA MIBOR)
TOTAL ExPENSE RATIO (As on January 31, 2021)Including Additional expenses and Goods and Service Tax on Management FeesRegular: 1.68% Direct: 1.08%
#BENCHMARK INDEX: NIFTY Midcap 100 (Total Returns Index) ##ADDl. BENCHMARK INDEX: NIFTY 50 (Total Returns Index)
EXIT lOADl In respect of each purchase / switch-in of Units, an exit Load
of 1.00% is payable if Units are redeemed / switched-out within 1 year from the date of allotment.
l No exit Load is payable if Units are redeemed / switched-out after 1 year from the date of allotment.
For further details, please refer to para ‘Exit Load’ on Pg 67.
PLANS & OPTIONSRegular Plan, Direct Plan. Under each Plan : Growth & Dividend. The Dividend Option offers Dividend Payout and Reinvestment facility.
MINIMUM APPlICATION AMOUNTPurchase : ` 5,000 and any amount thereafter.Additional Purchase : ` 1,000 and any amount thereafter.
SEgMENT-WISE BREAK-UP OF EqUITY HOlDINg (% OF NET ASSETS)Large Cap 5.42%Mid Cap 65.71% Small Cap 23.29%
¥ Dedicated Fund Manager for Overseas Investments: Mr. Sankalp Baid (since January 22, 2021) (Total experience: Over 13 years).
SIP PERFORMANCE ^ - Regular Plan - growth Option
Since Inception SIP
10 year SIP
5 year SIP
3 year SIP
1 year SIP
Total Amount Invested (` ‘000) 1,640.00 1,200.00 600.00 360.00 120.00 Mkt Value As on January 29, 2021 (` ‘000) 5,587.38 2,700.44 783.81 441.95 153.46 Returns (%) 16.51 15.49 10.64 13.81 55.93 Benchmark Returns (%) # 12.64 12.92 10.40 14.68 66.95 Additional Benchmark Returns (%) ## 11.61 12.33 13.49 15.30 51.56
Assuming ` 10,000 invested systematically on the first Business Day of every month over a period of time. CAGR returns are computed after accounting for the cash flow by using xIRR method (investment internal rate of return) for Regular Plan - Growth Option. The above investment simulation is for illustrative purposes only and should not be construed as a promise on minimum returns and safeguard of capital.
PERFORMANCE ^ - Regular Plan - growth Option
Date Period Scheme Returns
(%)
Benchmark Returns
(%)#
Additional Benchmark
Returns (%) ##
Value of ` 10,000 invested
Scheme (`) Benchmark (`)#
Additional Benchmark
(`)##
Jan 31, 20 Last 1 Year 15.76 17.21 15.22 11,572 11,716 11,518Jan 31, 18 Last 3 Years 3.48 1.16 8.70 11,081 10,353 12,841Jan 29, 16 Last 5 Years 12.71 12.06 13.94 18,199 17,684 19,214Jun 25, 07 Since Inception 14.74 11.21 10.21 64,972 42,455 37,556
Returns greater than 1 year period are compounded annualized (CAGR). Performance of dividend option under the schemes for the investors would be net of distribution tax, if any. For performance of other schemes managed by Chirag Setalvad, please refer page 67. Different plans viz. Regular Plan and Direct Plan have a different expense structure. The expenses of the Direct Plan under the Scheme will be lower to the extent of the distribution expenses / commission charged in the Regular Plan. For Performance of Direct Plan, refer page no. 73.
Face Value per Unit: ` 10 unless otherwise specified, + Industry Classification as recommended by AMFI, Data is as of January 31, 2021 unless otherwise specified.
This product is suitable for investors who are seeking ~
l to generate long-term capital appreciation / income
l investment predominantly in Mid-Cap companies
VeryHigh
Low to
Moderate
Low
Moderate ModeratelyHigh High
RISKOMETERInvestors understand that their principal will be at
very high risk
~ Investors should consult their financial advisers, if in doubt about whether the product is suitable for them.
^Past performance may or may not be sustained in the future. Load is not taken into consideration for computation of performance.
(An open ended equity scheme predominantly investing in mid cap stocks)HDFC Mid Cap Opportunities Fund
PORTFOLIO
Industry Allocation of Equity Holding (% of Net Assets)
0.270.330.350.590.841.001.041.191.38
2.413.083.123.453.60
6.167.75
8.859.46
11.5913.6814.32
0 2 4 6 8 10 12 14 16Textile Products
PesticidesTextiles - Cotton
Engineering ServicesMedia & Entertainment
TransportationRetailing
Ferrous MetalsConstruction
Construction ProjectHotels, Resorts & Other Recreational Activities
SoftwareIndustrial Capital GoodsConsumer Non Durables
BanksPharmaceuticals
Industrial ProductsChemicals
Consumer DurablesAuto Ancillaries
Finance

January 2021 13
CATEgORY OF SCHEME: SMALL CAP FUND
KEY FACTS
INVESTMENT OBjECTIVETo provide long-term capital appreciation /income by investing predominantly in Small-Cap companies.There is no assurance that the investment objective of the Scheme will be realized.
FUND MANAgER § ¥
Chirag Setalvad (since June 28, 2014)
Total experience: Over 21 years
INCEPTION DATE (Date of Allotment)April 3, 2008
NAV (AS ON JANUARY 29, 2021) NAV PER UNIT (`)Regular Plan - Growth Option 46.431Regular Plan - Dividend Option 24.445Direct Plan - Growth Option 50.631Direct Plan - Dividend Option 31.228
ASSETS UNDER MANAgEMENT (`) IN CROREAs on January 31, 2021 9,069.13Average for Month of January 2021 9,542.72
qUANTITATIVE DATAPortfolio Turnover Ratio (Last 1 year) 15.94%Risk Ration Standard Deviation 8.020%n Beta 0.793n Sharpe Ratio* 0.012Computed for the 3-yr period ended January 29, 2021. Based on month-end NAV. * Risk free rate: 3.47%(Source: FIMMDA MIBOR)
TOTAL ExPENSE RATIO (As on January 31, 2021)Including Additional expenses and Goods and Service Tax on Management FeesRegular: 2.08% Direct: 0.88%
#BENCHMARK INDEX: NIFTY Smallcap 100 (Total Returns Index)##ADDl. BENCHMARK INDEX: NIFTY 50 (Total Returns Index)
EXIT lOADl In respect of each purchase / switch-in of Units, an exit Load
of 1.00% is payable if Units are redeemed / switched-out within 1 year from the date of allotment.
l No exit Load is payable if Units are redeemed / switched-out after 1 year from the date of allotment.
For further details, please refer to para ‘Exit Load’ on Pg 67.
PLANS & OPTIONSRegular Plan, Direct Plan. Under each Plan : Growth & Dividend. The Dividend Option offers Dividend Payout and Reinvestment facility.
MINIMUM APPlICATION AMOUNTPurchase : ` 5,000 and any amount thereafter.Additional Purchase : ` 1,000 and any amount thereafter.
SEgMENT-WISE BREAK-UP OF EqUITY HOlDINg (% OF NET ASSETS)Large Cap 2.70%Mid Cap 12.94%Small Cap 79.31%§ Date of migration from Morgan Stanley Mutual Fund
(Close of business hours - June 27, 14)¥ Dedicated Fund Manager for Overseas Investments: Mr. Sankalp Baid (since January 22, 2021) (Total experience: Over 13 years).
SIP PERFORMANCE ^ - Regular Plan - growth Option
Since Inception SIP
10 year SIP
5 year SIP
3 year SIP
1 year SIP
Total Amount Invested (` ‘000) 1,540.00 1,200.00 600.00 360.00 120.00 Mkt Value As on January 29, 2021 (` ‘000) 4,006.57 2,423.13 774.48 424.16 160.60 Returns (%) 13.93 13.47 10.16 10.96 68.75 Benchmark Returns (%) # 9.63 9.44 7.10 13.18 84.81 Additional Benchmark Returns (%) ## 12.06 12.33 13.49 15.30 51.56
Assuming ` 10,000 invested systematically on the first Business Day of every month over a period of time. CAGR returns are computed after accounting for the cash flow by using xIRR method (investment internal rate of return) for Regular Plan - Growth Option. The above investment simulation is for illustrative purposes only and should not be construed as a promise on minimum returns and safeguard of capital.
PERFORMANCE ^ - Regular Plan - growth Option
Date Period Scheme Returns
(%)
Benchmark Returns
(%)#
Additional Benchmark
Returns (%) ##
Value of ` 10,000 invested
Scheme (`) Benchmark (`)#
Additional Benchmark
(`)##
Jan 31, 20 Last 1 Year 15.39 16.54 15.22 11,534 11,649 11,518Jan 31, 18 Last 3 Years 0.49 -5.63 8.70 10,147 8,405 12,841Jan 29, 16 Last 5 Years 12.99 8.45 13.94 18,426 15,010 19,214Apr 03, 08 Since Inception 12.71 6.62 9.83 46,431 22,775 33,309
Returns greater than 1 year period are compounded annualized (CAGR). Performance of dividend option under the schemes for the investors would be net of distribution tax, if any. For performance of other schemes managed by Chirag Setalvad, please refer page 67. Different plans viz. Regular Plan and Direct Plan have a different expense structure. The expenses of the Direct Plan under the Scheme will be lower to the extent of the distribution expenses / commission charged in the Regular Plan. For Performance of Direct Plan, refer page no. 73.
Face Value per Unit: ` 10 unless otherwise specified, + Industry Classification as recommended by AMFI, Data is as of January 31, 2021 unless otherwise specified.
This product is suitable for investors who are seeking ~
l to generate long-term capital appreciation / income
l investment predominantly in Small-Cap companies
VeryHigh
Low to
Moderate
Low
Moderate ModeratelyHigh High
RISKOMETERInvestors understand that their principal will be at
very high risk
~ Investors should consult their financial advisers, if in doubt about whether the product is suitable for them.
^Past performance may or may not be sustained in the future. Load is not taken into consideration for computation of performance.
(An open ended equity scheme predominantly investing in small cap stocks)HDFC Small Cap Fund
Company Industry+ % to NAV
EqUITY & EqUITY RElATED• Bajaj Electricals Ltd. Consumer Durables 5.44• Firstsource Solutions Ltd. Software 4.99• Persistent Systems Ltd. Software 4.13• Sonata Software Ltd. Software 3.78• Chambal Fertilizers &
Chemicals Ltd. Fertilisers 3.59• Procter & Gamble Health Ltd. Pharmaceuticals 2.77• Aurobindo Pharma Ltd. Pharmaceuticals 2.70• Aster DM Healthcare Ltd. Healthcare Services 2.65• PNC Infratech Ltd. Construction 2.46• KEC International Ltd. Construction Project 2.41Finolex Industries Ltd. Industrial Products 2.17eClerx Services Ltd. Software 1.98KeI Industries Ltd. Industrial Products 1.97Advanced enzyme Technologies Ltd.
Consumer Non Durables 1.93
Tata Metaliks Ltd. Ferrous Metals 1.92emami Ltd. Consumer Non Durables 1.77Sharda Cropchem Ltd. Pesticides 1.77Vardhman Textiles Ltd. Textiles - Cotton 1.73Suprajit engineering Ltd. Auto Ancillaries 1.65Unichem Laboratories Ltd. Pharmaceuticals 1.62La Opala RG Ltd. Consumer Durables 1.60SKF India Ltd. Industrial Products 1.58Radico Khaitan Ltd. Consumer Non Durables 1.57Bajaj Consumer Care Ltd. Consumer Non Durables 1.55DCB Bank Ltd. Banks 1.52Kalpataru Power Transmission Ltd. Power 1.46Nilkamal Ltd. Industrial Products 1.46Kirloskar Ferrous Industries Ltd. Ferrous Metals 1.44T. V. Today Network Ltd. Media & entertainment 1.44Great eastern Shipping Company Ltd. Transportation 1.43Atul Ltd. Chemicals 1.39Delta Corp Ltd. Hotels/Resorts & Other
Recreational Activities 1.33Bank of Baroda Banks 1.32Gujarat Fluorochemicals Ltd. Chemicals 1.29Carborundum Universal Ltd. Industrial Products 1.22engineers India Ltd. Construction Project 1.20Chalet Hotels Ltd. Hotels/Resorts & Other
Recreational Activities 1.14Redington (India) Ltd. Transportation 1.01Repco Home Finance Ltd. Finance 1.00Gabriel India Ltd. Auto Ancillaries 0.98NRB Bearing Ltd. Industrial Products 0.97JB Chemicals & Pharmaceuticals Ltd. Pharmaceuticals 0.96Astral Poly Technik Ltd. Industrial Products 0.95Insecticides (India) Ltd. Pesticides 0.92Goodyear India Ltd. Auto Ancillaries 0.91eIH Ltd. Hotels/Resorts & Other
Recreational Activities 0.87
Company Industry+ % to NAV
Indian Bank Banks 0.71LG Balakrishnan & Bros Ltd. Auto Ancillaries 0.68IFGL Refractories Ltd. (Erst IFGL Exports Ltd.) Industrial Products 0.67Shaily engineering Plastics Ltd. Industrial Products 0.62The Federal Bank Ltd. Banks 0.62Oriental Carbon & Chemicals Ltd. Chemicals 0.54Transport Corporation of India Ltd. Transportation 0.54Power Mech Projects Ltd. Construction Project 0.49Vesuvius India Ltd. Industrial Products 0.49Sadbhav engineering Ltd. Construction Project 0.46D B Corp Ltd. Media & entertainment 0.44GNA Axles Ltd. Auto Ancillaries 0.42Inox Leisure Ltd. Media & entertainment 0.42Greenlam Industries Ltd. Consumer Durables 0.36Apar Industries Ltd. Industrial Capital Goods 0.33Taj GVK Hotels & Resorts Ltd. Hotels/Resorts & Other
Recreational Activities 0.27Atul Auto Ltd. Auto 0.24Greenply Industries Ltd. Consumer Durables 0.20Jagran Prakashan Ltd. Media & entertainment 0.18Equitas Small Finance Bank Ltd. Banks 0.13Orient Refractories Ltd. Industrial Products 0.08Time Technoplast Ltd. Industrial Products 0.06Sub Total 94.89Cash, Cash equivalents and Net Current Assets 5.11Grand Total 100.00• Top Ten Holdings
PORTFOLIO
Industry Allocation of Equity Holding (% of Net Assets)
0.240.331.001.461.732.462.482.652.692.983.223.363.593.614.304.564.64
6.827.608.05
12.2414.88
0 2 4 6 8 10 12 14 16Auto
Industrial Capital GoodsFinance
PowerTextiles - Cotton
ConstructionMedia & Entertainment
Healthcare ServicesPesticides
TransportationChemicals
Ferrous MetalsFertilisers
Hotels, Resorts & Other Recreational ActivitiesBanks
Construction ProjectAuto Ancillaries
Consumer Non DurablesConsumer Durables
PharmaceuticalsIndustrial Products
Software

14 January 2021
CATEgORY OF SCHEME: LARGE & MID CAP FUND
KEY FACTS
INVESTMENT OBjECTIVETo generate long term capital appreciation/income from a portfolio, predominantly invested in equity and equity related instruments. There is no assurance that the investment objective of the Scheme will be realized.
FUND MANAgER § ¥
gopal Agrawal (since July 16, 2020)
Total experience: Over 16 years
INCEPTION DATE (Date of Allotment)February 18, 1994
NAV (AS ON JANUARY 29, 2021) NAV PER UNIT (`)Regular Plan - Growth Option 130.129Regular Plan - Dividend Option 19.118Direct Plan - Growth Option 132.143Direct Plan - Dividend Option 22.799
ASSETS UNDER MANAgEMENT (`) IN CROREAs on January 31, 2021 1,725.18Average for Month of January 2021 1,770.48
qUANTITATIVE DATAPortfolio Turnover Ratio (Last 1 year) 14.34%Risk Ration Standard Deviation 6.908%n Beta 0.966n Sharpe Ratio* 0.035Computed for the 3-yr period ended January 29, 2021. Based on month-end NAV. * Risk free rate: 3.47%(Source: FIMMDA MIBOR)
TOTAL ExPENSE RATIO (As on January 31, 2021)Including Additional expenses and Goods and Service Tax on Management FeesRegular: 2.27% Direct: 1.92%
#BENCHMARK INDEX: NIFTY Large Midcap 250 (Total Returns Index)##ADDl. BENCHMARK INDEX: S&P BSe SeNSex (Total Returns Index)
EXIT lOADl In respect of each purchase / switch-in of Units, an exit Load
of 1.00% is payable if Units are redeemed / switched-out within 1 year from the date of allotment.
l No exit Load is payable if Units are redeemed / switched-out after 1 year from the date of allotment.
For further details, please refer to para ‘Exit Load’ on Pg 67.
PLANS & OPTIONSRegular Plan, Direct Plan. Under each Plan : Growth & Dividend. The Dividend Option offers Dividend Payout and Reinvestment facility.
MINIMUM APPlICATION AMOUNTPurchase : ` 5,000 and any amount thereafter.Additional Purchase : ` 1,000 and any amount thereafter.
SEgMENT-WISE BREAK-UP OF EqUITY HOlDINg (% OF NET ASSETS)Large Cap 56.83%Mid Cap 33.25%Small Cap 6.74%§ Date of migration from Morgan Stanley Mutual Fund (Close
of business hours - June 27, 14)
¥ Dedicated Fund Manager for Overseas Investments: Mr. Sankalp Baid (since January 22, 2021) (Total experience: Over 13 years).
PERFORMANCE ^ - Regular Plan - growth Option
Date Period Scheme Returns
(%) $$
Benchmark Returns
(%)#
Additional Benchmark
Returns (%) ##
Value of ` 10,000 invested
Scheme (`) $$
Benchmark (`)#
Additional Benchmark
(`)##
Jan 31, 20 Last 1 Year 12.47 17.26 15.05 11,244 11,721 11,500Jan 31, 18 Last 3 Years 3.53 6.18 10.08 11,096 11,969 13,336Jan 29, 16 Last 5 Years 10.38 14.34 14.65 16,392 19,555 19,826Feb 18, 94 Since Inception 11.08 N.A. 11.19 170,123 N.A. 174,689
Returns greater than 1 year period are compounded annualized (CAGR). Performance of dividend option under the schemes for the investors would be net of distribution tax, if any. N.A. Not Available. The Scheme, formerly a large cap fund, has undergone change in Fundamental attributes w.e.f. May 23, 2018 and become a Large and Mid-cap Fund. Accordingly, the Scheme’s benchmark has also changed. Hence, the past performance of the Scheme may not strictly be comparable with that of the new benchmark. As S&P BSe SeNSex TRI data is not available since inception of the scheme, additional benchmark performance is calculated using composite CAGR of S&P BSE SENSEx PRI values from February 18, 1994 to August 18, 1996 and TRI values since August 19, 1996. $$ All dividends declared prior to the splitting of the Scheme into Dividend & Growth Options are assumed to be reinvested in the units of the Scheme at the then prevailing NAV (ex-dividend NAV). For performance of other schemes managed by Gopal Agrawal, please refer page 67. Different plans viz. Regular Plan and Direct Plan have a different expense structure. The expenses of the Direct Plan under the Scheme will be lower to the extent of the distribution expenses / commission charged in the Regular Plan. For Performance of Direct Plan, refer page no. 79.
Face Value per Unit: ` 10 unless otherwise specified, + Industry Classification as recommended by AMFI, Data is as of January 31, 2021 unless otherwise specified.
This product is suitable for investors who are seeking ~
l to generate long-term capital appreciation/income
l investment predominantly in Large Cap and Mid Cap companies
VeryHigh
Low to
Moderate
Low
Moderate ModeratelyHigh High
RISKOMETERInvestors understand that their principal will be at
very high risk
~ Investors should consult their financial advisers, if in doubt about whether the product is suitable for them.
^Past performance may or may not be sustained in the future. Load is not taken into consideration for computation of performance.
(An open ended equity scheme investing in both large cap and mid cap stocks)HDFC Growth Opportunities Fund
Company Industry+ % to NAV
EqUITY & EqUITY RElATED• ICICI Bank Ltd. Banks 7.41• Infosys Ltd. Software 7.30• State Bank of India Banks 5.49• Reliance Industries Ltd. Petroleum Products 5.31• Tata Consumer Products Ltd. Consumer Non Durables 4.02• HDFC Bank Ltd. Banks 3.79• NTPC Ltd. Power 3.66• Emami Ltd. Consumer Non Durables 3.33• Bharat Petroleum
Corporation Ltd. Petroleum Products 2.90• ITC Ltd. Consumer Non Durables 2.83Bharat electronics Ltd. Industrial Capital Goods 2.39Apollo Tyres Ltd. Auto Ancillaries 2.32Tata Steel Ltd. Ferrous Metals 2.26Max Financial Services Ltd. Finance 2.11Sun Pharmaceutical Industries Ltd. Pharmaceuticals 2.04Indian Hotels Company Ltd. Hotels/Resorts & Other
Recreational Activities 1.93GAIL (India) Ltd. Gas 1.84Mindtree Consulting Ltd. Software 1.67Larsen and Toubro Ltd. Construction Project 1.66Prestige estates Projects Ltd. Construction 1.66ACC Ltd. Cement 1.53Shriram Transport Finance Company Ltd. Finance 1.50Trent Ltd. Retailing 1.42Tata Motors Ltd. DVR Auto 1.41Gujarat State Petronet Ltd. Gas 1.40NHPC Ltd. Power 1.32LIC Housing Finance Ltd. Finance 1.31CeSC Ltd. Power 1.29exide Industries Ltd. Auto Ancillaries 1.27Indian Railway Catering And Tourism Corporation Ltd. Services 1.27Tata Motors Ltd. Auto 1.22Computer Age Management Services Finance 1.09Mahanagar Gas Ltd. Gas 1.04Ambuja Cements Ltd. Cement 1.02Inox Leisure Ltd. Media & entertainment 1.00Lupin Ltd. Pharmaceuticals 0.99Tata Chemicals Ltd. Chemicals 0.97Solar Industries India Ltd. Chemicals 0.94Castrol India Ltd. Petroleum Products 0.88The Phoenix Mills Ltd. Construction 0.87Hindustan Petroleum Corporation Ltd. Petroleum Products 0.86Glenmark Pharmaceuticals Ltd. Pharmaceuticals 0.85Cholamandalam Investment & Finance Finance 0.81
Company Industry+ % to NAV
Jindal Steel & Power Ltd. Ferrous Metals 0.77Bharat Heavy electricals Ltd. Industrial Capital Goods 0.64Power Finance Corporation Ltd. Finance 0.64Power Grid Corporation of India Ltd. Power 0.53Canara Bank Banks 0.44Titagarh Wagons Ltd. Industrial Capital Goods 0.39NBCC (India) Ltd. Construction 0.23NLC India Ltd. Power 0.22Aurobindo Pharma Ltd. Pharmaceuticals 0.15Oil India Ltd. Oil 0.15SBI Cards and Payment Services Ltd. Finance 0.13Union Bank of India Banks 0.13Indian Bank Banks 0.12Reliance Power Ltd. Power 0.08Indus Towers Ltd. Telecom - equipment
& Accessories 0.01Sub Total 96.81Cash, Cash equivalents and Net Current Assets 3.19Grand Total 100.00• Top Ten Holdings
PORTFOLIO
Industry Allocation of Equity Holding (% of Net Assets)
0.010.151.001.271.421.661.911.932.552.632.763.033.423.594.034.28
7.107.59
8.979.9510.18
17.38
0 2 4 6 8 1012141618Telecom - Equipment & Accessories
OilMedia & Entertainment
ServicesRetailing
Construction ProjectChemicals
Hotels, Resorts & Other Recreational ActivitiesCement
AutoConstruction
Ferrous MetalsIndustrial Capital Goods
Auto AncillariesPharmaceuticals
GasPower
FinanceSoftware
Petroleum ProductsConsumer Non Durables
Banks
SIP PERFORMANCE ^ - Regular Plan - growth OptionSince Inception
SIP15 year
SIP10 year
SIP5 year
SIP3 year
SIP1 year
SIPTotal Amount Invested (` ‘000) 3,240.00 1,800.00 1,200.00 600.00 360.00 120.00 Mkt Value As on January 29, 2021 (` ‘000) $$ 23,330.99 3,909.12 2,076.33 768.40 435.35 152.56 Returns (%) $$ 12.43 9.68 10.57 9.84 12.76 54.33 Benchmark Returns (%) # N.A. 13.08 14.16 13.14 15.80 57.50 Additional Benchmark Returns (%) ## 13.54 11.87 12.88 14.61 16.22 50.95
Assuming ` 10,000 invested systematically on the first Business Day of every month over a period of time. CAGR returns are computed after accounting for the cash flow by using xIRR method (investment internal rate of return) for Regular Plan - Growth Option. The above investment simulation is for illustrative purposes only and should not be construed as a promise on minimum returns and safeguard of capital.

January 2021 15
CATEgORY OF SCHEME: FOCUSED FUND
KEY FACTS
INVESTMENT OBjECTIVE
To generate long term capital appreciation/income by investing in equity & equity related instruments of up to 30 companies.
There is no assurance that the investment objective of the Scheme will be realized.
FUND MANAgER ¥
gopal Agrawal (since July 16, 2020)
Total experience: Over 16 years
INCEPTION DATE (Date of Allotment)
September 17, 2004
NAV (AS ON JANUARY 29, 2021) NAV PER UNIT (`)
Regular Plan - Growth Option 79.735Regular Plan - Dividend Option 14.834Direct Plan - Growth Option 85.540Direct Plan - Dividend Option 16.736
ASSETS UNDER MANAgEMENT (`) IN CRORE
As on January 31, 2021 563.70Average for Month of January 2021 586.42
qUANTITATIVE DATA
Portfolio Turnover Ratio (Last 1 year) 24.00%
Risk Ration Standard Deviation 6.847%n Beta 0.994n Sharpe Ratio* -0.039Computed for the 3-yr period ended January 29, 2021. Based on month-end NAV. * Risk free rate: 3.47%(Source: FIMMDA MIBOR)
TOTAL ExPENSE RATIO (As on January 31, 2021)Including Additional expenses and Goods and Service Tax on Management Fees
Regular: 2.70% Direct: 1.55%
#BENCHMARK INDEX: NIFTY 500 (Total Returns Index)
##ADDl. BENCHMARK INDEX: S&P BSe SeNSex (Total Returns Index)
EXIT lOAD
l In respect of each purchase / switch-in of Units, an exit Load of 1.00% is payable if Units are redeemed / switched-out within 1 year from the date of allotment.
l No exit Load is payable if Units are redeemed / switched-out after 1 year from the date of allotment.
For further details, please refer to para ‘Exit Load’ on Pg 67.
PLANS & OPTIONS
Regular Plan, Direct Plan. Under each Plan : Growth & Dividend. The Dividend Option offers Dividend Payout and Reinvestment facility.
MINIMUM APPlICATION AMOUNT
Purchase : ` 5,000 and any amount thereafter.Additional Purchase : ` 1,000 and any amount thereafter.
¥ Dedicated Fund Manager for Overseas Investments: Mr. Sankalp Baid (since January 22, 2021) (Total experience: Over 13 years).
SIP PERFORMANCE ^ - Regular Plan - growth Option
Since Inception SIP
15 year SIP
10 year SIP
5 year SIP
3 year SIP
1 year SIP
Total Amount Invested (` ‘000) 1,970.00 1,800.00 1,200.00 600.00 360.00 120.00
Mkt Value As on January 29, 2021 (` ‘000) 4,703.30 3,667.35 1,823.33 680.59 395.66 146.22
Returns (%) 9.83 8.92 8.11 4.99 6.24 43.21
Benchmark Returns (%) # 12.18 11.64 12.58 12.59 14.83 53.73
Additional Benchmark Returns (%) ## 12.62 11.87 12.88 14.61 16.22 50.95
Assuming ̀ 10,000 invested systematically on the first Business Day of every month over a period of time. CAGR returns are computed after accounting for the cash flow by using xIRR method (investment internal rate of return) for Regular Plan - Growth Option. The above investment simulation is for illustrative purposes only and should not be construed as a promise on minimum returns and safeguard of capital.
PERFORMANCE ^ - Regular Plan - growth Option
Date Period Scheme Returns
(%)
Benchmark Returns
(%)#
Additional Benchmark
Returns (%) ##
Value of ` 10,000 invested
Scheme (`) Benchmark (`)#
Additional Benchmark
(`)##
Jan 31, 20 Last 1 Year 4.46 15.82 15.05 10,445 11,578 11,500
Jan 31, 18 Last 3 Years -2.56 6.49 10.08 9,251 12,073 13,336
Jan 29, 16 Last 5 Years 7.43 13.61 14.65 14,315 18,938 19,826
Sep 17, 04 Since Inception 13.51 14.73 15.38 79,735 94,888 104,190
Returns greater than 1 year period are compounded annualized (CAGR). Performance of dividend option under the schemes for the investors would be net of distribution tax, if any. For performance of other schemes managed by Gopal Agrawal, please refer page 67. Different plans viz. Regular Plan and Direct Plan have a different expense structure. The expenses of the Direct Plan under the Scheme will be lower to the extent of the distribution expenses / commission charged in the Regular Plan. For Performance of Direct Plan, refer page no. 79.
Face Value per Unit: ` 10 unless otherwise specified, + Industry Classification as recommended by AMFI, Data is as of January 31, 2021 unless otherwise specified.
This product is suitable for investors who are seeking ~
l to generate long-term capital appreciation / income
l investments in equity & equity related instruments of up to 30 companies
VeryHigh
Low to
Moderate
Low
Moderate ModeratelyHigh High
RISKOMETERInvestors understand that their principal will be at
very high risk
~ Investors should consult their financial advisers, if in doubt about whether the product is suitable for them. ^Past performance may or may not be sustained in the future. Load is not taken into consideration for computation of performance.
[An open ended equity scheme investing in maximum 30 stocks in large-cap, mid-cap and small-cap category (i.e. Multi-Cap)]HDFC Focused 30 Fund
Company Industry+ / Rating % to NAV
EqUITY & EqUITY RElATED
• ICICI Bank Ltd. Banks 7.68
• Larsen and Toubro Ltd. Construction Project 7.10
• HDFC Bank Ltd. Banks 6.91
• Reliance Industries Ltd. Petroleum Products 6.54
• Infosys Ltd. Software 6.44
• State Bank of India Banks 5.81
• ITC Ltd. Consumer Non Durables 4.44
• Bharti Airtel Ltd. Telecom - Services 3.98
• NTPC Ltd. Power 3.86
• Axis Bank Ltd. Banks 3.76
Bharat Petroleum Corporation Ltd. Petroleum Products 3.63
Lupin Ltd. Pharmaceuticals 3.19
Bharat electronics Ltd. Industrial Capital Goods 3.09
Power Grid Corporation of India Ltd. Power 2.62
Hindustan Petroleum Corporation Ltd. Petroleum Products 2.52
Burger King India Ltd. Consumer Non Durables 2.37
Tata Steel Ltd. Ferrous Metals 2.29
Garden Reach Shipbuilders & engineers Ltd. Aerospace & Defence 2.27
ACC Ltd. Cement 2.13
Ambuja Cements Ltd. Cement 1.83
Kalpataru Power Transmission Ltd. Power 1.79
SBI Cards and Payment Services Ltd. Finance 1.79
GAIL (India) Ltd. Gas 1.77
Avenue Supermarts Ltd. Retailing 1.73
Vardhman Textiles Ltd. Textiles - Cotton 1.73
Company Industry+ / Rating % to NAV
Gujarat Pipavav Port Ltd. Transportation 1.72
CeSC Ltd. Power 1.52
Hindustan Aeronautics Ltd. Aerospace & Defence 1.48
Coal India Ltd. Minerals/Mining 1.10
Indigo Paints Ltd. Consumer Non Durables 1.01
Sub Total 98.10
Cash, Cash equivalents and Net Current Assets 1.90
Grand Total 100.00
• Top Ten Holdings
PORTFOLIO
Industry Allocation of Equity Holding (% of Net Assets)
1.10
1.721.73
1.731.771.792.293.093.19
3.753.963.98
6.447.107.82
9.7912.69
24.16
0 5 10 15 20 25
Minerals/Mining
TransportationRetailing
Textiles - Cotton
GasFinance
Ferrous Metals
Industrial Capital GoodsPharmaceuticals
Aerospace & Defence
CementTelecom - Services
SoftwareConstruction Project
Consumer Non DurablesPower
Petroleum ProductsBanks

16 January 2021
CATEgORY OF SCHEME: THEMATIC FUND
KEY FACTS
INVESTMENT OBjECTIVE
To seek long-term capital appreciation/income by investing predominantly in equity and equity related securities of companies engaged in or expected to benefit from the growth and development of infrastructure.There is no assurance that the investment objective of the Scheme will be realized.
FUND MANAgER ¥
Rakesh Vyas (since June 01, 2019)
Total experience: Over 15 years
INCEPTION DATE (Date of Allotment)
March 10, 2008
NAV (AS ON JANUARY 29, 2021) NAV PER UNIT (`)
Regular Plan - Growth Option 13.984Regular Plan - Dividend Option 8.347Direct Plan - Growth Option 14.914Direct Plan - Dividend Option 11.444
ASSETS UNDER MANAgEMENT (`) IN CRORE
As on January 31, 2021 492.13Average for Month of January 2021 514.17
qUANTITATIVE DATA
Portfolio Turnover Ratio (Last 1 year) 27.61%
Risk Ration Standard Deviation 9.629%n Beta 1.337n Sharpe Ratio* -0.113
Computed for the 3-yr period ended January 29, 2021. Based on month-end NAV. * Risk free rate: 3.47%(Source: FIMMDA MIBOR)
TOTAL ExPENSE RATIO (As on January 31, 2021)Including Additional expenses and Goods and Service Tax on Management Fees
Regular: 2.74% Direct: 1.94%
#BENCHMARK INDEX: NIFTY 500 (Total Returns Index)##ADDl. BENCHMARK INDEX: NIFTY 50 (Total Returns Index)
EXIT lOAD
l In respect of each purchase / switch-in of Units, an exit Load of 1.00% is payable if Units are redeemed / switched-out within 1 year from the date of allotment.
l No exit Load is payable if Units are redeemed / switched-out after 1 year from the date of allotment.
For further details, please refer to para ‘Exit Load’ on Pg 67.
PLANS & OPTIONS
Regular Plan, Direct Plan. Under each Plan : Growth & Dividend. The Dividend Option offers Dividend Payout and Reinvestment facility.
MINIMUM APPlICATION AMOUNT
Purchase : ` 5,000 and any amount thereafter.Additional Purchase : ` 1,000 and any amount thereafter.
¥ Dedicated Fund Manager for Overseas Investments: Mr. Sankalp Baid (since January 22, 2021) (Total experience: Over 13 years).
SIP PERFORMANCE ^ - Regular Plan - growth Option
Since Inception SIP
10 year SIP
5 year SIP
3 year SIP
1 year SIP
Total Amount Invested (` ‘000) 1,550.00 1,200.00 600.00 360.00 120.00 Mkt Value As on January 29, 2021 (` ‘000) 1,864.79 1,300.54 549.30 352.18 149.79 Returns (%) 2.80 1.59 -3.47 -1.42 49.45 Benchmark Returns (%) # 12.27 12.58 12.59 14.83 53.73 Additional Benchmark Returns (%) ## 12.02 12.33 13.49 15.30 51.56
Assuming ` 10,000 invested systematically on the first Business Day of every month over a period of time. CAGR returns are computed after accounting for the cash flow by using xIRR method (investment internal rate of return) for Regular Plan - Growth Option. The above investment simulation is for illustrative purposes only and should not be construed as a promise on minimum returns and safeguard of capital.
PERFORMANCE ^ - Regular Plan - growth Option
Date Period Scheme Returns
(%)
Benchmark Returns
(%)#
Additional Benchmark
Returns (%) ##
Value of ` 10,000 invested
Scheme (`) Benchmark (`)#
Additional Benchmark
(`)##
Jan 31, 20 Last 1 Year -7.95 15.82 15.22 9,208 11,578 11,518Jan 31, 18 Last 3 Years -14.32 6.49 8.70 6,293 12,073 12,841Jan 29, 16 Last 5 Years -0.28 13.61 13.94 9,861 18,938 19,214Mar 10, 08 Since Inception 2.63 9.81 9.73 13,984 33,439 33,115
Returns greater than 1 year period are compounded annualized (CAGR). Performance of dividend option under the schemes for the investors would be net of distribution tax, if any. For performance of other schemes managed by Rakesh Vyas, please refer page 67. Different plans viz. Regular Plan and Direct Plan have a different expense structure. The expenses of the Direct Plan under the Scheme will be lower to the extent of the distribution expenses / commission charged in the Regular Plan. For Performance of Direct Plan, refer page no. 79.
Face Value per Unit: ` 10 unless otherwise specified, + Industry Classification as recommended by AMFI, Data is as of January 31, 2021 unless otherwise specified.
This product is suitable for investors who are seeking ~
l to generate long-term capital appreciation / income
l investment predominantly in equity and equity related securities of companies engaged in or expected to benefit from the growth and development of infrastructure
VeryHigh
Low to
Moderate
Low
Moderate ModeratelyHigh High
RISKOMETERInvestors understand that their principal will be at
very high risk
~ Investors should consult their financial advisers, if in doubt about whether the product is suitable for them. ^Past performance may or may not be sustained in the future. Load is not taken into consideration for computation of performance.
(An open ended equity scheme following infrastructure theme)HDFC Infrastructure Fund
Company Industry+ % to NAV
EqUITY & EqUITY RElATED
• Larsen and Toubro Ltd. Construction Project 8.64
• ICICI Bank Ltd. Banks 8.51
• State Bank of India Banks 8.21
• Coal India Ltd. Minerals/Mining 5.28
• NTPC Ltd. Power 5.17
• J.Kumar Infraprojects Ltd. Construction 4.80
• Centum Electronics Ltd. Industrial Capital Goods 3.97
• CESC Ltd. Power 3.93
• JMC Projects (India) Ltd. Construction 3.75
• Dilip Buildcon Ltd. Construction Project 3.30
Computer Age Management Services Finance 3.27
Gujarat Pipavav Port Ltd. Transportation 3.24
Bharti Airtel Ltd. Telecom - Services 2.92
Hindustan Construction Company Ltd. Construction Project 2.87
Power Finance Corporation Ltd. Finance 2.45
SBI Cards and Payment Services Ltd. Finance 2.38
Ashoka Buildcon Ltd. Construction Project 2.37
Axis Bank Ltd. Banks 2.29
Ambuja Cements Ltd. Cement 2.15
HDFC Bank Ltd. Banks 1.98
ReC Ltd. Finance 1.72
Burger King India Ltd. Consumer Non Durables 1.69
Dynamatic Technologies Ltd. Auto Ancillaries 1.56
Tata Steel Ltd. Ferrous Metals 1.53
Repco Home Finance Ltd. Finance 1.28
Reliance Industries Ltd. Petroleum Products 1.18
Indigo Paints Ltd. Consumer Non Durables 1.16
Hindalco Industries Ltd. Non - Ferrous Metals 1.13
Premier explosives Ltd. Chemicals 1.11
Birla Corporation Ltd. Cement 0.95
Bharat Petroleum Corporation Ltd. Petroleum Products 0.75
Company Industry+ % to NAV
MeP Infrastructure Developers Ltd. Transportation 0.53
Texmaco Rail & engineering Ltd. Industrial Capital Goods 0.47
Simplex Infrastructures Ltd. Construction 0.42
Sadbhav Infrastructure Project Ltd. (Corporate Guarantee of Sadbhav engineering Ltd.) Construction Project 0.36
Prestige estates Projects Ltd. Construction 0.27
CG Power and Industrial Solutions Ltd. Industrial Capital Goods 0.01
Sub Total 97.60
Cash, Cash equivalents and Net Current Assets 2.40
Grand Total 100.00
• Top Ten Holdings
PORTFOLIO
Industry Allocation of Equity Holding (% of Net Assets)
1.11
1.13
1.53
1.56
1.93
2.85
2.92
3.10
3.77
4.45
5.28
9.10
9.24
11.10
17.54
20.99
0 5 10 15 20 25
Chemicals
Non - Ferrous Metals
Ferrous Metals
Auto Ancillaries
Petroleum Products
Consumer Non Durables
Telecom - Services
Cement
Transportation
Industrial Capital Goods
Minerals/Mining
Power
Construction
Finance
Construction Project
Banks
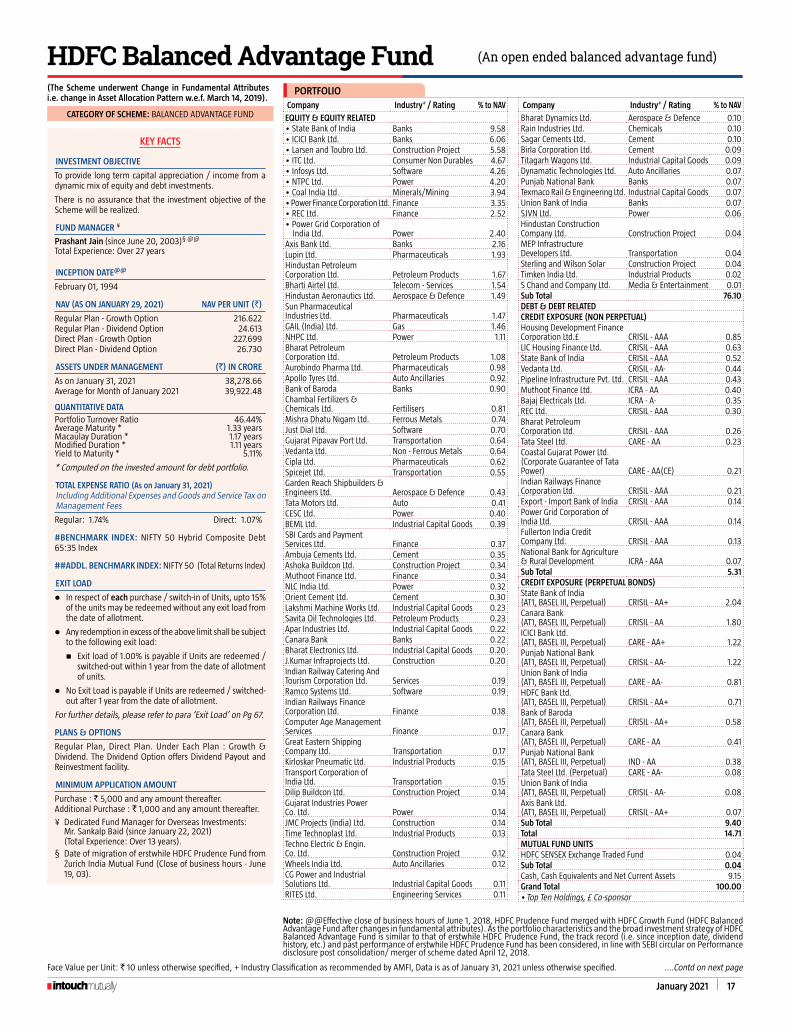
January 2021 17
Face Value per Unit: ` 10 unless otherwise specified, + Industry Classification as recommended by AMFI, Data is as of January 31, 2021 unless otherwise specified. ....Contd on next page
Note: @@Effective close of business hours of June 1, 2018, HDFC Prudence Fund merged with HDFC Growth Fund (HDFC Balanced Advantage Fund after changes in fundamental attributes). As the portfolio characteristics and the broad investment strategy of HDFC Balanced Advantage Fund is similar to that of erstwhile HDFC Prudence Fund, the track record (i.e. since inception date, dividend history, etc.) and past performance of erstwhile HDFC Prudence Fund has been considered, in line with SEBI circular on Performance disclosure post consolidation/ merger of scheme dated April 12, 2018.
(An open ended balanced advantage fund)HDFC Balanced Advantage Fund Company Industry+ / Rating % to NAV
EqUITY & EqUITY RElATED• State Bank of India Banks 9.58• ICICI Bank Ltd. Banks 6.06• Larsen and Toubro Ltd. Construction Project 5.58• ITC Ltd. Consumer Non Durables 4.67• Infosys Ltd. Software 4.26• NTPC Ltd. Power 4.20• Coal India Ltd. Minerals/Mining 3.94• Power Finance Corporation Ltd. Finance 3.35• REC Ltd. Finance 2.52• Power Grid Corporation of
India Ltd. Power 2.40Axis Bank Ltd. Banks 2.16Lupin Ltd. Pharmaceuticals 1.93Hindustan Petroleum Corporation Ltd. Petroleum Products 1.67Bharti Airtel Ltd. Telecom - Services 1.54Hindustan Aeronautics Ltd. Aerospace & Defence 1.49Sun Pharmaceutical Industries Ltd. Pharmaceuticals 1.47GAIL (India) Ltd. Gas 1.46NHPC Ltd. Power 1.11Bharat Petroleum Corporation Ltd. Petroleum Products 1.08Aurobindo Pharma Ltd. Pharmaceuticals 0.98Apollo Tyres Ltd. Auto Ancillaries 0.92Bank of Baroda Banks 0.90Chambal Fertilizers & Chemicals Ltd. Fertilisers 0.81Mishra Dhatu Nigam Ltd. Ferrous Metals 0.74Just Dial Ltd. Software 0.70Gujarat Pipavav Port Ltd. Transportation 0.64Vedanta Ltd. Non - Ferrous Metals 0.64Cipla Ltd. Pharmaceuticals 0.62Spicejet Ltd. Transportation 0.55Garden Reach Shipbuilders & engineers Ltd. Aerospace & Defence 0.43Tata Motors Ltd. Auto 0.41CeSC Ltd. Power 0.40BeML Ltd. Industrial Capital Goods 0.39SBI Cards and Payment Services Ltd. Finance 0.37Ambuja Cements Ltd. Cement 0.35Ashoka Buildcon Ltd. Construction Project 0.34Muthoot Finance Ltd. Finance 0.34NLC India Ltd. Power 0.32Orient Cement Ltd. Cement 0.30Lakshmi Machine Works Ltd. Industrial Capital Goods 0.23Savita Oil Technologies Ltd. Petroleum Products 0.23Apar Industries Ltd. Industrial Capital Goods 0.22Canara Bank Banks 0.22Bharat electronics Ltd. Industrial Capital Goods 0.20J.Kumar Infraprojects Ltd. Construction 0.20Indian Railway Catering And Tourism Corporation Ltd. Services 0.19Ramco Systems Ltd. Software 0.19Indian Railways Finance Corporation Ltd. Finance 0.18Computer Age Management Services Finance 0.17Great eastern Shipping Company Ltd. Transportation 0.17Kirloskar Pneumatic Ltd. Industrial Products 0.15Transport Corporation of India Ltd. Transportation 0.15Dilip Buildcon Ltd. Construction Project 0.14Gujarat Industries Power Co. Ltd. Power 0.14JMC Projects (India) Ltd. Construction 0.14Time Technoplast Ltd. Industrial Products 0.13Techno electric & engin. Co. Ltd. Construction Project 0.12Wheels India Ltd. Auto Ancillaries 0.12CG Power and Industrial Solutions Ltd. Industrial Capital Goods 0.11RITeS Ltd. engineering Services 0.11
Company Industry+ / Rating % to NAV
Bharat Dynamics Ltd. Aerospace & Defence 0.10Rain Industries Ltd. Chemicals 0.10Sagar Cements Ltd. Cement 0.10Birla Corporation Ltd. Cement 0.09Titagarh Wagons Ltd. Industrial Capital Goods 0.09Dynamatic Technologies Ltd. Auto Ancillaries 0.07Punjab National Bank Banks 0.07Texmaco Rail & engineering Ltd. Industrial Capital Goods 0.07Union Bank of India Banks 0.07SJVN Ltd. Power 0.06Hindustan Construction Company Ltd. Construction Project 0.04MeP Infrastructure Developers Ltd. Transportation 0.04Sterling and Wilson Solar Construction Project 0.04Timken India Ltd. Industrial Products 0.02S Chand and Company Ltd. Media & entertainment 0.01Sub Total 76.10DEBT & DEBT RElATEDCREDIT EXPOSURE (NON PERPETUAl)Housing Development Finance Corporation Ltd.£ CRISIL - AAA 0.85LIC Housing Finance Ltd. CRISIL - AAA 0.63State Bank of India CRISIL - AAA 0.52Vedanta Ltd. CRISIL - AA- 0.44Pipeline Infrastructure Pvt. Ltd. CRISIL - AAA 0.43Muthoot Finance Ltd. ICRA - AA 0.40Bajaj electricals Ltd. ICRA - A- 0.35ReC Ltd. CRISIL - AAA 0.30Bharat Petroleum Corporation Ltd. CRISIL - AAA 0.26Tata Steel Ltd. CARe - AA 0.23Coastal Gujarat Power Ltd. (Corporate Guarantee of Tata Power) CARe - AA(Ce) 0.21Indian Railways Finance Corporation Ltd. CRISIL - AAA 0.21export - Import Bank of India CRISIL - AAA 0.14Power Grid Corporation of India Ltd. CRISIL - AAA 0.14Fullerton India Credit Company Ltd. CRISIL - AAA 0.13National Bank for Agriculture & Rural Development ICRA - AAA 0.07Sub Total 5.31CREDIT EXPOSURE (PERPETUAl BONDS)State Bank of India (AT1, BASeL III, Perpetual) CRISIL - AA+ 2.04Canara Bank (AT1, BASeL III, Perpetual) CRISIL - AA 1.80ICICI Bank Ltd. (AT1, BASeL III, Perpetual) CARE - AA+ 1.22Punjab National Bank (AT1, BASeL III, Perpetual) CRISIL - AA- 1.22Union Bank of India (AT1, BASeL III, Perpetual) CARe - AA- 0.81HDFC Bank Ltd. (AT1, BASeL III, Perpetual) CRISIL - AA+ 0.71Bank of Baroda (AT1, BASeL III, Perpetual) CRISIL - AA+ 0.58Canara Bank (AT1, BASeL III, Perpetual) CARe - AA 0.41Punjab National Bank (AT1, BASeL III, Perpetual) IND - AA 0.38Tata Steel Ltd. (Perpetual) CARe - AA- 0.08Union Bank of India (AT1, BASeL III, Perpetual) CRISIL - AA- 0.08Axis Bank Ltd. (AT1, BASeL III, Perpetual) CRISIL - AA+ 0.07Sub Total 9.40Total 14.71MUTUAl FUND UNITSHDFC SeNSex Exchange Traded Fund 0.04Sub Total 0.04Cash, Cash equivalents and Net Current Assets 9.15Grand Total 100.00• Top Ten Holdings, £ Co-sponsor
PORTFOLIO
KEY FACTS
INVESTMENT OBjECTIVE
To provide long term capital appreciation / income from a dynamic mix of equity and debt investments.
There is no assurance that the investment objective of the Scheme will be realized.
FUND MANAgER ¥
Prashant Jain (since June 20, 2003)§ @@
Total experience: Over 27 years
INCEPTION DATE@@
February 01, 1994
NAV (AS ON JANUARY 29, 2021) NAV PER UNIT (`)
Regular Plan - Growth Option 216.622Regular Plan - Dividend Option 24.613Direct Plan - Growth Option 227.699Direct Plan - Dividend Option 26.730
ASSETS UNDER MANAgEMENT (`) IN CRORE
As on January 31, 2021 38,278.66Average for Month of January 2021 39,922.48
qUANTITATIVE DATAPortfolio Turnover Ratio 46.44%Average Maturity * 1.33 yearsMacaulay Duration * 1.17 yearsModified Duration * 1.11 yearsYield to Maturity * 5.11%
* Computed on the invested amount for debt portfolio.
TOTAL ExPENSE RATIO (As on January 31, 2021)Including Additional expenses and Goods and Service Tax on Management Fees
Regular: 1.74% Direct: 1.07%
#BENCHMARK INDEX: NIFTY 50 Hybrid Composite Debt 65:35 Index
##ADDl. BENCHMARK INDEX: NIFTY 50 (Total Returns Index)
EXIT lOAD
l In respect of each purchase / switch-in of Units, upto 15% of the units may be redeemed without any exit load from the date of allotment.
l Any redemption in excess of the above limit shall be subject to the following exit load:
n exit load of 1.00% is payable if Units are redeemed / switched-out within 1 year from the date of allotment of units.
l No exit Load is payable if Units are redeemed / switched-out after 1 year from the date of allotment.
For further details, please refer to para ‘Exit Load’ on Pg 67.
PLANS & OPTIONS
Regular Plan, Direct Plan. Under each Plan : Growth & Dividend. The Dividend Option offers Dividend Payout and Reinvestment facility.
MINIMUM APPlICATION AMOUNT
Purchase : ` 5,000 and any amount thereafter.Additional Purchase : ` 1,000 and any amount thereafter.
¥ Dedicated Fund Manager for Overseas Investments: Mr. Sankalp Baid (since January 22, 2021) (Total experience: Over 13 years).§ Date of migration of erstwhile HDFC Prudence Fund from
Zurich India Mutual Fund (Close of business hours - June 19, 03).
(The Scheme underwent Change in Fundamental Attributes i.e. change in Asset Allocation Pattern w.e.f. March 14, 2019).
CATEgORY OF SCHEME: BALANCED ADVANTAGE FUND

18 January 2021
This product is suitable for investors who are seeking ~
l to generate long-term capital appreciation / income
l investments in a mix of equity and debt instruments
VeryHigh
Low to
Moderate
Low
Moderate ModeratelyHigh High
RISKOMETERInvestors understand that their principal will be at
very high risk
~ Investors should consult their financial advisers, if in doubt about whether the product is suitable for them.
SIP PERFORMANCE ^ - Regular Plan - growth OptionSince Inception
SIP15 year
SIP10 year
SIP5 year
SIP3 year
SIP1 year
SIPTotal Amount Invested (` ‘000) 3,240.00 1,800.00 1,200.00 600.00 360.00 120.00 Mkt Value As on January 29, 2021 (` ‘000) $$ 65,082.70 4,915.83 2,126.74 746.14 418.59 146.19 Returns (%) $$ 18.17 12.38 11.02 8.66 10.06 43.15 Benchmark Returns (%) # N.A. 11.03 11.65 12.71 14.61 35.97 Additional Benchmark Returns (%) ## 13.11 11.51 12.33 13.49 15.30 51.56
Assuming ` 10,000 invested systematically on the first Business Day of every month over a period of time. CAGR returns are computed after accounting for the cash flow by using xIRR method (investment internal rate of return) for Regular Plan - Growth Option. The above investment simulation is for illustrative purposes only and should not be construed as a promise on minimum returns and safeguard of capital.
PERFORMANCE ^ - Regular Plan - growth OptionDate Period Scheme
Returns (%) $$
Benchmark Returns
(%)#
Additional Benchmark
Returns (%) ##
Value of ` 10,000 invested
Scheme (`) $$
Benchmark (`)#
Additional Benchmark
(`)##Jan 31, 20 Last 1 Year 8.71 16.00 15.22 10,869 11,596 11,518Jan 31, 18 Last 3 Years 3.12 9.84 8.70 10,963 13,247 12,841Jan 29, 16 Last 5 Years 10.85 12.75 13.94 16,750 18,232 19,214Feb 01, 94 Since Inception 17.62 N.A. 10.51 801,710 N.A. 148,695
Returns greater than 1 year period are compounded annualized (CAGR). Performance of dividend option under the schemes for the investors would be net of distribution tax, if any. N.A. Not Available. Scheme performance may not strictly be comparable with that of its Additional Benchmark in view of balanced nature of the scheme where a portion of scheme’s investments are made in debt instruments. $$ All dividends declared prior to the splitting of the Scheme into Dividend & Growth Options are assumed to be reinvested in the units of the Scheme at the then prevailing NAV (ex-dividend NAV). For performance of other schemes managed by Prashant Jain, please refer page 67. Different plans viz. Regular Plan and Direct Plan have a different expense structure. The expenses of the Direct Plan under the Scheme will be lower to the extent of the distribution expenses / commission charged in the Regular Plan. As NIFTY 50 TRI data is not available since inception of the scheme, additional benchmark performance is calculated using composite CAGR of NIFTY 50 PRI values from February 1, 1994 to June 29, 1999 and TRI values since June 30, 1999. For Performance of Direct Plan, refer page no. 73. For FPI Portfolio, refer page no. 81.
^Past performance may or may not be sustained in the future. Load is not taken into consideration for computation of performance.
Portfolio Classification By Asset Class (%)
n equity 76.10
n Credit exposure 14.71
n Mutual Fund Units 0.04
n Cash, Cash equivalents and Net Current Assets 9.15
Portfolio Classification By Rating Class (%)
n equity 76.10n AAA/AAA(SO)/A1+/A1+(SO) &
equivalent 3.68n AA+ 4.62n AA/AA- 6.06n A+ & Below 0.35n Mutual Fund Units 0.04n Cash, Cash equivalents and Net
Current Assets 9.15
(An open ended balanced advantage fund)HDFC Balanced Advantage Fund .....Contd from previous page
Industry Allocation of Equity Holding (% of Net Assets)
0.010.100.110.190.300.340.410.640.740.810.841.111.311.461.541.552.02
2.983.944.675.005.15
6.266.93
8.6319.06
0 5 10 15 20Media & Entertainment
ChemicalsEngineering Services
ServicesIndustrial Products
ConstructionAuto
Non - Ferrous MetalsFerrous Metals
FertilisersCement
Auto AncillariesIndustrial Capital Goods
GasTelecom - Services
TransportationAerospace & Defence
Petroleum ProductsMinerals/Mining
Consumer Non DurablesPharmaceuticals
SoftwareConstruction Project
FinancePowerBanks

January 2021 19
Company Industry+ / Rating % to NAV
EqUITY & EqUITY RElATED
• ICICI Bank Ltd. Banks 8.56
• Housing Development Finance Corporation Ltd.£ Finance 7.03
• HDFC Bank Ltd. Banks 6.69
• Infosys Ltd. Software 5.00
• Larsen and Toubro Ltd. Construction Project 4.44
• Reliance Industries Ltd. Petroleum Products 4.21
• Aurobindo Pharma Ltd. Pharmaceuticals 3.49
• ITC Ltd. Consumer Non Durables 3.27
• Axis Bank Ltd. Banks 2.99
State Bank of India Banks 2.65
Bharat electronics Ltd. Industrial Capital Goods 2.59
Tata Steel Ltd. Ferrous Metals 2.01
Bharti Airtel Ltd. Telecom - Services 2.00
Atul Ltd. Chemicals 1.80
Power Grid Corporation of India Ltd. Power 1.73
KeC International Ltd. Construction Project 1.72
UPL Ltd. Pesticides 1.62
SKF India Ltd. Industrial Products 1.05
Indusind Bank Ltd. Banks 1.03
Vedanta Ltd. Non - Ferrous Metals 1.02
Hindustan Petroleum Corporation Ltd. Petroleum Products 0.99
Bharat Petroleum Corporation Ltd. Petroleum Products 0.87
PNC Infratech Ltd. Construction 0.84
Mahindra Holidays & Resorts Ind Ltd.
Hotels/Resorts & Other Recreational Activities 0.79
Bank of Baroda Banks 0.74
Redington (India) Ltd. Transportation 0.66
Vardhman Textiles Ltd. Textiles - Cotton 0.47
Persistent Systems Ltd. Software 0.43
Sharda Cropchem Ltd. Pesticides 0.39
Zensar Technologies Ltd. Software 0.36
Tamilnadu Newsprint & Papers Ltd. Paper 0.35
Carborundum Universal Ltd. Industrial Products 0.34
Kalpataru Power Transmission Ltd. Power 0.29
Cholamandalam Financial Holdings Ltd. Finance 0.18
MM Forgings Ltd. Industrial Products 0.18
Sadbhav engineering Ltd. Construction Project 0.18
Navneet education Ltd. Media & entertainment 0.15
Jagran Prakashan Ltd. Media & entertainment 0.12
Sub Total 73.23
Company Industry+ / Rating % to NAV
DEBT & DEBT RElATED
gOVERNMENT SECURITIES (CENTRAl/STATE)
7.16 GOI 2023 Sovereign 1.78
6.84 GOI 2022 Sovereign 1.17
8.2 GOI 2025 Sovereign 1.17
7.35 GOI 2024 Sovereign 0.97
8.24 GOI 2033 Sovereign 0.67
8.4 GOI 2024 Sovereign 0.33
8.6 GOI 2028 Sovereign 0.28
8.13 GOI 2045 Sovereign 0.14
8.2 GOI 2022 Sovereign 0.02
8.83 GOI 2023 Sovereign 0.02
SUB TOTAL 6.55
CREDIT EXPOSURE (NON PERPETUAl)
• Tata Sons Ltd. CRISIL - AAA 3.43
LIC Housing Finance Ltd. CARe - AAA / CRISIL - AAA 1.79
Coastal Gujarat Power Ltd. (Corporate Guarantee of Tata Power) CARe - AA(Ce) 1.55
Shriram Transport Finance Company Ltd. CRISIL - AA+ / IND - AA+ 1.26
Power Finance Corporation Ltd. CRISIL - AAA / ICRA - AAA 1.25
ReC Ltd. CARe - AAA / CRISIL - AAA / IND - AAA 0.84
Shriram City Union Finance Ltd. CRISIL - AA 0.60
Bajaj electricals Ltd. ICRA - A- 0.56
Muthoot Finance Ltd. CRISIL - AA / ICRA - AA 0.43
National Bank for Agriculture & Rural Development CRISIL - AAA 0.42
HDFC Bank Ltd. CRISIL - AAA 0.33
Punjab National Bank ICRA - AA 0.18
ICICI Bank Ltd. CARe - AAA 0.16
Kalpataru Power Transmission Ltd. CRISIL - AA 0.16
Hindalco Industries Ltd. CRISIL - AA 0.06
Sub Total 13.02
CREDIT EXPOSURE (PERPETUAl BONDS)
Axis Bank Ltd. (AT1, BASeL III, Perpetual) CRISIL - AA+ 2.18
Punjab National Bank (AT1, BASeL III, Perpetual) CRISIL - AA- 0.62
State Bank of India (AT1, BASeL III, Perpetual) CRISIL - AA+ 0.31
Canara Bank (AT1, BASeL III, Perpetual) CARe - AA 0.18
Union Bank of India (AT1, BASeL III, Perpetual) CRISIL - AA- 0.12
Sub Total 3.41
Total 22.98
MUTUAl FUND UNITS
HDFC NIFTY 50 Exchange Traded Fund 1.12
Sub Total 1.12
Cash, Cash equivalents and Net Current Assets 2.67
gRAND TOTAl 100.00
l Top Ten Holdings, £ Co-sponsor
CATEgORY OF SCHEME: AGGRESSIVE HYBRID FUND
Face Value per Unit: ` 10 unless otherwise specified, + Industry Classification as recommended by AMFI, Data is as of January 31, 2021 unless otherwise specified.
Note: @@ Effective close of business hours of June 1, 2018, HDFC Balanced Fund merged with HDFC Premier Multi Cap Fund (HDFC Hybrid Equity Fund after changes in fundamental attributes). As the portfolio characteristics and the broad investment strategy of HDFC Hybrid Equity Fund is similar to that of erstwhile HDFC Balanced Fund, the track record (i.e. since inception date dividend history, etc) and past performance of erstwhile HDFC Balanced Fund has been considered, in line with SEBI circular on Performance disclosure post consolidation/ merger of scheme dated April 12, 2018.
(An open ended hybrid scheme investing predominantly in equity and equity related instruments)HDFC Hybrid Equity Fund
PORTFOLIO
KEY FACTS
INVESTMENT OBjECTIVE
The investment objective of the Scheme is to generate capital appreciation / income from a portfolio, predominantly of equity & equity related instruments. The Scheme will also invest in debt and money market instruments.
There is no assurance that the investment objective of the Scheme will be realized.
FUND MANAgER ¥
Chirag Setalvad (since April 2, 2007)@@
Total experience: Over 21 years
INCEPTION DATE@@
September 11, 2000
NAV (AS ON JANUARY 29, 2021) NAV PER UNIT (`)
Regular Plan - Growth Option 62.420Regular Plan - Dividend Option 11.987Direct Plan - Growth Option 65.752Direct Plan - Dividend Option 12.963
ASSETS UNDER MANAgEMENT (`) IN CRORE
As on January 31, 2021 16,617.32Average for Month of January 2021 17,363.11
qUANTITATIVE DATA
Portfolio Turnover Ratio (Last 1 year) 7.24%Average Maturity * 2.42 yearsMacaulay Duration * 2.00 yearsModified Duration * 1.92 yearsYield to Maturity * 5.50%
* Computed on the invested amount for debt portfolio.
TOTAL ExPENSE RATIO (As on January 31, 2021)Including Additional expenses and Goods and Service Tax on Management Fees
Regular: 1.77% Direct: 1.17%
#BENCHMARK INDEX: NIFTY 50 Hybrid Composite Debt 65:35 Index
##ADDl. BENCHMARK INDEX: NIFTY 50 (Total Returns Index)
EXIT lOAD
l In respect of each purchase/switch-in of Units, upto 15% of the units may be redeemed without any exit load from the date of allotment.
l Any redemption in excess of the above limit shall be subject to the following exit load:
n exit load of 1.00% is payable if Units are redeemed / switched-out within 1 year from the date of allotment of units.
l No exit Load is payable if Units are redeemed / switched-out after 1 year from the date of allotment.
For further details, please refer to para ‘Exit Load’ on Pg 67.
PLANS & OPTIONS
Regular Plan, Direct Plan. Under each Plan : Growth & Dividend. The Dividend Option offers Dividend Payout and Reinvestment facility.
MINIMUM APPlICATION AMOUNT
Purchase : ` 5,000 and any amount thereafter.Additional Purchase : ` 1,000 and any amount thereafter.
SEgMENT-WISE BREAK-UP OF EqUITY HOlDINgS (% OF NET ASSETS)
Large Cap 59.59%Mid Cap 5.56%Small Cap 8.08%
¥ Dedicated Fund Manager for Overseas Investments: Mr. Sankalp Baid (since January 22, 2021) (Total experience: Over 13 years).

20 January 2021
SIP PERFORMANCE ^ - Regular Plan - growth Option
Since Inception SIP
15 year SIP
10 year SIP
5 year SIP
3 year SIP
1 year SIP
Total Amount Invested (` ‘000) 2,450.00 1,800.00 1,200.00 600.00 360.00 120.00 Mkt Value As on January 29, 2021 (` ‘000) 14,725.86 5,449.74 2,322.62 776.05 431.84 146.19 Returns (%) 15.33 13.58 12.68 10.24 12.20 43.16 Benchmark Returns (%) # N.A. 11.03 11.65 12.71 14.61 35.97 Additional Benchmark Returns (%) ## 14.32 11.51 12.33 13.49 15.30 51.56
Assuming ` 10,000 invested systematically on the first Business Day of every month over a period of time. CAGR returns are computed after accounting for the cash flow by using xIRR method (investment internal rate of return) for Regular Plan - Growth Option. The above investment simulation is for illustrative purposes only and should not be construed as a promise on minimum returns and safeguard of capital.
PERFORMANCE ^ - Regular Plan - growth Option
Date Period Scheme Returns
(%)
Benchmark Returns
(%)#
Additional Benchmark
Returns (%) ##
Value of ` 10,000 invested
Scheme (`) Benchmark (`)#
Additional Benchmark
(`)##
Jan 31, 20 Last 1 Year 13.03 16.00 15.22 11,299 11,596 11,518Jan 31, 18 Last 3 Years 5.30 9.84 8.70 11,674 13,247 12,841Jan 29, 16 Last 5 Years 11.60 12.75 13.94 17,321 18,232 19,214Sep 11, 00 Since Inception 15.18 N.A. 13.14 178,751 N.A. 123,982
Returns greater than 1 year period are compounded annualized (CAGR). Performance of dividend option under the schemes for the investors would be net of distribution tax, if any. N.A. Not Available. Scheme performance may not strictly be comparable with that of its Additional Benchmark in view of hybrid nature of the scheme where a portion of scheme’s investments are made in debt instruments. For performance of other schemes managed by Chirag Setalvad, please refer page 67. Different plans viz. Regular Plan and Direct Plan have a different expense structure. The expenses of the Direct Plan under the Scheme will be lower to the extent of the distribution expenses / commission charged in the Regular Plan. For Performance of Direct Plan, refer page no. 73.
^Past performance may or may not be sustained in the future. Load is not taken into consideration for computation of performance.
Face Value per Unit: ` 10 unless otherwise specified, + Industry Classification as recommended by AMFI, Data is as of January 31, 2021 unless otherwise specified.
This product is suitable for investors who are seeking ~
l to generate long-term capital appreciation / income.
l investments predominantly in equity & equity related instruments. The Scheme will also invest in debt and money market instruments.
VeryHigh
Low to
Moderate
Low
Moderate ModeratelyHigh High
RISKOMETERInvestors understand that their principal will be at
very high risk
~ Investors should consult their financial advisers, if in doubt about whether the product is suitable for them.
PORTFOlIO ClASSIFICATION BY ASSET ClASS (%)
n equity 73.23
n G-Sec 6.55
n Credit exposure 16.43
n Mutual Fund Units 1.12
n Cash, Cash equivalents and Net Current Assets 2.67
PORTFOlIO ClASSIFICATION BY RATINg ClASS (%)
n equity 73.23n Sovereign 6.55n AAA/AAA(SO)/A1+/A1+(SO) &
equivalent 8.22n AA+ 3.75n AA/AA- 3.90n A+ & Below 0.56n Mutual Fund Units 1.12n Cash, Cash equivalents and Net
Current Assets 2.67
(An open ended hybrid scheme investing predominantly in equity and equity related instruments)HDFC Hybrid Equity Fund .....Contd from previous page
Industry Allocation of Equity Holding (% of Net Assets)
0.270.350.470.660.790.841.021.571.802.002.012.012.022.593.273.49
5.796.076.347.21
22.66
0 5 10 15 20 25Media & Entertainment
PaperTextiles - Cotton
TransportationHotels, Resorts & Other Recreational Activities
ConstructionNon - Ferrous Metals
Industrial ProductsChemicals
Telecom - ServicesFerrous Metals
PesticidesPower
Industrial Capital GoodsConsumer Non Durables
PharmaceuticalsSoftware
Petroleum ProductsConstruction Project
FinanceBanks

January 2021 21
SIP PERFORMANCE ^ - Regular Plan - growth Option
Since Inception SIP
15 year SIP
10 year SIP
5 Year SIP
3 Year SIP
1 Year SIP
Total Amount Invested (` ‘000) 1,860.00 1,800.00 1,200.00 600.00 360.00 120.00 Mkt Value As on January 29, 2021 (` ‘000) 4,113.74 3,881.03 1,969.30 779.02 442.80 141.77 Returns (%) 9.56 9.59 9.57 10.39 13.94 35.57 Benchmark Returns (%) # N.A. N.A. 11.57 13.13 15.30 32.76 Additional Benchmark Returns (%) ## 11.67 11.51 12.33 13.49 15.30 51.56
Assuming ` 10,000 invested systematically on the first Business Day of every month over a period of time. CAGR returns are computed after accounting for the cash flow by using xIRR method (investment internal rate of return) for Regular Plan - Growth Option. The above investment simulation is for illustrative purposes only and should not be construed as a promise on minimum returns and safeguard of capital.
PERFORMANCE ^ - Regular Plan - growth Option
Date Period Scheme Returns
(%)
Benchmark Returns
(%)#
Additional Benchmark
Returns (%) ##
Value of ` 10,000 invested
Scheme (`) Benchmark (`)#
Additional Benchmark
(`)##
Jan 31, 20 Last 1 Year 15.85 16.72 15.22 11,580 11,667 11,518Jan 31, 18 Last 3 Years 8.07 10.76 8.70 12,618 13,584 12,841Jan 29, 16 Last 5 Years 9.21 12.92 13.94 15,540 18,370 19,214Aug 17, 05 Since Inception 9.30 N.A. 13.26 39,537 N.A. 68,538
Returns greater than 1 year period are compounded annualized (CAGR). Performance of dividend option under the schemes for the investors would be net of distribution tax, if any. N.A. Not Available. The Scheme formerly, a debt oriented hybrid fund, has undergone change in Fundamental attributes w.e.f. May 23, 2018 and become a multi asset fund investing in equities, debt and gold related instruments. Accordingly, the Scheme’s benchmark has also changed. Hence, the performance of the Scheme from inception till May 22, 2018 may not strictly be comparable with those of the new benchmark and the additional benchmark. Scheme performance may not strictly be comparable with that of its Additional Benchmark in view of hybrid nature of the scheme where a portion of scheme’s investments are made in debt instruments and gold related instruments. For performance of other schemes managed by Amit B. Ganatra (Equities), Anil Bamboli (Debt), Krishan Kumar Daga (Gold and Arbitrage) and Arun Agarwal (Arbitrage) please refer page 67. Different plans viz. Regular Plan and Direct Plan have a different expense structure. The expenses of the Direct Plan under the Scheme will be lower to the extent of the distribution expenses / commission charged in the Regular Plan. For Performance of Direct Plan, refer page no. 79.
Face Value per Unit: ` 10 unless otherwise specified, + Industry Classification as recommended by AMFI, Data is as of January 31, 2021 unless otherwise specified.
This product is suitable for investors who are seeking ~
l to generate long-term capital appreciation/incomel investments in a diversified portfolio of equity & equity
related instruments, debt & money market instruments and Gold related instruments
VeryHigh
Low to
Moderate
Low
Moderate ModeratelyHigh High
RISKOMETERInvestors understand that their principal will be at
very high risk
~ Investors should consult their financial advisers, if in doubt about whether the product is suitable for them.
^Past performance may or may not be sustained in the future. Load is not taken into consideration for computation of performance.
(An open ended scheme investing in equity and equity related instruments, debt & money market instruments and gold related instruments)HDFC Multi-Asset Fund
Industry Allocation of Equity Holding (% of Net Assets)
0.21
0.51
0.71
0.85
0.91
0.97
1.13
1.63
1.71
2.01
2.27
2.72
5.45
6.33
9.68
10.34
16.38
0 2 4 6 8 10 12 14 16 18Pesticides
Industrial Products
Ferrous Metals
Healthcare Services
Chemicals
Industrial Capital Goods
Consumer Durables
Auto
Power
Auto Ancillaries
Pharmaceuticals
Telecom - Services
Petroleum Products
Finance
Software
Consumer Non Durables
Banks
KEY FACTS
INVESTMENT OBjECTIVEThe objective of the Scheme is to generate long term capital appreciation/income by investing in a diversified portfolio of equity & equity related instruments, debt & money market instruments and Gold related instruments.There is no assurance that the investment objective of the Scheme will be realized.
FUND MANAgER ¥
Amit B. Ganatra (equities) (since June 12, 2020)
Total experience - Over 17 years; Anil Bamboli (Debt) (since August 17, 2005)
Total experience: Over 23 years &Krishan Kumar Daga (Gold and Arbitrage) (since May 23, 2018)Total experience: Over 22 yearsArun Agarwal (Arbitrage) (since August 24, 2020)
Total experience: Over 22 years
INCEPTION DATE (Date of Allotment)August 17, 2005
NAV (AS ON JANUARY 29, 2021) NAV PER UNIT (`)Regular Plan - Growth Option 39.537Regular Plan - Dividend Option 14.096Direct Plan - Growth Option 41.663Direct Plan - Dividend Option 15.578
ASSETS UNDER MANAgEMENT (`) IN CROREAs on January 31, 2021 511.63Average for Month of January 2021 498.89
qUANTITATIVE DATAPortfolio Turnover Ratio 44.42%
TOTAL ExPENSE RATIO (As on January 31, 2021)Including Additional expenses and Goods and Service Tax on Management FeesRegular: 2.76% Direct: 1.41%
#BENCHMARK INDEX: 90% NIFTY 50 Hybrid Composite Debt 65:35 Index + 10% Domestic Price of Gold##ADDl. BENCHMARK INDEX: NIFTY 50 (Total Returns Index)
EXIT lOADl In respect of each purchase / switch-in of Units, 15% of the
units (“the limit”) may be redeemed without any exit Load from the date of allotment.
l Any redemption in excess of the above limit shall be subject to the following exit load:
t exit Load of 1.00% is payable if units are redeemed / switched out within 12 months from the date of allotment.
l No exit Load is payable if units are redeemed / switched out after 12 months from the date of allotment.
For further details, please refer to para ‘Exit Load’ on Pg 67.
PLANS & OPTIONSRegular Plan, Direct Plan. Under each Plan : Growth & Dividend. The Dividend Option offers Dividend Payout and Reinvestment facility.
MINIMUM APPlICATION AMOUNTPurchase : ` 5,000 and any amount thereafter.Additional Purchase : ` 1,000 and any amount thereafter.¥ Dedicated Fund Manager for Overseas Investments: Mr. Sankalp Baid (since January 22, 2021) (Total experience: Over 13 years).
(The Scheme underwent Change in Fundamental Attributes i.e. change in Asset Allocation Pattern w.e.f. March 14, 2019).
Portfolio Classification By Asset Class (%)
n equity 63.81
n Credit exposure 8.16
n Gold ETF 14.51
n Cash, Cash equivalents and Net Current Assets 13.52
Portfolio Classification By Rating Class (%)
n equity 63.81n AAA/AAA(SO)/A1+/A1+(SO) &
equivalent 3.29n AA/AA- 3.88n A+ & Below 0.99n Gold ETF 14.51n Cash, Cash equivalents and Net
Current Assets 13.52
Cash and Cash equivalents include overnight deployment of Cash in Tri-Party Repos
CATEgORY OF SCHEME: MULTI ASSET ALLOCATION FUND

22 January 2021
Company Industry+ / Rating % to NAV (Hedged & Unhedged)
% exposure of Derivative
EqUITY & EqUITY RElATED
• HDFC Bank Ltd. Banks 8.03 0.00
• ICICI Bank Ltd. Banks 6.34 0.00
• Infosys Ltd. Software 5.70 0.00
• Reliance Industries Ltd. Petroleum Products 4.76 0.00
• Housing Development Finance Corporation Ltd.£ Finance 3.32 0.00
• Bharti Airtel Ltd. Telecom - Services 2.72 0.00
• Hindustan Unilever Ltd. Consumer Non Durables 2.42 0.00
• Burger King India Ltd. Consumer Non Durables 2.25 0.00
Axis Bank Ltd. Banks 2.01 0.00
SBI Life Insurance Company Ltd. Finance 1.60 0.00
emami Ltd. Consumer Non Durables 1.51 0.00
ITC Ltd. Consumer Non Durables 1.48 0.00
HCL Technologies Ltd. Software 1.35 0.00
Cipla Ltd. Pharmaceuticals 1.31 0.00
Tata Consumer Products Ltd. Consumer Non Durables 1.25 0.00
Power Grid Corporation of India Ltd. Power 1.19 0.00
Godrej Consumer Products Ltd. Consumer Non Durables 1.12 0.00
Maruti Suzuki India Ltd. Auto 0.99 0.00
Dr Reddys Laboratories Ltd. Pharmaceuticals 0.96 0.00
Apollo Hospitals enterprise Ltd. Healthcare Services 0.85 0.00
Titan Company Ltd. Consumer Durables 0.83 0.00
Coforge Ltd. Software 0.80 0.00
Balkrishna Industries Ltd. Auto Ancillaries 0.76 0.00
Tata Steel Ltd. Ferrous Metals 0.71 0.00
Bharat Petroleum Corporation Ltd. Petroleum Products 0.69 0.00
endurance Technologies Ltd. Auto Ancillaries 0.69 0.00
Sonata Software Ltd. Software 0.65 0.00
Hero MotoCorp Ltd. Auto 0.64 0.00
Mindtree Consulting Ltd. Software 0.64 0.00
Bharat electronics Ltd. Industrial Capital Goods 0.62 0.00
UTI Asset Management Company Ltd. Finance 0.59 0.00
Aarti Industries Ltd. Chemicals 0.58 0.00
Company Industry+ / Rating % to NAV (Hedged & Unhedged)
% exposure of Derivative
Oracle Financial Ser Software Ltd. Software 0.54 0.00
NTPC Ltd. Power 0.52 0.00
Shaily engineering Plastics Ltd. Industrial Products 0.51 0.00
IIFL Wealth Management Ltd. Finance 0.48 0.00
Jamna Auto Industries Ltd. Auto Ancillaries 0.44 0.00
The Anup engineering Ltd. Industrial Capital Goods 0.35 0.00
Repco Home Finance Ltd. Finance 0.34 0.00
Rossari Biotech Ltd. Chemicals 0.33 0.00
VST Industries Ltd. Consumer Non Durables 0.31 0.00
La Opala RG Ltd. Consumer Durables 0.30 0.00
Sharda Cropchem Ltd. Pesticides 0.21 0.00
Suprajit engineering Ltd. Auto Ancillaries 0.12 0.00
Sub Total 63.81
DEBT & DEBT RElATED
CREDIT EXPOSURE (NON PERPETUAl)
• Housing Development Finance Corporation Ltd.£ CRISIL - AAA 2.21
Vedanta Ltd. CRISIL - AA- 1.90
Power Finance Corporation Ltd. CRISIL - AAA 1.08
INOx Wind Infrastructure Services Ltd. CRISIL - AA(Ce) 0.98
Sub Total 6.17
CREDIT EXPOSURE (PERPETUAl BONDS)
Union Bank of India (AT1, BASeL III, Perpetual) CARe - AA- 1.00
TATA International Ltd. (Perpetual) CARe - A 0.99
Sub Total 1.99
Total 8.16
MUTUAl FUND UNITS
• HDFC Gold Exchange Traded Fund 14.51
Sub Total 14.51
OTHERS
Cash, Cash equivalents and Net Current Assets 13.52
Sub Total 13.52
Grand Total 100.00
• Top Ten Holdings, £ Co-sponsor
Face Value per Unit: ` 10 unless otherwise specified, + Industry Classification as recommended by AMFI, Data is as of January 31, 2021 unless otherwise specified.
(An open ended scheme investing in equity and equity related instruments, debt & money market instruments and gold related instruments)HDFC Multi-Asset Fund ...Contd from previous page
PORTFOLIO

January 2021 23
CATEgORY OF SCHEME: ExCHANGE TRADED FUND
KEY FACTSINVESTMENT OBjECTIVEThe investment objective of HDFC NIFTY 50 ETF is to generate returns that are commensurate with the performance of the NIFTY 50 Index, subject to tracking error.There is no assurance that the investment objective of the Scheme will be realized.
FUND MANAgERKrishan Kumar Daga (since December 09, 2015)
Total experience: Over 22 yearsArun Agarwal (since August 24, 2020)
Total experience: Over 22 years
INCEPTION DATE (Date of Allotment)December 09, 2015
NAV (AS ON JANUARY 29, 2021) NAV PER UNIT (`)Growth Option 1,441.53
ASSETS UNDER MANAgEMENT j (`) IN CROREAs on January 31, 2021 747.27Average for Month of January 2021 664.67
qUANTITATIVE DATAPortfolio Turnover Ratio (Last 1 year) 16.15%
TRACKINg ERRORAnnualised tracking error is calculated based on daily rolling returns for the last 12 months: 0.19%
TOTAL ExPENSE RATIO (As on January 31, 2021)Including Additional expenses and Goods and Service Tax on Management FeesHDFC NIFTY 50 ETF 0.05%
#BENCHMARK INDEX: NIFTY 50 (Total Returns Index)##ADDl. BENCHMARK INDEX: S&P BSe SeNSex (Total Returns Index)
EXIT lOADFor Creation Unit Size:l No exit load will be levied on redemptions made by
Authorised Participants / Large Investors directly with the Fund in Creation Unit Size.
For other than Creation Unit Size:l N.A. The Units of HNETF in other than Creation Unit Size cannot
be directly redeemed with the Fund. These Units can be redeemed (sold) on a continuous basis on
the NSe and BSe during the trading hours on all trading days. Refer SID for further details.For further details, please refer to para ‘Exit Load’ on Pg 67.
PLANS & OPTIONSHDFC NIFTY 50 ETF. Presently the Scheme does not offer any Plans / Options for investmentMINIMUM APPlICATION AMOUNT (Under each Plan / Option)Authorised Participants / large Investors: Application for subscription of HNETF Units in Creation Unit Size can be made either: (i) in exchange of the Portfolio Deposit; or (ii) by depositing basket of securities comprising NIFTY 50 Index Each Creation Unit Size will consist of 4,000 Units of HNETF and 1 Unit of HNETF will be approximately equal to 1/10th of the value of NIFTY 50 Index. Other investors (including Authorised Participants and large Investors): Units of HNETF can be subscribed (in lots of 1 Unit) during the trading hours on all trading days on the NSe and BSe on which the Units will be listed.
Face Value per Unit: ` 761.25, + Industry Classification as recommended by AMFI, Data is as of January 31, 2021 unless otherwise specified.
PERFORMANCE *^
Date Period Scheme Returns
(%)
Benchmark Returns
(%)#
Additional Benchmark
Returns (%) ##
Value of ` 10,000 invested
Scheme (`) Benchmark (`)#
Additional Benchmark
(`)##
Jan 31, 20 Last 1 Year 14.80 15.22 15.05 11,475 11,518 11,500
Jan 31, 18 Last 3 Years 8.55 8.70 10.08 12,787 12,841 13,336
Jan 29, 16 Last 5 Years 13.78 13.94 14.65 19,083 19,214 19,826
Dec 09, 15 Since Inception 13.21 13.40 14.09 18,936 19,095 19,700
Returns greater than 1 year period are compounded annualized (CAGR). * The Scheme does not offer any Plans/Options. For performance of other schemes managed by Krishan Kumar Daga and Arun Agarwal, please refer page 67.
This product is suitable for investors who are seeking ~
l returns that are commensurate with the performance of the NIFTY 50, subject to tracking errors over long term
l investment in equity securities covered by the NIFTY 50
VeryHigh
Low to
Moderate
Low
Moderate ModeratelyHigh High
RISKOMETERInvestors understand that their principal will be at
very high risk
~ Investors should consult their financial advisers, if in doubt about whether the product is suitable for them. ^Past performance may or may not be sustained in the future. Load is not taken into consideration for computation of performance.
j Includes investments made by the schemes of HDFC Mutual Fund aggregating to ` 186.92 Crores
(An open ended scheme replicating / tracking NIFTY 50 index)HDFC NIFTY 50 ETF
Company Industry+ % to NAV
EqUITY & EqUITY RElATED
• HDFC Bank Ltd. Banks 10.29
• Reliance Industries Ltd. Petroleum Products 10.13
• Infosys Ltd. Software 7.81
• Housing Development Finance Corporation Ltd.£ Finance 7.27
• ICICI Bank Ltd. Banks 6.31
• Tata Consultancy Services Ltd. Software 5.56
• Kotak Mahindra Bank Ltd. Banks 4.27
• Hindustan Unilever Ltd. Consumer Non Durables 3.44
• ITC Ltd. Consumer Non Durables 3.02
• Axis Bank Ltd. Banks 2.79
Larsen and Toubro Ltd. Construction Project 2.74
Bharti Airtel Ltd. Telecom - Services 2.26
Bajaj Finance Ltd. Finance 2.13
Asian Paints Ltd. Consumer Non Durables 1.84
State Bank of India Banks 1.84
HCL Technologies Ltd. Software 1.69
Maruti Suzuki India Ltd. Auto 1.63
Mahindra & Mahindra Ltd. Auto 1.22
Sun Pharmaceutical Industries Ltd. Pharmaceuticals 1.08
Wipro Ltd. Software 1.06
UltraTech Cement Ltd. Cement 1.05
Tech Mahindra Ltd. Software 1.01
Titan Company Ltd. Consumer Durables 1.01
Nestle India Ltd. Consumer Non Durables 1.00
Dr Reddys Laboratories Ltd. Pharmaceuticals 0.95
Bajaj Finserv Ltd. Finance 0.92
HDFC Life Insurance Company Ltd. Finance 0.91
Bajaj Auto Ltd. Auto 0.89
Indusind Bank Ltd. Banks 0.82
Power Grid Corporation of India Ltd. Power 0.80
Tata Motors Ltd. Auto 0.80
Tata Steel Ltd. Ferrous Metals 0.77
NTPC Ltd. Power 0.73
Britannia Industries Ltd. Consumer Non Durables 0.72
Divis Laboratories Ltd. Pharmaceuticals 0.72
Hero MotoCorp Ltd. Auto 0.72
Cipla Ltd. Pharmaceuticals 0.71
Grasim Industries Ltd. Cement 0.70
Company Industry+ % to NAV
eicher Motors Ltd. Auto 0.65
Adani Ports & Special economic Zone Transportation 0.63
JSW Steel Ltd. Ferrous Metals 0.60
SBI Life Insurance Company Ltd. Finance 0.57
Hindalco Industries Ltd. Non - Ferrous Metals 0.56
Oil & Natural Gas Corporation Ltd. Oil 0.55
UPL Ltd. Pesticides 0.53
Bharat Petroleum Corporation Ltd. Petroleum Products 0.52
Shree Cement Ltd. Cement 0.49
Coal India Ltd. Minerals/Mining 0.45
Indian Oil Corporation Ltd. Petroleum Products 0.40
GAIL (India) Ltd. Gas 0.39
Yes Bank Ltd. Banks @
Sub Total 99.95
Cash, Cash equivalents and Net Current Assets 0.05
Grand Total 100.00
• Top Ten Holdings, £ Co-sponsor, @ Less than 0.01%
PORTFOLIO
Industry Allocation of Equity Holding (% of Net Assets)
0.390.450.530.550.560.631.011.371.532.242.262.743.46
5.9110.0211.0511.80
17.1326.32
0 5 10 15 20 25 30
GasMinerals/Mining
PesticidesOil
Non - Ferrous MetalsTransportation
Consumer DurablesFerrous Metals
PowerCement
Telecom - ServicesConstruction Project
PharmaceuticalsAuto
Consumer Non DurablesPetroleum Products
FinanceSoftware
Banks

24 January 2021
CATEgORY OF SCHEME: INDEx FUND
Company Industry+ % to NAV
EqUITY & EqUITY RElATED• HDFC Bank Ltd. Banks 10.27• Reliance Industries Ltd. Petroleum Products 10.11• Infosys Ltd. Software 7.80• Housing Development
Finance Corporation Ltd.£ Finance 7.26• ICICI Bank Ltd. Banks 6.29• Tata Consultancy Services Ltd. Software 5.55• Kotak Mahindra Bank Ltd. Banks 4.26• Hindustan Unilever Ltd. Consumer Non Durables 3.43• ITC Ltd. Consumer Non Durables 3.02• Axis Bank Ltd. Banks 2.79Larsen and Toubro Ltd. Construction Project 2.74Bharti Airtel Ltd. Telecom - Services 2.26Bajaj Finance Ltd. Finance 2.13Asian Paints Ltd. Consumer Non Durables 1.84State Bank of India Banks 1.84HCL Technologies Ltd. Software 1.68Maruti Suzuki India Ltd. Auto 1.63Mahindra & Mahindra Ltd. Auto 1.22Sun Pharmaceutical Industries Ltd. Pharmaceuticals 1.07Wipro Ltd. Software 1.05UltraTech Cement Ltd. Cement 1.04Nestle India Ltd. Consumer Non Durables 1.03Tech Mahindra Ltd. Software 1.01Titan Company Ltd. Consumer Durables 1.01Dr Reddys Laboratories Ltd. Pharmaceuticals 0.95HDFC Life Insurance Company Ltd. Finance 0.91Bajaj Finserv Ltd. Finance 0.90Bajaj Auto Ltd. Auto 0.89Indusind Bank Ltd. Banks 0.82Power Grid Corporation of India Ltd. Power 0.80Tata Motors Ltd. Auto 0.80Tata Steel Ltd. Ferrous Metals 0.77Divis Laboratories Ltd. Pharmaceuticals 0.73NTPC Ltd. Power 0.73Hero MotoCorp Ltd. Auto 0.72Cipla Ltd. Pharmaceuticals 0.71Britannia Industries Ltd. Consumer Non Durables 0.70Grasim Industries Ltd. Cement 0.70eicher Motors Ltd. Auto 0.65
Company Industry+ % to NAV
Adani Ports & Special economic Zone Transportation 0.63JSW Steel Ltd. Ferrous Metals 0.60SBI Life Insurance Company Ltd. Finance 0.57Hindalco Industries Ltd. Non - Ferrous Metals 0.56Oil & Natural Gas Corporation Ltd. Oil 0.55Bharat Petroleum Corporation Ltd. Petroleum Products 0.52Shree Cement Ltd. Cement 0.52UPL Ltd. Pesticides 0.52Coal India Ltd. Minerals/Mining 0.45Indian Oil Corporation Ltd. Petroleum Products 0.40GAIL (India) Ltd. Gas 0.39Yes Bank Ltd. Banks @Sub Total 99.82Cash, Cash equivalents and Net Current Assets 0.18Grand Total 100.00• Top Ten Holdings, £ Co-sponsor, @ Less than 0.01%
KEY FACTS
INVESTMENT OBjECTIVE
The investment objective of the Scheme is to generate returns that are commensurate with the performance of the NIFTY 50 Index, subject to tracking errors.
There is no assurance that the investment objective of the Scheme will be realized.
FUND MANAgER
Krishan Kumar Daga (since October 19, 2015)
Total experience: Over 22 years
Arun Agarwal (since August 24, 2020)
Total experience: Over 22 years
INCEPTION DATE (Date of Allotment)
July 17, 2002
NAV (AS ON JANUARY 29, 2021) NAV PER UNIT (`)
Regular Plan - Growth Option 124.7787Direct Plan - Growth Option 126.5548
ASSETS UNDER MANAgEMENT (`) IN CRORE
As on January 31, 2021 2,343.46Average for Month of January 2021 2,411.73
qUANTITATIVE DATA
Portfolio Turnover Ratio (Last 1 year) 21.43%
TRACKINg ERROR
Annualised tracking error is calculated based on daily rolling returns for the last 12 months: 0.31%
TOTAL ExPENSE RATIO (As on January 31, 2021)Including Additional expenses and Goods and Service Tax on Management Fees
Regular: 0.30% Direct: 0.10%
#BENCHMARK INDEX: NIFTY 50 (Total Returns Index)
##ADDl. BENCHMARK INDEX: S&P BSe SeNSex (Total Returns Index)
EXIT lOAD
l In respect of each purchase / switch-in of Units, an exit Load of 0.25% is payable if Units are redeemed / switched-out within 3 days from the date of allotment.
l No exit load is payable if units are redeemed / switched out after 3 days from the date of allotment.
For further details, please refer to para ‘Exit Load’ on Pg 67.
PLANS & OPTIONS
Regular Plan, Direct Plan. Each Plan offers Growth Option only.
MINIMUM APPlICATION AMOUNT
Purchase : ` 5,000 and any amount thereafter.Additional Purchase : ` 1,000 and any amount thereafter.
SIP PERFORMANCE ^ - Regular Plan - growth Option
Since Inception SIP
15 year SIP
10 year SIP
5 year SIP
3 year SIP
1 year SIP
Total Amount Invested (` ‘000) 2,230.00 1,800.00 1,200.00 600.00 360.00 120.00 Mkt Value As on January 29, 2021 (` ‘000) 7,754.49 4,151.50 2,206.70 828.03 447.04 150.50 Returns (%) 12.09 10.39 11.72 12.85 14.60 50.69 Benchmark Returns (%) # 13.92 11.51 12.33 13.49 15.30 51.56 Additional Benchmark Returns (%) ## 14.49 11.87 12.88 14.61 16.22 50.95
Assuming ` 10,000 invested systematically on the first Business Day of every month over a period of time. CAGR returns are computed after accounting for the cash flow by using xIRR method (investment internal rate of return) for Regular Plan - Growth Option. The above investment simulation is for illustrative purposes only and should not be construed as a promise on minimum returns and safeguard of capital.
PERFORMANCE ^ - Regular Plan - growth Option
Date Period Scheme Returns
(%)
Benchmark Returns
(%)#
Additional Benchmark
Returns (%) ##
Value of ` 10,000 invested
Scheme (`) Benchmark (`)#
Additional Benchmark
(`)##
Jan 31, 20 Last 1 Year 14.22 15.22 15.05 11,418 11,518 11,500Jan 31, 18 Last 3 Years 8.12 8.70 10.08 12,637 12,841 13,336Jan 29, 16 Last 5 Years 13.30 13.94 14.65 18,681 19,214 19,826Jul 17, 02 Since Inception 14.38 16.53 17.21 120,839 170,842 190,388
Returns greater than 1 year period are compounded annualized (CAGR). Since inception returns are calculated on ` 10.3260 (allotment price). For performance of other schemes managed by Krishan Kumar Daga and Arun Agarwal, please refer page 67. Different plans viz. Regular Plan and Direct Plan have a different expense structure. The expenses of the Direct Plan under the Scheme will be lower to the extent of the distribution expenses / commission charged in the Regular Plan. For Performance of Direct Plan, refer page no. 80.
Face Value per Unit: ` 10.3260, + Industry Classification as recommended by AMFI, Data is as of January 31, 2021 unless otherwise specified.
This product is suitable for investors who are seeking ~
l returns that are commensurate with the performance of the NIFTY 50, subject to tracking errors over long term
l investment in equity securities covered by the NIFTY 50
VeryHigh
Low to
Moderate
Low
Moderate ModeratelyHigh High
RISKOMETERInvestors understand that their principal will be at
very high risk
~ Investors should consult their financial advisers, if in doubt about whether the product is suitable for them. ^Past performance may or may not be sustained in the future. Load is not taken into consideration for computation of performance.
(An open ended scheme replicating / tracking NIFTY 50 index)HDFC Index Fund - NIFTY 50 Plan
PORTFOLIO
Industry Allocation of Equity Holding (% of Net Assets)
0.390.450.520.550.560.631.011.371.532.262.262.743.46
5.9110.0211.0311.77
17.0926.27
0 5 10 15 20 25 30
GasMinerals/Mining
PesticidesOil
Non - Ferrous MetalsTransportation
Consumer DurablesFerrous Metals
PowerCement
Telecom - ServicesConstruction Project
PharmaceuticalsAuto
Consumer Non DurablesPetroleum Products
FinanceSoftware
Banks

January 2021 25
CATEgORY OF SCHEME: ExCHANGE TRADED FUND
KEY FACTS
INVESTMENT OBjECTIVEThe investment objective of HDFC SENSEx ETF is to generate returns that are commensurate with the performance of the S&P BSe SeNSex Index, subject to tracking errors.There is no assurance that the investment objective of the Scheme will be realized.
FUND MANAgERKrishan Kumar Daga (since December 09, 2015)
Total experience: Over 22 yearsArun Agarwal (since August 24, 2020)
Total experience: Over 22 years
INCEPTION DATE (Date of Allotment)December 09, 2015
NAV (AS ON JANUARY 29, 2021) NAV PER UNIT (`)Growth Option 4,922.56
ASSETS UNDER MANAgEMENT j (`) IN CROREAs on January 31, 2021 85.09Average for Month of January 2021 88.60
qUANTITATIVE DATAPortfolio Turnover Ratio (Last 1 year) 65.02%
TRACKINg ERRORAnnualised tracking error is calculated based on daily rolling returns for the last 12 months: 0.10%
TOTAL ExPENSE RATIO (As on January 31, 2021)Including Additional expenses and Goods and Service Tax on Management FeesHDFC SeNSex ETF 0.05%
#BENCHMARK INDEX: S&P BSe SeNSex (Total Returns Index)##ADDl. BENCHMARK INDEX: NIFTY 50 (Total Returns Index)
EXIT lOADFor Creation Unit Size:l No exit load will be levied on redemptions made by
Authorised Participants / Large Investors directly with the Fund in Creation Unit Size.
For other than Creation Unit Size:l N.A. The Units of HSxETF in other than Creation Unit Size cannot
be directly redeemed with the Fund. These Units can be redeemed (sold) on a continuous basis on
the NSe and BSe during the trading hours on all trading days. Refer SID for further details.For further details, please refer to para ‘Exit Load’ on Pg 67.
PLANS & OPTIONSHDFC SENSEx ETF. Presently the Scheme does not offer any Plans / Options for investment
MINIMUM APPlICATION AMOUNT (Under each Plan / Option)Authorised Participants / large Investors: Application for subscription of HSxETF Units in Creation Unit Size can be made either: (i) in exchange of the Portfolio Deposit; or (ii) by depositing basket of securities comprising S&P BSe
SeNSex IndexEach Creation Unit Size will consist of 1,000 Units of HSxETF and 1 Unit of HSxETF will be approximately equal to 1/10th of the value of S&P BSe SeNSex Index. Other investors (including Authorised Participants and large Investors): Units of HSxETF can be subscribed (in lots of 1 Unit) during the trading hours on all trading days on the NSe and BSe on which the Units will be listed.
Face Value per Unit: ` 2,503.61, + Industry Classification as recommended by AMFI, Data is as of January 31, 2021 unless otherwise specified.
PERFORMANCE *^
Date Period Scheme Returns
(%)
Benchmark Returns
(%)#
Additional Benchmark
Returns (%) ##
Value of ` 10,000 invested
Scheme (`) Benchmark (`)#
Additional Benchmark
(`)##
Jan 31, 20 Last 1 Year 14.86 15.05 15.22 11,482 11,500 11,518
Jan 31, 18 Last 3 Years 9.98 10.08 8.70 13,301 13,336 12,841
Jan 29, 16 Last 5 Years 14.65 14.65 13.94 19,828 19,826 19,214
Dec 09, 15 Since Inception 14.04 14.09 13.40 19,662 19,700 19,095
Returns greater than 1 year period are compounded annualized (CAGR). * The Scheme does not offer any Plans/Options. For performance of other schemes managed by Krishan Kumar Daga and Arun Agarwal, please refer page 67.
This product is suitable for investors who are seeking ~
l returns that are commensurate with the performance of the S&P BSe SeNSex, subject to tracking errors over long term
l investment in equity securities covered by the S&P BSe SeNSex
VeryHigh
Low to
Moderate
Low
Moderate ModeratelyHigh High
RISKOMETERInvestors understand that their principal will be at
very high risk
~ Investors should consult their financial advisers, if in doubt about whether the product is suitable for them. ^Past performance may or may not be sustained in the future. Load is not taken into consideration for computation of performance.
j Includes investments made by the schemes of HDFC Mutual Fund aggregating to ` 37.87 Crores
(An open ended scheme replicating / tracking S&P BSE SENSEX index)HDFC SENSEX ETF
Company Industry+ % to NAV
EqUITY & EqUITY RElATED
• Reliance Industries Ltd. Petroleum Products 11.77
• HDFC Bank Ltd. Banks 11.18
• Infosys Ltd. Software 8.97
• Housing Development Finance Corporation Ltd.£ Finance 8.45
• ICICI Bank Ltd. Banks 7.32
• Tata Consultancy Services Ltd. Software 6.46
• Kotak Mahindra Bank Ltd. Banks 4.42
• Hindustan Unilever Ltd. Consumer Non Durables 3.99
• ITC Ltd. Consumer Non Durables 3.51
• Axis Bank Ltd. Banks 3.45
Larsen and Toubro Ltd. Construction Project 3.18
Bharti Airtel Ltd. Telecom - Services 2.62
Bajaj Finance Ltd. Finance 2.48
Asian Paints Ltd. Consumer Non Durables 2.14
State Bank of India Banks 2.14
HCL Technologies Ltd. Software 1.96
Maruti Suzuki India Ltd. Auto 1.89
Mahindra & Mahindra Ltd. Auto 1.42
Sun Pharmaceutical Industries Ltd. Pharmaceuticals 1.25
UltraTech Cement Ltd. Cement 1.21
Nestle India Ltd. Consumer Non Durables 1.20
Tech Mahindra Ltd. Software 1.18
Titan Company Ltd. Consumer Durables 1.17
Dr Reddys Laboratories Ltd. Pharmaceuticals 1.10
Bajaj Finserv Ltd. Finance 1.04
Company Industry+ % to NAV
Bajaj Auto Ltd. Auto 1.03
Indusind Bank Ltd. Banks 0.95
Power Grid Corporation of India Ltd. Power 0.93
NTPC Ltd. Power 0.85
Oil & Natural Gas Corporation Ltd. Oil 0.64
Sub Total 99.90
Cash, Cash equivalents and Net Current Assets 0.10
Grand Total 100.00
• Top Ten Holdings, £ Co-sponsor
PORTFOLIO
Industry Allocation of Equity Holding (% of Net Assets)
0.64
1.17
1.21
1.78
2.35
2.62
3.18
4.34
10.84
11.77
11.97
18.57
29.46
0 5 10 15 20 25 30
Oil
Consumer Durables
Cement
Power
Pharmaceuticals
Telecom - Services
Construction Project
Auto
Consumer Non Durables
Petroleum Products
Finance
Software
Banks

26 January 2021
CATEgORY OF SCHEME: INDEx FUND
KEY FACTS
INVESTMENT OBjECTIVE
The investment objective of the Scheme is to generate returns that are commensurate with the performance of the S&P BSe SeNSex Index, subject to tracking errors.
There is no assurance that the investment objective of the Scheme will be realized.
FUND MANAgER
Krishan Kumar Daga (since October 19, 2015)
Total experience: Over 22 years
Arun Agarwal (since August 24, 2020)
Total experience: Over 22 years
INCEPTION DATE (Date of Allotment)
July 17, 2002
NAV (AS ON JANUARY 29, 2021) NAV PER UNIT (`)
Regular Plan - Growth Option 413.1330Direct Plan - Growth Option 419.7827
ASSETS UNDER MANAgEMENT (`) IN CRORE
As on January 31, 2021 1,770.33Average for Month of January 2021 1,805.51
qUANTITATIVE DATA
Portfolio Turnover Ratio (Last 1 year) 28.69%
TRACKINg ERROR
Annualised tracking error is calculated based on daily rolling returns for the last 12 months: 0.19%
TOTAL ExPENSE RATIO (As on January 31, 2021)Including Additional expenses and Goods and Service Tax on Management Fees
Regular: 0.30% Direct: 0.10%
#BENCHMARK INDEX: S&P BSe SeNSex (Total Returns Index)
##ADDl. BENCHMARK INDEX: NIFTY 50 (Total Returns Index)
EXIT lOAD
l In respect of each purchase / switch-in of Units, an exit Load of 0.25% is payable if Units are redeemed / switched-out within 3 days from the date of allotment.
l No exit load is payable if units are redeemed / switched out after 3 days from the date of allotment.
For further details, please refer to para ‘Exit Load’ on Pg 67.
PLANS & OPTIONS
Regular Plan, Direct Plan. Each Plan offers Growth Option only.
MINIMUM APPlICATION AMOUNT
Purchase : ` 5,000 and any amount thereafter.Additional Purchase : ` 1,000 and any amount thereafter.
SIP PERFORMANCE ^ - Regular Plan - growth Option
Since Inception SIP
15 year SIP
10 year SIP
5 year SIP
3 year SIP
1 year SIP
Total Amount Invested (` ‘000) 2,230.00 1,800.00 1,200.00 600.00 360.00 120.00 Mkt Value As on January 29, 2021 (` ‘000) 8,143.66 4,279.05 2,272.03 851.04 452.91 150.16 Returns (%) 12.53 10.75 12.27 13.96 15.52 50.09 Benchmark Returns (%) # 14.49 11.87 12.88 14.61 16.22 50.95 Additional Benchmark Returns (%) ## 13.92 11.51 12.33 13.49 15.30 51.56
Assuming ` 10,000 invested systematically on the first Business Day of every month over a period of time. CAGR returns are computed after accounting for the cash flow by using xIRR method (investment internal rate of return) for Regular Plan - Growth Option. The above investment simulation is for illustrative purposes only and should not be construed as a promise on minimum returns and safeguard of capital.
Face Value per Unit: ` 32.1610, + Industry Classification as recommended by AMFI, Data is as of January 31, 2021 unless otherwise specified.
This product is suitable for investors who are seeking ~
l returns that are commensurate with the performance of the S&P BSe SeNSex, subject to tracking errors over long term.
l investment in equity securities covered by the S&P BSe SeNSex.
VeryHigh
Low to
Moderate
Low
Moderate ModeratelyHigh High
RISKOMETERInvestors understand that their principal will be at
very high risk
~ Investors should consult their financial advisers, if in doubt about whether the product is suitable for them.
^Past performance may or may not be sustained in the future. Load is not taken into consideration for computation of performance.
PERFORMANCE ^ - Regular Plan - growth Option
Date Period Scheme Returns
(%)
Benchmark Returns
(%)#
Additional Benchmark
Returns (%) ##
Value of ` 10,000 invested
Scheme (`) Benchmark (`)#
Additional Benchmark
(`)##
Jan 31, 20 Last 1 Year 14.15 15.05 15.22 11,411 11,500 11,518Jan 31, 18 Last 3 Years 9.45 10.08 8.70 13,108 13,336 12,841Jan 29, 16 Last 5 Years 14.08 14.65 13.94 19,339 19,826 19,214Jul 17, 02 Since Inception 14.75 17.21 16.53 128,458 190,388 170,842
Returns greater than 1 year period are compounded annualized (CAGR). Since inception returns are calculated on ̀ 32.1610 (allotment price). For performance of other schemes managed by Krishan Kumar Daga and Arun Agarwal, please refer page 67. Different plans viz. Regular Plan and Direct Plan have a different expense structure. The expenses of the Direct Plan under the Scheme will be lower to the extent of the distribution expenses / commission charged in the Regular Plan. For Performance of Direct Plan, refer page no. 80.
Note: Effective close of business hours of May 25, 2018, HDFC Index Fund - SENSEx Plan (the Scheme) underwent changes in Fundamental Attributes and HDFC Index Fund - SENSEx Plus Plan was merged therein. As the portfolio structuring of the Scheme is continued, its past performance is provided, in line with SeBI circular on Performance disclosure post consolidation/ merger of scheme dated April 12, 2018.
(An open ended scheme replicating / tracking S&P BSE SENSEX index)HDFC Index Fund - SENSEX Plan
Company Industry+ % to NAV
EqUITY & EqUITY RElATED
• Reliance Industries Ltd. Petroleum Products 11.76
• HDFC Bank Ltd. Banks 11.17
• Infosys Ltd. Software 8.96
• Housing Development Finance Corporation Ltd.£ Finance 8.44
• ICICI Bank Ltd. Banks 7.31
• Tata Consultancy Services Ltd. Software 6.45
• Kotak Mahindra Bank Ltd. Banks 4.42
• Hindustan Unilever Ltd. Consumer Non Durables 3.99
• ITC Ltd. Consumer Non Durables 3.50
• Axis Bank Ltd. Banks 3.45
Larsen and Toubro Ltd. Construction Project 3.18
Bharti Airtel Ltd. Telecom - Services 2.62
Bajaj Finance Ltd. Finance 2.48
Asian Paints Ltd. Consumer Non Durables 2.14
State Bank of India Banks 2.14
HCL Technologies Ltd. Software 1.96
Maruti Suzuki India Ltd. Auto 1.89
Mahindra & Mahindra Ltd. Auto 1.42
Sun Pharmaceutical Industries Ltd. Pharmaceuticals 1.25
UltraTech Cement Ltd. Cement 1.21
Nestle India Ltd. Consumer Non Durables 1.20
Tech Mahindra Ltd. Software 1.17
Titan Company Ltd. Consumer Durables 1.17
Dr Reddys Laboratories Ltd. Pharmaceuticals 1.10
Bajaj Finserv Ltd. Finance 1.04
Bajaj Auto Ltd. Auto 1.03
Indusind Bank Ltd. Banks 0.95
Company Industry+ % to NAV
Power Grid Corporation of India Ltd. Power 0.93
NTPC Ltd. Power 0.85
Oil & Natural Gas Corporation Ltd. Oil 0.64
Sub Total 99.82
Cash, Cash equivalents and Net Current Assets 0.18
Grand Total 100.00
• Top Ten Holdings, £ Co-sponsor
PORTFOLIO
Industry Allocation of Equity Holding (% of Net Assets)
0.64
1.17
1.21
1.78
2.35
2.62
3.18
4.34
10.83
11.76
11.96
18.54
29.44
0 5 10 15 20 25 30
Oil
Consumer Durables
Cement
Power
Pharmaceuticals
Telecom - Services
Construction Project
Auto
Consumer Non Durables
Petroleum Products
Finance
Software
Banks

January 2021 27
CATEgORY OF SCHEME: eQUITY LINKeD SAVINGS SCHeMe
KEY FACTS
INVESTMENT OBjECTIVE
To generate capital appreciation / income from a portfolio, comprising predominantly of equity & equity related instruments.There is no assurance that the investment objective of the Scheme will be realized.
FUND MANAgER ¥
Amit B. Ganatra (since August 24, 2020)
Total experience: Over 17 years
INCEPTION DATE (Date of Allotment)
March 31, 1996
NAV (AS ON JANUARY 29, 2021) NAV PER UNIT (`)
Regular Plan - Growth Option 544.500Regular Plan - Dividend Option 48.299Direct Plan - Growth Option 572.386Direct Plan - Dividend Option 56.233
ASSETS UNDER MANAgEMENT (`) IN CRORE
As on January 31, 2021 7,580.47Average for Month of January 2021 7,868.08
qUANTITATIVE DATA
Portfolio Turnover Ratio (Last 1 year) 39.91%
Risk Ration Standard Deviation 6.553%n Beta 0.968n Sharpe Ratio* -0.022
Computed for the 3-yr period ended January 29, 2021. Based on month-end NAV. * Risk free rate: 3.47%(Source: FIMMDA MIBOR)
TOTAL ExPENSE RATIO (As on January 31, 2021)Including Additional expenses and Goods and Service Tax on Management Fees
Regular: 1.95% Direct: 1.35%
#BENCHMARK INDEX: NIFTY 500 (Total Returns Index)
##ADDl. BENCHMARK INDEX: NIFTY 50 (Total Returns Index)
EXIT lOAD
Nil
PLANS & OPTIONS
Regular Plan, Direct Plan. Under each Plan : Growth & Dividend. The Dividend Option offers Dividend Payout facility.
MINIMUM APPlICATION AMOUNT
Purchase : ` 500 and in multiples of ` 500 thereafter.Additional Purchase : ̀ 500 and in multiples of ̀ 500 thereafter.
lOCK-IN PERIOD
3 years from the date of allotment of the respective Units
¥ Dedicated Fund Manager for Overseas Investments: Mr. Sankalp Baid (since January 22, 2021) (Total experience: Over 13 years).
SIP PERFORMANCE ^ - Regular Plan - growth OptionSince Inception
SIP15 year
SIP10 year
SIP5 year
SIP3 year
SIP1 year
SIPTotal Amount Invested (` ‘000) 2,980.00 1,800.00 1,200.00 600.00 360.00 120.00 Mkt Value As on January 29, 2021 (` ‘000) $$ 69,341.55 4,138.79 1,947.16 706.39 403.30 146.93 Returns (%) $$ 20.80 10.36 9.36 6.47 7.53 44.45 Benchmark Returns (%) # 14.70 11.64 12.58 12.59 14.83 53.73 Additional Benchmark Returns (%) ## 13.70 11.51 12.33 13.49 15.30 51.56
Assuming ` 10,000 invested systematically on the first Business Day of every month over a period of time. CAGR returns are computed after accounting for the cash flow by using xIRR method (investment internal rate of return) for Regular Plan - Growth Option. The above investment simulation is for illustrative purposes only and should not be construed as a promise on minimum returns and safeguard of capital.
PERFORMANCE ^ - Regular Plan - growth OptionDate Period Scheme
Returns (%) $$
Benchmark Returns
(%)#
Additional Benchmark
Returns (%) ##
Value of ` 10,000 investedScheme (`)
$$Benchmark
(`)#Additional
Benchmark (`)##
Jan 31, 20 Last 1 Year 7.12 15.82 15.22 10,710 11,578 11,518Jan 31, 18 Last 3 Years -0.88 6.49 8.70 9,738 12,073 12,841Jan 29, 16 Last 5 Years 9.60 13.61 13.94 15,820 18,938 19,214Mar 31, 96 Since Inception 21.91 13.64 12.47 1,373,546 240,033 185,613
Returns greater than 1 year period are compounded annualized (CAGR). Performance of dividend option under the schemes for the investors would be net of distribution tax, if any. $$ All dividends declared prior to the splitting of the Scheme into Dividend & Growth Options are assumed to be reinvested in the units of the Scheme at the then prevailing NAV (ex-dividend NAV). For performance of other schemes managed by Amit B. Ganatra, please refer page 67. Different plans viz. Regular Plan and Direct Plan have a different expense structure. The expenses of the Direct Plan under the Scheme will be lower to the extent of the distribution expenses / commission charged in the Regular Plan. For Performance of Direct Plan, refer page no. 78. As TRI data is not available since inception of the scheme, additional benchmark performance is calculated using composite CAGR of NIFTY 50 PRI values from Mar 29, 96 (Data for March 31, 96 is not available) to Jun 29, 99 and TRI values since Jun 30, 99. As NIFTY 500 TRI data is not available for March 31, 96, benchmark performance is calculated from March 29, 96.
Face Value per Unit: ` 10 unless otherwise specified, + Industry Classification as recommended by AMFI, Data is as of January 31, 2021 unless otherwise specified.
This product is suitable for investors who are seeking ~
l to generate long-term capital appreciation / income
l investment predominantly of equity & equity related instruments
VeryHigh
Low to
Moderate
Low
Moderate ModeratelyHigh High
RISKOMETERInvestors understand that their principal will be at
very high risk
~ Investors should consult their financial advisers, if in doubt about whether the product is suitable for them.
^Past performance may or may not be sustained in the future. Load is not taken into consideration for computation of performance.
(An open ended equity linked savings scheme with a statutory lock in of 3 years and tax benefit)HDFC TaxSaver
Company Industry+ % to NAVEqUITY & EqUITY RElATED• ICICI Bank Ltd. Banks 9.51• Infosys Ltd. Software 9.51• HDFC Bank Ltd. Banks 9.34• Reliance Industries Ltd. Petroleum Products 5.21• Bharti Airtel Ltd. Telecom - Services 4.37• Cipla Ltd. Pharmaceuticals 3.24• Axis Bank Ltd. Banks 3.16• Hindustan Unilever Ltd. Consumer Non Durables 2.90• ITC Ltd. Consumer Non Durables 2.47• Bharat Petroleum
Corporation Ltd. Petroleum Products 2.33State Bank of India Banks 2.25Larsen and Toubro Ltd. Construction Project 1.96NTPC Ltd. Power 1.86Kotak Mahindra Bank Ltd. Banks 1.82HCL Technologies Ltd. Software 1.79Maruti Suzuki India Ltd. Auto 1.63Voltas Ltd. Consumer Durables 1.63L&T Technology Services Ltd. Software 1.60Lupin Ltd. Pharmaceuticals 1.44Persistent Systems Ltd. Software 1.32Ambuja Cements Ltd. Cement 1.22endurance Technologies Ltd. Auto Ancillaries 1.21Crompton Greaves Consumer elec. Ltd. Consumer Durables 1.20Aurobindo Pharma Ltd. Pharmaceuticals 1.18Bharat electronics Ltd. Industrial Capital Goods 1.13HDFC Life Insurance Company Ltd. Finance 1.07Apollo Hospitals enterprise Ltd. Healthcare Services 1.06Power Grid Corporation of India Ltd. Power 1.05United Spirits Ltd. Consumer Non Durables 1.05Tata Motors Ltd. Auto 1.03Procter & Gamble Health Ltd. Pharmaceuticals 1.02Tata Consumer Products Ltd. Consumer Non Durables 1.02Tata Steel Ltd. Ferrous Metals 1.01The Phoenix Mills Ltd. Construction 0.99Titan Company Ltd. Consumer Durables 0.92GAIL (India) Ltd. Gas 0.91Torrent Pharmaceuticals Ltd. Pharmaceuticals 0.91Oracle Financial Ser Software Ltd. Software 0.90Mahanagar Gas Ltd. Gas 0.79Whirlpool of India Ltd. Consumer Durables 0.77Hindustan Petroleum Corporation Ltd. Petroleum Products 0.68InterGlobe Aviation Ltd. Transportation 0.63Computer Age Management Services Finance 0.60Multi Commodity exchange of India Ltd. Finance 0.58Kalpataru Power Transmission Ltd. Power 0.57Syngene International Ltd. Pharmaceuticals 0.56AIA engineering Ltd. Industrial Products 0.54Solar Industries India Ltd. Chemicals 0.51TCI express Ltd. Transportation 0.49Teamlease Services Ltd. Commercial Services 0.47ABB India Ltd. Industrial Capital Goods 0.45
Company Industry+ % to NAVSBI Cards and Payment Services Ltd. Finance 0.40Tata Motors Ltd. DVR Auto 0.39eClerx Services Ltd. Software 0.29Dixon Technologies (India) Ltd. Consumer Durables 0.23Sadbhav engineering Ltd. Construction Project 0.22Hindustan Construction Company Ltd. Construction Project 0.15Somany Home Innovation Ltd. Construction 0.11Dynamatic Technologies Ltd. Auto Ancillaries 0.10Sadbhav Infrastructure Project Ltd. (Corporate Guarantee of Sadbhav engineering Ltd.) Construction Project 0.05MPS Ltd. Software 0.04Gujarat Pipavav Port Ltd. Transportation 0.03Siti Networks Ltd. Media & entertainment 0.01Sub Total 97.88DEBT & DEBT RElATEDCREDIT EXPOSURE (NON PERPETUAl)Muthoot Finance Ltd. ICRA - AA 0.33Sub Total 0.33CREDIT EXPOSURE (PERPETUAl BONDS)Punjab National Bank (AT1, BASeL III, Perpetual) IND - AA 0.34Sub Total 0.34Total 0.67Cash, Cash equivalents and Net Current Assets 1.45Grand Total 100.00• Top Ten Holdings
PORTFOLIO
Industry Allocation of Equity Holding (% of Net Assets)
0.010.470.510.541.011.061.101.151.221.311.581.702.382.653.053.484.374.75
7.448.228.35
15.4526.08
0 5 10 15 20 25 30Media & Entertainment
Commercial ServicesChemicals
Industrial ProductsFerrous Metals
Healthcare ServicesConstruction
TransportationCement
Auto AncillariesIndustrial Capital Goods
GasConstruction Project
FinanceAuto
PowerTelecom - Services
Consumer DurablesConsumer Non Durables
Petroleum ProductsPharmaceuticals
SoftwareBanks

28 January 2021
CATEgORY OF SCHEME: CHILDREN’S FUND
KEY FACTS
INVESTMENT OBjECTIVE
To generate capital appreciation / income from a portfolio of equity & equity related instruments and debt and money market instruments.
There is no assurance that the investment objective of the Scheme will be realized.
FUND MANAgER ¥
Chirag Setalvad (since April 2, 2007)
Total experience - Over 21 years
INCEPTION DATE (Date of Allotment)
March 2, 2001
NAV (AS ON JANUARY 29, 2021) NAV PER UNIT (`)
Regular Plan 144.496Direct Plan 154.346
ASSETS UNDER MANAgEMENT (`) IN CRORE
As on January 31, 2021 3,965.18Average for Month of January 2021 4,063.44
qUANTITATIVE DATA
Portfolio Turnover Ratio (Last 1 year) 17.33%Average Maturity * 2.93 yearsMacaulay Duration * 2.43 yearsModified Duration * 2.33 yearsYield to Maturity * 5.50%* Computed on the invested amount for debt portfolio.
TOTAL ExPENSE RATIO (As on January 31, 2021)Including Additional expenses and Goods and Service Tax on Management Fees
Regular: 1.99% Direct: 1.14%
#BENCHMARK INDEX: NIFTY 50 Hybrid Composite Debt 65:35 Index
##ADDl. BENCHMARK INDEX: NIFTY 50 (Total Returns Index)
EXIT lOAD
Nil
PLANS & OPTIONS
Regular Plan, Direct Plan.
MINIMUM APPlICATION AMOUNT
Purchase : ` 5,000 and any amount thereafter.Additional Purchase : ` 1,000 and any amount thereafter.
lOCK-IN PERIOD
Fresh investments by investors including SIP/ STP registrations, etc (effective May 23, 2018):Lock-in period will be compulsory. Lock-in period shall be earlier ofl 5 Years from the date of allotment; orl Until the Unit holder (being the beneficiary child) attains
the age of majority (i.e. completion of 18 years)¥ Dedicated Fund Manager for Overseas Investments: Mr. Sankalp Baid (since January 22, 2021) (Total experience: Over 13 years).
(Ω) eligibility (of Unit holder) : Children less than 18 years of age as on the date of investment by the Investor / Applicant are eligible as Unit holders in the Scheme. (π) Personal Accident Insurance Cover for Parent / Legal Guardian (upto the age of 80 years) of the Unit holder, equivalent to 10 times the cost value of the outstanding Units held by the Unit holder under all the applications / account statements / folios, subject to a maximum amount of ` 10 lakhs per Unit holder. The insurance premium in respect of the personal accident insurance cover will be borne by the AMC. This accident insurance cover is subject to conditions of the group personal accident insurance policy.
Face Value per Unit: ` 10 unless otherwise specified, + Industry Classification as recommended by AMFI, Data is as of January 31, 2021 unless otherwise specified.
[An open ended fund for investment for children having a lock-in for atleast 5 years or till the child attains age of majority (whichever is earlier)] ΩπHDFC Children's Gift Fund
Company Industry+ / Rating % to NAV
EqUITY & EqUITY RElATED
• HDFC Bank Ltd. Banks 6.41
• Reliance Industries Ltd. Petroleum Products 5.60
• Infosys Ltd. Software 5.02
• ICICI Bank Ltd. Banks 4.73
• Housing Development Finance Corporation Ltd.£ Finance 4.32
Bajaj Finance Ltd. Finance 2.39
Coforge Ltd. Software 2.17
Larsen and Toubro Ltd. Construction Project 2.12
ITC Ltd. Consumer Non Durables 2.00
State Bank of India Banks 1.69
Cholamandalam Investment & Finance Finance 1.59
Britannia Industries Ltd. Consumer Non Durables 1.41
Century Plyboards (India) Ltd. Consumer Durables 1.41
Bharti Airtel Ltd. Telecom - Services 1.37
Aurobindo Pharma Ltd. Pharmaceuticals 1.35
Bharat electronics Ltd. Industrial Capital Goods 1.31
UPL Ltd. Pesticides 1.27
Aster DM Healthcare Ltd. Healthcare Services 1.24
Oracle Financial Ser Software Ltd. Software 1.21
Apollo Tyres Ltd. Auto Ancillaries 1.18
Newgen Software Technologies Ltd. Software 1.18
Kirloskar Pneumatic Ltd. Industrial Products 1.16
Balkrishna Industries Ltd. Auto Ancillaries 0.96
Ipca Laboratories Ltd. Pharmaceuticals 0.95
Finolex Industries Ltd. Industrial Products 0.82
Motherson Sumi Systems Ltd. Auto Ancillaries 0.76
Power Grid Corporation of India Ltd. Power 0.74
Indian Hotels Company Ltd. Hotels/Resorts & Other Recreational Activities 0.71
Axis Bank Ltd. Banks 0.69
Voltamp Transformers Ltd. Industrial Capital Goods 0.68
Mahindra Holidays & Resorts Ind Ltd.
Hotels/Resorts & Other Recreational Activities 0.65
Carborundum Universal Ltd. Industrial Products 0.63
Sonata Software Ltd. Software 0.60
Company Industry+ / Rating % to NAV
PNC Infratech Ltd. Construction 0.56
Tata Steel Ltd. Ferrous Metals 0.56
Prince Pipes and Fittings Ltd. Industrial Products 0.51
Bharat Petroleum Corporation Ltd. Petroleum Products 0.48
Bank of Baroda Banks 0.47
VST Industries Ltd. Consumer Non Durables 0.46
Zensar Technologies Ltd. Software 0.46
eClerx Services Ltd. Software 0.43
Cholamandalam Financial Holdings Ltd. Finance 0.42
Vedanta Ltd. Non - Ferrous Metals 0.38
SKF India Ltd. Industrial Products 0.36
Swaraj engines Ltd. Industrial Products 0.36
Vesuvius India Ltd. Industrial Products 0.33
Blue Star Ltd. Consumer Durables 0.27
V.S.T Tillers Tractors Ltd. Auto 0.26
Navneet education Ltd. Media & entertainment 0.24
engineers India Ltd. Construction Project 0.13
Jagran Prakashan Ltd. Media & entertainment 0.07
Sadbhav engineering Ltd. Construction Project 0.06
Yes Bank Ltd. Banks 0.01
Sub Total 67.14
DEBT & DEBT RElATED
gOVERNMENT SECURITIES (CENTRAl/STATE)
• 7.17 GOI 2028 Sovereign 4.47
8.28 GOI 2027 Sovereign 1.29
8.32 GOI 2032 Sovereign 0.88
6.79 GOI 2027 Sovereign 0.80
8.83 GOI 2023 Sovereign 0.74
8.15 GOI 2022 Sovereign 0.40
8.08 GOI 2022 Sovereign 0.27
8.6 GOI 2028 Sovereign 0.15
7.26 GOI 2029 Sovereign 0.14
8.2 GOI 2022 Sovereign 0.07
Sub Total 9.21
PORTFOLIO

January 2021 29
SIP PERFORMANCE ^ - Regular Plan - growth Option
Since Inception SIP 15 year SIP 10 year SIP 5 Year SIP 3 Year SIP 1 Year SIP
Total Amount Invested (` ‘000) 2,390.00 1,800.00 1,200.00 600.00 360.00 120.00
Mkt Value As on January 29, 2021 (` ‘000) $ 13,464.63 5,645.98 2,383.09 800.00 438.54 144.74
Returns (%) $ 15.21 13.99 13.16 11.46 13.27 40.66
Benchmark Returns (%) # N.A. 11.03 11.65 12.71 14.61 35.97
Additional Benchmark Returns (%) ## 14.36 11.51 12.33 13.49 15.30 51.56
Assuming ̀ 10,000 invested systematically on the first Business Day of every month over a period of time. CAGR returns are computed after accounting for the cash flow by using xIRR method (investment internal rate of return) for Regular Plan - Growth Option. The above investment simulation is for illustrative purposes only and should not be construed as a promise on minimum returns and safeguard of capital. N.A. Not Available.
PERFORMANCE ^ - Regular Plan - growth Option
Date Period Scheme Returns
(%) $
Benchmark Returns
(%)#
Additional Benchmark
Returns(%) ##
Value of ` 10,000 invested
Scheme (`) $
Benchmark (`)#
Additional Benchmark(`)##
Jan 31, 20 Last 1 Year 14.67 16.00 15.22 11,462 11,596 11,518
Jan 31, 18 Last 3 Years 6.77 9.84 8.70 12,168 13,247 12,841
Jan 29, 16 Last 5 Years 12.45 12.75 13.94 17,988 18,232 19,214
Mar 02, 01 Since Inception 15.86 N.A. 14.09 187,845 N.A. 138,188
Returns greater than 1 year period are compounded annualized (CAGR). N.A. Not Available. Scheme performance may not strictly be comparable with that of its Additional Benchmark in view of balanced nature of the scheme where a portion of scheme’s investments are made in debt instruments. $ Adjusted for Bonus units declared under the Scheme. For performance of other schemes managed by Chirag Setalvad, please refer page 48. Different plans viz. Regular Plan and Direct Plan have a different expense structure. The expenses of the Direct Plan under the Scheme will be lower to the extent of the distribution expenses / commission charged in the Regular Plan. For Performance of Direct Plan, refer page no. 73.
Face Value per Unit: ` 10 unless otherwise specified, + Industry Classification as recommended by AMFI, Data is as of January 31, 2021 unless otherwise specified.
This product is suitable for investors who are seeking ~
l capital appreciation over long term.
l investment in equity and equity related instruments as well as debt and money market instruments.
VeryHigh
Low to
Moderate
Low
Moderate ModeratelyHigh High
RISKOMETERInvestors understand that their principal will be at
very high risk
~ Investors should consult their financial advisers, if in doubt about whether the product is suitable for them.
^Past performance may or may not be sustained in the future. Load is not taken into consideration for computation of performance.
Portfolio Classification By Asset Class (%)
equity 67.14
G-Sec 9.21
Credit exposure 16.35
Cash, Cash equivalents and Net Current Assets 7.30
Portfolio Classification By Rating Class (%)
equity 67.14
Sovereign 9.21
AAA/AAA(SO)/A1+/A1+(SO) & equivalent 7.41
AA+ 8.94
Cash, Cash equivalents and Net Current Assets 7.30
[An open ended fund for investment for children having a lock-in for atleast 5 years or till the child attains age of majority (whichever is earlier)] ΩπHDFC Children's Gift Fund .....Contd from previous page
Company Industry+ / Rating % to NAV
CREDIT EXPOSURE (NON PERPETUAl)
• Housing Development Finance Corporation Ltd.£ CRISIL - AAA 3.28
• Shriram Transport Finance Company Ltd. CRISIL - AA+ 2.53
LIC Housing Finance Ltd. CRISIL - AAA 1.36
L&T Infrastructure Finance Ltd. CRISIL - AAA 1.04
Tata Sons Ltd. CRISIL - AAA 0.98
State Bank of India CRISIL - AAA 0.68
Power Finance Corporation Ltd. CRISIL - AAA 0.06
Britannia Industries Ltd. CRISIL - AAA 0.01
Sub Total 9.94
Company Industry+ / Rating % to NAV
CREDIT EXPOSURE (PERPETUAl BONDS)
• Axis Bank Ltd. (AT1, BASeL III, Perpetual) CRISIL - AA+ 2.60
• Bank of Baroda (AT1, BASeL III, Perpetual) CRISIL - AA+ 2.48
ICICI Bank Ltd. (AT1, BASeL III, Perpetual) CARE - AA+ 1.05
State Bank of India (AT1, BASeL III, Perpetual) CRISIL - AA+ 0.28
Sub Total 6.41
Total 25.56
Cash, Cash equivalents and Net Current Assets 7.30
Grand Total 100.00
• Top Ten Holdings, £ Co-sponsor
PORTFOLIOIndustry Allocation of Equity Holding (% of Net Assets)
0.26
0.31
0.38
0.56
0.56
0.74
1.24
1.27
1.36
1.37
1.68
1.99
2.30
2.31
2.90
3.87
4.17
6.08
8.72
11.07
14.00
0 2 4 6 8 10121416
Auto
Media & Entertainment
Non - Ferrous Metals
Construction
Ferrous Metals
Power
Healthcare Services
Pesticides
Hotels, Resorts & Other Recreational Activities
Telecom - Services
Consumer Durables
Industrial Capital Goods
Pharmaceuticals
Construction Project
Auto Ancillaries
Consumer Non Durables
Industrial Products
Petroleum Products
Finance
Software
Banks

30 January 2021
CATEgORY OF SCHEME: RETIREMENT FUND
KEY FACTS
INVESTMENT OBjECTIVE
The investment objective of the Scheme is to provide long-term capital appreciation/income by investing in a mix of equity and debt instruments to help investors meet their retirement goals. There is no assurance that the investment objective of the Scheme will be realized.
FUND MANAgER ¥
Chirag Setalvad (Equities) (since February 25, 2016)
Total experience - Over 21 years &Shobhit Mehrotra (Debt) (since February 25, 2016)
Total experience: Over 25 years
INCEPTION DATE (Date of Allotment)
February 25, 2016
NAV (AS ON JANUARY 29, 2021) NAV PER UNIT (`)
Regular Plan 20.319Direct Plan 21.849
ASSETS UNDER MANAgEMENT (`) IN CRORE
As on January 31, 2021 1,249.36Average for Month of January 2021 1,275.10
qUANTITATIVE DATA
Portfolio Turnover Ratio 19.07%
TOTAL ExPENSE RATIO (As on January 31, 2021)Including Additional expenses and Goods and Service Tax on Management Fees
Regular: 2.14% Direct: 1.09%
#BENCHMARK INDEX: NIFTY 500 (Total Returns Index)
##ADDl. BENCHMARK INDEX: NIFTY 50 (Total Returns Index)
EXIT lOAD
Upon completion of lock-in period: Nil
PLANS & OPTIONS
Regular Plan, Direct Plan. Under Each Plan offers Growth Option only.
MINIMUM APPlICATION AMOUNT
Purchase : ` 5,000 and any amount thereafter.Additional Purchase : ` 1,000 and any amount thereafter.
lOCK-IN PERIOD
Existing investments by investors including SIP / STP registrations, etc (until june 1, 2018):
Units purchased cannot be assigned / transferred / pledged / redeemed / switched out until completion of 5 years from the date of allotment of Units under the Scheme.
Fresh investments by investors including SIP / STP registrations, etc (effective june 2, 2018):
Units purchased cannot be assigned / transferred / pledged / redeemed / switched out until completion of 5 years from the date of allotment of Units or Retirement Age of Unit holder (i.e. completion of 60 years), whichever is earlier.
¥ Dedicated Fund Manager for Overseas Investments: Mr. Sankalp Baid (since January 22, 2021) (Total experience: Over 13 years).
Face Value per Unit: ` 10 unless otherwise specified, + Industry Classification as recommended by AMFI, Data is as of January 31, 2021 unless otherwise specified.
PERFORMANCE ^ - Regular Plan - growth Option
Date Period Scheme Returns
(%)
Benchmark Returns
(%)#
Additional Benchmark
Returns (%) ##
Value of ` 10,000 invested
Scheme (`)
Benchmark (`)#
Additional Benchmark
(`)##
Jan 31, 20 Last 1 Year 16.39 15.82 15.22 11,634 11,578 11,518Jan 31, 18 Last 3 Years 5.03 6.49 8.70 11,585 12,073 12,841Feb 25, 16 Since Inception 15.46 15.81 16.06 20,319 20,626 20,842
Returns greater than 1 year period are compounded annualized (CAGR). For performance of other schemes managed by Chirag Setalvad (equities) and Shobhit Mehrotra (Debt), please refer page 67. The Scheme is in existence for more than 1 year but less than 5 years. Different plans viz. Regular Plan and Direct Plan have a different expense structure. The expenses of the Direct Plan under the Scheme will be lower to the extent of the distribution expenses / commission charged in the Regular Plan. For Performance of Direct Plan, refer page no. 79.
This product is suitable for investors who are seeking ~
l a corpus to provide for pension in the form of income to the extent of the redemption value of their holding after the age of 60 years.
l investment predominantly in equity and equity related instruments.
VeryHigh
Low to
Moderate
Low
Moderate ModeratelyHigh High
RISKOMETERInvestors understand that their principal will be at
very high risk~ Investors should consult their financial advisers, if in doubt about whether the product is suitable for them.
^Past performance may or may not be sustained in the future. Load is not taken into consideration for computation of performance.
[An open ended retirement solution oriented scheme having a lock-in of 5 years or till retirement age (whichever is earlier)]HDFC Retirement Savings Fund - Equity Plan
(A notified Tax Savings Cum Pension Scheme)
Company Industry+ / Rating % to NAVEqUITY & EqUITY RElATED• HDFC Bank Ltd. Banks 6.48• Reliance Industries Ltd. Petroleum Products 5.40• ICICI Bank Ltd. Banks 4.99• Infosys Ltd. Software 4.83• Housing Development
Finance Corporation Ltd.£ Finance 4.66• Larsen and Toubro Ltd. Construction Project 3.74• ITC Ltd. Consumer Non Durables 3.09• Cyient Ltd. Software 2.06• Bajaj Electricals Ltd. Consumer Durables 2.05Timken India Ltd. Industrial Products 1.91Bharat electronics Ltd. Industrial Capital Goods 1.86Aurobindo Pharma Ltd. Pharmaceuticals 1.84JB Chemicals & Pharmaceuticals Ltd. Pharmaceuticals 1.80Radico Khaitan Ltd. Consumer Non Durables 1.77Godrej Consumer Products Ltd. Consumer Non Durables 1.67United Spirits Ltd. Consumer Non Durables 1.62Aarti Industries Ltd. Chemicals 1.56Computer Age Management Services Finance 1.56Balkrishna Industries Ltd. Auto Ancillaries 1.55State Bank of India Banks 1.54PNC Infratech Ltd. Construction 1.53Jindal Steel & Power Ltd. Ferrous Metals 1.36Chambal Fertilizers & Chemicals Ltd. Fertilisers 1.35UPL Ltd. Pesticides 1.35KeC International Ltd. Construction Project 1.33Voltamp Transformers Ltd. Industrial Capital Goods 1.26Transport Corporation of India Ltd. Transportation 1.21Hindustan Petroleum Corporation Ltd. Petroleum Products 1.18Mahindra Holidays & Resorts Ind Ltd.
Hotels/Resorts & Other Recreational Activities 1.16
Oracle Financial Ser Software Ltd. Software 1.16Tata Steel Ltd. Ferrous Metals 1.13Atul Ltd. Chemicals 1.12Cholamandalam Investment & Finance Finance 1.11Redington (India) Ltd. Transportation 1.08AkzoNobel India Ltd. Consumer Non Durables 1.07Carborundum Universal Ltd. Industrial Products 1.05engineers India Ltd. Construction Project 1.05The Anup engineering Ltd. Industrial Capital Goods 1.02Finolex Cables Ltd. Industrial Products 0.88Nilkamal Ltd. Industrial Products 0.88Power Grid Corporation of India Ltd. Power 0.88Great eastern Shipping Company Ltd. Transportation 0.82Alkyl Amines Chemicals Ltd. Chemicals 0.81Axis Bank Ltd. Banks 0.79Newgen Software Technologies Ltd. Software 0.78Sharda Cropchem Ltd. Pesticides 0.75Tata Metaliks Ltd. Ferrous Metals 0.75Blue Star Ltd. Consumer Durables 0.71Indian Hotels Company Ltd. Hotels/Resorts & Other
Recreational Activities 0.71Finolex Industries Ltd. Industrial Products 0.69KeI Industries Ltd. Industrial Products 0.65Firstsource Solutions Ltd. Software 0.64Tube Investments of India Ltd. Auto Ancillaries 0.62
Company Industry+ / Rating % to NAVKalpataru Power Transmission Ltd. Power 0.58Tamilnadu Newsprint & Papers Ltd. Paper 0.57T. V. Today Network Ltd. Media & entertainment 0.43Oriental Carbon & Chemicals Ltd. Chemicals 0.40GNA Axles Ltd. Auto Ancillaries 0.35Tata Motors Ltd. DVR Auto 0.34Vedanta Ltd. Non - Ferrous Metals 0.34Zensar Technologies Ltd. Software 0.29Indusind Bank Ltd. Banks 0.27Jagran Prakashan Ltd. Media & entertainment 0.25Apar Industries Ltd. Industrial Capital Goods 0.18CG Power and Industrial Solutions Ltd. Industrial Capital Goods 0.15Greenply Industries Ltd. Consumer Durables 0.12Sub Total 93.13DEBT & DEBT RElATEDCREDIT EXPOSURE (NON PERPETUAl)• Power Finance Corporation Ltd. CRISIL - AAA 2.25Vedanta Ltd. CRISIL - AA- 1.40L&T Infrastructure Finance Ltd. CRISIL - AAA 0.92Shriram Transport Finance Company Ltd. CRISIL - AA+ 0.68Sub Total 5.25CREDIT EXPOSURE (PERPETUAl BONDS)Canara Bank (AT1, BASeL III, Perpetual) CARe - AA 0.28Union Bank of India (AT1, BASeL III, Perpetual) CARe - AA- 0.25Sub Total 0.53Total 5.78Cash, Cash equivalents and Net Current Assets 1.09Grand Total 100.00• Top Ten Holdings, £ Co-sponsor
PORTFOLIO
Industry Allocation of Equity Holding (% of Net Assets)
0.340.340.570.681.351.461.531.872.102.522.883.113.243.643.894.47
6.066.126.587.33
9.229.76
14.07
0 2 4 6 810 121416Auto
Non - Ferrous MetalsPaper
Media & EntertainmentFertilisers
PowerConstruction
Hotels, Resorts & Other Recreational ActivitiesPesticides
Auto AncillariesConsumer Durables
TransportationFerrous Metals
PharmaceuticalsChemicals
Industrial Capital GoodsIndustrial Products
Construction ProjectPetroleum Products
FinanceConsumer Non Durables
SoftwareBanks
SIP PERFORMANCE ^ - Regular Plan - growth Option
Since Inception SIP 3 Year SIP 1 Year SIP
Total Amount Invested (` ‘000) 600.00 360.00 120.00 Mkt Value As on January 29, 2021 (` ‘000) 806.81 443.51 151.63 Returns (%) 11.81 14.05 52.69 Benchmark Returns (%) # 12.68 14.83 53.73 Additional Benchmark Returns (%) ## 13.58 15.30 51.56
Assuming ` 10,000 invested systematically on the first Business Day of every month over a period of time. CAGR returns are computed after accounting for the cash flow by using xIRR method (investment internal rate of return) for Regular Plan - Growth Option. The above investment simulation is for illustrative purposes only and should not be construed as a promise on minimum returns and safeguard of capital.

January 2021 31
Face Value per Unit: ` 10 unless otherwise specified, + Industry Classification as recommended by AMFI, Data is as of January 31, 2021 unless otherwise specified.
[An open ended retirement solution oriented scheme having a lock-in of 5 years or till retirement age (whichever is earlier)]
HDFC Retirement Savings Fund - Hybrid Equity Plan(A notified Tax Savings Cum Pension Scheme)
Company Industry+ / Rating % to
NAV
EqUITY & EqUITY RElATED
• HDFC Bank Ltd. Banks 5.81
• ICICI Bank Ltd. Banks 4.93
• Infosys Ltd. Software 4.63
• Housing Development Finance Corporation Ltd.£ Finance 4.57
• Reliance Industries Ltd. Petroleum Products 4.55
• ITC Ltd. Consumer Non Durables 2.87
• Larsen and Toubro Ltd. Construction Project 2.64
Procter & Gamble Health Ltd. Pharmaceuticals 2.47
Bajaj electricals Ltd. Consumer Durables 1.62
Aurobindo Pharma Ltd. Pharmaceuticals 1.56
Cyient Ltd. Software 1.48
State Bank of India Banks 1.38
engineers India Ltd. Construction Project 1.34
JB Chemicals &
Pharmaceuticals Ltd. Pharmaceuticals 1.32
UTI Asset Management
Company Ltd. Finance 1.31
Suprajit engineering Ltd. Auto Ancillaries 1.30
Chambal Fertilizers &
Chemicals Ltd. Fertilisers 1.23
Balrampur Chini Mills Ltd. Consumer Non Durables 1.13
Bharat electronics Ltd. Industrial Capital Goods 1.10
Timken India Ltd. Industrial Products 1.01
Balkrishna Industries Ltd. Auto Ancillaries 1.00
Oriental Carbon & Chemicals Ltd. Chemicals 1.00
Hindustan Petroleum
Corporation Ltd. Petroleum Products 0.99
Voltamp Transformers Ltd. Industrial Capital Goods 0.99
KeC International Ltd. Construction Project 0.95
Sonata Software Ltd. Software 0.94
Redington (India) Ltd. Transportation 0.92
UPL Ltd. Pesticides 0.91
Cholamandalam Investment
& Finance Finance 0.90
Nilkamal Ltd. Industrial Products 0.87
Power Grid Corporation of
India Ltd. Power 0.87
Carborundum Universal Ltd. Industrial Products 0.86
Mahindra Holidays & Resorts
Ind Ltd.
Hotels/Resorts & Other
Recreational Activities 0.85
Crompton Greaves Consumer
elec. Ltd. Consumer Durables 0.81
Vesuvius India Ltd. Industrial Products 0.74
Axis Bank Ltd. Banks 0.70
Blue Star Ltd. Consumer Durables 0.67
The Anup engineering Ltd. Industrial Capital Goods 0.65
Company Industry+ / Rating % to
NAV
Tata Steel Ltd. Ferrous Metals 0.58
Tamilnadu Newsprint &
Papers Ltd. Paper 0.44
Zensar Technologies Ltd. Software 0.44
Vedanta Ltd. Non - Ferrous Metals 0.42
Kalpataru Power
Transmission Ltd. Power 0.38
NRB Bearing Ltd. Industrial Products 0.38
Shaily engineering Plastics Ltd. Industrial Products 0.37
Cholamandalam Financial
Holdings Ltd. Finance 0.31
SKF India Ltd. Industrial Products 0.30
Shree Pushkar Chemicals &
Fertilisers Ltd. Chemicals 0.23
Lumax Industries Ltd. Auto Ancillaries 0.17
Apar Industries Ltd. Industrial Capital Goods 0.14
Jagran Prakashan Ltd. Media & entertainment 0.13
Sadbhav engineering Ltd. Construction Project 0.11
Yes Bank Ltd. Banks @
Sub Total 68.27
DEBT & DEBT RElATED
gOVERNMENT SECURITIES (CENTRAl/STATE)
7.57 GOI 2033 Sovereign 2.60
6.67 GOI 2050 Sovereign 1.92
Sub Total 4.52
CREDIT EXPOSURE (NON PERPETUAl)
• Power Finance Corporation Ltd. CRISIL - AAA 5.08
• Embassy Office Parks REIT CRISIL - AAA 4.69
• Vedanta Ltd. CRISIL - AA- 2.75
Jamnagar Utilities & Power Pvt. Ltd. (erstwhile Reliance Utilities & Power Pvt. Ltd.) CRISIL - AAA 2.02
L&T Infrastructure Finance Ltd. CRISIL - AAA 1.96
Power Grid Corporation of
India Ltd. CRISIL - AAA 1.03
Reliance Industries Ltd. CRISIL - AAA 0.53
Sub Total 18.06
CREDIT EXPOSURE (PERPETUAl BONDS)
State Bank of India
(AT1, BASeL III, Perpetual) CRISIL - AA+ 1.64
Canara Bank
(AT1, BASeL III, Perpetual) CARe - AA 0.67
Sub Total 2.31
Total 24.89
Cash, Cash equivalents and Net Current Assets 6.84
Grand Total 100.00
• Top Ten Holdings, £ Co-sponsor, @ Less than 0.01%
PORTFOLIO
KEY FACTS
INVESTMENT OBjECTIVE
The investment objective of the Scheme is to provide long-term capital appreciation/income by investing in a mix of equity and debt instruments to help investors meet their retirement goals. There is no assurance that the investment objective of the Scheme will be realized.
FUND MANAgER ¥
Chirag Setalvad (Equities) (since February 25, 2016)
Total experience - Over 21 years &
Shobhit Mehrotra (Debt) (since February 25, 2016)
Total experience: Over 25 years
INCEPTION DATE (Date of Allotment)
February 25, 2016
NAV (AS ON JANUARY 29, 2021) NAV PER UNIT (`)
Regular Plan 20.005Direct Plan 21.506
ASSETS UNDER MANAgEMENT (`) IN CRORE
As on January 31, 2021 531.24Average for Month of January 2021 539.10
qUANTITATIVE DATA
Portfolio Turnover Ratio 17.30%Average Maturity * 5.43 yearsMacaulay Duration * 3.55 yearsModified Duration * 3.39 yearsYield to Maturity * 6.10%* Computed on the invested amount for debt portfolio.
TOTAL ExPENSE RATIO (As on January 31, 2021)Including Additional expenses and Goods and Service Tax on Management Fees
Regular: 2.51% Direct: 1.31%
#BENCHMARK INDEX: NIFTY 50 Hybrid Composite Debt 65:35 Index
##ADDl. BENCHMARK INDEX: NIFTY 50 (Total Returns Index)
EXIT lOAD
Upon completion of lock-in period: Nil
PLANS & OPTIONS
Regular Plan, Direct Plan. Under Each Plan offers Growth Option only.
MINIMUM APPlICATION AMOUNT
Purchase : ` 5,000 and any amount thereafter.Additional Purchase : ` 1,000 and any amount thereafter.
lOCK-IN PERIOD
Existing investments by investors including SIP / STP registrations, etc (until june 1, 2018):
Units purchased cannot be assigned / transferred / pledged / redeemed / switched out until completion of 5 years from the date of allotment of Units under the Scheme.
Fresh investments by investors including SIP / STP registrations, etc (effective june 2, 2018):
Units purchased cannot be assigned / transferred / pledged / redeemed / switched out until completion of 5 years from the date of allotment of Units or Retirement Age of Unit holder (i.e. completion of 60 years), whichever is earlier.
¥ Dedicated Fund Manager for Overseas Investments: Mr. Sankalp Baid (since January 22, 2021) (Total experience: Over 13 years).
(The Plan underwent Change in Fundamental Attributes i.e. change in Asset Allocation Pattern w.e.f. March 14, 2019).
CATEgORY OF SCHEME: RETIREMENT FUND

32 January 2021
Portfolio Classification By Asset Class (%)
n equity 68.27
n G-Sec 4.52
n Credit exposure 20.37
n Cash, Cash equivalents and Net Current Assets 6.84
Portfolio Classification By Rating Class (%)
n equity 68.27n Sovereign 4.52n AAA/AAA(SO)/A1+/A1+(SO) &
equivalent 15.31n AA+ 1.64n AA/AA- 3.42n Cash, Cash equivalents and Net
Current Assets 6.84
This product is suitable for investors who are seeking ~
l a corpus to provide for pension in the form of income to the extent of the redemption value of their holding after the age of 60 years.
l investment predominantly in equity and equity related instruments & balance in debt and money market instruments.
VeryHigh
Low to
Moderate
Low
Moderate ModeratelyHigh High
RISKOMETERInvestors understand that their principal will be at
very high risk
~ Investors should consult their financial advisers, if in doubt about whether the product is suitable for them.
PERFORMANCE ^ - Regular Plan - growth Option
Date Period Scheme Returns
(%)
Benchmark Returns
(%)#
Additional Benchmark
Returns (%) ##
Value of ` 10,000 invested
Scheme (`)
Benchmark (`)#
Additional Benchmark
(`)##
Jan 31, 20 Last 1 Year 14.81 16.00 15.22 11,477 11,596 11,518
Jan 31, 18 Last 3 Years 7.20 9.84 8.70 12,316 13,247 12,841
Feb 25, 16 Since Inception 15.10 14.23 16.06 20,005 19,270 20,842
Returns greater than 1 year period are compounded annualized (CAGR). Scheme performance may not strictly be comparable with that of its Additional Benchmark in view of hybrid nature of the scheme where a portion of scheme’s investments are made in debt instruments. The Scheme is in existence for more than 1 year but less than 5 years. For performance of other schemes managed by Chirag Setalvad (equities) and Shobhit Mehrotra (Debt), please refer page 67. Different plans viz. Regular Plan and Direct Plan have a different expense structure. The expenses of the Direct Plan under the Scheme will be lower to the extent of the distribution expenses / commission charged in the Regular Plan. For Performance of Direct Plan, refer page no. 79.
^Past performance may or may not be sustained in the future. Load is not taken into consideration for computation of performance.
[An open ended retirement solution oriented scheme having a lock-in of 5 years or till retirement age(whichever is earlier)]
HDFC Retirement Savings Fund - Hybrid Equity Plan(A notified Tax Savings Cum Pension Scheme)
Industry Allocation of Equity Holding (% of Net Assets)
0.130.420.440.580.850.910.921.231.231.25
2.472.883.104.004.535.045.355.54
7.097.49
12.82
0 2 4 6 8 101214
Media & EntertainmentNon - Ferrous Metals
PaperFerrous Metals
Hotels, Resorts & Other Recreational ActivitiesPesticides
TransportationChemicalsFertilisers
PowerAuto Ancillaries
Industrial Capital GoodsConsumer Durables
Consumer Non DurablesIndustrial Products
Construction ProjectPharmaceuticals
Petroleum ProductsFinance
SoftwareBanks
.....Contd from previous page
SIP PERFORMANCE ^ - Regular Plan - growth Option
Since Inception SIP 3 Year SIP 1 Year SIP
Total Amount Invested (` ‘000) 600.00 360.00 120.00
Mkt Value As on January 29, 2021 (` ‘000) 809.14 440.71 145.61
Returns (%) 11.93 13.61 42.17
Benchmark Returns (%) # 12.77 14.61 35.97
Additional Benchmark Returns (%) ## 13.58 15.30 51.56
Assuming ` 10,000 invested systematically on the first Business Day of every month over a period of time. CAGR returns are computed after accounting for the cash flow by using xIRR method (investment internal rate of return) for Regular Plan - Growth Option. The above investment simulation is for illustrative purposes only and should not be construed as a promise on minimum returns and safeguard of capital.

January 2021 33
CATEgORY OF SCHEME: RETIREMENT FUND
KEY FACTS
INVESTMENT OBjECTIVEThe investment objective of the Scheme is to provide long-term capital appreciation/income by investing in a mix of equity and debt instruments to help investors meet their retirement goals. There is no assurance that the investment objective of the Scheme will be realized.
FUND MANAgER ¥
Chirag Setalvad (Equities) (since February 26, 2016)
Total experience - Over 21 years &Shobhit Mehrotra (Debt) (since February 26, 2016)
Total experience: Over 25 years
INCEPTION DATE (Date of Allotment)February 26, 2016
NAV (AS ON JANUARY 29, 2021) NAV PER UNIT (`)Regular Plan 15.1543Direct Plan 16.2198
ASSETS UNDER MANAgEMENT (`) IN CROREAs on January 31, 2021 109.59Average for Month of January 2021 105.90
qUANTITATIVE DATAAverage Maturity * 6.66 yearsMacaulay Duration * 4.31 yearsModified Duration * 4.15 yearsYield to Maturity * 5.91%* Computed on the invested amount for debt portfolio.
TOTAL ExPENSE RATIO (As on January 31, 2021)Including Additional expenses and Goods and Service Tax on Management FeesRegular: 2.32% Direct: 1.17%
#BENCHMARK INDEX: NIFTY 50 Hybrid Composite Debt 15:85 Index##ADDl. BENCHMARK INDEX: CRISIL 10 Year Gilt Index
EXIT lOADUpon completion of lock-in period: Nil
PLANS & OPTIONSRegular Plan, Direct Plan. Under Each Plan offers Growth Option only.MINIMUM APPlICATION AMOUNTPurchase : ` 5,000 and any amount thereafter.Additional Purchase : ` 1,000 and any amount thereafter.
lOCK-IN PERIODExisting investments by investors including SIP / STP registrations, etc (until june 1, 2018):Units purchased cannot be assigned / transferred / pledged / redeemed / switched out until completion of 5 years from the date of allotment of Units under the Scheme. Fresh investments by investors including SIP / STP registrations, etc (effective june 2, 2018): Units purchased cannot be assigned / transferred / pledged / redeemed / switched out until completion of 5 years from the date of allotment of Units or Retirement Age of Unit holder (i.e. completion of 60 years), whichever is earlier.
¥ Dedicated Fund Manager for Overseas Investments: Mr. Sankalp Baid (since January 22, 2021) (Total experience: Over 13 years).
Face Value per Unit: ` 10 unless otherwise specified, + Industry Classification as recommended by AMFI, Data is as of January 31, 2021 unless otherwise specified.
PERFORMANCE ^ - Regular Plan - growth OptionDate Period Scheme
Returns (%)
Benchmark Returns
(%)#
Additional Benchmark
Returns (%) ##
Value of ` 10,000 investedScheme
(`)Benchmark
(`)#Additional
Benchmark (`)##
Jan 31, 20 Last 1 Year 9.19 13.22 9.14 10,917 11,318 10,911Jan 31, 18 Last 3 Years 6.22 9.96 9.04 11,982 13,292 12,963Feb 26, 16 Since Inception 8.80 10.54 8.10 15,154 16,384 14,677
Returns greater than 1 year period are compounded annualized (CAGR). Scheme performance may not strictly be comparable with that of its Additional Benchmark in view of hybrid nature of the scheme where a portion of scheme’s investments are made in equity instruments. The Scheme is in existence for more than 1 year but less than 5 years. For performance of other schemes managed by Chirag Setalvad (equities) and Shobhit Mehrotra (Debt), please refer page 67. Different plans viz. Regular Plan and Direct Plan have a different expense structure. The expenses of the Direct Plan under the Scheme will be lower to the extent of the distribution expenses / commission charged in the Regular Plan. For Performance of Direct Plan, refer page no. 79.
This product is suitable for investors who are seeking ~
l a corpus to provide for pension in the form of income to the extent of the redemption value of their holding after the age of 60 years.
l investment predominantly in debt and money market instruments & balance in equity and equity related instruments.
VeryHigh
Low to
Moderate
Low
Moderate ModeratelyHigh High
RISKOMETERInvestors understand that their principal will be at
moderately high risk~ Investors should consult their financial advisers, if in doubt about whether the product is suitable for them.
^Past performance may or may not be sustained in the future. Load is not taken into consideration for computation of performance.
Portfolio Classification By Asset Class (%)
n equity 13.63
n G-Sec 31.02
n Credit exposure 34.62
n Cash, Cash equivalents and Net Current Assets 20.73
Portfolio Classification By Rating Class (%)
n equity 13.63n Sovereign 31.02n AAA/AAA(SO)/A1+/A1+(SO)
& equivalent 16.66n AA+ 6.72n AA/AA- 11.24n Cash, Cash equivalents and
Net Current Assets 20.73
[An open ended retirement solution oriented scheme having a lock-in of 5 years or till retirement age (whichever is earlier)]
HDFC Retirement Savings Fund - Hybrid Debt Plan(A notified Tax Savings Cum Pension Scheme)
SIP PERFORMANCE ^ - Regular Plan - growth Option
Since Inception SIP 3 Year SIP 1 Year SIP
Total Amount Invested (` ‘000) 600.00 360.00 120.00 Mkt Value As on January 29, 2021 (` ‘000) 729.85 410.80 129.18 Returns (%) 7.78 8.78 14.60 Benchmark Returns (%) # 10.26 11.88 14.83 Additional Benchmark Returns (%) ## 7.83 9.36 5.72
Assuming ` 10,000 invested systematically on the first Business Day of every month over a period of time. CAGR returns are computed after accounting for the cash flow by using xIRR method (investment internal rate of return) for Regular Plan - Growth Option. The above investment simulation is for illustrative purposes only and should not be construed as a promise on minimum returns and safeguard of capital.
Company Industry+ / Rating % to NAVEqUITY & EqUITY RElATEDICICI Bank Ltd. Banks 1.21HDFC Bank Ltd. Banks 1.12Reliance Industries Ltd. Petroleum Products 0.69Infosys Ltd. Software 0.65Indigo Paints Ltd. Consumer Non Durables 0.52ITC Ltd. Consumer Non Durables 0.46Coforge Ltd. Software 0.44Chambal Fertilizers & Chemicals Ltd. Fertilisers 0.43Larsen and Toubro Ltd. Construction Project 0.40Bajaj electricals Ltd. Consumer Durables 0.37Redington (India) Ltd. Transportation 0.37Tata Steel Ltd. Ferrous Metals 0.36Avanti Feeds Ltd. Consumer Non Durables 0.35Axis Bank Ltd. Banks 0.35Finolex Cables Ltd. Industrial Products 0.35Carborundum Universal Ltd. Industrial Products 0.33Timken India Ltd. Industrial Products 0.33Voltamp Transformers Ltd. Industrial Capital Goods 0.33JB Chemicals & Pharmaceuticals Ltd. Pharmaceuticals 0.27Newgen Software Technologies Ltd. Software 0.27Blue Star Ltd. Consumer Durables 0.26The Anup engineering Ltd. Industrial Capital Goods 0.26Lumax Industries Ltd. Auto Ancillaries 0.25GNA Axles Ltd. Auto Ancillaries 0.24State Bank of India Banks 0.24Transport Corporation of India Ltd. Transportation 0.23Mahindra Holidays & Resorts Ind Ltd.
Hotels/Resorts & Other Recreational Activities 0.22
Oriental Carbon & Chemicals Ltd. Chemicals 0.21Vesuvius India Ltd. Industrial Products 0.21SKF India Ltd. Industrial Products 0.19Nilkamal Ltd. Industrial Products 0.18Aurobindo Pharma Ltd. Pharmaceuticals 0.17Navneet education Ltd. Media & entertainment 0.17Hindustan Petroleum Corporation Ltd. Petroleum Products 0.15Power Grid Corporation of India Ltd. Power 0.15Insecticides (India) Ltd. Pesticides 0.14
Company Industry+ / Rating % to NAVKalpataru Power Transmission Ltd. Power 0.14NRB Bearing Ltd. Industrial Products 0.14Time Technoplast Ltd. Industrial Products 0.12Apar Industries Ltd. Industrial Capital Goods 0.10Poddar Pigments Ltd. Chemicals 0.10Bank of Baroda Banks 0.08Tamilnadu Newsprint & Papers Ltd. Paper 0.05Sadbhav engineering Ltd. Construction Project 0.03Sub Total 13.63DEBT & DEBT RElATEDgOVERNMENT SECURITIES (CENTRAl/STATE)• 6.19 GOI 2034 Sovereign 9.00• 7.57 GOI 2033 Sovereign 7.56• 7.5 GOI 2034 Sovereign 5.02• 6.79 GOI 2029 Sovereign 4.79• 6.67 GOI 2050 Sovereign 4.65Sub Total 31.02CREDIT EXPOSURE (NON PERPETUAl)• Vedanta Ltd. CRISIL - AA- 6.22• L&T Infrastructure Finance Ltd. CRISIL - AAA 6.18• Indian Railways Finance
Corporation Ltd. CRISIL - AAA 5.07• Shriram Transport Finance
Company Ltd. CRISIL - AA+ 2.52Jamnagar Utilities & Power Pvt. Ltd. (erstwhile Reliance Utilities & Power Pvt. Ltd.) CRISIL - AAA 2.45Reliance Industries Ltd. CRISIL - AAA 1.93Tata Motors Ltd. CARe - AA- 1.29Power Finance Corporation Ltd. CRISIL - AAA 1.03Sub Total 26.69CREDIT EXPOSURE (PERPETUAl BONDS)• State Bank of India
(AT1, BASeL III, Perpetual) CRISIL - AA+ 4.20Union Bank of India (AT1, BASeL III, Perpetual) CARe - AA- 1.89Canara Bank (AT1, BASeL III, Perpetual) CARe - AA 1.84Sub Total 7.93Total 65.64Cash, Cash equivalents and Net Current Assets 20.73Grand Total 100.00• Top Ten Holdings
PORTFOLIO

34 January 2021
CATEgORY OF SCHEME: EqUITY SAVINGS FUND
KEY FACTS
INVESTMENT OBjECTIVE
To provide capital appreciation by investing in equity & equity related instruments, Arbitrage opportunities, and Debt & money market instruments.There is no assurance that the investment objective of the Scheme will be realized.
FUND MANAgER ¥
gopal Agrawal (equities) (since July 16, 2020)
Total experience: Over 16 years
Krishan Kumar Daga (Arbitrage) (since January 08, 2016)
Total experience: Over 22 years
Arun Agarwal (Arbitrage) (since August 24, 2020)
Total experience: Over 22 years
Anil Bamboli (Debt) (since September 17, 2004)
Total experience: Over 23 years
INCEPTION DATE (Date of Allotment)
September 17, 2004
NAV (AS ON JANUARY 29, 2021) NAV PER UNIT (`)
Regular Plan - Growth Option 40.907Regular Plan - Dividend Option 11.063Direct Plan - Growth Option 43.984Direct Plan - Dividend Option 12.175
ASSETS UNDER MANAgEMENT (`) IN CRORE
As on January 31, 2021 2,416.43Average for Month of January 2021 2,522.49
qUANTITATIVE DATA
Portfolio Turnover Ratio 32.27%Average Maturity * 1.80 yearsMacaulay Duration * 1.48 yearsModified Duration * 1.39 yearsYield to Maturity * 5.85%
* Computed on the invested amount for debt portfolio.
TOTAL ExPENSE RATIO (As on January 31, 2021)Including Additional expenses and Goods and Service Tax on Management Fees
Regular: 2.20% Direct: 1.35%
#BENCHMARK INDEX: 40% NIFTY 50 Arbitrage Index, 30% CRISIL Short Term Bond Fund Index and 30% NIFTY 50 (Total Returns Index)
##ADDl. BENCHMARK INDEX: NIFTY 50 (Total Returns Index)
EXIT lOAD
l In respect of each purchase / switch-in of Units, upto 15% of the units may be redeemed without any exit load from the date of allotment.
l Any redemption in excess of the above limit shall be subject to the following exit load:
n exit load of 1.00% is payable if Units are redeemed / switched-out within 1 year from the date of allotment of units.
l No exit Load is payable if Units are redeemed / switched-out after 1 year from the date of allotment.
For further details, please refer to para ‘Exit Load’ on Pg 67.
PLANS & OPTIONS
Regular Plan, Direct Plan. Under each Plan : Growth & Dividend. The Dividend Option offers Dividend Payout and Reinvestment facility.
MINIMUM APPlICATION AMOUNT
Purchase : ` 5,000 and any amount thereafter.Additional Purchase : ` 1,000 and any amount thereafter.
¥ Dedicated Fund Manager for Overseas Investments: Mr. Sankalp Baid (since January 22, 2021) (Total experience: Over 13 years).
This product is suitable for investors who are seeking ~l capital appreciation while generating income over medium to
long term.l provide capital appreciation and income distribution to the
investors by using equity and equity related instruments, arbitrage opportunities, and investments in debt and money market instruments.
VeryHighLow
to
Moderate
Low
Moderate ModeratelyHigh High
RISKOMETERInvestors understand that their principal will be at
moderately high risk~ Investors should consult their financial advisers, if in doubt about whether the product is suitable for them.
SIP PERFORMANCE ^ - Regular Plan - growth OptionSince Inception SIP 15 year SIP 10 year SIP 5 Year SIP 3 Year SIP 1 Year SIP
Total Amount Invested (` ‘000) 1,970.00 1,800.00 1,200.00 600.00 360.00 120.00 Mkt Value As on January 29, 2021 (` ‘000) 4,308.06 3,655.15 1,862.10 729.05 408.25 134.90 Returns (%) 8.89 8.88 8.51 7.73 8.35 24.00 Benchmark Returns (%) # N.A. N.A. 8.84 8.71 9.36 17.08 Additional Benchmark Returns (%) ## 12.19 11.51 12.33 13.49 15.30 51.56
Assuming ` 10,000 invested systematically on the first Business Day of every month over a period of time. CAGR returns are computed after accounting for the cash flow by using xIRR method (investment internal rate of return) for Regular Plan - Growth Option. The above investment simulation is for illustrative purposes only and should not be construed as a promise on minimum returns and safeguard of capital. N.A. Not Available.
PERFORMANCE ^ - Regular Plan - growth OptionDate Period^^ Scheme
Returns (%)
Benchmark Returns
(%)#
Additional Benchmark
Returns (%) ##
Value of ` 10,000 investedScheme (`) Benchmark
(`)#Additional
Benchmark (`)##
Jan 31, 20 Last 1 Year 9.00 9.08 15.22 10,898 10,905 11,518Jan 31, 18 Last 3 Years 4.86 7.50 8.70 11,528 12,420 12,841Jan 29, 16 Last 5 Years 9.62 8.90 13.94 15,834 15,325 19,214Sep 17, 04 Since Inception 8.98 N.A. 14.84 40,907 N.A. 96,431
^^Effective December 16, 2015, certain changes, including changes to fundamental attributes, were effected in the erstwhile HDFC Multiple Yield Fund, (an open ended income scheme) which was renamed as HDFC Equity Savings Fund, an open ended equity scheme. On account of these changes, the performance during the period(s) from September 17, 2004 to December 15, 2015 is not comparable.Returns greater than 1 year period are compounded annualized (CAGR). N.A. Not Available. Scheme performance may not strictly be comparable with that of its Additional Benchmark, since a portion of scheme’s investments are made in debt instruments. Performance of dividend option under the schemes for the investors would be net of distribution tax, if any. For performance of other schemes managed by Gopal Agrawal (Equities), Krishan Kumar Daga (Arbitrage), Arun Agarwal (Arbitrage) and Anil Bamboli (Debt), please refer page 67. Different plans viz. Regular Plan and Direct Plan have a different expense structure. The expenses of the Direct Plan under the Scheme will be lower to the extent of the distribution expenses / commission charged in the Regular Plan. For Performance of Direct Plan, refer page no. 80.^Past performance may or may not be sustained in the future. Load is not taken into consideration for computation of performance.
Face Value per Unit: ` 10 unless otherwise specified, + Industry Classification as recommended by AMFI, Data is as of January 31, 2021 unless otherwise specified. ...Contd on next page
Portfolio Classification By Rating Class (%)
n equity 66.50n Sovereign 7.27n AAA/AAA(SO)/A1+/A1+(SO)
& equivalent 3.26n AA/AA- 15.18n Cash, Cash equivalents and
Net Current Assets 7.79
(An open ended scheme investing in equity, arbitrage and debt)HDFC Equity Savings Fund
Industry Allocation of Equity Holding (% of Net Assets)
0.12
0.57
0.59
0.67
0.81
1.02
1.29
1.34
1.71
1.85
1.88
2.02
2.74
3.14
3.49
4.74
11.63
0 2 4 6 8 10 12
Cement
Aerospace & Defence
Minerals/Mining
Ferrous Metals
Construction
Telecom - Services
Gas
Transportation
Finance
Consumer Non Durables
Power
Pharmaceuticals
Construction Project
Industrial Capital Goods
Petroleum Products
Software
Banks

January 2021 35
Face Value per Unit: ` 10 unless otherwise specified, + Industry Classification as recommended by AMFI, CD - Certificate of Deposit; CP - Commercial Papers. Data is as of January 31, 2021 unless otherwise specified.
(An open ended scheme investing in equity, arbitrage and debt) .....Contd from previous pageHDFC Equity Savings Fund
Company Industry+ / Rating % to NAV (Hedged & Unhedged)
% exposure of Derivative
EqUITY & EqUITY RElATED
• Housing Development Finance Corporation Ltd.£ Finance 8.61 8.61
• Reliance Industries Ltd. Petroleum Products 4.79 2.52
• ICICI Bank Ltd. Banks 4.27 0.00
• Infosys Ltd. Software 4.24 0.00
• HDFC Bank Ltd. Banks 3.65 0.00
• State Bank of India Banks 3.51 0.52
• Sun Pharmaceutical Industries Ltd. Pharmaceuticals 2.76 2.74
• Dr Reddys Laboratories Ltd. Pharmaceuticals 2.63 2.63
Larsen and Toubro Ltd. Construction Project 2.63 0.14
Bharti Airtel Ltd. Telecom - Services 2.14 1.12
Tata Steel Ltd. Ferrous Metals 1.82 1.15
SBI Cards and Payment Services Ltd. Finance 1.31 0.00
GAIL (India) Ltd. Gas 1.29 0.00
Axis Bank Ltd. Banks 1.26 0.54
Titan Company Ltd. Consumer Durables 1.17 1.17
Mahindra & Mahindra Ltd. Auto 1.13 1.13
JSW Steel Ltd. Ferrous Metals 1.11 1.11
Grasim Industries Ltd. Cement 1.06 1.06
Lupin Ltd. Pharmaceuticals 1.04 0.35
BeML Ltd. Industrial Capital Goods 0.98 0.00
Gujarat Pipavav Port Ltd. Transportation 0.92 0.00
Bharat Petroleum Corporation Ltd. Petroleum Products 0.88 0.00
Aurobindo Pharma Ltd. Pharmaceuticals 0.81 0.21
NTPC Ltd. Power 0.75 0.00
Cipla Ltd. Pharmaceuticals 0.71 0.00
Titagarh Wagons Ltd. Industrial Capital Goods 0.69 0.00
Bharat electronics Ltd. Industrial Capital Goods 0.67 0.00
ITC Ltd. Consumer Non Durables 0.63 0.00
emami Ltd. Consumer Non Durables 0.60 0.00
Coal India Ltd. Minerals/Mining 0.59 0.00
Power Grid Corporation of India Ltd. Power 0.59 0.00
Hindustan Aeronautics Ltd. Aerospace & Defence 0.57 0.00
JMC Projects (India) Ltd. Construction 0.55 0.00
NHPC Ltd. Power 0.54 0.00
Tata Consumer Products Ltd. Consumer Non Durables 0.51 0.00
Newgen Software Technologies Ltd. Software 0.50 0.00
Maruti Suzuki India Ltd. Auto 0.45 0.45
elecon engineering Comapny Ltd. Industrial Capital Goods 0.44 0.00
Container Corporation of India Ltd. Transportation 0.42 0.00
Power Finance Corporation Ltd. Finance 0.40 0.00
Texmaco Rail & engineering Ltd. Industrial Capital Goods 0.36 0.00
The Federal Bank Ltd. Banks 0.36 0.36
Hindustan Petroleum Corporation Ltd. Petroleum Products 0.34 0.00
United Spirits Ltd. Consumer Non Durables 0.33 0.22
Max Financial Services Ltd. Finance 0.29 0.29
ITD Cementation India Ltd. Construction 0.26 0.00
Ashoka Buildcon Ltd. Construction Project 0.25 0.00
Cadila Healthcare Ltd. Pharmaceuticals 0.21 0.21
Company Industry+ / Rating % to NAV (Hedged & Unhedged)
% exposure of Derivative
Orient Cement Ltd. Cement 0.12 0.00
Tech Mahindra Ltd. Software 0.11 0.11
Pidilite Industries Ltd. Chemicals 0.10 0.10
UltraTech Cement Ltd. Cement 0.09 0.09
Adani Ports & Special economic Zone Transportation 0.06 0.06
Biocon Ltd. Pharmaceuticals @
S Chand and Company Ltd. Media & entertainment @Sub Total 66.50
Preference Shares
Zee entertainment enterprises Ltd. Media & entertainment @
Sub Total @
Total 66.50
DEBT & DEBT RElATED
gOVERNMENT SECURITIES (CENTRAl/STATE)
7.59 GOI 2026 Sovereign 0.68
6.97 GOI 2026 Sovereign 0.44
Sub Total 1.12
T-BIllS
364 Days Tbill - Mat 150721 Sovereign 2.04
182 Days Tbill Mat 040321 Sovereign 1.03
364 Days Tbill Mat 250321 Sovereign 1.03
364 Days Tbill Mat 300321 Sovereign 1.03
364 Days Tbill Mat 220721 Sovereign 1.02
Sub Total 6.15
CREDIT EXPOSURE (NON PERPETUAl)
Power Finance Corporation Ltd. CRISIL - AAA 2.16
Vedanta Ltd. CRISIL - AA- 2.02
Shriram City Union Finance Ltd. CRISIL - AA 1.66
Indian Railways Finance Corporation Ltd. CRISIL - AAA 1.10
INOx Wind Infrastructure Services Ltd. CRISIL - AA(Ce) 0.62
Aarish Solar Power Pvt. Ltd. (Greenko) CARe - AA(Ce) 0.45
Sub Total 8.01
CREDIT EXPOSURE (PERPETUAl BONDS)
• Punjab National Bank (AT1, BASEL III, Perpetual) CRISIL - AA- 3.42
• Canara Bank (AT1, BASEL III, Perpetual) CARe - AA 2.76
Union Bank of India (AT1, BASeL III, Perpetual) IND - AA 2.13
Canara Bank (AT1, BASeL III, Perpetual) CRISIL - AA 1.06
Bank of Baroda (AT1, BASeL III, Perpetual) CARe - AA 0.43
Punjab National Bank (AT1, BASeL III, Perpetual) IND - AA 0.38
Union Bank of India (AT1, BASeL III, Perpetual) CARe - AA- 0.21
Union Bank of India (AT1, BASeL III, Perpetual) CRISIL - AA- 0.04
Sub Total 10.43
Total 25.71
Cash, Cash equivalents and Net Current Assets 7.79
Grand Total 100.00
• Top Ten Holdings, £ Co-sponsor, @ Less than 0.01%
Outstanding exposure in derivative instruments (` in Crore) 652.14
Hedged position in Equity & Equity related instruments
Outstanding derivative exposure (% age) 26.99
PORTFOLIO

36 January 2021
CATEgORY OF SCHEME: CONSERVATIVE HYBRID FUND
KEY FACTS
INVESTMENT OBjECTIVE
To generate income / capital appreciation by investing primarily in debt securities, money market instruments and moderate exposure to equities.
There is no assurance that the investment objective of the Scheme will be realized.
FUND MANAgER ¥
Prashant Jain (equities) (since December 26, 2003)
Total experience: Over 27 years &Shobhit Mehrotra (Debt) (since September 1, 2007)
Total experience: Over 25 years
INCEPTION DATE (Date of Allotment)
December 26, 2003
NAV (AS ON JANUARY 29, 2021) NAV PER UNIT (`)
Regular Plan - Growth Option 52.4497Regular Plan - Monthly Dividend Option 12.7226Regular Plan - Quarterly Dividend Option 13.4936Direct Plan - Growth Option 54.5848Direct Plan - Monthly Dividend Option 13.4920Direct Plan - Quarterly Dividend Option 14.3019
ASSETS UNDER MANAgEMENT (`) IN CRORE
As on January 31, 2021 2,431.88Average for Month of January 2021 2,456.19
qUANTITATIVE DATA
Average Maturity * 4.58 yearsMacaulay Duration * 3.52 yearsModified Duration * 3.35 yearsYield to Maturity * 7.32%* Computed on the invested amount for debt portfolio.
TOTAL ExPENSE RATIO (As on January 31, 2021)Including Additional expenses and Goods and Service Tax on Management Fees
Regular: 1.88% Direct: 1.47%
#BENCHMARK INDEX: NIFTY 50 Hybrid Composite Debt 15:85 Index
##ADDl. BENCHMARK INDEX: CRISIL 10 year Gilt Index
EXIT lOAD
l In respect of each purchase / switch-in of Units, 15% of the Units (“the limit”) may be redeemed without any exit load from the date of allotment.
l Any redemption in excess of the limit shall be subject to the following exit load:
n exit load of 1.00% is payable if Units are redeemed / switched-out within 1 year from the date of allotment of units.
l No exit load is payable if Units are redeemed / switched-out after 1 year from the date of allotment.
For further details, please refer to para ‘Exit Load’ on Pg 67.
PLANS & OPTIONS
Regular Plan, Direct Plan. Under each Plan : Growth, Monthly Dividend & Quarterly Dividend Option. The Dividend Option offers Dividend Payout and Reinvestment facility.
MINIMUM APPlICATION AMOUNT
Purchase: (Growth & Quarterly Dividend Option) - ` 5,000 and any amount thereafter. (Monthly Dividend Option) - ` 25,000 and any amount thereafter.Additional Purchase : ` 1,000 and any amount thereafter.
¥ Dedicated Fund Manager for Overseas Investments: Mr. Sankalp Baid (since January 22, 2021) (Total experience: Over 13 years).
Face Value per Unit: ` 10 unless otherwise specified, + Industry Classification as recommended by AMFI, CD - Certificate of Deposit; CP - Commercial Papers. Data is as of January 31, 2021 unless otherwise specified.
Company Industry+ / Rating % to NAV
EqUITY & EqUITY RElATED
State Bank of India Banks 1.86
ICICI Bank Ltd. Banks 1.76
ITC Ltd. Consumer Non Durables 1.59
Infosys Ltd. Software 1.54
Larsen and Toubro Ltd. Construction Project 1.47
Axis Bank Ltd. Banks 1.16
NTPC Ltd. Power 1.11
Power Finance Corporation Ltd. Finance 0.96
IRB Infrastructure Developers Ltd. Construction 0.91
Lupin Ltd. Pharmaceuticals 0.83
ReC Ltd. Finance 0.82
Coal India Ltd. Minerals/Mining 0.78
SBI Cards and Payment Services Ltd. Finance 0.65
Bharti Airtel Ltd. Telecom - Services 0.63
Cipla Ltd. Pharmaceuticals 0.61
NHPC Ltd. Power 0.60
Sun Pharmaceutical Industries Ltd. Pharmaceuticals 0.60
Ambuja Cements Ltd. Cement 0.53
Apar Industries Ltd. Industrial Capital Goods 0.50
Mishra Dhatu Nigam Ltd. Ferrous Metals 0.50
Power Grid Corporation of India Ltd. Power 0.50
Aurobindo Pharma Ltd. Pharmaceuticals 0.49
Chambal Fertilizers & Chemicals Ltd. Fertilisers 0.48
Hindustan Petroleum Corporation Ltd. Petroleum Products 0.44
HCL Technologies Ltd. Software 0.38
Bharat Petroleum Corporation Ltd. Petroleum Products 0.34
CG Power and Industrial Solutions Ltd. Industrial Capital Goods 0.29
MeP Infrastructure Developers Ltd. Transportation 0.28
Vedanta Ltd. Non - Ferrous Metals 0.28
Texmaco Rail & engineering Ltd. Industrial Capital Goods 0.19
Union Bank of India Banks 0.14
Burger King India Ltd. Consumer Non Durables 0.05
elecon engineering Comapny Ltd. Industrial Capital Goods 0.03
Titagarh Wagons Ltd. Industrial Capital Goods 0.02
Tata Motors Ltd. DVR Auto @
Sub Total 23.32
DEBT & DEBT RElATED
gOVERNMENT SECURITIES (CENTRAl/STATE)
• 5.77 GOI 2030 Sovereign 3.65
6.19 GOI 2034 Sovereign 2.03
6.68 GOI 2031 Sovereign 1.06
5.85 GOI 2030 Sovereign 0.61
6.97 GOI 2026 Sovereign 0.44
7.17 GOI 2028 Sovereign 0.44
6.79 GOI 2029 Sovereign 0.43
6.67 GOI 2050 Sovereign 0.42
Company Industry+ / Rating % to NAV
GOI 2023 Sovereign 0.33
6.45 GOI 2029 Sovereign 0.21
8.10% Tamil Nadu SDL - Mat 110325 Sovereign 0.11
7.73 GOI 2034 Sovereign 0.02
8.15 GOI 2026 Sovereign 0.02
Sub Total 9.77
CREDIT EXPOSURE (NON PERPETUAl)
• Vedanta Ltd. CRISIL - AA- 5.49
• TATA Housing Development Co Ltd. CARe - AA 5.18
• Pipeline Infrastructure Pvt. Ltd. CRISIL - AAA 4.49
• Sikka Port and Terminal Ltd. (erstwhile Reliance Ports and Terminals Ltd.) CRISIL - AAA 4.42
• Tata Motors Ltd. CRISIL - AA- 4.19
• DLF Ltd. ICRA - A+ 4.05
• Shriram City Union Finance Ltd. CARe - AA / CRISIL - AA 3.09
• Indian Railways Finance Corporation Ltd. CRISIL - AAA 3.00
• Shriram Transport Finance Company Ltd. CRISIL - AA+ 2.89
Talwandi Sabo Power Ltd. (Corporate Guarantee of Vedanta Ltd.) CRISIL - AA-(Ce) 2.82
ReC Ltd. CRISIL - AAA 2.62
Power Finance Corporation Ltd. CRISIL - AAA 2.35
Housing and Urban Development Corporation Ltd. CARe - AAA 2.29
National Highways Authority of India CRISIL - AAA 2.25
Andhra Pradesh expressway Ltd. (NHAI Annuity) ICRA - AAA 1.56
L&T Infrastructure Finance Ltd. CRISIL - AAA 1.46
National Bank for Agriculture & Rural Development CRISIL - AAA 1.33
First Business Receivables Trust (PTC backed by receivables from Reliance Corporate IT Park Ltd.) CRISIL - AAA(SO) 1.27
embassy Office Parks ReIT CRISIL - AAA 1.03
Hazaribagh Ranchi expressway Ltd. (NHAI Annuity) CARe - D 0.85
Coastal Gujarat Power Ltd. (Corporate Guarantee of Tata Power) CARe - AA(Ce) 0.81
JM Financial Products Ltd. ICRA - AA 0.26
Power Grid Corporation of India Ltd. CRISIL - AAA 0.24
Bharati Telecom Ltd. CRISIL - AA+ 0.08
Sub Total 58.02
CREDIT EXPOSURE (PERPETUAl BONDS)
Punjab National Bank (AT1, BASeL III, Perpetual) CRISIL - AA- 2.13
The Tata Power Company Ltd. (Perpetual) CRISIL - AA 1.67
Sub Total 3.80
Total 71.59
Cash, Cash equivalents and Net Current Assets 5.09
Grand Total 100.00
• Top Ten Holdings, @ Less than 0.01%
(An open ended hybrid scheme investing predominantly in debt instruments)HDFC Hybrid Debt Fund
PORTFOLIO

January 2021 37
Face Value per Unit: ` 10 unless otherwise specified, + Industry Classification as recommended by AMFI, Data is as of January 31, 2021 unless otherwise specified.
This product is suitable for investors who are seeking ~
l to generate long-term income / capital appreciation
l investments primarily in debt securities, money market instruments and moderate exposure to equities
VeryHigh
Low to
Moderate
Low
Moderate ModeratelyHigh High
RISKOMETERInvestors understand that their principal will be at
high risk
~ Investors should consult their financial advisers, if in doubt about whether the product is suitable for them.
SIP PERFORMANCE ^ - Regular Plan - growth Option
Since Inception SIP
15 year SIP 10 year SIP 5 Year SIP 3 Year SIP 1 Year SIP
Total Amount Invested (` ‘000) 2,060.00 1,800.00 1,200.00 600.00 360.00 120.00
Mkt Value As on January 29, 2021 (` ‘000) 4,992.50 3,761.80 1,877.42 728.22 414.08 132.44
Returns (%) 9.53 9.22 8.67 7.69 9.32 19.92
Benchmark Returns (%) # 9.23 9.35 9.77 10.24 11.88 14.83
Additional Benchmark Returns (%) ## 7.03 7.28 7.80 7.82 9.36 5.72
Assuming ` 10,000 invested systematically on the first Business Day of every month over a period of time. CAGR returns are computed after accounting for the cash flow by using xIRR method (investment internal rate of return) for Regular Plan - Growth Option. The above investment simulation is for illustrative purposes only and should not be construed as a promise on minimum returns and safeguard of capital.
PERFORMANCE ^ - Regular Plan - growth Option
Date Period Scheme Returns
(%)
Benchmark Returns
(%)#
Additional Benchmark
Returns (%) ##
Value of ` 10,000 invested
Scheme (`) Benchmark (`)#
Additional Benchmark (`)##
Jan 31, 20 Last 1 Year 9.80 13.22 9.14 10,977 11,318 10,911
Jan 31, 18 Last 3 Years 5.88 9.96 9.04 11,868 13,292 12,963
Jan 29, 16 Last 5 Years 8.61 9.99 7.93 15,122 16,107 14,654
Dec 26, 03 Since Inception 10.17 8.58 5.93 52,450 40,899 26,773
Returns greater than 1 year period are compounded annualized (CAGR). Performance of dividend option under the schemes for the investors would be net of distribution tax, if any. Scheme performance may not strictly be comparable with that of its Additional Benchmark in view of hybrid nature of the scheme where a portion of scheme’s investments are made in equity instruments. For performance of other schemes managed by Prashant Jain (equities) and Shobhit Mehrotra (Debt), please refer page 67. Different plans viz. Regular Plan and Direct Plan have a different expense structure. The expenses of the Direct Plan under the Scheme will be lower to the extent of the distribution expenses / commission charged in the Regular Plan. For Performance of Direct Plan, refer page no. 80.
^Past performance may or may not be sustained in the future. Load is not taken into consideration for computation of performance.
Note: Effective close of business hours of May 25, 2018, HDFC MF Monthly Income Plan – Long Term Plan (MIP-LTP) underwent changes in Fundamental Attributes and was renamed as HDFC Hybrid Debt Fund (HHDF) and HDFC MF Monthly Income Plan – Short Term Plan was merged therein. As the portfolio structuring of HHDF closely resembles the erstwhile MIP-LTP, the past performance of MIP-LTP is provided, in line with SeBI circular on Performance disclosure post consolidation/ merger of scheme dated April 12, 2018.
Portfolio Classification By Asset Class (%)
n equity 23.32
n G-Sec, SDL 9.77
n Credit exposure 61.82
n Cash, Cash equivalents and Net Current Assets 5.09
Portfolio Classification By Rating Class (%)
n equity 23.32n Sovereign 9.77n AAA/AAA(SO)/A1+/A1+(SO)
& equivalent 28.31n AA+ 2.97n AA/AA- 25.64n A+ & Below 4.90n Cash, Cash equivalents and
Net Current Assets 5.09
(An open ended hybrid scheme investing predominantly in debt instruments) .....Contd from previous pageHDFC Hybrid Debt Fund
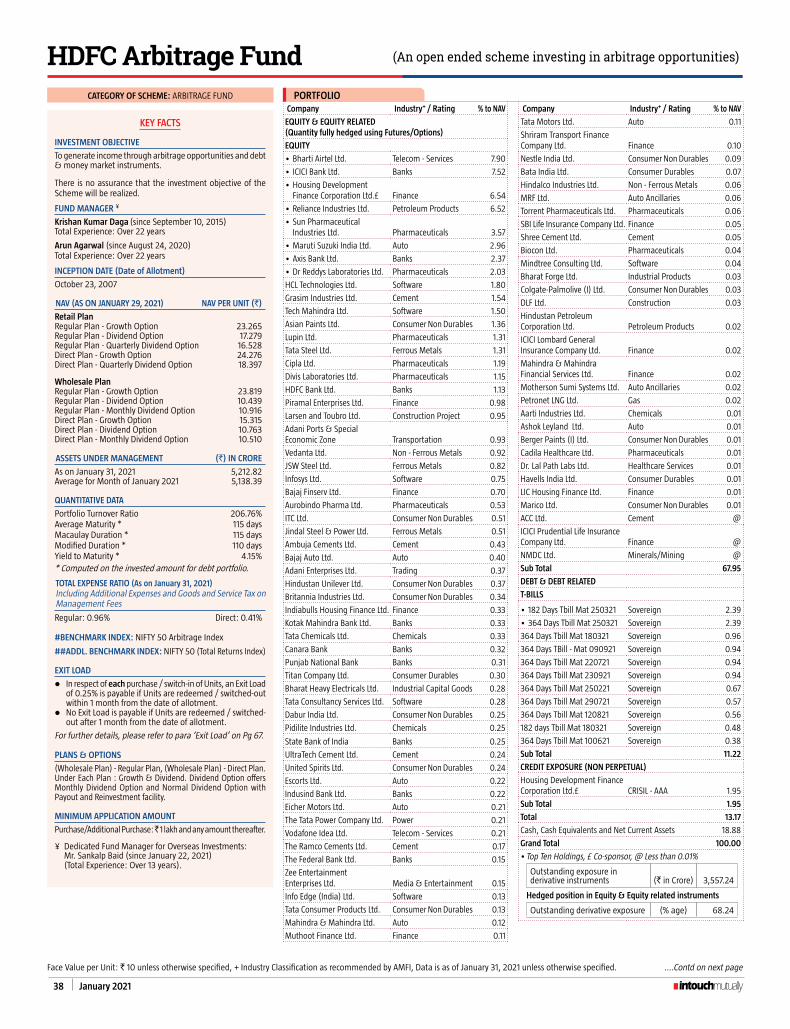
38 January 2021
CATEgORY OF SCHEME: ARBITRAGE FUND
KEY FACTS
INVESTMENT OBjECTIVE
To generate income through arbitrage opportunities and debt & money market instruments.
There is no assurance that the investment objective of the Scheme will be realized.
FUND MANAgER ¥
Krishan Kumar Daga (since September 10, 2015)
Total experience: Over 22 years
Arun Agarwal (since August 24, 2020)
Total experience: Over 22 years
INCEPTION DATE (Date of Allotment)
October 23, 2007
NAV (AS ON JANUARY 29, 2021) NAV PER UNIT (`)
Retail PlanRegular Plan - Growth Option 23.265Regular Plan - Dividend Option 17.279Regular Plan - Quarterly Dividend Option 16.528Direct Plan - Growth Option 24.276Direct Plan - Quarterly Dividend Option 18.397
Wholesale PlanRegular Plan - Growth Option 23.819Regular Plan - Dividend Option 10.439Regular Plan - Monthly Dividend Option 10.916Direct Plan - Growth Option 15.315Direct Plan - Dividend Option 10.763Direct Plan - Monthly Dividend Option 10.510
ASSETS UNDER MANAgEMENT (`) IN CRORE
As on January 31, 2021 5,212.82Average for Month of January 2021 5,138.39
qUANTITATIVE DATA
Portfolio Turnover Ratio 206.76%Average Maturity * 115 daysMacaulay Duration * 115 daysModified Duration * 110 daysYield to Maturity * 4.15%* Computed on the invested amount for debt portfolio.
TOTAL ExPENSE RATIO (As on January 31, 2021)Including Additional expenses and Goods and Service Tax on Management Fees
Regular: 0.96% Direct: 0.41%
#BENCHMARK INDEX: NIFTY 50 Arbitrage Index
##ADDl. BENCHMARK INDEX: NIFTY 50 (Total Returns Index)
EXIT lOAD
l In respect of each purchase / switch-in of Units, an exit Load of 0.25% is payable if Units are redeemed / switched-out within 1 month from the date of allotment.
l No exit Load is payable if Units are redeemed / switched-out after 1 month from the date of allotment.
For further details, please refer to para ‘Exit Load’ on Pg 67.
PLANS & OPTIONS
(Wholesale Plan) - Regular Plan, (Wholesale Plan) - Direct Plan.Under Each Plan : Growth & Dividend. Dividend Option offers Monthly Dividend Option and Normal Dividend Option with Payout and Reinvestment facility.
MINIMUM APPlICATION AMOUNT
Purchase/Additional Purchase: ̀ 1 lakh and any amount thereafter.
¥ Dedicated Fund Manager for Overseas Investments: Mr. Sankalp Baid (since January 22, 2021) (Total experience: Over 13 years).
Company Industry+ / Rating % to NAV
EqUITY & EqUITY RElATED (quantity fully hedged using Futures/Options)
EqUITY
• Bharti Airtel Ltd. Telecom - Services 7.90
• ICICI Bank Ltd. Banks 7.52
• Housing Development Finance Corporation Ltd.£ Finance 6.54
• Reliance Industries Ltd. Petroleum Products 6.52
• Sun Pharmaceutical Industries Ltd. Pharmaceuticals 3.57
• Maruti Suzuki India Ltd. Auto 2.96
• Axis Bank Ltd. Banks 2.37
• Dr Reddys Laboratories Ltd. Pharmaceuticals 2.03
HCL Technologies Ltd. Software 1.80
Grasim Industries Ltd. Cement 1.54
Tech Mahindra Ltd. Software 1.50
Asian Paints Ltd. Consumer Non Durables 1.36
Lupin Ltd. Pharmaceuticals 1.31
Tata Steel Ltd. Ferrous Metals 1.31
Cipla Ltd. Pharmaceuticals 1.19
Divis Laboratories Ltd. Pharmaceuticals 1.15
HDFC Bank Ltd. Banks 1.13
Piramal enterprises Ltd. Finance 0.98
Larsen and Toubro Ltd. Construction Project 0.95
Adani Ports & Special economic Zone Transportation 0.93
Vedanta Ltd. Non - Ferrous Metals 0.92
JSW Steel Ltd. Ferrous Metals 0.82
Infosys Ltd. Software 0.75
Bajaj Finserv Ltd. Finance 0.70
Aurobindo Pharma Ltd. Pharmaceuticals 0.53
ITC Ltd. Consumer Non Durables 0.51
Jindal Steel & Power Ltd. Ferrous Metals 0.51
Ambuja Cements Ltd. Cement 0.43
Bajaj Auto Ltd. Auto 0.40
Adani enterprises Ltd. Trading 0.37
Hindustan Unilever Ltd. Consumer Non Durables 0.37
Britannia Industries Ltd. Consumer Non Durables 0.34
Indiabulls Housing Finance Ltd. Finance 0.33
Kotak Mahindra Bank Ltd. Banks 0.33
Tata Chemicals Ltd. Chemicals 0.33
Canara Bank Banks 0.32
Punjab National Bank Banks 0.31
Titan Company Ltd. Consumer Durables 0.30
Bharat Heavy electricals Ltd. Industrial Capital Goods 0.28
Tata Consultancy Services Ltd. Software 0.28
Dabur India Ltd. Consumer Non Durables 0.25
Pidilite Industries Ltd. Chemicals 0.25
State Bank of India Banks 0.25
UltraTech Cement Ltd. Cement 0.24
United Spirits Ltd. Consumer Non Durables 0.24
escorts Ltd. Auto 0.22
Indusind Bank Ltd. Banks 0.22
eicher Motors Ltd. Auto 0.21
The Tata Power Company Ltd. Power 0.21
Vodafone Idea Ltd. Telecom - Services 0.21
The Ramco Cements Ltd. Cement 0.17
The Federal Bank Ltd. Banks 0.15
Zee entertainment enterprises Ltd. Media & entertainment 0.15
Info edge (India) Ltd. Software 0.13
Tata Consumer Products Ltd. Consumer Non Durables 0.13
Mahindra & Mahindra Ltd. Auto 0.12
Muthoot Finance Ltd. Finance 0.11
Company Industry+ / Rating % to NAV
Tata Motors Ltd. Auto 0.11
Shriram Transport Finance Company Ltd. Finance 0.10
Nestle India Ltd. Consumer Non Durables 0.09
Bata India Ltd. Consumer Durables 0.07
Hindalco Industries Ltd. Non - Ferrous Metals 0.06
MRF Ltd. Auto Ancillaries 0.06
Torrent Pharmaceuticals Ltd. Pharmaceuticals 0.06
SBI Life Insurance Company Ltd. Finance 0.05
Shree Cement Ltd. Cement 0.05
Biocon Ltd. Pharmaceuticals 0.04
Mindtree Consulting Ltd. Software 0.04
Bharat Forge Ltd. Industrial Products 0.03
Colgate-Palmolive (I) Ltd. Consumer Non Durables 0.03
DLF Ltd. Construction 0.03
Hindustan Petroleum Corporation Ltd. Petroleum Products 0.02
ICICI Lombard General Insurance Company Ltd. Finance 0.02
Mahindra & Mahindra Financial Services Ltd. Finance 0.02
Motherson Sumi Systems Ltd. Auto Ancillaries 0.02
Petronet LNG Ltd. Gas 0.02
Aarti Industries Ltd. Chemicals 0.01
Ashok Leyland Ltd. Auto 0.01
Berger Paints (I) Ltd. Consumer Non Durables 0.01
Cadila Healthcare Ltd. Pharmaceuticals 0.01
Dr. Lal Path Labs Ltd. Healthcare Services 0.01
Havells India Ltd. Consumer Durables 0.01
LIC Housing Finance Ltd. Finance 0.01
Marico Ltd. Consumer Non Durables 0.01
ACC Ltd. Cement @
ICICI Prudential Life Insurance Company Ltd. Finance @
NMDC Ltd. Minerals/Mining @
Sub Total 67.95
DEBT & DEBT RElATED
T-BIllS
• 182 Days Tbill Mat 250321 Sovereign 2.39
• 364 Days Tbill Mat 250321 Sovereign 2.39
364 Days Tbill Mat 180321 Sovereign 0.96
364 Days TBill - Mat 090921 Sovereign 0.94
364 Days Tbill Mat 220721 Sovereign 0.94
364 Days Tbill Mat 230921 Sovereign 0.94
364 Days Tbill Mat 250221 Sovereign 0.67
364 Days Tbill Mat 290721 Sovereign 0.57
364 Days Tbill Mat 120821 Sovereign 0.56
182 days Tbill Mat 180321 Sovereign 0.48
364 Days Tbill Mat 100621 Sovereign 0.38
Sub Total 11.22
CREDIT EXPOSURE (NON PERPETUAl)
Housing Development Finance Corporation Ltd.£ CRISIL - AAA 1.95
Sub Total 1.95
Total 13.17
Cash, Cash equivalents and Net Current Assets 18.88
Grand Total 100.00
• Top Ten Holdings, £ Co-sponsor, @ Less than 0.01%
Outstanding exposure in derivative instruments (` in Crore) 3,557.24
Hedged position in Equity & Equity related instruments
Outstanding derivative exposure (% age) 68.24
Face Value per Unit: ` 10 unless otherwise specified, + Industry Classification as recommended by AMFI, Data is as of January 31, 2021 unless otherwise specified. ....Contd on next page
(An open ended scheme investing in arbitrage opportunities)HDFC Arbitrage FundPORTFOLIO

January 2021 39
This product is suitable for investors who are seeking ~
l income over short term.
l income through arbitrage opportunities between cash and derivative market and arbitrage opportunities within the derivative segment.
VeryHigh
Low to
Moderate
Low
Moderate ModeratelyHigh High
RISKOMETERInvestors understand that their principal will be at
low risk~ Investors should consult their financial advisers, if in doubt about whether the product is suitable for them.
Face Value per Unit: ̀ 10 unless otherwise specified, + Industry Classification as recommended by AMFI, CD - Certificate of Deposit; CP - Commercial Papers, Data is as of January 31, 2021 unless otherwise specified.
PERFORMANCE ^ - Wholesale Plan - Regular Plan - growth Option
Date Period Scheme Returns
(%)
Benchmark Returns
(%)#
Additional Benchmark
Returns (%) ##
Value of ` 10,000 invested
Scheme (`) Benchmark (`)#
Additional Benchmark
(`)##
Jan 31, 20 Last 1 Year 3.28 1.84 15.22 10,327 10,183 11,518Jan 31, 18 Last 3 Years 4.96 4.42 8.70 11,561 11,385 12,841Jan 29, 16 Last 5 Years 5.40 4.77 13.94 13,010 12,626 19,214Oct 23, 07 Since Inception 6.75 N.A. 8.38 23,819 N.A. 29,116
Returns greater than 1 year period are compounded annualized (CAGR). Performance of dividend option under the schemes for the investors would be net of distribution tax, if any. N.A. Not Available. Scheme performance is not strictly comparable with that of its Additional Benchmark since the scheme does not take directional call in equity markets but is limited to availing arbitrage opportunities, etc. For performance of other schemes managed by Krishan Kumar Daga and Arun Agarwal, please refer page 67. Different plans viz. Regular Plan and Direct Plan have a different expense structure. The expenses of the Direct Plan under the Scheme will be lower to the extent of the distribution expenses / commission charged in the Regular Plan. For Performance of Direct Plan, refer page no. 80.
^Past performance may or may not be sustained in the future. Load is not taken into consideration for computation of performance.
Portfolio Classification By Rating Class (%)
n equity 67.95
n Sovereign 11.22
n AAA/AAA(SO)/A1+/A1+(SO) & equivalent 1.95
n Cash, Cash equivalents and Net Current Assets 18.88
Portfolio Classification By Asset Class (%)
n equity 67.95
n T-Bills 11.22
n Credit exposure 1.95
n Cash, Cash equivalents and Net Current Assets 18.88
(An open ended scheme investing in arbitrage opportunities) .....Contd from previous pageHDFC Arbitrage Fund
Industry Allocation of Equity Holding (% of Net Assets)
0.01
0.02
0.03
0.03
0.08
0.15
0.21
0.28
0.37
0.38
0.59
0.93
0.95
0.98
2.43
2.64
3.34
4.03
4.50
6.54
8.11
8.86
9.89
12.60
0 2 4 6 8 10 12 14
Healthcare Services
Gas
Construction
Industrial Products
Auto Ancillaries
Media & Entertainment
Power
Industrial Capital Goods
Trading
Consumer Durables
Chemicals
Transportation
Construction Project
Non - Ferrous Metals
Cement
Ferrous Metals
Consumer Non Durables
Auto
Software
Petroleum Products
Telecom - Services
Finance
Pharmaceuticals
Banks
SIP PERFORMANCE ^ - Regular Plan - growth Option
Since Inception SIP
10 year SIP
5 year SIP
3 year SIP
1 year SIP
Total Amount Invested (` ‘000) 1,600.00 1,200.00 600.00 360.00 120.00 Mkt Value As on January 29, 2021 (` ‘000) 2,487.67 1,632.12 679.58 385.14 121.93 Returns (%) 6.36 6.00 4.93 4.44 3.01 Benchmark Returns (%) # N.A. 5.56 4.26 3.76 1.74 Additional Benchmark Returns (%) ## 11.71 12.33 13.49 15.30 51.56
Assuming ` 10,000 invested systematically on the first Business Day of every month over a period of time. CAGR returns are computed after accounting for the cash flow by using xIRR method (investment internal rate of return) for Regular Plan - Growth Option. The above investment simulation is for illustrative purposes only and should not be construed as a promise on minimum returns and safeguard of capital.

40 January 2021
CATEgORY OF SCHEME: CORPORATE BOND FUND
KEY FACTSINVESTMENT OBjECTIVE
To generate income/capital appreciation through investments predominantly in AA+ and above rated corporate bonds.
There is no assurance that the investment objective of the Scheme will be realized.
FUND MANAgER ¥
Anupam Joshi (since October 27, 2015)
Total experience: Over 12 years
INCEPTION DATE (Date of Allotment)
June 29, 2010
NAV (AS ON JANUARY 29, 2021) NAV PER UNIT (`)
Regular Plan - Growth Option 24.9149Regular Plan - Dividend Option 16.9458Regular Plan - Quarterly Dividend Option 10.5842Direct Plan - Growth Option 25.1576Direct Plan - Dividend Option 17.2665Direct Plan - Quarterly Dividend Option 10.5071
ASSETS UNDER MANAgEMENT (`) IN CRORE
As on January 31, 2021 30,846.53Average for Month of January 2021 31,774.41
qUANTITATIVE DATA
Average Maturity * 4.36 yearsMacaulay Duration * 3.02 yearsModified Duration * 2.86 yearsYield to Maturity * 5.35%* Computed on the invested amount.
TOTAL ExPENSE RATIO (As on January 31, 2021)Including Additional expenses and Goods and Service Tax on Management Fees
Regular: 0.61% Direct: 0.30%
#BENCHMARK INDEX: NIFTY Corporate Bond Index
##ADDl. BENCHMARK INDEX: CRISIL 10 year Gilt Index
EXIT lOAD
Nil
PLANS & OPTIONS
Regular Plan, Direct Plan. Under both the Plans: Growth, Quarterly Dividend & Normal Dividend. Both Dividend options offer Payout and Reinvestment facilities.
MINIMUM APPlICATION AMOUNT
Purchase : ` 5,000 and any amount thereafter. Additional Purchase : ` 1,000 and any amount thereafter.
¥ Dedicated Fund Manager for Overseas Investments: Mr. Sankalp Baid (since January 22, 2021) (Total experience: Over 13 years).
Face Value per Unit: ` 10 unless otherwise specified, CD - Certificate of Deposit; CP - Commercial Papers, Data is as of January 31, 2021 unless otherwise specified.
This product is suitable for investors who are seeking ~
l income over short to medium term
l to generate income/capital appreciation through investments predominantly in AA+ and above rated corporate bonds
VeryHigh
Low to
Moderate
Low
Moderate ModeratelyHigh High
RISKOMETERInvestors understand that their principal will be at
moderate risk~ Investors should consult their financial advisers, if in doubt about whether the product is suitable for them.
Issuer Rating % to NAV
DEBT & DEBT RElATED
gOVERNMENT SECURITIES (CENTRAl/STATE)
• 6.79 GOI 2027 Sovereign 5.13
• 6.97 GOI 2026 Sovereign 4.48
• GOI 2033 Sovereign 3.28
8.24 GOI 2027 Sovereign 2.74
Central Government of India Loans 1.61
8.15 GOI 2026 Sovereign 0.91
8.33 GOI 2026 Sovereign 0.55
6.49% Gujarat SDL ISD 021220 Mat 021229 Sovereign 0.29
7.59 GOI 2026 Sovereign 0.27
8.21% Haryana SDL (UDAY) - Mat 310323 Sovereign 0.10
6.13 GOI 2028 Sovereign 0.05
Sub Total 19.41
CREDIT EXPOSURE (NON PERPETUAl)
• National Bank for Agriculture & Rural Development
CRISIL - AAA / ICRA - AAA 8.85
• Housing Development Finance Corporation Ltd.£ CRISIL - AAA 8.50
• Power Finance Corporation Ltd. CARe - AAA / CRISIL - AAA / ICRA - AAA 8.28
• REC Ltd. CARe - AAA / CRISIL - AAA / IND - AAA 7.47
• LIC Housing Finance Ltd. CARe - AAA / CRISIL - AAA 7.26
• State Bank of India CRISIL - AAA 5.58
• Reliance Industries Ltd. CRISIL - AAA / ICRA - AAA 4.93
National Highways Authority of India CARe - AAA / CRISIL - AAA 2.81
Mangalore Refinery and Petrochemicals Ltd. CARe - AAA / CRISIL - AAA 2.77
UltraTech Cement Ltd. CRISIL - AAA 2.41
Indian Railways Finance Corporation Ltd. CRISIL - AAA 1.92
ONGC Petro additions Ltd. (OPAL) (Put on ONGC Ltd.) CARe - AAA(Ce) 1.41
Chennai Petroleum Corporation Ltd. CRISIL - AAA 1.29
Bajaj Finance Ltd. CRISIL - AAA 1.26
Sundaram Finance Ltd. CRISIL - AAA / ICRA - AAA 1.10
Bank of Baroda CARe - AAA 1.05
TATA Capital Housing Finance Ltd. CRISIL - AAA 0.98
Issuer Rating % to NAV
Power Grid Corporation of India Ltd. CRISIL - AAA 0.91
Housing and Urban Development Corporation Ltd. CARe - AAA / IND - AAA 0.82
Pipeline Infrastructure Pvt. Ltd. CRISIL - AAA 0.80
Jamnagar Utilities & Power Pvt. Ltd. (erstwhile Reliance Utilities & Power Pvt. Ltd.) CRISIL - AAA 0.72
Food Corporation of India (Corporate guarantee from Govt of India) CRISIL - AAA (Ce) 0.70
HDB Financial Services Ltd. CRISIL - AAA 0.68
NTPC Ltd. CRISIL - AAA 0.64
export - Import Bank of India CRISIL - AAA 0.60
Sikka Port and Terminal Ltd. (erstwhile Reliance Ports and Terminals Ltd.) CARe - AAA 0.50
Britannia Industries Ltd. CRISIL - AAA 0.49
Indian Oil Corporation Ltd. CRISIL - AAA 0.49
Small Industries Development Bank CARe - AAA 0.41
Bajaj Housing Finance Ltd. CRISIL - AAA 0.35
Larsen and Toubro Ltd. CRISIL - AAA 0.33
National Housing Bank CRISIL - AAA 0.25
L&T Finance Ltd. CARe - AAA 0.18
NHPC Ltd. CARe - AAA 0.18
Andhra Pradesh expressway Ltd. (NHAI Annuity) ICRA - AAA 0.11
First Business Receivables Trust (PTC backed by receivables from Reliance Corporate IT Park Ltd.) CRISIL - AAA(SO) 0.10
Nuclear Power Corporation CRISIL - AAA 0.09
Gujarat Road and Infra Co Ltd. CARe - AAA 0.08
Tata Sons Ltd. CRISIL - AAA 0.06
ICICI Bank Ltd. CARe - AAA 0.04
Mahanagar Telephone Nigam Ltd. (Corporate guarantee from Govt of India) CRISIL - AAA(Ce) 0.03
Sub Total 77.43
Total 96.84
Cash, Cash equivalents and Net Current Assets 3.16
Grand Total 100.00
• Top Ten Holdings, £ Co-sponsor
Outstanding exposure in derivative instruments Interest Rate Swap (` in Crore) 3,400.00
Note: Effective close of business hours of May 8, 2018, HDFC Medium Term Opportunities Fund (HMTOF) underwent changes in Fundamental Attributes and was renamed as HDFC Corporate Bond Fund (HCBF) and HDFC Floating Rate Income Fund – Long Term Plan and HDFC Gilt Fund – Short Term Plan were merged therein. As the portfolio structuring of HCBF closely resembles the erstwhile HMTOF, the past performance of HMTOF is provided, in line with SEBI circular on Performance disclosure post consolidation/ merger of scheme dated April 12, 2018.
Portfolio Classification By Asset Class (%)
n G-Sec, SDL 19.41
n Credit exposure 77.43
n Cash, Cash equivalents and Net Current Assets 3.16
Portfolio Classification By Rating Class (%)
n Sovereign 19.41n AAA/AAA(SO)/A1+/A1+(SO)
& equivalent 77.43n Cash, Cash equivalents and
Net Current Assets 3.16
(An open ended debt scheme predominantly investing in AA+ and above rated corporate bonds)HDFC Corporate Bond Fund
PORTFOLIO

January 2021 41
PERFORMANCE ^ - Regular Plan - growth Option
Date Period Scheme Returns
(%)
Benchmark Returns
(%)#
Additional Benchmark
Returns (%) ##
Value of ` 10,000 invested
Scheme (`) Benchmark (`)#
Additional Benchmark
(`)##
Jan 31, 20 Last 1 Year 10.91 10.89 9.14 11,088 11,086 10,911Jan 31, 18 Last 3 Years 9.36 9.08 9.04 13,077 12,974 12,963Jan 29, 16 Last 5 Years 8.97 8.72 7.93 15,372 15,197 14,654Jun 29, 10 Since Inception 9.00 8.77 7.03 24,915 24,361 20,545
Returns greater than 1 year period are compounded annualized (CAGR). Performance of dividend option under the schemes for the investors would be net of distribution tax, if any. For performance of other schemes managed by Anupam Joshi, please refer page 67. Different plans viz. Regular Plan and Direct Plan have a different expense structure. The expenses of the Direct Plan under the Scheme will be lower to the extent of the distribution expenses / commission charged in the Regular Plan. For Performance of Direct Plan, refer page no. 80.
^Past performance may or may not be sustained in the future. Load is not taken into consideration for computation of performance.
(An open ended debt scheme predominantly investing in AA+ and above rated corporate bonds).....Contd from previous pageHDFC Corporate Bond Fund
SIP PERFORMANCE ^ - Regular Plan - growth Option
Since Inception SIP
10 year SIP
5 year SIP
3 year SIP
1 year SIP
Total Amount Invested (` ‘000) 1,280.00 1,200.00 600.00 360.00 120.00 Mkt Value As on January 29, 2021 (` ‘000) 2,114.81 1,918.47 755.38 418.73 125.69 Returns (%) 9.07 9.08 9.15 10.08 8.98 Benchmark Returns (%) # 8.98 9.00 9.00 10.05 9.56 Additional Benchmark Returns (%) ## 7.71 7.80 7.82 9.36 5.72
Assuming ` 10,000 invested systematically on the first Business Day of every month over a period of time. CAGR returns are computed after accounting for the cash flow by using xIRR method (investment internal rate of return) for Regular Plan - Growth Option. The above investment simulation is for illustrative purposes only and should not be construed as a promise on minimum returns and safeguard of capital.

42 January 2021
CATEgORY OF SCHEME: CREDIT RISK FUND
KEY FACTS
INVESTMENT OBjECTIVE
To generate income/capital appreciation by investing predominantly in AA and below rated corporate debt.
There is no assurance that the investment objective of the Scheme will be realized.
FUND MANAgER ¥
Shobhit Mehrotra (since March 25, 2014)
Total experience: Over 25 years
INCEPTION DATE (Date of Allotment)
March 25, 2014
NAV (AS ON JANUARY 29, 2021) NAV PER UNIT (`)
Regular Plan - Growth Option 18.0825Regular Plan - Dividend Option 16.6501Regular Plan - Quarterly Dividend Option 10.5276Direct Plan - Growth Option 19.0237Direct Plan - Dividend Option 16.6757Direct Plan - Quarterly Dividend Option 10.6845
ASSETS UNDER MANAgEMENT (`) IN CRORE
As on January 31, 2021 6,847.74Average for Month of January 2021 6,715.94
qUANTITATIVE DATA
Average Maturity * 2.50 yearsMacaulay Duration * 2.11 yearsModified Duration * 1.99 yearsYield to Maturity * 8.05%* Computed on the invested amount.
#BENCHMARK INDEX: NIFTY Credit Risk Bond Index
##ADDl. BENCHMARK INDEX: CRISIL 10 year Gilt Index
TOTAL ExPENSE RATIO (As on January 31, 2021)Including Additional expenses and Goods and Service Tax on Management Fees
Regular: 1.71% Direct: 1.11%
EXIT lOAD
l In respect of each purchase / switch-in of Units, 15% of the units (“the limit”) may be redeemed without any exit Load from the date of allotment
l Any redemption in excess of the above limit shall be subject to the following exit load:
n In respect of each purchase / switch-in of Units, an exit Load of 1.00% is payable if Units are redeemed / switched-out within 12 months from the date of allotment
n In respect of each purchase / switch-in of Units, an exit Load of 0.50% is payable if Units are redeemed / switched-out after 12 months but within 18 months from the date of allotment
l No exit Load is payable if Units are redeemed / switched-out after 18 months from the date of allotment
For further details, please refer to para ‘Exit Load’ on Pg 67.
PLANS & OPTIONS
Regular Plan, Direct Plan. Under each Plan: Growth, Quarterly Dividend and Normal Dividend. Both Dividend options offers Payout and Reinvestment facilities.
MINIMUM APPlICATION AMOUNT
Purchase : ` 5,000 and any amount thereafter. Additional Purchase : ` 1,000 and any amount thereafter.
¥ Dedicated Fund Manager for Overseas Investments: Mr. Sankalp Baid (since January 22, 2021) (Total experience: Over 13 years).
PERFORMANCE ^ - Regular Plan - growth Option
Date Period Scheme Returns
(%)
Benchmark Returns
(%)#
Additional Benchmark
Returns (%) ##
Value of ` 10,000 invested
Scheme (`) Benchmark (`)#
Additional Benchmark
(`)##
Jan 31, 20 Last 1 Year 10.39 10.70 9.14 11,036 11,066 10,911Jan 31, 18 Last 3 Years 8.31 9.01 9.04 12,704 12,951 12,963Jan 29, 16 Last 5 Years 8.46 8.98 7.93 15,015 15,376 14,654Mar 25, 14 Since Inception 9.03 9.41 8.64 18,083 18,520 17,648
The above returns are for Regular Plan - Growth Option. Returns greater than 1 year period are compounded annualized (CAGR). Performance of dividend option under the schemes for the investors would be net of distribution tax, if any. Load is not taken into consideration for computation of performance. For performance of other schemes managed by Shobhit Mehrotra, please refer page 67. Different plans viz. Regular Plan and Direct Plan have a different expense structure. The expenses of the Direct Plan under the Scheme will be lower to the extent of the distribution expenses / commission charged in the Regular Plan. For Performance of Direct Plan, refer page no. 73.
This product is suitable for investors who are seeking ~
l income over short to medium terml to generate income/capital appreciation by investing
predominantly in AA and below rated corporate debt (excluding AA+ rated corporate bonds)
VeryHigh
Low to
Moderate
Low
Moderate ModeratelyHigh High
RISKOMETERInvestors understand that their principal will be at
high risk
~ Investors should consult their financial advisers, if in doubt about whether the product is suitable for them.
Note: Effective close of business hours of May 8, 2018, HDFC Corporate Debt Opportunities Fund (HCDOF) underwent changes in Fundamental Attributes and was renamed as HDFC Credit Risk Debt Fund (HCRDF) and HDFC Regular Savings Fund was merged therein. As the portfolio structuring of HCRDF closely resembles the erstwhile HCDOF, the past performance of HCDOF is provided, in line with SeBI circular on Performance disclosure post consolidation/ merger of scheme dated April 12, 2018.
Portfolio Classification By Asset Class (%)
n G-Sec 5.46
n CP 1.46
n Credit exposure 82.94
n Cash, Cash equivalents and Net Current Assets 10.14
Portfolio Classification By Issuer Rating Class (%) ≈
n Sovereign 5.46n AAA/AAA(SO)/A1+/A1+(SO)
& equivalent 22.06n AA+ 1.35n AA/AA- 47.06n A+ & Below 13.93n Cash, Cash equivalents and
Net Current Assets 10.14
[An open ended debt scheme predominantly investing in AA andbelow rated corporate bonds (excluding AA+ rated corporate bonds)]HDFC Credit Risk Debt Fund
Face Value per Unit: ` 10 unless otherwise specified, Data is as of January 31, 2021 unless otherwise specified. ≈ Based on long term rating.
SIP PERFORMANCE ^ - Regular Plan - growth Option
Since Inception SIP
5 year SIP
3 year SIP
1 year SIP
Total Amount Invested (` ‘000) 830.00 600.00 360.00 120.00 Mkt Value As on January 29, 2021 (` ‘000) 1,122.11 743.58 416.12 127.28 Returns (%) 8.59 8.52 9.65 11.52 Benchmark Returns (%) # 9.09 9.06 9.82 10.41 Additional Benchmark Returns (%) ## 8.00 7.82 9.36 5.72
Assuming ` 10,000 invested systematically on the first Business Day of every month over a period of time. CAGR returns are computed after accounting for the cash flow by using xIRR method (investment internal rate of return) for Regular Plan - Growth Option. The above investment simulation is for illustrative purposes only and should not be construed as a promise on minimum returns and safeguard of capital.

January 2021 43
Company Industry+ / Security Rating
Issuer Rating % to NAV
DEBT & DEBT RElATED
gOVERNMENT SECURITIES (CENTRAl/STATE)
7.17 GOI 2028 Sovereign Sovereign 1.41
6.79 GOI 2027 Sovereign Sovereign 1.16
7.27 GOI 2026 Sovereign Sovereign 0.95
7.32 GOI 2024 Sovereign Sovereign 0.78
7.59 GOI 2026 Sovereign Sovereign 0.40
7.72 GOI 2025 Sovereign Sovereign 0.40
5.15 GOI 2025 Sovereign Sovereign 0.36
Sub Total 5.46
CREDIT EXPOSURE (NON PERPETUAl)
• Vedanta Ltd. CRISIL - AA- CRISIL - AA- 7.62
• DLF Ltd. ICRA - A+ CRISIL - A+ 5.81
• Tata Motors Ltd. CRISIL - AA- CRISIL - AA- 5.80
• IndInfravit Trust CRISIL - AAA CRISIL - AAA 5.21
• Shriram City Union Finance Ltd. CRISIL - AA CRISIL - AA 5.05
• Power Finance Corporation Ltd. CRISIL - AAA CRISIL - AAA 4.97
• Pipeline Infrastructure Pvt. Ltd. CRISIL - AAA CRISIL - AAA 4.30
• REC Ltd. CRISIL - AAA CRISIL - AAA 3.52
• Dilip Buildcon Ltd. CRISIL - A CRISIL - A 3.28
Sadbhav Infrastructure Project Ltd. (Corporate Guarantee of Sadbhav engineering Ltd.) CARE - BBB+(CE) CARE - BBB+(CE) 2.55
JM Financial Asset Reconstruction Company Ltd. ICRA - AA- CRISIL - AA- 2.34
Indiabulls Housing Finance Ltd. CARe - AA / CRISIL - AA CRISIL - AA 2.16
INOx Wind Infrastructure Services Ltd. CRISIL - AA(Ce) CRISIL - AA(Ce) 1.68
INOx Wind Ltd. CRISIL - AA(Ce) CRISIL - AA(Ce) 1.46
Shriram Transport Finance Company Ltd. CRISIL - AA+ / IND - AA+ CRISIL - AA+ 1.35
TVS Credit Services Ltd. CRISIL - AA- ICRA - A+ 1.09
Green Infra Wind energy Ltd. CRISIL - AA CRISIL - AA- 1.06
GeRA Development Pvt. Ltd. CARe - AA- CARe - AA- 0.99
NTPC Ltd. CRISIL - AAA CRISIL - AAA 0.97
SANSAR TRUST NOV 2018 (PTC of pools from Shriram Transport Finance Company Ltd.) ICRA - AAA(SO) ICRA - AAA(SO) 0.94
Starlite Lighting Ltd. (Corporate Guarantee of Bajaj electrical Ltd.) ICRA - A-(Ce) ICRA - A-(Ce) 0.89
Aarish Solar Power Pvt. Ltd. (Greenko) CARe - AA(Ce) CARe - AA(Ce) 0.85
Aashman energy Pvt. Ltd. (Greenko) CARe - AA(Ce) CARe - AA(Ce) 0.85
Divyesh Power Pvt. Ltd. (Greenko) CARe - AA(Ce) CARe - AA(Ce) 0.85
elena Renewable energy Pvt. Ltd. (Greenko) CARe - AA(Ce) CARe - AA(Ce) 0.85
Company Industry+ / Security Rating
Issuer Rating % to NAV
Pratyash Renewable Pvt. Ltd. (Greenko) CARe - AA(Ce) CARe - AA(Ce) 0.85
SeI Baskara Power Pvt. Ltd. (Greenko) CARe - AA(Ce) BRICKWORKS - AA-(SO) 0.85
SeI enerstar Renewable energy Pvt. Ltd. (Greenko) CARe - AA(Ce) CARe - AA(Ce) 0.85
SeI Mihir energy Pvt. Ltd. (Greenko) CARe - AA(Ce) CARe - AA(Ce) 0.85
Shreyas Renewable energy Pvt. Ltd. (Greenko) CARe - AA(Ce) CARe - AA(Ce) 0.85
Zuvan energy Pvt. Ltd. (Greenko) CARe - AA(Ce) CARe - AA(Ce) 0.85
The Tata Power Company Ltd. CRISIL - AA ICRA - AA- 0.75
Indian Oil Corporation Ltd. CRISIL - AAA CRISIL - AAA 0.73
MFL Securitisation Trust LxxxI (PTC of pools from Magma Fincorp Ltd.) CRISIL - AAA(SO) CRISIL - AAA(SO) 0.62
Gateway Distriparks Ltd. IND - AA- IND - AA- 0.60
Indian Railways Finance Corporation Ltd. CRISIL - AAA CRISIL - AAA 0.41
L&T Infrastructure Finance Ltd. CRISIL - AAA CARe - AAA 0.38
Muthoot Finance Ltd. ICRA - AA ICRA - AA- 0.38
Hazaribagh Ranchi expressway Ltd. (NHAI Annuity) CARe - D CARe - D 0.31
Nuvoco Vistas Corporation Ltd. (100% subsidiary of Nirma Ltd. & erstwhile Lafarge India Ltd.) CRISIL - AA CRISIL - AA 0.27
JM Financial Credit Solutions Ltd. ICRA - AA CRISIL - AA 0.06
Reliance Industries Ltd. CRISIL - AAA CRISIL - AAA 0.01
Sub Total 76.06
CREDIT EXPOSURE (PERPETUAl BONDS)
• Punjab National Bank (AT1, BASeL III, Perpetual) CRISIL - AA- CARe - AA 4.11
Punjab National Bank (AT1, BASeL III, Perpetual) IND - AA CARe - AA 1.65
The Tata Power Company Ltd. (Perpetual) CRISIL - AA ICRA - AA- 0.60
Indian Bank (AT1, BASeL III, Perpetual) CRISIL - AA CARe - AA 0.37
Tata Steel Ltd. (Perpetual) CARe - AA- CARe - AA 0.15
Sub Total 6.88
Total 88.40
MONEY MARKET INSTRUMENTS
CP
Bharat Heavy electricals Ltd. CARE - A1+ CRISIL - AA 0.73
Steel Authority Of India Ltd. CRISIL - A1+ CARe - AA- 0.73
Sub Total 1.46
Total 1.46
Cash, Cash equivalents and Net Current Assets 10.14
Grand Total 100.00
• Top Ten Holdings
^Past performance may or may not be sustained in the future. Load is not taken into consideration for computation of performance.
Face Value per Unit: ̀ 10 unless otherwise specified, + Industry Classification as recommended by AMFI, CD - Certificate of Deposit; CP - Commercial Papers, Data is as of January 31, 2021 unless otherwise specified.
[An open ended debt scheme predominantly investing in AA and below rated corporate bonds (excluding AA+ rated corporate bonds)] .....Contd from previous pageHDFC Credit Risk Debt Fund
PORTFOLIO

44 January 2021
CATEgORY OF SCHEME: BANKING AND PSU FUND
KEY FACTSINVESTMENT OBjECTIVETo generate income / capital appreciation through investments in debt and money market instruments consisting predominantly of securities issued by entities such as Scheduled Commercial Banks (SCBs), Public Sector undertakings (PSUs), Public Financial Institutions (PFIs), Municipal Corporations and such other bodies.
There is no assurance that the investment objective of the Scheme will be realized.
FUND MANAgER ¥
Anil Bamboli (since March 26, 2014)
Total experience: Over 23 years
INCEPTION DATE (Date of Allotment)March 26, 2014
NAV (AS ON JANUARY 29, 2021) NAV PER UNIT (`)Regular Plan - Growth Option 17.8357Regular Plan - Dividend Option 10.2269Direct Plan - Growth Option 18.2336Direct Plan - Dividend Option 10.0273
ASSETS UNDER MANAgEMENT (`) IN CROREAs on January 31, 2021 10,735.16Average for Month of January 2021 11,343.90
qUANTITATIVE DATAAverage Maturity * 3.57 yearsMacaulay Duration * 2.73 yearsModified Duration * 2.60 yearsYield to Maturity * 5.45%* Computed on the invested amount.
TOTAL ExPENSE RATIO (As on January 31, 2021)Including Additional expenses and Goods and Service Tax on Management FeesRegular: 0.84% Direct: 0.36%
#BENCHMARK INDEX: NIFTY Banking & PSU Index
##ADDl. BENCHMARK INDEX: CRISIL 1 year T-Bill Index
EXIT lOADNil
PLANS & OPTIONSRegular Plan, Direct Plan. Under each Plan: Growth & Dividend Option (Weekly frequency). The Dividend Option offers Dividend Payout and Reinvestment facility.
MINIMUM APPlICATION AMOUNTPurchase : ` 5,000 and any amount thereafter. Additional Purchase : ` 1,000 and any amount thereafter.
¥ Dedicated Fund Manager for Overseas Investments: Mr. Sankalp Baid (since January 22, 2021) (Total experience: Over 13 years).
Face Value per Unit: ` 10 unless otherwise specified, Data is as of January 31, 2021 unless otherwise specified.
This product is suitable for investors who are seeking ~
l income over short to medium term.l to generate income / capital appreciation through investments
in debt and money market instruments consisting predominantly of securities issued by entities such as Scheduled Commercial Banks (SCBs), Public Sector undertakings (PSUs), Public Financial Institutions (PFIs), Municipal Corporations and such other bodies
VeryHigh
Low to
Moderate
Low
Moderate ModeratelyHigh High
RISKOMETERInvestors understand that their principal will be at
moderate risk
~ Investors should consult their financial advisers, if in doubt about whether the product is suitable for them.
Issuer Rating % to NAVDEBT & DEBT RElATEDgOVERNMENT SECURITIES (CENTRAl/STATE)5.77 GOI 2030 Sovereign 2.34
5.22 GOI 2025 Sovereign 1.63
5.79 GOI 2030 Sovereign 1.24
6.79 GOI 2027 Sovereign 1.13
7.26 GOI 2029 Sovereign 0.75
6.97 GOI 2026 Sovereign 0.50
6.54% Karnataka SDL -ISD 091220 Mat 091230 Sovereign 0.40
5.85 GOI 2030 Sovereign 0.32
6.45 GOI 2029 Sovereign 0.10
Sub Total 8.41CREDIT EXPOSURE (NON PERPETUAl)• Power Finance
Corporation Ltd.CARe - AAA / CRISIL - AAA / ICRA - AAA 7.63
• REC Ltd. CRISIL - AAA / IND - AAA 6.61
• State Bank of India CRISIL - AAA 6.36
• National Bank for Agriculture & Rural Development CRISIL - AAA / ICRA - AAA 6.23
• Housing and Urban Development Corporation Ltd. CARe - AAA 5.23
• Indian Railways Finance Corporation Ltd. CRISIL - AAA 4.24
• National Highways Authority of India CRISIL - AAA 3.43
• Housing Development Finance Corporation Ltd.£ CRISIL - AAA 2.69
• NHPC Ltd. CARe - AAA / ICRA - AAA 2.67
• Hindustan Petroleum Corporation Ltd. CRISIL - AAA 2.64
LIC Housing Finance Ltd. CRISIL - AAA 2.32
Food Corporation of India (Corporate guarantee from Govt of India) CRISIL - AAA(Ce) 2.27
ONGC Petro additions Ltd. (OPAL) (Put on ONGC Ltd.) CARe - AAA(Ce) 2.24
Mahanagar Telephone Nigam Ltd. (Corporate guarantee from Govt of India) CRISIL - AAA(Ce) 1.96
Axis Bank Ltd. CRISIL - A1+ 1.86
Power Grid Corporation of India Ltd. CRISIL - AAA 1.51
Vedanta Ltd. CRISIL - AA- 1.33
Indian Oil Corporation Ltd. CRISIL - AAA 0.94
NTPC Ltd. CRISIL - AAA 0.94
The Tata Power Company Ltd. CRISIL - AA 0.75
Sikka Port and Terminal Ltd. (erstwhile Reliance Ports and Terminals Ltd.) CRISIL - AAA 0.73
export - Import Bank of India CRISIL - AAA 0.65
L&T Housing Finance Ltd. CRISIL - AAA 0.49
TATA Capital Housing Finance Ltd. CRISIL - AAA 0.49
L&T Infrastructure Finance Ltd. CRISIL - AAA 0.48
Reliance Industries Ltd. CRISIL - AAA 0.43
TMF Holdings Ltd. (Subsidiary of Tata Motors Ltd.) ICRA - AA- 0.28
Shriram Transport Finance Company Ltd. IND - AA+ 0.23
Bank of Baroda CARe - AAA 0.20
Issuer Rating % to NAVAashman energy Pvt. Ltd. (Greenko) CARe - AA(Ce) 0.10
Divyesh Power Pvt. Ltd. (Greenko) CARe - AA(Ce) 0.10
elena Renewable energy Pvt. Ltd. (Greenko) CARe - AA(Ce) 0.10
Pratyash Renewable Pvt. Ltd. (Greenko) CARe - AA(Ce) 0.10
SeI Baskara Power Pvt. Ltd. (Greenko) CARe - AA(Ce) 0.10
SeI enerstar Renewable energy Pvt. Ltd. (Greenko) CARe - AA(Ce) 0.10
SeI Mihir energy Pvt. Ltd. (Greenko) CARe - AA(Ce) 0.10
Shreyas Renewable energy Pvt. Ltd. (Greenko) CARe - AA(Ce) 0.10
Zuvan energy Pvt. Ltd. (Greenko) CARe - AA(Ce) 0.10
Hazaribagh Ranchi expressway Ltd. (NHAI Annuity) CARe - D 0.03
Small Industries Development Bank CARe - AAA 0.01
Sub Total 68.77CREDIT EXPOSURE (PERPETUAl BONDS)Canara Bank (AT1, BASeL III, Perpetual) CARe - AA 2.47
Bank of Baroda (AT1, BASeL III, Perpetual) CARe - AA 2.16
State Bank of India (AT1, BASeL III, Perpetual) CRISIL - AA+ 2.12
Union Bank of India (AT1, BASeL III, Perpetual) CARe - AA- 1.74
Union Bank of India (AT1, BASeL III, Perpetual) CRISIL - AA- 1.16
Union Bank of India (AT1, BASeL III, Perpetual) IND - AA 1.02
Bank of Baroda (AT1, BASeL III, Perpetual) CRISIL - AA+ 0.67
ICICI Bank Ltd. (AT1, BASeL III, Perpetual) CARE - AA+ 0.56
Punjab National Bank (AT1, BASeL III, Perpetual) IND - AA 0.53
Punjab National Bank (AT1, BASeL III, Perpetual) CRISIL - AA- 0.53
Sub Total 12.96Total 90.14MONEY MARKET INSTRUMENTSCP NTPC Ltd. CARE - A1+ 1.63
Bharat Heavy electricals Ltd. CARE - A1+ 1.40
National Bank for Agriculture & Rural Development ICRA - A1+ 1.38
Sub Total 4.41CD Indusind Bank Ltd. CRISIL - A1+ 2.33
Axis Bank Ltd. CRISIL - A1+ 0.92
Sub Total 3.25Total 7.66Cash, Cash equivalents and Net Current Assets 2.20
Grand Total 100.00• Top Ten Holdings, £ Co-sponsor
Outstanding exposure in derivative instruments Interest Rate Swap (` in Crore) 825.00
Portfolio Classification By Asset Class (%)
n G-Sec, SDL 8.41
n CP 4.41
n CD 3.25
n Credit exposure 81.73
n Cash, Cash equivalents and Net Current Assets 2.20
Portfolio Classification By Rating Class (%)
n Sovereign 8.41n AAA/AAA(SO)/A1+/A1+(SO)
& equivalent 72.91n AA+ 3.58n AA/AA- 12.87n A+ & Below 0.03n Cash, Cash equivalents and
Net Current Assets 2.20
(An open ended debt scheme predominantly investing in debt instruments of banks, public sector undertakings, public financial institutions and municipal bonds)HDFC Banking and PSU Debt Fund
PORTFOLIO

January 2021 45
PERFORMANCE ^ - Regular Plan - growth Option
Date Period Scheme Returns
(%)
Benchmark Returns
(%)#
Additional Benchmark
Returns (%) ##
Value of ` 10,000 invested
Scheme (`) Benchmark (`)#
Additional Benchmark
(`)##
Jan 31, 20 Last 1 Year 9.65 9.48 5.52 10,962 10,946 10,551Jan 31, 18 Last 3 Years 8.71 8.28 6.67 12,844 12,694 12,135Jan 29, 16 Last 5 Years 8.57 8.07 6.60 15,092 14,749 13,769Mar 26, 14 Since Inception 8.81 8.54 7.06 17,836 17,533 15,963
The above returns are for Regular Plan - Growth Option. Returns greater than 1 year period are compounded annualized (CAGR). Performance of dividend option under the schemes for the investors would be net of distribution tax, if any. For performance of other schemes managed by Anil Bamboli, please refer page 67. Different plans viz. Regular Plan and Direct Plan have a different expense structure. The expenses of the Direct Plan under the Scheme will be lower to the extent of the distribution expenses / commission charged in the Regular Plan. For Performance of Direct Plan, refer page no. 76.
^Past performance may or may not be sustained in the future. Load is not taken into consideration for computation of performance.
(An open ended debt scheme predominantly investing in debt instruments of banks, public sector undertakings, public financial institutions and municipal bonds)HDFC Banking and PSU Debt Fund
.....Contd from previous pageSIP PERFORMANCE ^ - Regular Plan - growth Option
Since Inception SIP
5 year SIP
3 year SIP
1 year SIP
Total Amount Invested (` ‘000) 830.00 600.00 360.00 120.00 Mkt Value As on January 29, 2021 (` ‘000) 1,125.69 746.20 415.46 125.39 Returns (%) 8.68 8.66 9.54 8.50 Benchmark Returns (%) # 8.21 8.21 9.08 7.52 Additional Benchmark Returns (%) ## 6.64 6.41 6.22 4.22
Assuming ` 10,000 invested systematically on the first Business Day of every month over a period of time. CAGR returns are computed after accounting for the cash flow by using xIRR method (investment internal rate of return) for Regular Plan - Growth Option. The above investment simulation is for illustrative purposes only and should not be construed as a promise on minimum returns and safeguard of capital.

46 January 2021
CATEgORY OF SCHEME: GILT FUND
KEY FACTSINVESTMENT OBjECTIVE
To generate credit risk-free returns through investments in sovereign securities issued by the Central Government and/or State Government.
There is no assurance that the investment objective of the Scheme will be realized.
FUND MANAgER ¥
Anil Bamboli (since September 1, 2007)
Total experience: Over 23 years
INCEPTION DATE (Date of Allotment)
July 25, 2001
NAV (AS ON JANUARY 29, 2021) NAV PER UNIT (`)
Regular Plan - Growth Option 43.7871Regular Plan - Dividend Option 11.9378Direct Plan - Growth Option 45.2178Direct Plan - Dividend Option 12.4517
ASSETS UNDER MANAgEMENT (`) IN CRORE
As on January 31, 2021 2,141.46Average for Month of January 2021 2,132.22
qUANTITATIVE DATA
Average Maturity * 8.11 yearsMacaulay Duration * 5.98 yearsModified Duration * 5.81 yearsYield to Maturity * 5.78%* Computed on the invested amount.
TOTAL ExPENSE RATIO (As on January 31, 2021)Including Additional expenses and Goods and Service Tax on Management Fees
Regular: 0.91% Direct: 0.44%
#BENCHMARK INDEX: CRISIL Dynamic Gilt Index
##ADDl. BENCHMARK INDEX: CRISIL 10 year Gilt Index
EXIT lOAD
Nil
PLANS & OPTIONS
Regular Plan, Direct Plan. Under both the Plans: Growth & Dividend Option (Dividend Option offers Dividend Payout and Reinvestment facility.
MINIMUM APPlICATION AMOUNT
Purchase : ` 5,000 and any amount thereafter. Additional Purchase : ` 1,000 and any amount thereafter.
¥ Dedicated Fund Manager for Overseas Investments: Mr. Sankalp Baid (since January 22, 2021) (Total experience: Over 13 years).
Face Value per Unit: ` 10 unless otherwise specified, Data is as of January 31, 2021 unless otherwise specified.
PERFORMANCE ^ - Regular Plan - growth Option
Date Period Scheme Returns
(%)
Benchmark Returns
(%)#
Additional Benchmark
Returns (%) ##
Value of ` 10,000 invested
Scheme (`) Benchmark (`)#
Additional Benchmark
(`)##
Jan 31, 20 Last 1 Year 9.85 11.35 9.14 10,982 11,132 10,911Jan 31, 18 Last 3 Years 8.26 9.94 9.04 12,687 13,286 12,963Jan 29, 16 Last 5 Years 8.51 8.89 7.93 15,050 15,313 14,654Jul 25, 01 Since Inception 7.86 8.47 N.A. 43,787 48,960 N.A.
Returns greater than 1 year period are compounded annualized (CAGR). N.A. Not Available. Performance of dividend option under the schemes for the investors would be net of distribution tax, if any. For performance of other schemes managed by Anil Bamboli, please refer page 67. Different plans viz. Regular Plan and Direct Plan have a different expense structure. The expenses of the Direct Plan under the Scheme will be lower to the extent of the distribution expenses / commission charged in the Regular Plan. For Performance of Direct Plan, refer page no. 76.
This product is suitable for investors who are seeking ~
l credit risk free returns over medium to long term
l to generate credit risk-free returns through investments in sovereign securities issued by the Central Government and / or State Government
VeryHigh
Low to
Moderate
Low
Moderate ModeratelyHigh High
RISKOMETERInvestors understand that their principal will be at
moderate risk
~ Investors should consult their financial advisers, if in doubt about whether the product is suitable for them.
^Past performance may or may not be sustained in the future. Load is not taken into consideration for computation of performance.
Portfolio Classification By Asset Class (%)
n G-Sec, SDL 93.23
n Cash, Cash equivalents and Net Current Assets 6.77
Portfolio Classification By Rating Class (%)
n Sovereign 93.23n Cash, Cash equivalents and
Net Current Assets 6.77
(An open ended debt scheme investing in government securities across maturities)HDFC Gilt Fund
Issuer Rating % to NAV
DEBT & DEBT RElATED
gOVERNMENT SECURITIES (CENTRAl/STATE)
• 5.77 GOI 2030 Sovereign 17.28
• 7.26 GOI 2029 Sovereign 16.84
• 6.45 GOI 2029 Sovereign 10.77
• 7.17 GOI 2028 Sovereign 10.03
• 6.79 GOI 2027 Sovereign 9.36
• 7.59 GOI 2026 Sovereign 5.60
• 6.79 GOI 2029 Sovereign 5.15
• 5.79 GOI 2030 Sovereign 4.84
• 6.19 GOI 2034 Sovereign 3.69
• 6.97 GOI 2026 Sovereign 3.23
8.60% Rajasthan SDL- Mat 061128 Sovereign 1.31
7.83% Maharashtra SDL - ISD 080420 Mat 080430 Sovereign 1.27
Issuer Rating % to NAV
7.73% Gujarat SDL - ISD 070420 Mat 080429 Sovereign 1.26
6.8 GOI 2060 Sovereign 1.22
5.85 GOI 2030 Sovereign 0.70
8.24 GOI 2033 Sovereign 0.23
7.73 GOI 2034 Sovereign 0.16
7.37 GOI 2023 Sovereign 0.12
7.95 GOI 2032 Sovereign 0.06
8.97 GOI 2030 Sovereign 0.06
7.32 GOI 2024 Sovereign 0.05
Sub Total 93.23
Cash, Cash equivalents and Net Current Assets 6.77
Grand Total 100.00
• Top Ten Holdings
Outstanding exposure in derivative instruments Interest Rate Swap (` in Crore) 60.00
PORTFOLIO
SIP PERFORMANCE ^ - Regular Plan - growth Option
Since Inception SIP
15 year SIP 10 year SIP 5 Year SIP 3 Year SIP 1 Year SIP
Total Amount Invested (` ‘000) 2,350.00 1,800.00 1,200.00 600.00 360.00 120.00
Mkt Value As on January 29, 2021 (` ‘000) 5,179.91 3,387.82 1,850.20 728.13 411.08 124.36
Returns (%) 7.47 7.96 8.39 7.68 8.82 6.86
Benchmark Returns (%) # 8.09 8.51 8.96 8.97 10.45 7.50
Additional Benchmark Returns (%) ## N.A. 7.28 7.80 7.82 9.36 5.72
Assuming ` 10,000 invested systematically on the first Business Day of every month over a period of time. CAGR returns are computed after accounting for the cash flow by using xIRR method (investment internal rate of return) for Regular Plan - Growth Option. The above investment simulation is for illustrative purposes only and should not be construed as a promise on minimum returns and safeguard of capital.

January 2021 47
CATEgORY OF SCHEME: DYNAMIC BOND FUND
KEY FACTSINVESTMENT OBjECTIVE
To generate income / capital appreciation by investing in a range of debt and money market instruments.
There is no assurance that the investment objective of the Scheme will be realized.
FUND MANAgER ¥
Anil Bamboli (since February 16, 2004)
Total experience: Over 23 years
INCEPTION DATE (Date of Allotment)
April 28, 1997
NAV (AS ON JANUARY 29, 2021) NAV PER UNIT (`)
Regular Plan - Growth Option 68.1443Regular Plan - Quarterly Dividend Option 11.7661Regular Plan - Half-Yearly Dividend Option 11.3352Regular Plan - Yearly Dividend Option 13.2503Regular Plan - Normal Dividend Option 14.5985Direct Plan - Growth Option 72.3014Direct Plan - Quarterly Dividend Option 12.6166Direct Plan - Half-Yearly Dividend Option 12.7126Direct Plan - Yearly Dividend Option 14.1878Direct Plan - Normal Dividend Option 15.2235
ASSETS UNDER MANAgEMENT (`) IN CRORE
As on January 31, 2021 488.19Average for Month of January 2021 490.34
qUANTITATIVE DATA
Average Maturity * 4.48 yearsMacaulay Duration * 3.44 yearsModified Duration * 3.32 yearsYield to Maturity * 5.42%* Computed on the invested amount.
TOTAL ExPENSE RATIO (As on January 31, 2021)Including Additional expenses and Goods and Service Tax on Management Fees
Regular: 1.76% Direct: 1.21%
#BENCHMARK INDEX: CRISIL Dynamic Debt Index
##ADDl. BENCHMARK INDEX: CRISIL 10 year Gilt Index
EXIT lOAD
l In respect of each purchase / switch-in of Units, an exit Load of 0.50% is payable if Units are redeemed / switched-out within 6 months from the date of allotment.
l No exit Load is payable if Units are redeemed / switched-out after 6 months from the date of allotment.
For further details, please refer to para ‘Exit Load’ on Pg 67.
PLANS & OPTIONS
Regular Plan, Direct Plan. Under each Plan: Growth, Normal Dividend, Quarterly Dividend, Half Yearly Dividend, & Yearly Dividend. All Dividend Options offer Payout and Reinvestment facility.
MINIMUM APPlICATION AMOUNT
Purchase : ` 5,000 and any amount thereafter. Additional Purchase : ` 1,000 and any amount thereafter.
¥ Dedicated Fund Manager for Overseas Investments: Mr. Sankalp Baid (since January 22, 2021) (Total experience: Over 13 years).
Face Value per Unit: ` 10 unless otherwise specified, Data is as of January 31, 2021 unless otherwise specified.
PERFORMANCE ^ - Regular Plan - growth Option
Date Period Scheme Returns
(%)
Benchmark Returns
(%)#
Additional Benchmark
Returns (%) ##
Value of ` 10,000 invested
Scheme (`) Benchmark (`)#
Additional Benchmark
(`)##
Jan 31, 20 Last 1 Year 8.35 11.40 9.14 10,832 11,137 10,911Jan 31, 18 Last 3 Years 5.47 9.52 9.04 11,730 13,132 12,963Jan 29, 16 Last 5 Years 6.66 9.01 7.93 13,807 15,402 14,654Apr 28, 97 Since Inception 8.41 N.A. N.A. 68,144 N.A. N.A.
Returns greater than 1 year period are compounded annualized (CAGR). N.A. Not Available. Performance of dividend option under the schemes for the investors would be net of distribution tax, if any. For performance of other schemes managed by Anil Bamboli, please refer page 67. Different plans viz. Regular Plan and Direct Plan have a different expense structure. The expenses of the Direct Plan under the Scheme will be lower to the extent of the distribution expenses / commission charged in the Regular Plan. For Performance of Direct Plan, refer page no. 76.
This product is suitable for investors who are seeking ~
l income over medium to long term
l to generate income / capital appreciation by investing in a range of debt and money market instruments
VeryHigh
Low to
Moderate
Low
Moderate ModeratelyHigh High
RISKOMETERInvestors understand that their principal will be at
moderately high risk~ Investors should consult their financial advisers, if in doubt about whether the product is suitable for them.
^Past performance may or may not be sustained in the future. Load is not taken into consideration for computation of performance.
Portfolio Classification By Asset Class (%)
n G-Sec, SDL 41.55
n Credit exposure 51.80
n Cash, Cash equivalents and Net Current Assets 6.65
Portfolio Classification By Rating Class (%)
n Sovereign 41.55n AAA/AAA(SO)/A1+/A1+(SO)
& equivalent 20.60n AA/AA- 22.91n A+ & Below 8.29n Cash, Cash equivalents and
Net Current Assets 6.65
(An open ended dynamic debt scheme investing across duration)HDFC Dynamic Debt Fund
Issuer Rating % to NAV
DEBT & DEBT RElATED
gOVERNMENT SECURITIES (CENTRAl/STATE)
• 7.26 GOI 2029 Sovereign 11.02
• 7.17 GOI 2028 Sovereign 11.00
• 6.45 GOI 2029 Sovereign 7.35
• 6.79 GOI 2029 Sovereign 4.30
6.79 GOI 2027 Sovereign 2.16
7.42% Maharashtra SDL - Mat 110522 Sovereign 2.13
7.32 GOI 2024 Sovereign 1.10
8.68% Gujarat SDL - Mat 060223. Sovereign 1.10
6.97 GOI 2026 Sovereign 1.09
GOI 2023 Sovereign 0.16
8.26% Maharashtra SDL - ISD 120815 Mat 120825 Sovereign 0.14
8.19% Rajasthan SDL (UDAY Scheme- Strip Ix ) - ISD 230616 Mat 230626 Sovereign @
Sub Total 41.55
CREDIT EXPOSURE (NON PERPETUAl)
• Hazaribagh Ranchi Expressway Ltd. (NHAI Annuity) CARe - D 8.29
• Reliance Industries Ltd. CRISIL - AAA 8.23
• State Bank of India CRISIL - AAA 5.59
Issuer Rating % to NAV
• Vedanta Ltd. CRISIL - AA- 5.09
Mahanagar Telephone Nigam Ltd. (Corporate guarantee from Govt of India) CARe - AAA(Ce) 3.40
Jamnagar Utilities & Power Pvt. Ltd. (erstwhile Reliance Utilities & Power Pvt. Ltd.) CRISIL - AAA 3.24
INOx Wind Infrastructure Services Ltd. CRISIL - AA(Ce) 2.05
NTPC Ltd. CRISIL - AAA 0.14
Sub Total 36.03
CREDIT EXPOSURE (PERPETUAl BONDS)
• Canara Bank (AT1, BASeL III, Perpetual) CARe - AA 7.35
• Union Bank of India (AT1, BASeL III, Perpetual) CARe - AA- 4.20
Punjab National Bank (AT1, BASeL III, Perpetual) CRISIL - AA- 3.18
The Tata Power Company Ltd. (Perpetual) CRISIL - AA 1.04
Sub Total 15.77
Total 93.35
Cash, Cash equivalents and Net Current Assets 6.65
Grand Total 100.00
• Top Ten Holdings, @ less than 0.01%
Outstanding exposure in derivative instruments Interest Rate Swap (` in Crore) 40.00
PORTFOLIO
SIP PERFORMANCE ^ - Regular Plan - growth Option
Since Inception SIP
15 year SIP 10 year SIP 5 Year SIP 3 Year SIP 1 Year SIP
Total Amount Invested (` ‘000) 2,860.00 1,800.00 1,200.00 600.00 360.00 120.00
Mkt Value As on January 29, 2021 (` ‘000) 7,713.05 3,221.71 1,723.43 693.06 398.48 124.65
Returns (%) 7.54 7.36 7.04 5.71 6.72 7.32
Benchmark Returns (%) # N.A. 8.96 9.17 9.13 10.49 8.44
Additional Benchmark Returns (%) ## N.A. 7.28 7.80 7.82 9.36 5.72
Assuming ` 10,000 invested systematically on the first Business Day of every month over a period of time. CAGR returns are computed after accounting for the cash flow by using xIRR method (investment internal rate of return) for Regular Plan - Growth Option. The above investment simulation is for illustrative purposes only and should not be construed as a promise on minimum returns and safeguard of capital.

48 January 2021
CATEgORY OF SCHEME: MEDIUM TO LONG DURATION FUND
KEY FACTS
INVESTMENT OBjECTIVE
To generate income / capital appreciation through investments in debt and money market instruments.There is no assurance that the investment objective of the Scheme will be realized.
FUND MANAgER ¥
Shobhit Mehrotra (since September 11, 2007)
Total experience: Over 25 years
INCEPTION DATE (Date of Allotment)
September 11, 2000
NAV (AS ON JANUARY 29, 2021) NAV PER UNIT (`)
Regular Plan - Growth Option 46.9049Regular Plan - Quarterly Dividend Option 11.3781Regular Plan - Normal Dividend Option 14.7906Direct Plan - Growth Option 49.6753Direct Plan - Quarterly Dividend Option 12.2094Direct Plan - Normal Dividend Option 15.7092
ASSETS UNDER MANAgEMENT (`) IN CRORE
As on January 31, 2021 686.64Average for Month of January 2021 696.86
qUANTITATIVE DATA
Average Maturity * 8.79 yearsMacaulay Duration * 6.04 yearsModified Duration * 5.83 yearsYield to Maturity * 6.31%* Computed on the invested amount for debt portfolio.
TOTAL ExPENSE RATIO (As on January 31, 2021)Including Additional expenses and Goods and Service Tax on Management Fees
Regular: 2.29% Direct: 1.39%
#BENCHMARK INDEX: NIFTY Medium to Long Duration Debt Index
##ADDl. BENCHMARK INDEX: CRISIL 10 year Gilt Index
EXIT lOAD
l In respect of each purchase / switch-in of Units, an exit Load of 0.25% is payable if Units are redeemed / switched-out within 1 month from the date of allotment.
l No exit Load is payable if Units are redeemed / switched-out after 1 month from the date of allotment.
For further details, please refer to para ‘Exit Load’ on Pg 67.
PLANS & OPTIONS
Regular Plan, Direct Plan. Under each Plan : Growth, Quarterly Dividend & Normal Dividend. Both Dividend Options offer Payout and Reinvestment facility.
MINIMUM APPlICATION AMOUNT
Purchase : ` 5,000 and any amount thereafter.Additional Purchase : ` 1,000 and any amount thereafter.
¥ Dedicated Fund Manager for Overseas Investments: Mr. Sankalp Baid (since January 22, 2021) (Total experience: Over 13 years).
PERFORMANCE ^ - Regular Plan - growth Option
Date Period Scheme Returns
(%)
Benchmark Returns
(%)#
Additional Benchmark
Returns (%) ##
Value of ` 10,000 invested
Scheme (`) Benchmark (`)#
Additional Benchmark
(`)##
Jan 31, 20 Last 1 Year 8.86 12.13 9.14 10,884 11,209 10,911Jan 31, 18 Last 3 Years 7.39 9.57 9.04 12,383 13,153 12,963Jan 29, 16 Last 5 Years 7.42 8.90 7.93 14,311 15,322 14,654Sep 11, 00 Since Inception 7.87 N.A. N.A. 46,905 N.A. N.A.
Returns greater than 1 year period are compounded annualized (CAGR). N.A. Not Available. Performance of dividend option under the schemes for the investors would be net of distribution tax, if any. For performance of other schemes managed by Shobhit Mehrotra, please refer page 67. Different plans viz. Regular Plan and Direct Plan have a different expense structure. The expenses of the Direct Plan under the Scheme will be lower to the extent of the distribution expenses / commission charged in the Regular Plan. For Performance of Direct Plan, refer page no. 73.
Face Value per Unit: ` 10 unless otherwise specified, Data is as of January 31, 2021 unless otherwise specified.
This product is suitable for investors who are seeking ~
l income over medium to long term
l to generate income / capital appreciation through investments in debt and money market instruments
VeryHigh
Low to
Moderate
Low
Moderate ModeratelyHigh High
RISKOMETERInvestors understand that their principal will be at
moderately high risk~ Investors should consult their financial advisers, if in doubt about whether the product is suitable for them.
^Past performance may or may not be sustained in the future. Load is not taken into consideration for computation of performance.
Portfolio Classification By Asset Class (%)
n G-Sec 61.01
n Credit exposure 33.95
n Cash, Cash equivalents and Net Current Assets 5.04
Portfolio Classification By Rating Class (%)
n Sovereign 61.01n AAA/AAA(SO)/A1+/A1+(SO)
& equivalent 15.63n AA+ 8.03n AA/AA- 10.29n Cash, Cash equivalents and
Net Current Assets 5.04
[An open ended medium term debt scheme investing in instruments such that the Macaulay Duration of the Portfolio is between 4 years and 7 years (Refer page 2 for definition of Macaulay Duration)]HDFC Income Fund
Issuer Rating % to NAV
DEBT & DEBT RElATED
gOVERNMENT SECURITIES (CENTRAl/STATE)
• 5.77 GOI 2030 Sovereign 15.09
• 6.19 GOI 2034 Sovereign 9.02
• 7.57 GOI 2033 Sovereign 6.44
• 6.68 GOI 2031 Sovereign 6.03
• 6.67 GOI 2050 Sovereign 5.20
• 5.85 GOI 2030 Sovereign 5.08
7.26 GOI 2029 Sovereign 3.92
6.97 GOI 2026 Sovereign 3.87
6.45 GOI 2029 Sovereign 2.99
6.79 GOI 2029 Sovereign 1.53
GOI 2023 Sovereign 0.94
8.2 GOI 2025 Sovereign 0.51
7.95 GOI 2032 Sovereign 0.39
9.15 GOI 2024 Sovereign @
Sub Total 61.01
Issuer Rating % to NAV
CREDIT EXPOSURE (NON PERPETUAl)
• Power Finance Corporation Ltd. CRISIL - AAA 7.04
• NTPC Ltd. CRISIL - AAA 4.04
Vedanta Ltd. CRISIL - AA- 3.55
IndInfravit Trust CRISIL - AAA 2.97
ReC Ltd. CRISIL - AAA 1.58
Sub Total 19.18
CREDIT EXPOSURE (PERPETUAl BONDS)
• Punjab National Bank (AT1, BASeL III, Perpetual) IND - AA 5.99
• State Bank of India (AT1, BASeL III, Perpetual) CRISIL - AA+ 4.28
export - Import Bank of India (AT1, BASeL III, Perpetual) CRISIL - AA+ 3.75
Union Bank of India (AT1, BASeL III, Perpetual) CARe - AA- 0.75
Sub Total 14.77
Total 94.96
Cash, Cash equivalents and Net Current Assets 5.04
Grand Total 100.00
• Top Ten Holdings, @ less than 0.01%
PORTFOLIO
SIP PERFORMANCE ^ - Regular Plan - growth Option
Since Inception SIP
15 year SIP 10 year SIP 5 Year SIP 3 Year SIP 1 Year SIP
Total Amount Invested (` ‘000) 2,450.00 1,800.00 1,200.00 600.00 360.00 120.00
Mkt Value As on January 29, 2021 (` ‘000) 5,508.02 3,270.93 1,760.98 714.71 408.03 124.48
Returns (%) 7.32 7.54 7.45 6.94 8.32 7.05
Benchmark Returns (%) # N.A. 8.56 8.95 9.23 10.87 8.97
Additional Benchmark Returns (%) ## N.A. 7.28 7.80 7.82 9.36 5.72
Assuming ` 10,000 invested systematically on the first Business Day of every month over a period of time. CAGR returns are computed after accounting for the cash flow by using xIRR method (investment internal rate of return) for Regular Plan - Growth Option. The above investment simulation is for illustrative purposes only and should not be construed as a promise on minimum returns and safeguard of capital.

January 2021 49
CATEgORY OF SCHEME: MEDIUM DURATION FUND
KEY FACTS
INVESTMENT OBjECTIVE
To generate income / capital appreciation through investments in Debt and Money Market Instruments.
There is no assurance that the investment objective of the Scheme will be realized.
FUND MANAgER ¥
Shobhit Mehrotra (since September 1, 2007)
Total experience: Over 25 years
INCEPTION DATE (Date of Allotment)
February 6, 2002
NAV (AS ON JANUARY 29, 2021) NAV PER UNIT (`)
Regular Plan - Growth Option 43.2712Regular Plan - Dividend Option 16.4171Regular Plan - Fortnightly Dividend Option 10.1980Direct Plan - Growth Option 45.5213Direct Plan - Dividend Option 17.0401Direct Plan - Fortnightly Dividend Option 10.2019
ASSETS UNDER MANAgEMENT (`) IN CRORE
As on January 31, 2021 2,906.06Average for Month of January 2021 2,785.17
qUANTITATIVE DATA
Average Maturity * 4.12 yearsMacaulay Duration * 3.23 yearsModified Duration * 3.08 yearsYield to Maturity * 6.69%* Computed on the invested amount.
TOTAL ExPENSE RATIO (As on January 31, 2021)Including Additional expenses and Goods and Service Tax on Management Fees
Regular: 1.29% Direct: 0.49%
#BENCHMARK INDEX: NIFTY Medium Duration Debt Index
##ADDl. BENCHMARK INDEX: CRISIL 1 year T-Bill Index
EXIT lOAD
Nil
PLANS & OPTIONS
Regular Plan, Direct Plan. Under both the Plans : Growth, Normal Dividend & Fortnightly Dividend. Both Dividend Options offer Payout and Reinvestment facility.
MINIMUM APPlICATION AMOUNT
Purchase : ` 5,000 and any amount thereafter. Additional Purchase : ` 1,000 and any amount thereafter.
¥ Dedicated Fund Manager for Overseas Investments: Mr. Sankalp Baid (since January 22, 2021) (Total experience: Over 13 years).
Face Value per Unit: ` 10 unless otherwise specified, Data is as of January 31, 2021 unless otherwise specified.
This product is suitable for investors who are seeking ~
l income over medium terml to generate income / capital appreciation through
investments in Debt and Money Market Instruments
VeryHigh
Low to
Moderate
Low
Moderate ModeratelyHigh High
RISKOMETERInvestors understand that their principal will be at
moderately high risk
~ Investors should consult their financial advisers, if in doubt about whether the product is suitable for them.
[An open ended medium term debt scheme investing in instruments such that the Macaulay Duration of the portfolio is between 3 years and 4 years (Refer page 2 for definition of Macaulay Duration)]HDFC Medium Term Debt Fund
Issuer Rating % to NAV
DEBT & DEBT RElATED
gOVERNMENT SECURITIES (CENTRAl/STATE)
• 6.18 GOI 2024 Sovereign 3.58
• 7.27 GOI 2026 Sovereign 3.34
• 7.59 GOI 2026 Sovereign 2.81
5.15 GOI 2025 Sovereign 2.10
7.26 GOI 2029 Sovereign 2.04
6.97 GOI 2026 Sovereign 1.83
5.77 GOI 2030 Sovereign 1.70
GOI 2033 Sovereign 1.57
5.22 GOI 2025 Sovereign 1.03
7.32 GOI 2024 Sovereign 0.92
5.85 GOI 2030 Sovereign 0.86
5.79 GOI 2030 Sovereign 0.85
7.57 GOI 2033 Sovereign 0.76
6.79 GOI 2027 Sovereign 0.73
6.45 GOI 2029 Sovereign 0.35
6.67 GOI 2050 Sovereign 0.35
Sub Total 24.82
CREDIT EXPOSURE (NON PERPETUAl)
• Power Finance Corporation Ltd. CRISIL - AAA 5.34
• Embassy Office Parks REIT CRISIL - AAA 5.20
• Housing Development Finance Corporation Ltd.£ CRISIL - AAA 4.34
• REC Ltd. CRISIL - AAA 3.87
• Vedanta Ltd. CRISIL - AA- 2.78
• NTPC Ltd. CRISIL - AAA 2.61
• TVS Credit Services Ltd. CRISIL - AA- 2.58
Green Infra Wind energy Ltd. CRISIL - AA 2.51
Shriram City Union Finance Ltd. CRISIL - AA 2.41
Muthoot Finance Ltd. CRISIL - AA 2.09
Sikka Port and Terminal Ltd. (erstwhile Reliance Ports and Terminals Ltd.) CRISIL - AAA 2.04
INOx Wind Infrastructure Services Ltd. CRISIL - AA(Ce) 1.72
INOx Wind Ltd. CRISIL - AA(Ce) 1.72
Pipeline Infrastructure Pvt. Ltd. CRISIL - AAA 1.69
Tata Motors Finance Solutions Ltd. CARe - AA- 1.37
TATA Housing Development Co Ltd. CARe - AA 1.32
Shriram Transport Finance Company Ltd. CRISIL - AA+ 1.09
Copeland Jan 2020 (PTC of pools from Muthoot Capital Services Ltd.) CRISIL - AA(SO) 1.07
Indian Railways Finance Corporation Ltd. CRISIL - AAA 0.95
Reliance Industries Ltd. CRISIL - AAA 0.92
LIC Housing Finance Ltd. CRISIL - AAA 0.91
IndInfravit Trust CRISIL - AAA 0.88
JM Financial Asset Reconstruction Company Ltd. ICRA - AA- 0.87
National Housing Bank CRISIL - AAA 0.87
Mangalore Refinery and Petrochemicals Ltd. CARe - AAA 0.86
Issuer Rating % to NAV
National Bank for Agriculture & Rural Development ICRA - AAA 0.86
NHPC Ltd. CARe - AAA 0.57
GeRA Development Pvt. Ltd. CARe - AA- 0.55
The Tata Power Company Ltd. CRISIL - AA 0.55
Indian Oil Corporation Ltd. CRISIL - AAA 0.53
Coastal Gujarat Power Ltd. (Corporate Guarantee of Tata Power) CARe - AA(Ce) 0.48
Tata Motors Ltd. CRISIL - AA- 0.35
Talwandi Sabo Power Ltd. (Corporate Guarantee of Vedanta Ltd.) CRISIL - AA-(Ce) 0.22
Aarish Solar Power Pvt. Ltd. (Greenko) CARe - AA(Ce) 0.15
Aashman energy Pvt. Ltd. (Greenko) CARe - AA(Ce) 0.15
Divyesh Power Pvt. Ltd. (Greenko) CARe - AA(Ce) 0.15
elena Renewable energy Pvt. Ltd. (Greenko) CARe - AA(Ce) 0.15
Pratyash Renewable Pvt. Ltd. (Greenko) CARe - AA(Ce) 0.15
SeI Baskara Power Pvt. Ltd. (Greenko) CARe - AA(Ce) 0.15
SeI enerstar Renewable energy Pvt. Ltd. (Greenko) CARe - AA(Ce) 0.15
SeI Mihir energy Pvt. Ltd. (Greenko) CARe - AA(Ce) 0.15
Shreyas Renewable energy Pvt. Ltd. (Greenko) CARe - AA(Ce) 0.15
Zuvan energy Pvt. Ltd. (Greenko) CARe - AA(Ce) 0.15
L&T Infrastructure Finance Ltd. CRISIL - AAA 0.04
Indiabulls Housing Finance Ltd. CRISIL - AA 0.03
Sub Total 57.69
CREDIT EXPOSURE (PERPETUAl BONDS)
Indian Bank (AT1, BASeL III, Perpetual) CRISIL - AA 1.72
Union Bank of India (BASeL III, Perpetual) BRICKWORKS - AA 1.72
Punjab National Bank (AT1, BASeL III, Perpetual) CRISIL - AA- 0.89
The Tata Power Company Ltd. (Perpetual) CRISIL - AA 0.88
TATA International Ltd. (Perpetual) CARe - A 0.87
Union Bank of India (AT1, BASeL III, Perpetual) BRICKWORKS - AA 0.87
Tata Steel Ltd. (Perpetual) CARe - AA- 0.62
Union Bank of India (AT1, BASeL III, Perpetual) CARe - AA- 0.18
Sub Total 7.75
Total 90.26
MONEY MARKET INSTRUMENTS
CP
Fedbank Financial Services Ltd. CRISIL - A1+ 1.14
Sub Total 1.14
Total 1.14
Cash, Cash equivalents and Net Current Assets 8.60
Grand Total 100.00
• Top Ten Holdings, £ Co-sponsor
PORTFOLIO

50 January 2021
.....Contd from previous page
PERFORMANCE ^ - Regular Plan - growth Option
Date Period Scheme Returns
(%)
Benchmark Returns
(%)#
Additional Benchmark
Returns (%) ##
Value of ` 10,000 invested
Scheme (`) Benchmark (`)#
Additional Benchmark
(`)##
Jan 31, 20 Last 1 Year 9.16 11.76 5.52 10,913 11,172 10,551Jan 31, 18 Last 3 Years 8.18 9.41 6.67 12,658 13,092 12,135Jan 29, 16 Last 5 Years 8.25 8.84 6.60 14,872 15,279 13,769Feb 06, 02 Since Inception 8.02 8.09 6.08 43,271 43,838 30,664
Returns greater than 1 year period are compounded annualized (CAGR). N.A. Not Available. Performance of dividend option under the schemes for the investors would be net of distribution tax, if any. For performance of other schemes managed by Shobhit Mehrotra, please refer page 67. Different plans viz. Regular Plan and Direct Plan have a different expense structure. The expenses of the Direct Plan under the Scheme will be lower to the extent of the distribution expenses / commission charged in the Regular Plan. For Performance of Direct Plan, refer page no. 73.
SIP PERFORMANCE ^ - Regular Plan - growth Option
Since Inception SIP
15 year SIP 10 year SIP 5 Year SIP 3 Year SIP 1 Year SIP
Total Amount Invested (` ‘000) 2,280.00 1,800.00 1,200.00 600.00 360.00 120.00
Mkt Value As on January 29, 2021 (` ‘000) 5,350.33 3,526.72 1,846.36 736.93 412.19 125.93
Returns (%) 8.28 8.45 8.35 8.16 9.01 9.37
Benchmark Returns (%) # 8.34 8.73 9.03 9.24 10.59 9.51
Additional Benchmark Returns (%) ## 6.39 6.63 6.87 6.41 6.22 4.22
Assuming ` 10,000 invested systematically on the first Business Day of every month over a period of time. CAGR returns are computed after accounting for the cash flow by using xIRR method (investment internal rate of return) for Regular Plan - Growth Option. The above investment simulation is for illustrative purposes only and should not be construed as a promise on minimum returns and safeguard of capital.
Portfolio Classification By Asset Class (%)
n G-Sec 24.82
n CP 1.14
n Credit exposure 65.44
n Cash, Cash equivalents and Net Current Assets 8.60
Portfolio Classification By Rating Class (%)
n Sovereign 24.82n AAA/AAA(SO)/A1+/A1+(SO) &
equivalent 33.62n AA+ 1.09n AA/AA- 31.00n A+ & Below 0.87n Cash, Cash equivalents and Net
Current Assets 8.60
^Past performance may or may not be sustained in the future. Load is not taken into consideration for computation of performance.
[An open ended medium term debt scheme investing in instruments such that the Macaulay Duration of the portfolio is between 3 years and 4 years (Refer page 2 for definition of Macaulay Duration)]HDFC Medium Term Debt Fund

January 2021 51
CATEgORY OF SCHEME: SHORT DURATION FUND
Face Value per Unit: ` 10 unless otherwise specified, CD - Certificate of Deposit; CP - Commercial Papers. Data is as of January 31, 2021 unless otherwise specified.
KEY FACTS
INVESTMENT OBjECTIVE
To generate income / capital appreciation through investments in Debt and Money Market Instruments.
There is no assurance that the investment objective of the Scheme will be realized.
FUND MANAgER ¥
Anil Bamboli (since June 25, 2010)
Total experience: Over 23 years
INCEPTION DATE (Date of Allotment)
June 25, 2010
NAV (AS ON JANUARY 29, 2021) NAV PER UNIT (`)
Regular Plan - Growth Option 24.5371Regular Plan - Fortnightly Dividend Option 10.3111Regular Plan - Normal Dividend Option 16.4978Direct Plan - Growth Option 24.8955Direct Plan - Fortnightly Dividend Option 10.3838Direct Plan - Normal Dividend Option 16.6425
ASSETS UNDER MANAgEMENT (`) IN CRORE
As on January 31, 2021 18,389.99Average for Month of January 2021 18,613.04
qUANTITATIVE DATA
Average Maturity * 3.41 yearsMacaulay Duration * 2.66 yearsModified Duration * 2.54 yearsYield to Maturity * 5.48%* Computed on the invested amount.
TOTAL ExPENSE RATIO (As on January 31, 2021)Including Additional expenses and Goods and Service Tax on Management Fees
Regular: 0.78% Direct: 0.24%
#BENCHMARK INDEX: CRISIL Short Term Bond Fund Index
##ADDl. BENCHMARK INDEX: CRISIL 1 year T-Bill Index
EXIT lOAD
Nil
PLANS & OPTIONS
Regular Plan, Direct Plan. Under each Plan: Growth, Fortnightly Dividend & Normal Dividend. Both Dividend options offer Payout and Reinvestment facilities.
MINIMUM APPlICATION AMOUNT
Purchase : ` 5,000 and any amount thereafter. Additional Purchase : ` 1,000 and any amount thereafter.
¥ Dedicated Fund Manager for Overseas Investments: Mr. Sankalp Baid (since January 22, 2021) (Total experience: Over 13 years).
This product is suitable for investors who are seeking ~
l income over short term.
l to generate income / capital appreciation through investments in Debt and Money Market Instruments
VeryHigh
Low to
Moderate
Low
Moderate ModeratelyHigh High
RISKOMETERInvestors understand that their principal will be at
moderate risk~ Investors should consult their financial advisers, if in doubt about whether the product is suitable for them.
[An open ended short term debt scheme investing in instruments such that the Macaulay Duration of the portfolio is between 1 year and 3 years (Refer page 2 for definition of Macaulay Duration)]HDFC Short Term Debt Fund
Issuer Rating % to NAVDEBT & DEBT RElATEDgOVERNMENT SECURITIES (CENTRAl/STATE)• 5.77 GOI 2030 Sovereign 4.27• 7.32 GOI 2024 Sovereign 3.156.79 GOI 2027 Sovereign 1.755.79 GOI 2030 Sovereign 1.645.22 GOI 2025 Sovereign 1.367.59 GOI 2026 Sovereign 1.306.97 GOI 2026 Sovereign 1.106.45 GOI 2029 Sovereign 0.848.48% Karnataka SDL - Mat 171022 Sovereign 0.757.27 GOI 2026 Sovereign 0.736.18 GOI 2024 Sovereign 0.685.85 GOI 2030 Sovereign 0.607.59% Gujarat SDL - Mat 150227 Sovereign 0.587.17 GOI 2028 Sovereign 0.447.89% Gujarat SDL - Mat 150525 Sovereign 0.447.26 GOI 2029 Sovereign 0.418.38% Karnataka SDL - Mat 311022 Sovereign 0.29GOI 2033 Sovereign 0.286.54% Karnataka SDL - ISD 091220 Mat 091230 Sovereign 0.278.39% Rajasthan SDL - Mat 150323 Sovereign 0.157.15% Maharashtra SDL - Mat 131026 Sovereign 0.146.19 GOI 2034 Sovereign 0.03Sub Total 21.20CREDIT EXPOSURE (NON PERPETUAl)• Housing Development
Finance Corporation Ltd.£ CRISIL - AAA 6.17• REC Ltd. CRISIL - AAA 5.89• State Bank of India CRISIL - AAA 3.87• LIC Housing Finance Ltd. CARe - AAA / CRISIL - AAA 2.82• Power Finance
Corporation Ltd.CARe - AAA / CRISIL - AAA / ICRA - AAA 2.77
• National Bank for Agriculture & Rural Development CRISIL - AAA / ICRA - AAA 2.64
• Vedanta Ltd. CRISIL - AA- 2.03IndInfravit Trust CRISIL - AAA 1.89Mahanagar Telephone Nigam Ltd. (Corporate guarantee from Govt of India)
CARe - AAA(Ce) / CRISIL - AAA(Ce) 1.69
Indian Railways Finance Corporation Ltd. CRISIL - AAA 1.68Larsen and Toubro Ltd. CRISIL - AAA 1.65Housing and Urban Development Corporation Ltd. CARe - AAA 1.56Reliance Industries Ltd. CRISIL - AAA 1.52Coastal Gujarat Power Ltd. (Corporate Guarantee of Tata Power) CARe - AA(Ce) 1.42Motherson Sumi Systems Ltd. IND - AAA 1.38Cholamandalam Investment & Finance ICRA - AA+ 1.35National Highways Authority of India CRISIL - AAA 1.17Fullerton India Credit Company Ltd. CRISIL - AAA 1.12Axis Bank Ltd. CRISIL - A1+ 1.08Jamnagar Utilities & Power Pvt. Ltd. (erstwhile Reliance Utilities & Power Pvt. Ltd.) CRISIL - AAA 1.06Tata Steel Ltd. CARe - AA 1.02First Business Receivables Trust (PTC backed by receivables from Reliance Corporate IT Park Ltd.) CRISIL - AAA(SO) 1.01HDB Financial Services Ltd. CRISIL - AAA 0.96Sikka Port and Terminal Ltd. (erstwhile Reliance Ports and Terminals Ltd.) CARe - AAA / CRISIL - AAA 0.85L&T Infrastructure Finance Ltd. CRISIL - AAA 0.85
Issuer Rating % to NAVPower Grid Corporation of India Ltd. CRISIL - AAA 0.82Nabha Power Ltd. (Corporate Guarantee of L&T Ltd.) ICRA - AAA(Ce) 0.82Pipeline Infrastructure Pvt. Ltd. CRISIL - AAA 0.74Mobil Trust Series 10 (PTC of pools from Shriram City Union Finance Ltd.) CRISIL - AAA(SO) 0.60Britannia Industries Ltd. CRISIL - AAA 0.57ONGC Petro additions Ltd. (OPAL) (Put on ONGC Ltd.) CARe - AAA(Ce) 0.56TATA Capital Housing Finance Ltd. CRISIL - AAA 0.56Sundaram Finance Ltd. CRISIL - AAA 0.55Hindustan Petroleum Corporation Ltd. CRISIL - AAA 0.54Tata Motors Finance Ltd. CRISIL - AA- 0.54John Deere Financial India Pvt. Ltd. CRISIL - AAA 0.49Hindalco Industries Ltd. CRISIL - AA 0.37TMF Holdings Ltd. (Subsidiary of Tata Motors Ltd.) ICRA - AA- 0.32NTPC Ltd. CRISIL - AAA 0.29Grasim Industries Ltd. CRISIL - AAA 0.28Fullerton India Home Finance Company Ltd. CARe - AAA 0.27Indian Oil Corporation Ltd. CRISIL - AAA 0.27NHPC Ltd. CARe - AAA 0.27Reliable Devices Trust (PTC backed by receivables from Reliance Retail Ltd.) ICRA - AAA(SO) 0.27Shriram City Union Finance Ltd. CRISIL - AA 0.27Talwandi Sabo Power Ltd. (Corporate Guarantee of Vedanta Ltd.) CRISIL - AA-(Ce) 0.27Tata Capital Financial Services Ltd. ICRA - AAA 0.27Tata Motors Finance Solutions Ltd. CARe - AA- 0.27L&T Housing Finance Ltd. CRISIL - AAA 0.25The Tata Power Company Ltd. CRISIL - AA 0.23Sansar Trust Nov 2018 (PTC of pools from Shriram Transport Finance Company Ltd.) ICRA - AAA(SO) 0.18Manappuram Finance Ltd. CRISIL - AA 0.17Inox Air Products Pvt. Ltd. CRISIL - AA+ 0.13Sub Total 60.62CREDIT EXPOSURE (PERPETUAl BONDS)• State Bank of India
(AT1, BASeL III, Perpetual) CRISIL - AA+ 2.93Union Bank of India (AT1, BASeL III, Perpetual) CRISIL - AA- 0.53ICICI Bank Ltd. (AT1, BASeL III, Perpetual) CARE - AA+ 0.42HDFC Bank Ltd. (AT1, BASeL III, Perpetual) CRISIL - AA+ 0.40Union Bank of India (AT1, BASeL III, Perpetual) IND - AA 0.36The Tata Power Company Ltd. (Perpetual) CRISIL - AA 0.28Bank of Baroda (AT1, BASeL III, Perpetual) CARe - AA 0.25Canara Bank (AT1, BASeL III, Perpetual) CARe - AA 0.06Sub Total 5.23Total 87.05MONEY MARKET INSTRUMENTSCPTata Teleservices Ltd. CRISIL - A1+ 0.65Sub Total 0.65CD Axis Bank Ltd. CRISIL - A1+ 0.81Sub Total 0.81Total 1.46Cash, Cash equivalents and Net Current Assets 11.49Grand Total 100.00• Top Ten Holdings, £ Co-sponsor
Outstanding exposure in derivative instruments Interest Rate Swap (` in Crore) 1,650.00
PORTFOLIO

52 January 2021
PERFORMANCE ^ - Regular Plan - growth Option
Date Period Scheme Returns
(%)
Benchmark Returns
(%)#
Additional Benchmark
Returns (%) ##
Value of ` 10,000 invested
Scheme (`) Benchmark (`)#
Additional Benchmark
(`)##
Jan 31, 20 Last 1 Year 10.08 9.20 5.52 11,005 10,918 10,551Jan 31, 18 Last 3 Years 9.06 8.74 6.67 12,967 12,856 12,135Jan 29, 16 Last 5 Years 8.56 8.34 6.60 15,086 14,933 13,769Jun 25, 10 Since Inception 8.83 8.37 6.81 24,537 23,444 20,105
Returns greater than 1 year period are compounded annualized (CAGR). Performance of dividend option under the schemes for the investors would be net of distribution tax, if any. For performance of other schemes managed by Anil Bamboli, please refer page 67. Different plans viz. Regular Plan and Direct Plan have a different expense structure. The expenses of the Direct Plan under the Scheme will be lower to the extent of the distribution expenses / commission charged in the Regular Plan. For Performance of Direct Plan, refer page no. 76.^Past performance may or may not be sustained in the future. Load is not taken into consideration for computation of performance.
[An open ended short term debt scheme investing in instruments such that the Macaulay Duration of the portfolio is between 1 year and 3 years (Refer page 2 for definition of Macaulay Duration)]HDFC Short Term Debt Fund
Portfolio Classification By Asset Class (%)
n G-Sec, SDL 21.20
n CP 0.65
n CD 0.81
n Credit exposure 65.85
n Cash, Cash equivalents and Net Current Assets 11.49
Portfolio Classification By Rating Class (%)
n Sovereign 21.20n AAA/AAA(SO)/A1+/A1+(SO)
& equivalent 53.69n AA+ 5.23n AA/AA- 8.39n Cash, Cash equivalents and
Net Current Assets 11.49
.....Contd from previous page
SIP PERFORMANCE ^ - Regular Plan - growth Option
Since Inception SIP
10 year SIP
5 year SIP
3 year SIP
1 year SIP
Total Amount Invested (` ‘000) 1,280.00 1,200.00 600.00 360.00 120.00 Mkt Value As on January 29, 2021 (` ‘000) 2,083.79 1,890.42 749.45 415.91 125.55 Returns (%) 8.81 8.80 8.84 9.62 8.75 Benchmark Returns (%) # 8.54 8.56 8.44 9.10 7.49 Additional Benchmark Returns (%) ## 6.87 6.87 6.41 6.22 4.22
Assuming ` 10,000 invested systematically on the first Business Day of every month over a period of time. CAGR returns are computed after accounting for the cash flow by using xIRR method (investment internal rate of return) for Regular Plan - Growth Option. The above investment simulation is for illustrative purposes only and should not be construed as a promise on minimum returns and safeguard of capital.

January 2021 53
CATEgORY OF SCHEME: LOW DURATION FUND
KEY FACTSINVESTMENT OBjECTIVETo generate income / capital appreciation through investment in debt securities and money market instruments.There is no assurance that the investment objective of the Scheme will be realized.
FUND MANAgER ¥
Anupam Joshi (since October 27, 2015)
Total experience: Over 12 years
INCEPTION DATE (Date of Allotment)November 18, 1999
NAV (AS ON JANUARY 29, 2021) NAV PER UNIT (`)Regular Plan - Growth Option 44.8473Regular Plan - Daily Dividend Reinvestment Option 10.1428Regular Plan - Weekly Dividend Option 10.1149Regular Plan - Monthly Dividend Option 10.1449Direct Plan - Growth Option 47.3552Direct Plan - Daily Dividend Reinvestment Option 10.0655Direct Plan - Weekly Dividend Option 10.1105Direct Plan - Monthly Dividend Option 10.1481
ASSETS UNDER MANAgEMENT (`) IN CROREAs on January 31, 2021 25,667.34Average for Month of January 2021 26,099.51
qUANTITATIVE DATAAverage Maturity * 2.40 yearsMacaulay Duration * 364 daysModified Duration * 337 daysYield to Maturity * 4.78%* Computed on the invested amount.
TOTAL ExPENSE RATIO (As on January 31, 2021)Including Additional expenses and Goods and Service Tax on Management FeesRegular: 1.04% Direct: 0.44%
#BENCHMARK INDEX: NIFTY Low Duration Debt Index
##ADDl. BENCHMARK INDEX: CRISIL 1 year T-Bill Index
EXIT lOADNil
PLANS & OPTIONSRegular Plan, Direct Plan. each Plan offers Growth and Dividend Option. Dividend Option offers Daily Dividend Option with Reinvestment facility only and Weekly and Monthly Dividend Option with Payout and Reinvestment facility.
MINIMUM APPlICATION AMOUNTFor all Options (except Daily Dividend Option) Growth, Weekly and Monthly Dividend Option: Purchase: ` 5,000 and any amount thereafter. Additional Purchase : ` 1,000 and any amount thereafter. Daily Dividend Option : Purchase : ` 10,000 and any amount thereafter. Additional Purchase : ` 5,000 and any amount thereafter.
¥ Dedicated Fund Manager for Overseas Investments: Mr. Sankalp Baid (since January 22, 2021) (Total experience: Over 13 years).
Face Value per Unit: ` 10 unless otherwise specified, CD - Certificate of Deposit; CP - Commercial Papers. Data is as of January 31, 2021 unless otherwise specified.
This product is suitable for investors who are seeking ~
l income over short term.
l to generate income / capital appreciation through investmentin debt securities and money market instruments
VeryHigh
Low to
Moderate
Low
Moderate ModeratelyHigh High
RISKOMETERInvestors understand that their principal will be at
moderate risk
~ Investors should consult their financial advisers, if in doubt about whether the product is suitable for them.
[An open ended low duration debt scheme investing in instruments such that the Macaulay Duration of the portfolio is between 6 months and 12 months (Refer page 2 for definition of Macaulay Duration)]HDFC Low Duration Fund
Issuer Rating % to NAVDEBT & DEBT RElATEDgOVERNMENT SECURITIES (CENTRAl/STATE)• GOI 2033 Sovereign 5.728.24 GOI 2027 Sovereign 1.537.8 GOI 2021 Sovereign 1.506.79 GOI 2027 Sovereign 0.956.97 GOI 2026 Sovereign 0.858.95% Maharashtra SDL - Mat 070322 Sovereign 0.658.15 GOI 2026 Sovereign 0.448.33 GOI 2026 Sovereign 0.447.94 GOI 2021 Sovereign 0.24Sub Total 12.32T-BIllS• 182 days Tbill ISD 081020
Mat 080421 Sovereign 4.45182 Days Tbill Mat 250321 Sovereign 1.9491 days Tbill ISD 051120 Mat 040221 Sovereign 1.52364 Days Tbill - Mat 070521 Sovereign 0.9791 Days Tbill ISD 261120 Mat 250221 Sovereign 0.78364 Days Tbill Mat 200521 Sovereign 0.77364 Days Tbill Mat 180321 Sovereign 0.58364 Days Tbill Mat 220421 Sovereign 0.39364 Days Tbill Mat 240621 Sovereign 0.12Sub Total 11.52CREDIT EXPOSURE (NON PERPETUAl)• Power Finance Corporation Ltd. CARe - AAA / CRISIL -
AAA / ICRA - AAA 6.05• REC Ltd. CARe - AAA / CRISIL - AAA 4.33• Housing Development
Finance Corporation Ltd.£ CRISIL - AAA 3.72• LIC Housing Finance Ltd. CARe - AAA / CRISIL - AAA 3.05• Axis Bank Ltd. CRISIL - A1+ 2.53L&T Infrastructure Finance Ltd. CRISIL - AAA 2.35National Bank for Agriculture & Rural Development
CRISIL - AAA / ICRA - AAA 1.99
Vedanta Ltd. CRISIL - AA- 1.77Muthoot Finance Ltd. ICRA - AA 1.63Reliance Industries Ltd. CRISIL - AAA 1.38Reliable Devices Trust (PTC backed by receivables from Reliance Retail Ltd.) ICRA - AAA(SO) 1.27Food Corporation of India (Corporate guarantee from Govt of India) CRISIL - AAA(Ce) 1.24Nabha Power Ltd. (Corporate Guarantee of L&T Ltd.) ICRA - AAA(Ce) 1.18Shriram Transport Finance Company Ltd. CRISIL - AA+ 0.86Larsen and Toubro Ltd. CRISIL - AAA 0.71Bharat Petroleum Corporation Ltd. CRISIL - AAA 0.70HDB Financial Services Ltd. CRISIL - AAA 0.66Aditya Birla Finance Ltd. ICRA - AAA 0.64Manappuram Finance Ltd. CARe - AA 0.60Power Grid Corporation of India Ltd. CRISIL - AAA 0.54Shriram City Union Finance Ltd. CARe - AA / CRISIL - AA 0.44TATA Capital Housing Finance Ltd. CRISIL - AAA 0.41embassy Office Parks ReIT CRISIL - AAA 0.39NTPC Ltd. CRISIL - AAA 0.38Bajaj Finance Ltd. CRISIL - AAA 0.37Housing and Urban Development Corporation Ltd. CARe - AAA 0.37Mangalore Refinery and Petrochemicals Ltd. CARe - AAA 0.31Bharati Telecom Ltd. CRISIL - AA+ 0.30Small Industries Development Bank CARe - AAA 0.30TMF Holdings Ltd. (Subsidiary of Tata Motors Ltd.) ICRA - AA- 0.23Indian Oil Corporation Ltd. CRISIL - AAA 0.20KKR India Financial Services Pvt. Ltd. CRISIL - AA 0.19Tata Motors Finance Solutions Ltd. CARe - AA- 0.19National Highways Authority of India CARe - AAA / CRISIL - AAA 0.12First Business Receivables Trust (PTC backed by receivables from Reliance Corporate IT Park Ltd.) CRISIL - AAA(SO) 0.11L&T Housing Finance Ltd. CARe - AAA 0.10Motherson Sumi Systems Ltd. IND - AAA 0.10Jamnagar Utilities & Power Pvt. Ltd. (erstwhile Reliance Utilities & Power Pvt. Ltd.) CRISIL - AAA 0.05Kotak Mahindra Prime Ltd. CRISIL - AAA 0.04Aurous Trust Jan 20 (PTC of pools from IIFL Finance Ltd.) CRISIL - A1+(SO) 0.03
Issuer Rating % to NAVAarish Solar Power Pvt. Ltd. (Greenko) CARe - AA(Ce) 0.02Aashman energy Pvt. Ltd. (Greenko) CARe - AA(Ce) 0.02Divyesh Power Pvt. Ltd. (Greenko) CARe - AA(Ce) 0.02elena Renewable energy Pvt. Ltd. (Greenko) CARe - AA(Ce) 0.02L&T Finance Ltd. CARe - AAA 0.02Pratyash Renewable Pvt. Ltd. (Greenko) CARe - AA(Ce) 0.02SeI Baskara Power Pvt. Ltd. (Greenko) CARe - AA(Ce) 0.02SeI enerstar Renewable energy Pvt. Ltd. (Greenko) CARe - AA(Ce) 0.02SeI Mihir energy Pvt. Ltd. (Greenko) CARe - AA(Ce) 0.02Shreyas Renewable energy Pvt. Ltd. (Greenko) CARe - AA(Ce) 0.02State Bank of India CRISIL - AAA 0.02Zuvan energy Pvt. Ltd. (Greenko) CARe - AA(Ce) 0.02Sub Total 42.07CREDIT EXPOSURE (PERPETUAl BONDS)• State Bank of India
(AT1, BASeL III, Perpetual) CRISIL - AA+ 2.69Canara Bank (AT1, BASeL III, Perpetual) CARe - AA 1.00State Bank of India (BASeL III, Perpetual) CRISIL - AA+ 1.00Union Bank of India (AT1, BASeL III, Perpetual) BRICKWORKS - AA 0.96Union Bank of India (AT1, BASeL III, Perpetual) CARe - AA- 0.94Bank of Baroda (AT1, BASeL III, Perpetual) CARe - AA 0.74Canara Bank (AT1, BASeL III, Perpetual) CRISIL - AA 0.70Union Bank of India (AT1, BASeL III, Perpetual) IND - AA 0.62Punjab National Bank (AT1, BASeL III, Perpetual) CRISIL - AA- 0.60Union Bank of India (BASeL III, Perpetual) BRICKWORKS - AA 0.58Axis Bank Ltd. (AT1, BASeL III, Perpetual) CRISIL - AA+ 0.40Indian Bank (AT1, BASeL III, Perpetual) CRISIL - AA 0.38Bank of Baroda (AT1, BASeL III, Perpetual) CRISIL - AA+ 0.34Union Bank of India (AT1, BASeL III, Perpetual) CRISIL - AA- 0.31Canara Bank (AT1, BASeL III, Perpetual) ICRA - AA 0.04Sub Total 11.30Total 77.21MONEY MARKET INSTRUMENTSCP• National Bank for Agriculture
& Rural Development ICRA - A1+ 3.21• Tata Teleservices Ltd. CRISIL - A1+ 2.87Indian Railways Finance Corporation Ltd. CRISIL - A1+ 0.97Tata Motors Ltd. CRISIL - A1+ 0.93CanFin Homes Ltd. CARE - A1+ 0.76LIC Housing Finance Ltd. CRISIL - A1+ 0.58Sundaram BNP Paribas Home Finance Ltd. CRISIL - A1+ 0.57Tata Teleservices (Maharashtra) Ltd. CRISIL - A1+ 0.56Tata Motors Finance Ltd. CARE - A1+ 0.53Hindustan Zinc Ltd. CRISIL - A1+ 0.48Tata Projects Ltd. CRISIL - A1+ 0.38Fedbank Financial Services Ltd. CRISIL - A1+ 0.18Reliance Industries Ltd. CRISIL - A1+ 0.10Sub Total 12.12CD export - Import Bank of India CRISIL - AAA 1.75National Bank for Agriculture & Rural Development CRISIL - A1+ / IND - A1+ 1.61Bank of Baroda CRISIL - A1+ 1.26The Federal Bank Ltd. CARE - A1+ 0.39Indusind Bank Ltd. CRISIL - A1+ 0.24Sub Total 5.25Total 17.37Cash, Cash equivalents and Net Current Assets 5.42Grand Total 100.00• Top Ten Holdings, £ Co-sponsor
Outstanding exposure in derivative instruments Interest Rate Swap (` in Crore) 2,875.00
PORTFOLIO

54 January 2021
^Past performance may or may not be sustained in the future. Load is not taken into consideration for computation of performance.
Portfolio Classification by Asset Class (%)
n G-Sec, SDL, T-bills 23.84
n CP 12.12
n CD 5.25
n Credit exposure 53.37
n Cash, Cash equivalents and Net Current Assets 5.42
Portfolio Classification by Rating Class (%)
n Sovereign 23.84n AAA/AAA(SO)/A1+/A1+(SO) &
equivalent 53.03n AA+ 5.59n AA/AA- 12.12n Cash, Cash equivalents and Net
Current Assets 5.42
[An open ended low duration debt scheme investing in instruments such that the Macaulay Duration of the portfolio is between 6 months and 12 months (Refer page 2 for definition of Macaulay Duration)]HDFC Low Duration Fund
PERFORMANCE ^ - Regular Plan - growth Option
Date Period Scheme Returns
(%)
Benchmark Returns
(%)#
Additional Benchmark
Returns (%) ##
Value of ` 10,000 invested
Scheme (`) Benchmark (`)#
Additional Benchmark
(`)##
Jan 31, 20 Last 1 Year 7.78 6.15 5.52 10,775 10,613 10,551Jan 31, 18 Last 3 Years 7.47 7.30 6.67 12,412 12,350 12,135Jan 29, 16 Last 5 Years 7.47 7.38 6.60 14,341 14,280 13,769Nov 18, 99 Since Inception 7.33 N.A. 6.48 44,847 N.A. 37,857
Returns greater than 1 year period are compounded annualized (CAGR). N.A. Not Available. Performance of dividend option under the schemes for the investors would be net of distribution tax, if any. For performance of other schemes managed by Anupam Joshi, please refer page 67. Different plans viz. Regular Plan and Direct Plan have a different expense structure. The expenses of the Direct Plan under the Scheme will be lower to the extent of the distribution expenses / commission charged in the Regular Plan. For Performance of Direct Plan, refer page no. 74.
SIP PERFORMANCE ^ - Regular Plan - growth Option
Since Inception SIP
15 year SIP 10 year SIP 5 Year SIP 3 Year SIP 1 Year SIP
Total Amount Invested (` ‘000) 2,550.00 1,800.00 1,200.00 600.00 360.00 120.00
Mkt Value As on January 29, 2021 (` ‘000) 5,985.27 3,291.41 1,777.75 722.91 404.15 124.68
Returns (%) 7.38 7.61 7.63 7.39 7.67 7.37
Benchmark Returns (%) # N.A. 8.08 7.78 7.09 6.91 5.38
Additional Benchmark Returns (%) ## 6.37 6.63 6.87 6.41 6.22 4.22
Assuming ` 10,000 invested systematically on the first Business Day of every month over a period of time. CAGR returns are computed after accounting for the cash flow by using xIRR method (investment internal rate of return) for Regular Plan - Growth Option. The above investment simulation is for illustrative purposes only and should not be construed as a promise on minimum returns and safeguard of capital.
.....Contd from previous page

January 2021 55
n G-Sec, SDL, T-Bills 15.11
n CP 56.87
n CD 27.18
n Credit exposure 1.90
n Cash, Cash equivalents and Net Current Assets -1.06
Portfolio Classification by Asset Class (%)
n Sovereign 15.11
n AAA/AAA(SO)/A1+/A1+(SO) & equivalent 85.95
n Cash, Cash equivalents and Net Current Assets -1.06
Portfolio Classification by Rating Class (%)
CATEgORY OF SCHEME: MONEY MARKET FUND
KEY FACTSINVESTMENT OBjECTIVE
To generate income / capital appreciation by investing in money market instruments.
There is no assurance that the investment objective of the Scheme will be realized.
FUND MANAgER ¥
Anil Bamboli (since July 25, 2012)
Total experience: Over 23 years
Vikash Agarwal (since July 1, 2020)
Total Experience: Over 14 years
INCEPTION DATE (Date of Allotment)
November 18, 1999
NAV (AS ON JANUARY 29, 2021) NAV PER UNIT (`)
Regular Plan - Growth Option 4,387.5437Regular Plan - Daily Dividend Reinvestment Option 1,063.6400Regular Plan - Weekly Dividend Option 1,063.1294Direct Plan - Growth Option 4,441.4099Direct Plan - Daily Dividend Reinvestment Option 1,063.6400Direct Plan - Weekly Dividend Option 1,063.1579
ASSETS UNDER MANAgEMENT (`) IN CRORE
As on January 31, 2021 10,530.19Average for Month of January 2021 11,450.64
qUANTITATIVE DATA
Average Maturity * 87 daysMacaulay Duration * 87 daysModified Duration * 87 daysYield to Maturity * 3.73%* Computed on the invested amount.
TOTAL ExPENSE RATIO (As on January 31, 2021)Including Additional expenses and Goods and Service Tax on Management Fees
Regular: 0.35% Direct: 0.21%
#BENCHMARK INDEX: NIFTY Money Market Index
##ADDl. BENCHMARK INDEX: CRISIL 1 year T-Bill Index
EXIT lOAD
Nil
PLANS & OPTIONS
Regular Plan, Direct Plan. Each Plan offers Growth and Daily Dividend Option (with Reinvestment facility only). Weekly Dividend Option (with Payout and Reinvestment facility).
MINIMUM APPlICATION AMOUNT
Purchase : Under Growth Option and Weekly Dividend Option : ` 5,000 and any amount thereafter. Under Daily Dividend Option : ` 10,000 and any amount thereafter
Additional Purchase : Under Growth Option and Weekly Dividend Option : ̀ 1,000 and any amount thereafter. Under Daily Dividend Option : ` 5,000 and any amount thereafter
¥ Dedicated Fund Manager for Overseas Investments: Mr. Sankalp Baid (since January 22, 2021) (Total experience: Over 13 years).
PERFORMANCE ^ - Regular Plan - growth Option
Date Period Scheme Returns
(%) $$
Benchmark Returns
(%)#
Additional Benchmark
Returns (%) ##
Value of ` 10,000 invested
Scheme (`) $$
Benchmark (`)#
Additional Benchmark
(`)##
Jan 31, 20 Last 1 Year 6.28 4.85 5.52 10,626 10,483 10,551Jan 31, 18 Last 3 Years 7.23 6.47 6.67 12,327 12,067 12,135Jan 29, 16 Last 5 Years 7.10 6.77 6.60 14,098 13,877 13,769Nov 18, 99 Since Inception 7.24 N.A. 6.48 44,026 N.A. 37,857
Returns greater than 1 year period are compounded annualized (CAGR). N.A. Not Available. $$ All dividends declared prior to the splitting of the Scheme into Dividend & Growth Options are assumed to be reinvested in the units of the Scheme at the then prevailing NAV (ex-dividend NAV). Performance of dividend option under the schemes for the investors would be net of distribution tax, if any. For performance of other schemes managed by Anil Bamboli & Vikas Agarwal, please refer page 67. Different plans viz. Regular Plan and Direct Plan have a different expense structure. The expenses of the Direct Plan under the Scheme will be lower to the extent of the distribution expenses / commission charged in the Regular Plan. For Performance of Direct Plan, refer page no. 80.
Face Value per Unit: ` 1,000, CD - Certificate of Deposit; CP - Commercial Papers. Data is as of January 31, 2021 unless otherwise specified.
This product is suitable for investors who are seeking ~
l income over short term
l to generate income / capital appreciation by investing in money market instruments
VeryHigh
Low to
Moderate
Low
Moderate ModeratelyHigh High
RISKOMETERInvestors understand that their principal will be at
moderate risk
~ Investors should consult their financial advisers, if in doubt about whether the product is suitable for them.
^Past performance may or may not be sustained in the future. Load is not taken into consideration for computation of performance.
(An open ended debt scheme investing in money market instruments)HDFC Money Market Fund
Issuer Rating % to NAVDEBT & DEBT RElATEDgOVERNMENT SECURITIES (CENTRAl/STATE)8.79 GOI 2021 Sovereign 1.487.62% Maharashtra SDL - Mat 140321 Sovereign 0.117.56% AP SDL - Mat 140221 Sovereign 0.108.51% Andhra Pradesh SDL - Mat 170221 Sovereign 0.10Sub Total 1.79T-BIllS• 182 Days Tbill Mat 040321 Sovereign 8.12182 Days Tbill Mat 110321 Sovereign 1.42364 Days Tbill Mat 180321 Sovereign 1.42182 Days Tbill Mat 250221 Sovereign 1.18182 days Tbill Mat 180321 Sovereign 0.71364 Days Tbill Mat 300321 Sovereign 0.47Sub Total 13.32CREDIT EXPOSURE (NON PERPETUAl)Axis Bank Ltd. CRISIL - A1+ 1.90Sub Total 1.90Total 17.01MONEY MARKET INSTRUMENTSCP • Hindustan Zinc Ltd. CRISIL - A1+ 5.13• TATA Capital Housing
Finance Ltd. CRISIL - A1+ 4.74• Reliance Industries Ltd. CRISIL - A1+ 4.73• Sun Pharmaceutical
Industries Ltd. CRISIL - A1+ 4.56• Daimler Fin Ser (I) Pvt Ltd. CRISIL - A1+ 4.36Tata Teleservices Ltd. CRISIL - A1+ 3.80Cholamandalam Investment & Finance CRISIL - A1+ 3.79LIC Housing Finance Ltd. CRISIL - A1+ 3.78Tata Motors Ltd. CRISIL - A1+ 3.40Manappuram Finance Ltd. CRISIL - A1+ 2.72
Issuer Rating % to NAVSBI Global Factors Ltd. CRISIL - A1+ 2.27Bharti Hexacom Ltd. CRISIL - A1+ 1.89TATA Housing Development Co Ltd. CARE - A1+ 1.82National Bank for Agriculture & Rural Development ICRA - A1+ 1.66Bajaj Housing Finance Ltd. CRISIL - A1+ 1.38Housing Development Finance Corporation Ltd.£ CRISIL - A1+ 1.18CanFin Homes Ltd. CARE - A1+ 0.95SCB Inv & Loan (I) Ltd. CRISIL - A1+ 0.95Motilal Oswal Financial Services Ltd. CRISIL - A1+ 0.94Deutsche Investments India Pvt. Ltd. CRISIL - A1+ 0.91Bharat Heavy electricals Ltd. CARE - A1+ 0.76Netmagic IT Services Private Ltd. ICRA - A1+ 0.47Fedbank Financial Services Ltd. CRISIL - A1+ 0.45Tata Teleservices (Maharashtra) Ltd. CRISIL - A1+ 0.23Sub Total 56.87CD• National Bank for Agriculture
& Rural Development CRISIL - A1+ / IND - A1+ 7.53• Bank of Baroda CRISIL - A1+ 4.50• Export - Import Bank of India CRISIL - A1+ 4.50• Small Industries
Development Bank ICRA - A1+ 4.02Axis Bank Ltd. CRISIL - A1+ 2.84Au Small Finance Bank Ltd. CRISIL - A1+ 1.42Indusind Bank Ltd. CRISIL - A1+ 1.42The Federal Bank Ltd. CARE - A1+ 0.95Sub Total 27.18Total 84.05Cash, Cash equivalents and Net Current Assets -1.06Grand Total 100.00• Top Ten Holdings, £ Co-sponsor
PORTFOLIO
SIP PERFORMANCE ^ - Regular Plan - growth Option
Since Inception SIP
15 year SIP 10 year SIP 5 Year SIP 3 Year SIP 1 Year SIP
Total Amount Invested (` ‘000) 2,550.00 1,800.00 1,200.00 600.00 360.00 120.00
Mkt Value As on January 29, 2021 (` ‘000) $$ 6,033.99 3,299.72 1,766.12 713.21 397.94 123.11
Returns (%) $$ 7.44 7.65 7.50 6.85 6.63 4.88
Benchmark Returns (%) # N.A. 7.66 7.29 6.29 5.81 4.16
Additional Benchmark Returns (%) ## 6.37 6.63 6.87 6.41 6.22 4.22
Assuming ` 10,000 invested systematically on the first Business Day of every month over a period of time. CAGR returns are computed after accounting for the cash flow by using xIRR method (investment internal rate of return) for Regular Plan - Growth Option. The above investment simulation is for illustrative purposes only and should not be construed as a promise on minimum returns and safeguard of capital.

56 January 2021
PORTFOLIOIssuer Rating % to NAVDEBT & DEBT RElATEDgOVERNMENT SECURITIES (CENTRAl/STATE)• GOI 2033 Sovereign 6.346.79 GOI 2027 Sovereign 2.317.59 GOI 2026 Sovereign 2.04GOI 2024 Sovereign 0.776.97 GOI 2026 Sovereign 0.767.27 GOI 2026 Sovereign 0.406.18 GOI 2024 Sovereign 0.335.15 GOI 2025 Sovereign 0.315.22 GOI 2025 Sovereign 0.227.32 GOI 2024 Sovereign 0.175.85 GOI 2030 Sovereign 0.165.79 GOI 2030 Sovereign 0.06Sub Total 13.87T-BIllS182 Days Tbill Mat 110321 Sovereign 0.93Sub Total 0.93CREDIT EXPOSURE (NON PERPETUAl)• Power Finance
Corporation Ltd. CARe - AAA / CRISIL - AAA 5.80• REC Ltd. CARe - AAA / CRISIL -
AAA / IND - AAA 5.72• Housing Development
Finance Corporation Ltd.£ CRISIL - AAA 5.44• Axis Bank Ltd. CRISIL - A1+ 4.69• Embassy Office Parks REIT CRISIL - AAA 4.27• LIC Housing Finance Ltd. CARe - AAA / CRISIL - AAA 3.73• Reliance Industries Ltd. CRISIL - AAA 2.43Nabha Power Ltd. (Corporate Guarantee of L&T Ltd.) ICRA - AAA(Ce) 2.33Muthoot Finance Ltd. CRISIL - AA 2.21L&T Infrastructure Finance Ltd. CRISIL - AAA 2.09Vedanta Ltd. CRISIL - AA- 1.98Sikka Port and Terminal Ltd. (erstwhile Reliance Ports and Terminals Ltd.)
CARe - AAA / CRISIL - AAA 1.92
State Bank of India CRISIL - AAA 1.71Manappuram Finance Ltd. CARe - AA / CRISIL - AA 1.53National Bank for Agriculture & Rural Development
CRISIL - AAA / ICRA - AAA 1.31
National Housing Bank CRISIL - AAA 1.27Aditya Birla Finance Ltd. ICRA - AAA 1.18Grasim Industries Ltd. CRISIL - AAA 0.97TATA Capital Housing Finance Ltd. CRISIL - AAA 0.88NTPC Ltd. CRISIL - AAA 0.76TMF Holdings Ltd. (Subsidiary of Tata Motors Ltd.) ICRA - AA- 0.56First Business Receivables Trust (PTC backed by receivables from Reliance Corporate IT Park Ltd.) CRISIL - AAA(SO) 0.54IndInfravit Trust CRISIL - AAA 0.41Tata Motors Finance Solutions Ltd. CARe - AA- 0.37Larsen and Toubro Ltd. CRISIL - AAA 0.33National Highways Authority of India CARe - AAA 0.32
Issuer Rating % to NAVHindustan Petroleum Corporation Ltd. CRISIL - AAA 0.31Housing and Urban Development Corporation Ltd. IND - AAA 0.11Gujarat Road and Infra Co Ltd. CARe - AAA 0.08Tata Sons Ltd. CRISIL - AAA 0.06Aurous Trust Jan 20 (PTC of pools from IIFL Finance Ltd.) CRISIL - A1+(SO) 0.04Jamnagar Utilities & Power Pvt. Ltd. (erstwhile Reliance Utilities & Power Pvt. Ltd.) CRISIL - AAA 0.03Sub Total 55.38CREDIT EXPOSURE (PERPETUAl BONDS)• Canara Bank (AT1, BASeL III, Perpetual) CARe - AA 2.41Union Bank of India (AT1, BASeL III, Perpetual) CARe - AA- 1.82Union Bank of India (BASeL III, Perpetual) BRICKWORKS - AA 0.94State Bank of India (AT1, BASeL III, Perpetual) CRISIL - AA+ 0.73Canara Bank (AT1, BASeL III, Perpetual) CRISIL - AA 0.64Axis Bank Ltd. (AT1, BASeL III, Perpetual) CRISIL - AA+ 0.48Indian Bank (AT1, BASeL III, Perpetual) CRISIL - AA 0.16Sub Total 7.18Total 77.36MONEY MARKET INSTRUMENTSCP • Tata Motors Finance Ltd. CARE - A1+ 2.41Tata Teleservices Ltd. CRISIL - A1+ 2.18Adani Ports & Special economic Zone ICRA - A1+ 1.24TATA Housing Development Co Ltd. CARE - A1+ 0.76Fedbank Financial Services Ltd. CRISIL - A1+ 0.39Tata Projects Ltd. CRISIL - A1+ 0.30HSBC InvestDirect Financial Services (India) Ltd. CRISIL - A1+ 0.25Sub Total 7.53CD National Bank for Agriculture & Rural Development CRISIL - A1+ / IND - A1+ 0.94Small Industries Development Bank ICRA - A1+ 0.47Bank of Baroda CRISIL - A1+ 0.15Sub Total 1.56Total 9.09Cash, Cash equivalents and Net Current Assets 13.55Grand Total 100.00• Top Ten Holdings, £ Co-sponsorOutstanding exposure in derivative instruments Interest Rate Swap (` in Crore) 8,425.00
Portfolio Classification by Asset Class (%)
n G-Sec, T-Bills 14.80
n CP 7.53
n CD 1.56
n Credit exposure 62.56
n Cash, Cash equivalents and Net Current Assets 13.55
Portfolio Classification by Rating Class (%)
n Sovereign 14.80n AAA/AAA(SO)/A1+/A1+(SO) &
equivalent 57.82n AA+ 1.21n AA/AA- 12.62n Cash, Cash equivalents and Net
Current Assets 13.55
CATEgORY OF SCHEME: FLOATER FUND
KEY FACTS
INVESTMENT OBjECTIVETo generate income/capital appreciation through investment in a portfolio comprising substantially of floating rate debt, fixed rate debt instruments swapped for floating rate returns and money market instruments. There is no assurance that the investment objective of the Scheme will be realized.
FUND MANAgER ¥
Shobhit Mehrotra (since October 23, 2007)
Total experience: Over 25 years
Vikash Agarwal (since July 1, 2020)
Total Experience: Over 14 years
INCEPTION DATE (Date of Allotment)October 23, 2007
NAV (AS ON JANUARY 29, 2021) NAV PER UNIT (`)Regular Plan - Growth Option 37.7565Regular Plan - Daily Dividend Reinvestment Option 10.0742Regular Plan - Weekly Dividend Option 10.0447Regular Plan - Monthly Dividend Option 10.1488Direct Plan - Growth Option 38.1181Direct Plan - Daily Dividend Reinvestment Option 10.0757Direct Plan - Weekly Dividend Option 10.0449Direct Plan - Monthly Dividend Option 10.1491
ASSETS UNDER MANAgEMENT (`) IN CROREAs on January 31, 2021 16,001.19Average for Month of January 2021 15,683.83
qUANTITATIVE DATAAverage Maturity * 2.63 yearsMacaulay Duration * 1.22 yearsModified Duration * 1.12 yearsYield to Maturity * 4.98%* Computed on the invested amount.
TOTAL ExPENSE RATIO (As on January 31, 2021)Including Additional expenses and Goods and Service Tax on Management FeesRegular: 0.48% Direct: 0.23%
#BENCHMARK INDEX: CRISIL Liquid Fund Index
##ADDl. BENCHMARK INDEX: CRISIL 1 year T-Bill Index
EXIT lOADNil
PLANS & OPTIONSRegular Plan, Direct Plan. Under both the Plans: Growth & Dividend Option. The Dividend Option offers Daily Dividend Option (with Reinvestment facility only) and Weekly and Monthly Dividend Option (with Payout and Reinvestment facility).
MINIMUM APPlICATION AMOUNTPurchase : ` 5,000 and any amount thereafter. Additional Purchase : ` 1 and any amount thereafter.
¥ Dedicated Fund Manager for Overseas Investments: Mr. Sankalp Baid (since January 22, 2021) (Total experience: Over 13 years).
Face Value per Unit: ` 10 unless otherwise specified, CD - Certificate of Deposit; CP - Commercial Papers. Data is as of January 31, 2021 unless otherwise specified.
PERFORMANCE ^ - Regular Plan - growth OptionDate Period Scheme
Returns (%)
Benchmark Returns
(%)#
Additional Benchmark
Returns (%) ##
Value of ` 10,000 investedScheme (`) Benchmark
(`)#Additional
Benchmark (`)##
Jan 31, 20 Last 1 Year 8.68 4.39 5.52 10,865 10,438 10,551Jan 31, 18 Last 3 Years 8.19 6.25 6.67 12,661 11,992 12,135Jan 29, 16 Last 5 Years 8.06 6.58 6.60 14,739 13,755 13,769Oct 23, 07 Since Inception 8.25 7.24 6.46 28,642 25,292 22,954
Returns greater than 1 year period are compounded annualized (CAGR). Since Inception returns are calculated on ` 13.1821 (allotment price). Performance of dividend option under the schemes for the investors would be net of distribution tax, if any. For performance of other schemes managed by Shobhit Mehrotra & Vikas Agarwal, please refer page 67. Different plans viz. Regular Plan and Direct Plan have a different expense structure. The expenses of the Direct Plan under the Scheme will be lower to the extent of the distribution expenses / commission charged in the Regular Plan. For Performance of Direct Plan, refer page no. 80.
This product is suitable for investors who are seeking ~
l income over short terml to generate income / capital appreciation through investment
in a portfolio comprising substantially of floating rate debt, fixed rate debt instruments swapped for floating rate returns and money market instruments
VeryHigh
Low to
Moderate
Low
Moderate ModeratelyHigh High
RISKOMETERInvestors understand that their principal will be at
moderate risk~ Investors should consult their financial advisers, if in doubt about whether the product is suitable for them.
^Past performance may or may not be sustained in the future. Load is not taken into consideration for computation of performance.
[An open ended debt scheme predominantly investing in floating rate instruments (including fixed rate instruments converted to floating rate exposures using swaps / derivatives)]HDFC Floating Rate Debt Fund
SIP PERFORMANCE ^ - Regular Plan - growth OptionSince Inception
SIP10 year
SIP5 year
SIP3 year
SIP1 year
SIPTotal Amount Invested (` ‘000) 1,600.00 1,200.00 600.00 360.00 120.00 Mkt Value As on January 29, 2021 (` ‘000) 2,866.32 1,846.65 735.18 408.69 125.21 Returns (%) 8.32 8.35 8.07 8.43 8.22 Benchmark Returns (%) # 7.18 7.05 6.08 5.48 3.96 Additional Benchmark Returns (%) ## 6.71 6.87 6.41 6.22 4.22
Assuming ` 10,000 invested systematically on the first Business Day of every month over a period of time. CAGR returns are computed after accounting for the cash flow by using xIRR method (investment internal rate of return) for Regular Plan - Growth Option. The above investment simulation is for illustrative purposes only and should not be construed as a promise on minimum returns and safeguard of capital.

January 2021 57
CATEgORY OF SCHEME: ULTRA SHORT DURATION FUND
KEY FACTSINVESTMENT OBjECTIVE
To generate income / capital appreciation through investment in debt securities and money market instruments.
There is no assurance that the investment objective of the Scheme will be realized.
FUND MANAgER ¥
Anil Bamboli (since September 25, 2018)
Total experience: Over 23 years
INCEPTION DATE (Date of Allotment)
September 25, 2018
NAV (AS ON JANUARY 29, 2021) NAV PER UNIT (`)
Regular Plan - Growth Option 11.7641Regular Plan - Daily Dividend Reinvestment Option 10.1030Regular Plan - Weekly Dividend Option 10.0535Regular Plan - Monthly Dividend Option 10.1535Direct Plan - Growth Option 11.8497Direct Plan - Daily Dividend Reinvestment Option 10.0920Direct Plan - Weekly Dividend Option 10.0537Direct Plan - Monthly Dividend Option 10.0538
ASSETS UNDER MANAgEMENT (`) IN CRORE
As on January 31, 2021 18,196.00Average for Month of January 2021 18,022.54
qUANTITATIVE DATA
Average Maturity * 143 daysMacaulay Duration * 127 daysModified Duration * 124 daysYield to Maturity * 3.98%* Computed on the invested amount.
TOTAL ExPENSE RATIO (As on January 31, 2021)Including Additional expenses and Goods and Service Tax on Management Fees
Regular: 0.64% Direct: 0.34%
#BENCHMARK INDEX: CRISIL Ultra Short Term Debt Index
##ADDl. BENCHMARK INDEX: CRISIL 1 year T-Bill Index
EXIT lOAD
Nil
PLANS & OPTIONS
Regular Plan, Direct Plan. Under both the Plans: Growth & Dividend Option. The Dividend Option offers Daily Dividend Option (with Reinvestment facility only) and Weekly and Monthly Dividend Option (with Payout and Reinvestment facility).
MINIMUM APPlICATION AMOUNT
Purchase : ` 5,000 and any amount thereafter. Additional Purchase : ` 1,000 and any amount thereafter.
¥ Dedicated Fund Manager for Overseas Investments: Mr. Sankalp Baid (since January 22, 2021) (Total experience: Over 13 years).
Face Value per Unit: ` 10 unless otherwise specified, CD - Certificate of Deposit; CP - Commercial Papers. Data is as of January 31, 2021 unless otherwise specified.
This product is suitable for investors who are seeking ~
l income over short terml income/capital appreciation through investment in debt
securities and money market instruments
VeryHigh
Low to
Moderate
Low
Moderate ModeratelyHigh High
RISKOMETERInvestors understand that their principal will be at
moderate risk
~ Investors should consult their financial advisers, if in doubt about whether the product is suitable for them.
[An open ended ultra-short term debt scheme investing in instruments such that the Macaulay Duration of the portfolio is between 3 months and 6 months (Refer page 2 for definition of Macaulay Duration)]HDFC Ultra Short Term Fund
Issuer Rating % to NAV
DEBT & DEBT RElATED
gOVERNMENT SECURITIES (CENTRAl/STATE)
8.35 GOI 2022 Sovereign 0.38
7.94 GOI 2021 Sovereign 0.28
Sub Total 0.66
T-BIllS
• 182 days Tbill ISD 081020 Mat 080421 Sovereign 2.73
• 364 Days Tbill Mat 220421 Sovereign 2.73
182 Days Tbill Mat 250221 Sovereign 1.92
91 days Tbill ISD 051120 Mat 040221 Sovereign 1.37
364 Days Tbill - Mat 040221 Sovereign 1.02
182 Days Tbill Mat 250321 Sovereign 0.55
364 Days Tbill Mat 180321 Sovereign 0.55
364 Days Tbill Mat 250321 Sovereign 0.55
364 Days Tbill Mat 100621 Sovereign 0.22
182 Days Tbill Mat 110321 Sovereign 0.14
182 days Tbill Mat 180321 Sovereign 0.14
Sub Total 11.92
CREDIT EXPOSURE (NON PERPETUAl)
• Housing Development Finance Corporation Ltd.£ CRISIL - AAA 8.18
• REC Ltd. CRISIL - AAA 3.45
• Aditya Birla Finance Ltd. ICRA - AAA 3.27
LIC Housing Finance Ltd. CARe - AAA / CRISIL - AAA 2.02
Reliance Industries Ltd. CRISIL - AAA 1.73
Power Finance Corporation Ltd. CARe - AAA / CRISIL - AAA 1.47
Axis Bank Ltd. CRISIL - A1+ 1.37
L&T Infrastructure Finance Ltd. CRISIL - AAA 0.98
Sundaram Finance Ltd. CRISIL - AAA 0.69
Mobil Trust Series 10 (PTC of pools from Shriram City Union Finance Ltd.) CRISIL - AAA(SO) 0.60
L&T Finance Ltd. CARe - AAA / IND - AAA 0.57
TATA Capital Housing Finance Ltd. CRISIL - AAA 0.57
Tata Sons Ltd. CRISIL - AAA 0.55
Small Industries Development Bank CARe - AAA 0.52
John Deere Financial India Pvt. Ltd. CRISIL - AAA 0.47
Food Corporation of India (Corporate guarantee from Govt of India) CRISIL - AAA(Ce) 0.44
NTPC Ltd. ICRA - AAA 0.41
National Highways Authority of India CRISIL - AAA 0.37
National Bank for Agriculture & Rural Development CRISIL - AAA 0.32
First Business Receivables Trust (PTC backed by receivables from Reliance Corporate IT Park Ltd.) CRISIL - AAA(SO) 0.31
HDB Financial Services Ltd. CRISIL - AAA 0.19
Aurous Trust Jan 20 (PTC of pools from IIFL Finance Ltd.) CRISIL - A1+(SO) 0.18
Bajaj Finance Ltd. CRISIL - AAA 0.17
Aditya Birla Housing Finance Ltd. ICRA - AAA 0.09
Issuer Rating % to NAV
Copeland Jan 2020 (PTC of pools from Muthoot Capital Services Ltd.) CRISIL - AAA(SO) 0.09
Sub Total 29.01
Total 41.59
MONEY MARKET INSTRUMENTS
CP
• National Bank for Agriculture & Rural Development ICRA - A1+ 4.77
• Hindustan Zinc Ltd. CRISIL - A1+ 3.11
• Bharat Oman Refineries Ltd. CRISIL - A1+ 2.73
• Indian Railways Finance Corporation Ltd. CRISIL - A1+ 2.73
• Manappuram Finance Ltd. CRISIL - A1+ 2.65
CanFin Homes Ltd. CARE - A1+ 2.13
Tata Teleservices Ltd. CRISIL - A1+ 2.03
Tata Motors Finance Ltd. CARE - A1+ 1.91
Godrej Properties Ltd. CRISIL - A1+ 1.31
Sun Pharmaceutical Industries Ltd. CRISIL - A1+ 1.21
Bharti Hexacom Ltd. CRISIL - A1+ 1.10
Bahadur Chand Investments Pvt. Ltd. CARE - A1+ 1.08
Tata Realty and Infrastructure Ltd. CRISIL - A1+ 1.08
Bharat Heavy electricals Ltd. CARE - A1+ 0.93
TATA Housing Development Co Ltd. CARE - A1+ 0.83
UPL Ltd. CRISIL - A1+ 0.82
Kalpataru Power Transmission Ltd. CRISIL - A1+ 0.55
Motilal Oswal Financial Services Ltd. CRISIL - A1+ 0.55
SBI Global Factors Ltd. CRISIL - A1+ 0.55
Tata Projects Ltd. CRISIL - A1+ 0.54
Daimler Fin Ser (I) Pvt Ltd. CRISIL - A1+ 0.49
Reliance Industries Ltd. CRISIL - A1+ 0.41
Rashtriya Chemicals and Fertilizers Ltd. CARE - A1+ 0.38
Fedbank Financial Services Ltd. CRISIL - A1+ 0.26
Housing Development Finance Corporation Ltd.£ CRISIL - A1+ 0.14
SBI Cards and Payment Services Ltd. CRISIL - A1+ 0.13
Tata Teleservices (Maharashtra) Ltd. CRISIL - A1+ 0.13
Sub Total 34.55
CD
National Bank for Agriculture & Rural Development CRISIL - A1+ / IND - A1+ 1.49
Axis Bank Ltd. CRISIL - A1+ 0.82
Au Small Finance Bank Ltd. CRISIL - A1+ 0.27
Indusind Bank Ltd. CRISIL - A1+ 0.22
Sub Total 2.80
Total 37.35
Cash, Cash equivalents and Net Current Assets 21.06
Grand Total 100.00
• Top Ten Holdings, £ Co-sponsorOutstanding exposure in derivative instruments Interest Rate Swap (` in Crore) 1,525.00
PORTFOLIO

58 January 2021
[An open ended ultra-short term debt scheme investing in instruments such that the Macaulay Duration of the portfolio is between 3 months and 6 months (Refer page 2 for definition of Macaulay Duration)]HDFC Ultra Short Term Fund
^Past performance may or may not be sustained in the future. Load is not taken into consideration for computation of performance.
Portfolio Classification by Asset Class (%)
n G-Sec, T-Bills 12.58
n CP 34.55n CD 2.80n Credit exposure 29.01n Cash, Cash equivalents and Net
Current Assets 21.06
Portfolio Classification by Rating Class (%)
n Sovereign 12.58n AAA/AAA(SO)/A1+/A1+(SO) &
equivalent 66.36n Cash, Cash equivalents and Net
Current Assets 21.06
PERFORMANCE ^ - Regular Plan - growth OptionDate Period Scheme
Returns (%)
Benchmark Returns
(%)#
Additional Benchmark
Returns (%) ##
Value of ` 10,000 investedScheme
(`)Benchmark
(`)#Additional
Benchmark (`)##
Jan 31, 20 Last 1 Year 6.08 5.79 5.52 10,607 10,578 10,551Sep 25, 18 Since Inception 7.16 7.12 6.95 11,764 11,754 11,709
Returns greater than 1 year period are compounded annualized (CAGR). The Scheme is in existence for more than 1 year but less than 3 years. Performance of dividend option under the schemes for the investors would be net of distribution tax, if any. For performance of other schemes managed by Anil Bamboli, please refer page 67. Different plans viz. Regular Plan and Direct Plan have a different expense structure. The expenses of the Direct Plan under the Scheme will be lower to the extent of the distribution expenses / commission charged in the Regular Plan. For Performance of Direct Plan, refer page no. 76.
SIP PERFORMANCE ^ - Regular Plan - growth Option
Since Inception SIP 1 Year SIP
Total Amount Invested (` ‘000) 290.00 120.00 Mkt Value As on January 29, 2021 (` ‘000) 313.57 123.31 Returns (%) 6.41 5.20 Benchmark Returns (%) # 6.35 5.10 Additional Benchmark Returns (%) ## 5.95 4.22
Assuming ` 10,000 invested systematically on the first Business Day of every month over a period of time. CAGR returns are computed after accounting for the cash flow by using xIRR method (investment internal rate of return) for Regular Plan - Growth Option. The above investment simulation is for illustrative purposes only and should not be construed as a promise on minimum returns and safeguard of capital.
.....Contd from previous page

January 2021 59
CATEgORY OF SCHEME: LIqUID FUND PORTFOLIO
KEY FACTS
INVESTMENT OBjECTIVE
To generate income through a portfolio comprising money market and debt instruments.
There is no assurance that the investment objective of the Scheme will be realized.
FUND MANAgER ¥
Anupam Joshi (since October 27, 2015)
Total experience: Over 12 years
INCEPTION DATE (Date of Allotment)
October 17, 2000
NAV (AS ON JANUARY 31, 2021)^^ NAV PER UNIT (`)
Regular Plan - Growth Option 3,997.1676Regular Plan - Daily Dividend Reinvestment Option 1,019.8200Regular Plan - Weekly Dividend Option 1,031.6029Regular Plan - Monthly Dividend Option 1,026.8704Direct Plan - Growth Option 4,024.2206Direct Plan - Daily Dividend Reinvestment Option 1,019.8200Direct Plan - Weekly Dividend Option 1,031.6199Direct Plan - Monthly Dividend Option 1,026.8949
ASSETS UNDER MANAgEMENT (`) IN CRORE
As on January 31, 2021 62,049.67Average for Month of January 2021 68,865.19
qUANTITATIVE DATA
Average Maturity * 23 daysMacaulay Duration * 23 daysModified Duration * 23 daysYield to Maturity * 3.56%* Computed on the invested amount.
TOTAL ExPENSE RATIO (As on January 31, 2021)Including Additional expenses and Goods and Service Tax on Management Fees
Regular: 0.30% Direct: 0.20%
#BENCHMARK INDEX: CRISIL Liquid Fund Index
##ADDl. BENCHMARK INDEX: CRISIL 1 year T-Bill Index
EXIT lOAD
l On investments made on or before October 19, 2019: NIL
l On investments (including through existing systematic plan registrations) made on or after October 20, 2019, as follows:
Units redeemed / switched-out within “X” days from the date
of allotment
Exit load as a % of redemption proceeds
Day 1 0.0070%Day 2 0.0065%Day 3 0.0060%Day 4 0.0055%Day 5 0.0050%Day 6 0.0045%Day 7 onwards Nil
PLANS & OPTIONS
Regular Plan, Direct Plan. Under both the Plans: Growth & Dividend Option. The Dividend Option offers Daily Dividend Option (Reinvestment facility only) and Weekly and Monthly Dividend Option (with Payout and Reinvestment facility).
MINIMUM APPlICATION AMOUNT
Purchase : Under Growth Option, Weekly Dividend Option and Monthly Dividend Option: ` 5,000 and any amount thereafter. Under Daily Dividend Option: ̀ 10,000 and any amount thereafter.Additional Purchase : Under Growth Option, Weekly Dividend Option and Monthly Dividend Option: ` 1,000 and any amount thereafter. Under Daily Dividend Option: ` 5,000 and any amount thereafter.
¥ Dedicated Fund Manager for Overseas Investments: Mr. Sankalp Baid (since January 22, 2021) (Total experience: Over 13 years).
^^Calculated on all calendar days.
Face Value per Unit: ` 1,000, CD - Certificate of Deposit; CP - Commercial Papers. Data is as of January 31, 2021 unless otherwise specified.
(An open ended liquid scheme)HDFC Liquid Fund
^Past performance may or may not be sustained in the future. Load is not taken into consideration for computation of performance.
Company Rating % to NAV
DEBT & DEBT RElATED
T-BIllS
• 91 days Tbill ISD 191120 Mat 180221 Sovereign 14.47
• 91 Days Tbill ISD 261120 Mat 250221 Sovereign 9.09
• 364 Days Tbill Mat 110221 Sovereign 3.69
• 182 Days Tbill Mat 110321 Sovereign 3.32
• 91 Days Tbill - ISD 241220 Mat 250321 Sovereign 3.30
364 Days Tbill - Mat 180221 Sovereign 2.33
182 Days Tbill Mat 250321 Sovereign 2.20
364 Days Tbill Mat 300321 Sovereign 1.68
91 Days Tbill Mat 180321 Sovereign 1.61
91 Days Tbill - Mat 110321 Sovereign 1.37
182 days Tbill Mat 180321 Sovereign 0.66
91 Days Tbill Mat 110221 Sovereign 0.52
182 Days Tbill Mat 250221 Sovereign 0.48
91 Days Tbill Mat 040321 Sovereign 0.48
182 Days Tbill Mat 040321 Sovereign 0.32
182 Days Tbill Mat 110221 Sovereign 0.32
364 Days Tbill Mat 250221 Sovereign 0.32
364 Days Tbill Mat 110321 Sovereign 0.16
364 Days Tbill Mat 250321 Sovereign 0.08
364 Days Tbill Mat 180321 Sovereign 0.05
Sub Total 46.45
CREDIT EXPOSURE (NON-PERPETUAl)
ReC Ltd. CRISIL - AAA 0.02
Sub Total 0.02
Total 46.47
MONEY MARKET INSTRUMENTS
CP
• NTPC Ltd. CRISIL - A1+ 6.44
• Reliance Industries Ltd. CRISIL - A1+ 5.56
• Bajaj Finance Ltd. CRISIL - A1+ 4.03
• National Bank for Agriculture & Rural Development ICRA - A1+ 3.34
• Aditya Birla Finance Ltd. ICRA - A1+ 2.73
export - Import Bank of India CRISIL - A1+ 2.53
Tata Teleservices (Maharashtra) Ltd. CRISIL - A1+ 2.42
Company Rating % to NAV
Steel Authority Of India Ltd. CARE - A1+ / CRISIL - A1+ 2.34
Infina Finance Pvt. Ltd. CRISIL - A1+ 1.93
Indian Oil Corporation Ltd. ICRA - A1+ 1.84
L&T Finance Ltd. CRISIL - A1+ 1.61
Motilal Oswal Finvest Ltd. CRISIL - A1+ 1.61
Bharat Heavy electricals Ltd. CARE - A1+ 1.44
IIFL Finance Ltd. CRISIL - A1+ 1.21
Indian Railways Finance Corporation Ltd. CRISIL - A1+ 1.20
JM Financial Products Ltd. CRISIL - A1+ 1.13
IIFL Facilities Services Ltd. CRISIL - A1+ 0.81
Tata Capital Financial Services Ltd. CRISIL - A1+ 0.81
NLC India Ltd. CARE - A1+ 0.80
Mangalore Refinery and Petrochemicals Ltd. CARE - A1+ 0.64
Kotak Securities Ltd. CRISIL - A1+ 0.56
LIC Housing Finance Ltd. CRISIL - A1+ 0.56
Chennai Petroleum Corporation Ltd. CRISIL - A1+ 0.52
ICICI Securities Ltd. CRISIL - A1+ 0.52
Tata Teleservices Ltd. CRISIL - A1+ 0.50
Chambal Fertilizers & Chemicals Ltd. CRISIL - A1+ 0.48
Mahindra & Mahindra Financial Services Ltd. CRISIL - A1+ 0.48
National Fertilizers Ltd. ICRA - A1+ 0.48
Aditya Birla Fashion and Retail Ltd. CRISIL - A1+ 0.32
Axis Finance Ltd. CRISIL - A1+ 0.32
Kalpataru Power Transmission Ltd. CRISIL - A1+ 0.16
Sub Total 49.32
CD
Axis Bank Ltd. CRISIL - A1+ 0.51
Punjab National Bank CARE - A1+ 0.20
National Bank for Agriculture & Rural Development IND - A1+ 0.12
Kotak Mahindra Bank Ltd. CRISIL - A1+ 0.02
Sub Total 0.85
Total 50.17
Cash, Cash equivalents and Net Current Assets 3.36
Grand Total 100.00
• Top Ten Holdings

60 January 2021
This product is suitable for investors who are seeking ~
l regular income over short term
l to generate income through a portfolio comprising money market and debt instruments
VeryHigh
Low to
Moderate
Low
Moderate ModeratelyHigh High
RISKOMETERInvestors understand that their principal will be at
low to moderate risk
~ Investors should consult their financial advisers, if in doubt about whether the product is suitable for them.
(An open ended liquid scheme) .....Contd from previous pageHDFC Liquid Fund
PERFORMANCE ^ - Regular Plan - growth OptionDate Period Scheme
Returns (%)
Benchmark Returns
(%)#
Additional Benchmark
Returns (%) ##
Value of ` 10,000 investedScheme (`) Benchmark
(`)#Additional
Benchmark (`)##
Jan 24, 21 Last 7 days 3.32 3.52 -0.69 10,006 10,007 9,999Jan 16, 21 Last 15 days 3.14 3.41 3.40 10,013 10,014 10,014Dec 31, 20 Last 1 Month 2.69 3.23 1.58 10,023 10,027 10,013Jan 31, 20 Last 1 Year 3.90 4.40 5.53 10,392 10,441 10,555Jan 31, 18 Last 3 Years 5.83 6.24 6.66 11,854 11,994 12,137Jan 31, 16 Last 5 Years 6.30 6.57 6.59 13,575 13,752 13,766Oct 17, 00 Since Inception 7.06 N.A. 6.39 39,972 N.A. 35,184
Returns less than 1 year period are simple annualized and greater than 1 year are compounded annualized (CAGR). N.A. Not Available. Performance of dividend option under the schemes for the investors would be net of distribution tax, if any. For performance of other schemes managed by Anupam Joshi, please refer page 67. Different plans viz. Regular Plan and Direct Plan have a different expense structure. The expenses of the Direct Plan under the Scheme will be lower to the extent of the distribution expenses / commission charged in the Regular Plan. For Performance of Direct Plan, refer page no. 75.
n T-Bills 46.45
n CP 49.32
n CD 0.85
n Credit exposure 0.02
n Cash, Cash equivalents and Net Current Assets 3.36
Portfolio Classification by Asset Class (%)
n Sovereign 46.45n AAA/AAA(SO)/A1+/A1+(SO) &
equivalent 50.19
n Cash, Cash equivalents and Net Current Assets 3.36
Portfolio Classification by Rating Class (%)
SIP PERFORMANCE ^ - Regular Plan - growth Option
Since Inception SIP
15 year SIP 10 year SIP 5 Year SIP 3 Year SIP 1 Year SIP
Total Amount Invested (` ‘000) 2,440.00 1,800.00 1,200.00 600.00 360.00 120.00
Mkt Value As on January 29, 2021 (` ‘000) 5,338.57 3,186.04 1,711.37 692.92 388.51 122.14
Returns (%) 7.12 7.22 6.90 5.70 5.02 3.35
Benchmark Returns (%) # N.A. 7.19 7.05 6.08 5.48 3.96
Additional Benchmark Returns (%) ## 6.37 6.63 6.87 6.41 6.22 4.22
Assuming ̀ 10,000 invested systematically on the first Business Day of every month over a period of time. CAGR returns are computed after accounting for the cash flow by using xIRR method (investment internal rate of return) for Regular Plan - Growth Option. The above investment simulation is for illustrative purposes only and should not be construed as a promise on minimum returns and safeguard of capital. SIP facility in the Scheme has been made available from November 12, 2020.

January 2021 61
CATEgORY OF SCHEME: OVERNIGHT FUND
KEY FACTS
INVESTMENT OBjECTIVE
To generate returns by investing in debt and money market instruments with overnight maturity.
There is no assurance that the investment objective of the Scheme will be realized.
FUND MANAgER ¥
Anil Bamboli (since July 25, 2012)
Total experience: Over 23 years
INCEPTION DATE (Date of Allotment)
February 06, 2002
NAV (AS ON JANUARY 31, 2021)^^ NAV PER UNIT (`)
Regular Plan - Growth Option 3,025.9996Regular Plan - Daily Dividend Reinvestment Option 1,042.6600Direct Plan - Growth Option 3,043.1775Direct Plan - Daily Dividend Reinvestment Option 1,042.6600
ASSETS UNDER MANAgEMENT (`) IN CRORE
As on January 31, 2021 12,689.48Average for Month of January 2021 13,211.48
qUANTITATIVE DATA
Average Maturity * 1 dayMacaulay Duration * 1 dayModified Duration * 1 dayYield to Maturity * 3.33%* Computed on the invested amount.
TOTAL ExPENSE RATIO (As on January 31, 2021)Including Additional expenses and Goods and Service Tax on Management Fees
Regular: 0.20% Direct: 0.10%
#BENCHMARK INDEX: CRISIL Overnight Index
##ADDl. BENCHMARK INDEX: CRISIL 1 year T-Bill Index
EXIT lOAD
Nil
PLANS & OPTIONS
Regular Plan, Direct Plan. Each Plan offers Growth and Daily Dividend Option (with Reinvestment facility only).
MINIMUM APPlICATION AMOUNT
Purchase : Under Growth Option : ` 5,000 and any amount thereafter. Under Daily Dividend Option : ` 10,000 and any amount thereafter
Additional Purchase : Under Growth Option : ̀ 1,000 and any amount thereafter. Under Daily Dividend Option : ` 5,000 and any amount thereafter
¥ Dedicated Fund Manager for Overseas Investments: Mr. Sankalp Baid (since January 22, 2021) (Total experience: Over 13 years).
^^Calculated on all calendar days.
Face Value per Unit: ` 1,000, Data is as of January 31, 2021 unless otherwise specified. N.A. Not Available
PERFORMANCE ^ - Regular Plan - growth Option
Date Period Scheme Returns
(%)
Benchmark Returns
(%)#
Additional Benchmark
Returns (%) ##
Value of ` 10,000 invested
Scheme (`) Benchmark (`)#
Additional Benchmark
(`)##
Jan 24, 21 Last 7 days 3.03 3.23 -0.69 10,006 10,006 9,999Jan 16, 21 Last 15 days N.A. N.A. N.A. N.A. N.A. N.A.Dec 31, 20 Last 1 Month 2.93 3.13 1.58 10,025 10,027 10,013Jan 31, 20 Last 1 Year 3.09 3.27 5.53 10,310 10,328 10,555Jan 31, 18 Last 3 Years 4.88 5.02 6.66 11,538 11,584 12,137Jan 31, 16 Last 5 Years 5.37 5.49 6.59 12,991 13,065 13,766Feb 06, 02 Since Inception 6.00 N.A. 6.08 30,260 N.A. 30,670
Returns less than 1 year period are simple annualized and greater than 1 year are compounded annualized (CAGR). N.A. Not Available. Performance of dividend option under the schemes for the investors would be net of distribution tax, if any. For performance of other schemes managed by Anil Bamboli, please refer page 67. Different plans viz. Regular Plan and Direct Plan have a different expense structure. The expenses of the Direct Plan under the Scheme will be lower to the extent of the distribution expenses / commission charged in the Regular Plan. For Performance of Direct Plan, refer page no. 76.
Cash, Cash equivalents and Net Current Assets 100.00
Portfolio Classification by Asset Class (%)
Cash, Cash equivalents and Net Current Assets 100.00
Portfolio Classification by Rating Class (%)
This product is suitable for investors who are seeking ~
l regular income over short term that may be in line with the overnight call rates
l to generate returns by investing in debt and money market instruments with overnight maturity
VeryHigh
Low to
Moderate
Low
Moderate ModeratelyHigh High
RISKOMETERInvestors understand that their principal will be at
low risk
~ Investors should consult their financial advisers, if in doubt about whether the product is suitable for them.
^Past performance may or may not be sustained in the future. Load is not taken into consideration for computation of performance.
(An open ended debt scheme investing in overnight securities)HDFC Overnight Fund
Issuer Rating % to NAV
Cash, Cash equivalents and Net Current Assets 100.00
Grand Total 100.00
PORTFOLIO
SIP PERFORMANCE ^ - Regular Plan - growth Option
Since Inception SIP
15 year SIP 10 year SIP 5 Year SIP 3 Year SIP 1 Year SIP
Total Amount Invested (` ‘000) 2,280.00 1,800.00 1,200.00 600.00 360.00 120.00
Mkt Value As on January 29, 2021 (` ‘000) 4,260.58 2,931.82 1,627.39 677.96 383.73 121.88
Returns (%) 6.17 6.21 5.94 4.84 4.20 2.93
Benchmark Returns (%) # N.A. 6.25 6.09 4.98 4.38 3.13
Additional Benchmark Returns (%) ## 6.39 6.63 6.87 6.41 6.22 4.22
Assuming ̀ 10,000 invested systematically on the first Business Day of every month over a period of time. CAGR returns are computed after accounting for the cash flow by using xIRR method (investment internal rate of return) for Regular Plan - Growth Option. The above investment simulation is for illustrative purposes only and should not be construed as a promise on minimum returns and safeguard of capital. SIP facility in the Scheme has been made available from November 12, 2020.

62 January 2021
KEY FACTS
INVESTMENT OBjECTIVE
The investment objective of the Scheme is to generate returns that are in line with the performance of gold, subject to tracking errors.
There is no assurance that the investment objective of the Scheme will be realized.
Exchange Listed
BSe/NSe
Exchange Symbol/Scrip Code
BSE/NSE: HDFCMFGETF | 533230
ISIN
INF179K01CN1
Creation Unit Size
1,000 units of HDFC Gold ETF
FUND MANAgER
Krishan Kumar Daga (since October 19, 2015)
Total experience: Over 23 years
INCEPTION DATE (Date of Allotment)
August 13, 2010
NAV (AS ON JANUARY 29, 2021) NAV PER UNIT (`)
HDFC Gold ETF 4,385.6882
ASSETS UNDER MANAgEMENT (`) IN CRORE
As on January 31, 2021 2,189.43Average for Month of January 2021 2,152.96
TRACKINg ERROR
Annualised tracking error is calculated based on daily rolling returns for the last 12 months: 0.22%
TOTAL ExPENSE RATIO (As on January 31, 2021)Including Additional expenses and Goods and Service Tax on Management Fees
HDFC GOLD ETF 0.62%
#BENCHMARK INDEX: Domestic Price of Physical Gold
EXIT lOAD
For Creation Unit Size:l No exit load will be levied on redemptions made by
Authorised Participants / Large Investors directly with the Fund in Creation Unit Size.
For other than Creation Unit Size:l N.A. The Units of HGETF in other than Creation Unit Size cannot
be directly redeemed with the Fund. These Units can be redeemed (sold) on a continuous basis on
the NSe and BSe during the trading hours on all trading days. Refer SID for further details.
For further details, please refer to para ‘Exit Load’ on Pg 67.
PLANS & OPTIONS
Currently, there are no investment Plans/Options being offered under the Scheme.
MINIMUM APPlICATION AMOUNT
Authorised Participants: Application for subscription of HGETF Units directly with the Fund in Creation Unit Size at NAV based prices in exchange of Portfolio Deposit and Cash Component.
large Investors: Application for subscription of HGETF Units directly with the Fund in Creation Unit Size at NAV based prices by payment of requisite Cash as determined by the AMC only by means of payment instruction of Real Time Gross Settlement (RTGS) / National Electronic Funds Transfer (NEFT) or Funds Transfer Letter / Transfer Cheque of a bank where the Scheme has a collection account.
Other investors (including Authorised Participants and large Investors): Units of HGETF can be subscribed (in lots of 1 Unit) during the trading hours on all trading days on the NSe and BSe on which the Units are listed.
CATEgORY OF SCHEME: ExCHANGE TRADED FUND
Face Value per Unit: ` 1,800.3288, Data is as of January 31, 2021 unless otherwise specified. N.A. Not Available
This product is suitable for investors who are seeking ~
l returns that are commensurate with the performance of gold, subject to tracking errors, over long term
l investment predominantly in Gold bullion of 0.995 fineness
VeryHigh
Low to
Moderate
Low
Moderate ModeratelyHigh High
RISKOMETERInvestors understand that their principal will be at
moderately high risk
~ Investors should consult their financial advisers, if in doubt about whether the product is suitable for them.
Issuer Rating % to NAV
gOlD
Physical Gold (99.5% Purity) 98.12
Cash, Cash equivalents and Net Current Assets 1.88
Grand Total 100.00
PORTFOLIO
(An open ended scheme replicating / tracking performance of Gold)HDFC Gold Exchange Traded Fund
^Past performance may or may not be sustained in the future. Load is not taken into consideration for computation of performance.
PERFORMANCE * ^
Date Period Scheme Returns (%)
Benchmark Returns (%)#
Value of ` 10,000 invested
Scheme (`) Benchmark (`)#
Jan 31, 20 Last 1 Year 18.99 19.73 11,893 11,967Jan 31, 18 Last 3 Years 16.19 17.42 15,678 16,182Jan 29, 16 Last 5 Years 11.61 12.81 17,326 18,283Aug 13, 10 Since Inception 8.88 9.76 24,360 26,526
Returns less than 1 year period are simple annualized and greater than 1 year are compounded annualized (CAGR). * The Scheme does not offer any Plans/Options. For performance of other schemes managed by Krishan Kumar Daga, please refer page 67.
HDFC Gold ETF
n Gold 98.12
n Cash, Cash equivalents and Net Current Assets 1.88
Portfolio Classification by Asset Class (%) HDFC Gold ETF
n Gold 98.12
n Cash, Cash equivalents and Net Current Assets 1.88
Portfolio Classification by Rating Class (%)

January 2021 63
SIP PERFORMANCE ^ - Regular Plan - growth Option
Since Inception SIP
5 Year SIP
3 Year SIP
1 Year SIP
Total Amount Invested (` ‘000) 1,110.00 600.00 360.00 120.00 Mkt Value As on January 29, 2021 (` ‘000) 1,656.11 854.20 473.35 122.17 Returns (%) 8.42 14.12 18.64 3.39 Benchmark Returns (%) # 9.91 15.43 19.98 5.42 Additional Benchmark Returns (%) ## N.A. N.A. N.A. N.A.
Assuming ` 10,000 invested systematically on the first Business Day of every month over a period of time. CAGR returns are computed after accounting for the cash flow by using xIRR method (investment internal rate of return) for Regular Plan - Growth Option. The above investment simulation is for illustrative purposes only and should not be construed as a promise on minimum returns and safeguard of capital.
CATEgORY OF SCHEME: FUND OF FUND (DOMESTIC)
KEY FACTS
INVESTMENT OBjECTIVE
To seek capital appreciation by investing in units of HDFC Gold Exchange Traded Fund (HGETF).
There is no assurance that the investment objective of the Scheme will be realized.
FUND MANAgER
Krishan Kumar Daga (since October 19, 2015)
Total experience: Over 23 years
INCEPTION DATE (Date of Allotment)
November 01, 2011
NAV (AS ON JANUARY 29, 2021) NAV PER UNIT (`)
Regular Plan - Growth Option 15.5771Direct Plan - Growth Option 16.0691
ASSETS UNDER MANAgEMENT (`) IN CRORE
As on January 31, 2021 1,112.84Average for Month of January 2021 1,090.92
TOTAL ExPENSE RATIO (As on January 31, 2021)No Investment Management and Advisory Fees will be charged to the Scheme
Regular: 0.50% Direct: 0.25%
#BENCHMARK INDEX: Domestic Price of Physical Gold
EXIT lOAD
In respect of each purchase/switch-in of units-l An exit Load of 2% is payable if Units are redeemed/
switched-out within 6 months from the date of allotment.l An exit Load of 1% is payable if Units are redeemed/
switched-out after 6 months but within 1 year from the date of allotment.
l No exit Load is payable if Units are redeemed/switched-out after 1 year from the date of allotment.
For further details, please refer to para ‘Exit Load’ on Pg 67.
PLANS & OPTIONS
Regular Plan, Direct Plan. Each Plan offers Growth Option only.
MINIMUM APPlICATION AMOUNT
Purchase: Under Growth Option : ` 5,000 and any amount thereafter.
Additional Purchase : Under Growth Option : ` 1,000 and any amount thereafter.
Face Value per Unit: ` 10, Data is as of January 31, 2021 unless otherwise specified. N.A. Not Available
This product is suitable for investors who are seeking ~
l capital appreciation over long term
l investment in Units of HDFC Gold Exchange Traded Fund (HGETF). HGETF invests in gold bullion of 0.995 fineness
VeryHigh
Low to
Moderate
Low
Moderate ModeratelyHigh High
RISKOMETERInvestors understand that their principal will be at
moderately high risk
~ Investors should consult their financial advisers, if in doubt about whether the product is suitable for them.
(An open ended Fund of Fund scheme investing in HDFC Gold Exchange Traded Fund)HDFC Gold Fund
^Past performance may or may not be sustained in the future. Load is not taken into consideration for computation of performance.
Issuer Rating % to NAV
OTHERS
MUTUAl FUND UNITS
HDFC Gold Exchange Traded Fund 99.91
Cash, Cash equivalents and Net Current Assets 0.09
Grand Total 100.00
PORTFOLIO
PERFORMANCE ^ - Regular Plan - growth Option
Date Period Scheme Returns (%)
Benchmark Returns (%)#
Value of ` 10,000 invested
Scheme (`) Benchmark (`)#
Jan 31, 20 Last 1 Year 19.39 19.73 11,933 11,967Jan 31, 18 Last 3 Years 16.20 17.42 15,685 16,182Jan 29, 16 Last 5 Years 11.52 12.81 17,262 18,283Nov 01, 11 Since Inception 4.91 6.61 15,577 18,075
Returns less than 1 year period are simple annualized and greater than 1 year are compounded annualized (CAGR). N.A. Not Available. Performance of dividend option under the schemes for the investors would be net of distribution tax, if any. The investors will bear dual expenses i.e. the expenses charged, under the Scheme and underlying scheme (HDFC Gold Exchange Traded Fund) within the permissible limits. For performance of other schemes managed by Krishan Kumar Daga, please refer page 67. Different plans viz. Regular Plan and Direct Plan have a different expense structure. The expenses of the Direct Plan under the Scheme will be lower to the extent of the distribution expenses / commission charged in the Regular Plan. For Performance of Direct Plan, refer page no. 79.
HDFC Gold Fund
n Mutual Fund Units 99.91
n Cash, Cash equivalents and Net Current Assets 0.09
Portfolio Classification by Asset Class (%) HDFC Gold Fund
Cash, Cash equivalents and Net Current Assets 100.00
Portfolio Classification by Rating Class (%)

64 January 2021
Face Value per Unit: ` 223.31, + Industry Classification as recommended by AMFI, Data is as of January 31, 2021 unless otherwise specified. N.A. Not Available
KEY FACTS
INVESTMENT OBjECTIVE
The investment objective of the Scheme is to provide investment returns that, before expenses, closely correspond to the total returns of the Securities as represented by the NIFTY Bank Index, subject to tracking errors.
There is no assurance that the investment objective of the Scheme will be realized.
Exchange Listed
BSe/NSe
Exchange Symbol/Scrip Code
BSE/NSE: HBANKETF | 543224
ISIN
INF179KC1AN8
Creation Unit Size
12,500 units of HDFC Banking ETF
FUND MANAgER
Krishan Kumar Daga (since August 21, 2020)
Total experience: Over 23 years
Arun Agarwal (since August 24, 2020)
Total experience: Over 22 years
INCEPTION DATE (Date of Allotment)
August 21, 2020
NAV (AS ON JANUARY 29, 2021) NAV PER UNIT (`)
HDFC Banking ETF 305.53
ASSETS UNDER MANAgEMENT (`) IN CRORE
As on January 31, 2021 149.78Average for Month of January 2021 155.25
TOTAL ExPENSE RATIO (As on January 31, 2021)Including Additional expenses and Goods and Service Tax on Management Fees
HDFC BANKING ETF 0.16%
#BENCHMARK INDEX: NIFTY Bank (Total Returns Index)
##ADDl. BENCHMARK INDEX: NIFTY 50 (Total Returns Index)
EXIT lOAD
For Creation Unit Size:l No exit load will be levied on redemptions made by
Authorised Participants / Large Investors directly with the Fund in Creation Unit Size.
For other than Creation Unit Size:l N.A. The Units of the ETF in other than Creation Unit Size cannot
ordinarily be directly redeemed with the Fund. These Units can be redeemed (sold) on a continuous basis
on the exchange(s) where it is listed during the trading hours on all trading days.
Refer SID for further details.
For further details, please refer to para ‘Exit Load’ on Pg 67.
PLANS & OPTIONS
Currently, there are no investment Plans/Options being offered under the Scheme.
MINIMUM APPlICATION AMOUNT
Authorised Participants / large Investors: Application for subscription of the ETF Units in Creation Unit Size can be made either:
l in exchange of Cash* [as determined by the AMC equivalent to the cost incurred towards the purchase of predefined basket of securities that represent the underlying index (i.e. Portfolio Deposit)], Cash Component and other applicable transaction charges; or
l in exchange of Portfolio Deposit [i.e. by depositing basket of securities constituting NIFTY Bank Index] along with the cash component and applicable transaction charges.
Each Creation Unit Size will consist of 12,500 Units of the ETF and 1 Unit of the ETF will be approximately equal to 1/100th of the value of NIFTY Bank Index.
*Cash means payments shall be made only by means of payment instruction of Real Time Gross Settlement (RTGS) / National Electronic Funds Transfer (NEFT) or Funds Transfer Letter / Transfer Cheque of a bank where the Scheme has a collection account.
Redemption of Units of the ETF in Creation Unit Size will be allowed by means of exchange of Portfolio Deposit or in Cash.
Other investors (including Authorised Participants and large Investors): Units of the ETF can be subscribed (in lots of 1 Unit) during the trading hours on all trading days on the NSe and/ or BSe on which the Units will be listed.
CATEgORY OF SCHEME: ExCHANGE TRADED FUND
This product is suitable for investors who are seeking ~
l returns that are commensurate with the performance of the NIFTY Bank Index (Total Returns Index), subject to tracking error, over long term
l investment in equity securities covered by the NIFTY Bank Index
VeryHigh
Low to
Moderate
Low
Moderate ModeratelyHigh High
RISKOMETERInvestors understand that their principal will be at
very high risk
~ Investors should consult their financial advisers, if in doubt about whether the product is suitable for them.
Issuer Industry+ % to NAV
EqUITY & EqUITY RElATED
• HDFC Bank Ltd. Banks 26.89
• ICICI Bank Ltd. Banks 20.01
• Axis Bank Ltd. Banks 16.59
• Kotak Mahindra Bank Ltd. Banks 13.55
• State Bank of India Banks 10.93
• Indusind Bank Ltd. Banks 4.85
• Bandhan Bank Ltd. Banks 2.11
• The Federal Bank Ltd. Banks 1.46
• IDFC First Bank Ltd. Banks 1.00
• RBL Bank Ltd. Banks 0.97
Bank of Baroda Banks 0.83
Punjab National Bank Banks 0.81
Sub Total 100.00
Cash, Cash equivalents and Net Current Assets @
Grand Total 100.00
• Top Ten Holdings, @ less than 0.01%
PORTFOLIO
(An open ended scheme replicating / tracking NIFTY Bank Index)HDFC Banking ETF
HDFC Banking ETF
n Banks 100.00
n Cash, Cash equivalents and Net Current Assets 0.00
Portfolio Classification by Asset Class (%)HDFC Banking ETF
n equity 100.00
n Cash, Cash equivalents and Net Current Assets 0.00
Portfolio Classification by Rating Class (%)

January 2021 65
Face Value per Unit: ` 10 unless otherwise specified, + Industry Classification as recommended by AMFI, Data is as of January 31, 2021 unless otherwise specified.
This product is suitable for investors who are seeking ~
l capital appreciation over long term/regular income
l investment predominantly in equity and equity related Instruments of dividend yielding companies
VeryHigh
Low to
Moderate
Low
Moderate ModeratelyHigh High
RISKOMETERInvestors understand that their principal will be at
very high risk
~ Investors should consult their financial advisers, if in doubt about whether the product is suitable for them.
(An open ended equity scheme predominantly investing in dividend yielding stocks)HDFC Dividend Yield Fund
Company Industry+ % to NAV
EqUITY & EqUITY RElATED
• Infosys Ltd. Software 5.66
• Hindustan Unilever Ltd. Consumer Non Durables 5.51
• ITC Ltd. Consumer Non Durables 4.76
• Tata Consultancy Services Ltd. Software 3.79
• HCL Technologies Ltd. Software 3.06
• Inox Leisure Ltd. Media & entertainment 2.93
• Tech Mahindra Ltd. Software 2.93
• NTPC Ltd. Power 2.65
• NHPC Ltd. Power 2.42
• Tata Motors Ltd. Auto 2.40
Chambal Fertilizers & Chemicals Ltd. Fertilisers 2.32
CeSC Ltd. Power 2.16
Wipro Ltd. Software 2.16
Indian Railways Finance Corporation Ltd. Finance 2.08
ICICI Bank Ltd. Banks 1.96
Quess Corp Ltd. Services 1.89
Indian Railway Catering And Tourism Corporation Ltd. Services 1.77
Bharti Airtel Ltd. Telecom - Services 1.69
Nestle India Ltd. Consumer Non Durables 1.66
Coal India Ltd. Minerals/Mining 1.61
Power Finance Corporation Ltd. Finance 1.54
emami Ltd. Consumer Non Durables 1.47
ReC Ltd. Finance 1.45
Dilip Buildcon Ltd. Construction Project 1.44
UPL Ltd. Pesticides 1.37
Ambuja Cements Ltd. Cement 1.33
Sun Pharmaceutical Industries Ltd. Pharmaceuticals 1.33
Greenply Industries Ltd. Consumer Durables 1.30
HDFC Bank Ltd. Banks 1.27
Larsen and Toubro Ltd. Construction Project 1.22
Axis Bank Ltd. Banks 1.21
AIA engineering Ltd. Industrial Products 1.19
Tube Investments of India Ltd. Auto Ancillaries 1.19
Vardhman Textiles Ltd. Textiles - Cotton 1.12
Sun TV Network Ltd. Media & entertainment 1.10
Centum electronics Ltd. Industrial Capital Goods 1.06
Hindustan Petroleum Corporation Ltd. Petroleum Products 1.06
PNC Infratech Ltd. Construction 1.03
State Bank of India Banks 1.03
Godrej Consumer Products Ltd. Consumer Non Durables 1.02
Balrampur Chini Mills Ltd. Consumer Non Durables 1.01
GHCL Ltd. Chemicals 0.99
SKF India Ltd. Industrial Products 0.99
Carborundum Universal Ltd. Industrial Products 0.98
Cholamandalam Financial Holdings Ltd. Finance 0.91
Mahindra & Mahindra Ltd. Auto 0.91
Bharat electronics Ltd. Industrial Capital Goods 0.90
Finolex Cables Ltd. Industrial Products 0.89
Company Industry+ % to NAV
MM Forgings Ltd. Industrial Products 0.89
UTI Asset Management Company Ltd. Finance 0.89
Oil & Natural Gas Corporation Ltd. Oil 0.86
Trent Ltd. Retailing 0.85
Muthoot Finance Ltd. Finance 0.84
SBI Life Insurance Company Ltd. Finance 0.84
GAIL (India) Ltd. Gas 0.69
Apollo Tyres Ltd. Auto Ancillaries 0.61
Lupin Ltd. Pharmaceuticals 0.61
Mahindra Holidays & Resorts Ind Ltd.
Hotels/Resorts & Other Recreational Activities 0.53
ICICI Securities Ltd. Finance 0.48
Hindustan Aeronautics Ltd. Aerospace & Defence 0.11Sub Total 95.92Cash, Cash equivalents and Net Current Assets 4.08
Grand Total 100.00
• Top Ten Holdings, £ Co-sponsor
PORTFOLIO
Industry Allocation of Equity Holding (% of Net Assets)
0.110.530.690.850.860.991.031.061.121.301.331.371.611.691.801.941.962.322.663.313.664.034.945.47
7.239.03
15.4317.60
0 2 4 6 8 1012141618Aerospace & Defence
Hotels, Resorts & Other Recreational ActivitiesGas
RetailingOil
ChemicalsConstruction
Petroleum ProductsTextiles - Cotton
Consumer DurablesCement
PesticidesMinerals/Mining
Telecom - ServicesAuto AncillariesPharmaceuticals
Industrial Capital GoodsFertilisers
Construction ProjectAuto
ServicesMedia & Entertainment
Industrial ProductsBanksPower
FinanceConsumer Non Durables
Software
KEY FACTS
INVESTMENT OBjECTIVE
To provide capital appreciation and/or dividend distribution by predominantly investing in a well-diversified portfolio of equity and equity related instruments of dividend yielding companies.
There is no assurance that the investment objective of the Scheme will be realized.
FUND MANAgER § ¥
gopal Agrawal (since December 18, 2020)
Total experience: Over 16 years
INCEPTION DATE (Date of Allotment)
December 18, 2020
NAV (AS ON JANUARY 29, 2021) NAV PER UNIT (`)
Regular Plan - Growth Option 9.969Regular Plan - Dividend Option 9.969Direct Plan - Growth Option 9.989Direct Plan - Dividend Option 9.989
ASSETS UNDER MANAgEMENT (`) IN CRORE
As on January 31, 2021 1,642.27Average for Month of January 2021 1,656.51
TOTAL ExPENSE RATIO (As on January 31, 2021)Including Additional expenses and Goods and Service Tax on Management Fees
Regular: 2.11% Direct: 0.34%
#BENCHMARK INDEX: NIFTY Dividend Opportunities 50 (Total Returns Index)
##ADDl. BENCHMARK INDEX: NIFTY 50 (Total Returns Index)
EXIT lOAD
l In respect of each purchase / switch-in of Units, an exit Load of 1.00% is payable if Units are redeemed / switched-out within 1 year from the date of allotment.
l No exit Load is payable if Units are redeemed / switched-out after 1 year from the date of allotment.
For further details, please refer to para ‘Exit Load’ on Pg 67.
PLANS & OPTIONS
Regular Plan, Direct Plan. Under each Plan : Growth & Dividend. The Dividend Option offers Dividend Payout and Reinvestment facility.
MINIMUM APPlICATION AMOUNT
Purchase : ` 5,000 and any amount thereafter.Additional Purchase : ` 1,000 and any amount thereafter.
¥ Dedicated Fund Manager for Overseas Investments: Mr. Sankalp Baid (since January 22, 2021) (Total experience: Over 13 years).
CATEgORY OF SCHEME: DIVIDEND YIELD FUND

66 January 2021
Face Value per Unit: ` 10 unless otherwise specified, + Industry Classification as recommended by AMFI, Data is as of January 31, 2021 unless otherwise specified.
This product is suitable for investors who are seeking ~
l capital appreciation over long term/regular incomel investment predominantly in equity and equity related
instruments of entities engaged in and/ or expected to benefit from the growth in housing and its allied business activities
VeryHigh
Low to
Moderate
Low
Moderate ModeratelyHigh High
RISKOMETERInvestors understand that their principal will be at
very high risk
~ Investors should consult their financial advisers, if in doubt about whether the product is suitable for them.
(An open ended equity scheme following housing and allied activities theme)HDFC Housing Opportunities Fund
Company Industry+ % to NAV
EqUITY & EqUITY RElATED
• ICICI Bank Ltd. Banks 11.86
• HDFC Bank Ltd. Banks 11.80
• Larsen and Toubro Ltd. Construction Project 9.71
• State Bank of India Banks 8.58
• Axis Bank Ltd. Banks 6.90
• Housing Development Finance Corporation Ltd.£ Finance 6.73
• NTPC Ltd. Power 6.14
• Ambuja Cements Ltd. Cement 6.04
• Power Grid Corporation of India Ltd. Power 2.64
• Indian Railways Finance Corporation Ltd. Finance 2.40
GAIL (India) Ltd. Gas 2.31
Ashoka Buildcon Ltd. Construction Project 2.17
Sagar Cements Ltd. Cement 1.58
Tata Steel Ltd. Ferrous Metals 1.42
Orient Cement Ltd. Cement 1.34
Prestige estates Projects Ltd. Construction 1.31
Dilip Buildcon Ltd. Construction Project 1.23
Bharat Petroleum Corporation Ltd. Petroleum Products 1.17
Bharat Dynamics Ltd. Aerospace & Defence 0.99
AkzoNobel India Ltd. Consumer Non Durables 0.95
RBL Bank Ltd. Banks 0.92
NCL Industries Ltd. Cement 0.83
Petronet LNG Ltd. Gas 0.79
JMC Projects (India) Ltd. Construction 0.73
SBI Cards and Payment Services Ltd. Finance 0.69
Ge Power India Ltd. Industrial Capital Goods 0.43
PNC Infratech Ltd. Construction 0.36
Hindalco Industries Ltd. Non - Ferrous Metals 0.35
Birla Corporation Ltd. Cement 0.32
Prism Johnson Ltd. Cement 0.27
Finolex Cables Ltd. Industrial Products 0.26
HPL electric and Power Ltd. Consumer Durables 0.22
ITD Cementation India Ltd. Construction 0.15
KCP Ltd. Cement 0.07
Repco Home Finance Ltd. Finance 0.02Sub Total 93.68Cash, Cash equivalents and Net Current Assets 6.32
Grand Total 100.00
• Top Ten Holdings, £ Co-sponsor
PORTFOLIO Industry Allocation of Equity Holding (% of Net Assets)
0.22
0.26
0.35
0.43
0.95
0.99
1.17
1.42
2.55
3.10
8.78
9.84
10.45
13.11
40.06
0 5 10 15 20 25 30 35 40 45
Consumer Durables
Industrial Products
Non - Ferrous Metals
Industrial Capital Goods
Consumer Non Durables
Aerospace & Defence
Petroleum Products
Ferrous Metals
Construction
Gas
Power
Finance
Cement
Construction Project
BanksKEY FACTS
INVESTMENT OBjECTIVE
To provide long-term capital appreciation by investing predominantly in equity and equity related instruments of entities engaged in and/or expected to benefit from the growth in housing and its allied business activities.There is no assurance that the investment objective of the Scheme will be realized.
FUND MANAgER § ¥
Rakesh Vyas (since June 01, 2019)
Total experience: Over 17 years
INCEPTION DATE (Date of Allotment)
December 6, 2017
NAV (AS ON JANUARY 29, 2021) NAV PER UNIT (`)
Regular Plan - Growth Option 9.396Regular Plan - Dividend Option 9.396Direct Plan - Growth Option 9.712Direct Plan - Dividend Option 9.712
ASSETS UNDER MANAgEMENT (`) IN CRORE
As on January 31, 2021 2,131.97Average for Month of January 2021 2,553.37
qUANTITATIVE DATA
Portfolio Turnover Ratio (Last 1 year) 12.17%
Risk Ration Standard Deviation 7.067%n Beta 1.018n Sharpe Ratio* -0.029
Computed for the 3-yr period ended January 29, 2021. Based on month-end NAV. * Risk free rate: 3.47%(Source: FIMMDA MIBOR)
TOTAL ExPENSE RATIO (As on January 31, 2021)Including Additional expenses and Goods and Service Tax on Management Fees
Regular: 2.03% Direct: 0.94%
#BENCHMARK INDEX: India Housing & Allied Businesses Index (Total Returns Index)##ADDl. BENCHMARK INDEX: NIFTY 50 (Total Returns Index)
EXIT lOAD
Applicable only for units allotted after conversion of scheme into open-ended scheme i.e. on or after January 19, 2021:
In respect of each purchase / switch-in of Units, upto 15% of the units may be redeemed without any exit load from the date of allotment.
l Any redemption in excess of the above limit shall be subject to the following exit load: - exit load of 1.00% is payable if Units are redeemed / switched-out within 1 year from the date of allotment of units.
l No exit Load is payable if Units are redeemed / switched-out after 1 year from the date of allotment. No entry / exit Load shall be levied on bonus units and units allotted on dividend reinvestment.
Note: To clarify, Unitholders who acquired units on or before January 18, 2021, will not be charged exit load in respect of those units.
For further details, please refer to para ‘Exit Load’ on Pg 67.
PLANS & OPTIONS
Regular Plan, Direct Plan. Under each Plan : Growth & Dividend. The Dividend Option offers Dividend Payout and Reinvestment facility.
MINIMUM APPlICATION AMOUNT
Purchase : ` 5,000 and any amount thereafter*.Additional Purchase : ` 1,000 and any amount thereafter.*applicable if investing for the first time in a folio in the Scheme.
¥ Dedicated Fund Manager for Overseas Investments: Mr. Sankalp Baid (since January 22, 2021) (Total experience: Over 13 years).
CATEgORY OF SCHEME: THEMATIC FUND
[w.e.f January 19, 2021 (Erstwhile HDFC HOF - I - 1140D November 2017 (1)]
The date of inception/allotment of HDFC Housing opportunities Fund is December 6, 2017. The Scheme was launched as a close ended thematic Equity Scheme. The Scheme has been converted into open-ended scheme on January 19, 2021.
PERFORMANCE ^ - Regular Plan - growth OptionDate Period Scheme
Returns (%)
Benchmark Returns
(%)#
Additional Benchmark
Returns (%) ##
Value of ` 10,000 investedScheme (`) Benchmark
(`)#Additional
Benchmark (`)##
Jan 31, 20 Last 1 Year 0.96 13.71 15.22 10,095 11,367 11,518Jan 31, 18 Last 3 Years -3.08 5.90 8.70 9,105 11,875 12,841Dec 06, 17 Since Inception -1.96 8.88 11.53 9,396 13,073 14,103
Returns greater than 1 year period are compounded annualized (CAGR). Performance of dividend option under the schemes for the investors would be net of distribution tax, if any. N.A. Not Available. For performance of other schemes managed by Rakesh Vyas, please refer page 67. Different plans viz. Regular Plan and Direct Plan have a different expense structure. The expenses of the Direct Plan under the Scheme will be lower to the extent of the distribution expenses / commission charged in the Regular Plan. For Performance of Direct Plan, refer page no. 68.
^Past performance may or may not be sustained in the future. Load is not taken into consideration for computation of performance.

January 2021 67
Performance details of Schemes managed by respective Fund Managers
Sr. No. Name of the Fund Manager Funds Managed Page no.1 Mr. Prashant Jain HDFC Flexi Cap Fund (Erstwhile HDFC Equity Fund) 9
HDFC Top 100 Fund 11HDFC Balanced Advantage Fund 17-18HDFC Hybrid Debt Fund (Co-managed scheme) 36-37Permitted Category FPI Portfolio 81
2 Mr. Chirag Setalvad HDFC Mid-Cap Opportunities Fund 12HDFC Small Cap Fund 13HDFC Long Term Advantage Fund 68HDFC Hybrid Equity Fund 19-20HDFC Children’s Gift Fund 28-29HDFC Retirement Savings Fund - Equity Plan (Co-managed scheme) 30HDFC Retirement Savings Fund - Hybrid Equity Plan (Co-managed scheme) 31-32HDFC Retirement Savings Fund - Hybrid Debt Plan (Co-managed scheme) 33
3 Mr. Amit B. Ganatra HDFC Capital Builder Value Fund 10HDFC Dynamic PE Ratio Fund of Funds (Co-managed scheme) 72HDFC Multi-Asset Fund (Co-managed scheme) 21-22HDFC TaxSaver 27Closed ended schemes 72
4 Mr. Krishan Kumar Daga HDFC Arbitrage Fund (Co-managed scheme) 38-39HDFC Multi-Asset Fund (Co-managed scheme) 21-22HDFC Index Fund - SEnSEx Plan (Co-managed scheme) 26HDFC Index Fund - nIFTY 50 Plan (Co-managed scheme) 24HDFC SEnSEx ETF (Co-managed scheme) 25HDFC nIFTY 50 ETF (Co-managed scheme) 23HDFC Gold Exchange Traded Fund 62HDFC Gold Fund 63HDFC Equity Savings Fund (Co-managed scheme) 34-35HDFC Banking ETF (Co-managed scheme) 64
5 Mr. Shobhit Mehrotra HDFC Income Fund 48HDFC Medium Term Debt Fund 49-50HDFC Floating Rate Debt Fund (Co-managed scheme) 56HDFC Credit Risk Debt Fund 42-43HDFC Hybrid Debt Fund (Co-managed scheme) 36-37HDFC Retirement Savings Fund - Equity Plan (Co-managed scheme) 30HDFC Retirement Savings Fund - Hybrid Equity Plan (Co-managed scheme) 31-32HDFC Retirement Savings Fund - Hybrid Debt Plan (Co-managed scheme) 33Close ended schemes 68-69
6 Mr. Anil Bamboli HDFC Dynamic Debt Fund 47HDFC Short Term Debt Fund 51-52HDFC Gilt Fund 46HDFC Money Market Fund (Co-managed scheme) 55HDFC Ultra Short Term Fund 57-58HDFC Overnight Fund 61HDFC Banking and PSU Debt Fund 44-45HDFC Equity Savings Fund (Co-managed scheme) 34-35HDFC Multi-Asset Fund (Co-managed scheme) 21-22HDFC Dynamic PE Ratio Fund of Funds (Co-managed scheme) 72Close ended schemes 69-70
7 Mr. Anupam Joshi HDFC Liquid Fund 59-60HDFC Corporate Bond Fund 40-41HDFC Low Duration Fund 53-54Close ended schemes 70-72
8 Mr. Rakesh Vyas HDFC Infrastructure Fund 16HDFC Housing Opportunities Fund 66
9 Mr. Vikash Agarwal HDFC Floating Rate Debt Fund (Co-managed scheme) 56HDFC Money Market Fund (Co-managed scheme) 55
10 Mr. Gopal Agrawal HDFC Equity Savings Fund (Co-managed scheme) 34-35HDFC Focused 30 Fund 15HDFC Growth Opportunities Fund 14HDFC Dividend Yield Fund 65
11 Mr. Arun Agarwal HDFC Arbitrage Fund (Co-managed scheme) 38-39HDFC Equity Savings Fund (Co-managed scheme) 34-35HDFC Index Fund - SEnSEx Plan (Co-managed scheme) 26HDFC Index Fund - nIFTY 50 Plan (Co-managed scheme) 24HDFC SEnSEx ETF (Co-managed scheme) 25HDFC nIFTY 50 ETF (Co-managed scheme) 23HDFC Multi-Asset Fund (Co-managed scheme) 21-22HDFC Banking ETF (Co-managed scheme) 65
For performance details of Direct Plan, refer page 73-80
https://files.hdfcfund.com/s3fs-public/2020-07/FAQs%20on%20Stamp%20Duty.pdf
Exit Load : (i) no exit load shall be levied for switching between Options under the same Plan within a Scheme. (ii) Switch of investments to Direct Plan within the same Scheme shall be subject to applicable exit load, unless the investments were made without any distributor code. However, any subsequent switch-out or redemption of such investments from the Direct Plan will not be subject to any exit load. (iii) no exit load shall be levied for switch-out from Direct Plan to other Plan within the same Scheme. However, any subsequent switch-out or redemption of such investment from the other Plan shall be subject to exit load based on the original date of investment in the Direct Plan. (iv) Switch of investments between Plans under a Scheme having separate portfolios, will be subject to applicable exit load. (v) no exit load will be levied on Bonus Units and Units allotted on Dividend Re-investment. (vi) In case of Systematic Transactions such as SIP, GSIP, Flex SIP, STP, Flex STP, Swing STP, Flexindex; Exit Load, if any, prevailing on the date of registration / enrolment shall be levied.
Tax Benefits / Consequences : The Dividend Distribution Tax on distribution of income by equity oriented fund to all the investors shall be payable at the rate of 11.648%* and on distribution of income by other than equity oriented fund to an individual / HUF shall be payable at the rate of 29.12%* and at the rate of 34.944%* on distribution of income to any other investor. Such income distributed by the Scheme(s) is free from Income–tax in the hands of Investors. Units of the Scheme(s) are not subject to Wealth-tax and Gift-tax. Unit holders are required to pay Securities Transaction Tax (STT) at the rate of 0.001% at the time of redemption / switch-out of units of an equity-oriented fund. * including applicable surcharge, health and education cess.
Investors should be aware that the fiscal rules / tax laws may change and there can be no guarantee that the current tax position may continue indefinitely. In view of individual nature of tax consequences, each investor is advised to consult his / her own professional tax advisor.
Applicability of Stamp Duty : Effective July 1, 2020, in accordance with the amendment to the Indian Stamp Act, 1899, a stamp duty @ 0.005% of the transaction value would be levied on applicable mutual fund purchase transactions (including transactions carried through stock exchanges and depositories for units in demat mode). Thus, the number of units allotted on all the applicable mutual fund transactions would be reduced to the extent of levy of stamp duty.
Kindly refer to FAQs on Stamp Duty, for details on the nature of transactions and the rate of levy of stamp duty available on our website.

68 January 2021
SCHEME PERFORMANCE - REGULAR PLAN - GROWTH OPTION (FUND MANAGER-WISE)
Past performance may or may not be sustained in the future. Returns greater than 1 year period are compounded annualized (CAGR). Different plans viz. Regular Plan and Direct Plan have a different expense structure. The expenses of the Direct Plan under the Scheme will be lower to the extent of the distribution expenses / commission charged in the Regular Plan. Load is not taken into consideration for computation of performance. n.A.: not Available
Performance of close-ended schemes, being close-ended in nature, is not strictly comparable with that of open-ended schemes since the investment strategy for close-ended schemes is primarily buy-and-hold whereas open-ended schemes are actively managed.
CHIRAG SETALVAD
HDFC LONG TERM ADVANTAGE FUND NAV as on Jan 29, 2021 ` 414.568
Date Period Scheme Returns
(%)
Benchmark Returns
(%)#
Additional Benchmark
Returns (%) ##
Value of ` 10,000 invested
Scheme (`)
Benchmark (`)#
Additional Benchmark
(`)##
Jan 31, 20 Last 1 Year 11.67 15.05 15.22 11,164 11,500 11,518Jan 31, 18 Last 3 Years 4.71 10.08 8.70 11,480 13,336 12,841Jan 29, 16 Last 5 Years 13.76 14.65 13.94 19,068 19,826 19,214Jan 02, 01 Since Inception 20.37 14.72 14.12 414,568 157,827 141,949
# S&P BSE SEnSEx (Total Returns Index) ## nIFTY 50 (Total Returns Index). The scheme is managed by Mr. Chirag Setalvad since April 02, 2007.
SHOBHIT MEHROTRA
HDFC FMP 3360D MARCH 2014 (1) NAV as on Jan 29, 2021 ` 16.7258
Date Period Scheme Returns
(%)
Benchmark Returns
(%)#
Additional Benchmark
Returns (%) ##
Value of ` 10,000 invested
Scheme (`)
Benchmark (`)#
Additional Benchmark
(`)##
Jan 31, 20 Last 1 Year 9.35 11.30 9.14 10,932 11,127 10,911Jan 31, 18 Last 3 Years 9.10 9.67 9.04 12,983 13,186 12,963Jan 29, 16 Last 5 Years 9.31 9.12 7.93 15,614 15,477 14,654Mar 26, 14 Since Inception 7.80 9.69 8.63 16,726 18,850 17,638
# CRISIL Composite Bond Fund Index ## CRISIL 10 year Gilt Index. The scheme is managed by Mr. Shobhit Mehrotra since inception.
HDFC FMP 1430D JULY 2017 (1) NAV as on Jan 29, 2021 ` 12.7429
Date Period Scheme Returns
(%)
Benchmark Returns
(%)#
Additional Benchmark
Returns (%) ##
Value of ` 10,000 invested
Scheme (`)
Benchmark (`)#
Additional Benchmark
(`)##
Jan 31, 20 Last 1 Year 6.52 11.30 5.52 10,650 11,127 10,551Jan 31, 18 Last 3 Years 7.82 9.67 6.67 12,531 13,186 12,135Aug 01, 17 Since Inception 7.17 8.14 6.51 12,743 13,148 12,470
# CRISIL Composite Bond Fund Index ## CRISIL 1 year T-Bill Index. The Scheme is in existence for more than 1 year but less than 5 years. The scheme is managed by Mr. Shobhit Mehrotra since inception.
HDFC FMP 1113D JUNE 2018 (1) NAV as on Jan 29, 2021 ` 12.4146
Date Period Scheme Returns
(%)
Benchmark Returns
(%)#
Additional Benchmark
Returns (%) ##
Value of ` 10,000 invested
Scheme (`)
Benchmark (`)#
Additional Benchmark
(`)##
Jan 31, 20 Last 1 Year 7.11 11.30 5.52 10,709 11,127 10,551Jun 14, 18 Since Inception 8.57 11.11 6.82 12,415 13,192 11,894
# CRISIL Composite Bond Fund Index ## CRISIL 1 year T-Bill Index. The Scheme is in existence for more than 1 year but less than 3 years. The scheme is managed by Mr. Shobhit Mehrotra since inception.
HDFC FMP 1124D JUNE 2018 (1) NAV as on Jan 29, 2021 ` 12.4533
Date Period Scheme Returns
(%)
Benchmark Returns
(%)#
Additional Benchmark
Returns (%) ##
Value of ` 10,000 invested
Scheme (`)
Benchmark (`)#
Additional Benchmark
(`)##
Jan 31, 20 Last 1 Year 11.35 11.30 5.52 11,131 11,127 10,551Jun 29, 18 Since Inception 8.84 11.06 6.80 12,453 13,119 11,858
# CRISIL Composite Bond Fund Index ## CRISIL 1 year T-Bill Index. The Scheme is in existence for more than 1 year but less than 3 years. The scheme is managed by Mr. Shobhit Mehrotra since inception.
HDFC FMP 1099D JUNE 2018 (1) NAV as on Jan 29, 2021 ` 12.3455
Date Period Scheme Returns
(%)
Benchmark Returns
(%)#
Additional Benchmark
Returns (%) ##
Value of ` 10,000 invested
Scheme (`)
Benchmark (`)#
Additional Benchmark
(`)##
Jan 31, 20 Last 1 Year 6.88 11.30 5.52 10,686 11,127 10,551Jun 28, 18 Since Inception 8.47 11.09 6.80 12,346 13,132 11,860
# CRISIL Composite Bond Fund Index ## CRISIL 1 year T-Bill Index. The Scheme is in existence for more than 1 year but less than 3 years. The scheme is managed by Mr. Shobhit Mehrotra since inception.
HDFC FMP 1122D JULY 2018 (1) NAV as on Jan 29, 2021 ` 12.3913
Date Period Scheme Returns
(%)
Benchmark Returns
(%)#
Additional Benchmark
Returns (%) ##
Value of ` 10,000 invested
Scheme (`)
Benchmark (`)#
Additional Benchmark
(`)##
Jan 31, 20 Last 1 Year 7.17 11.30 5.52 10,715 11,127 10,551Jul 04, 18 Since Inception 8.68 10.98 6.83 12,391 13,077 11,854
# CRISIL Composite Bond Fund Index ## CRISIL 1 year T-Bill Index. The Scheme is in existence for more than 1 year but less than 3 years. The scheme is managed by Mr. Shobhit Mehrotra since inception.
HDFC FMP 1133D JULY 2018 (1) NAV as on Jan 29, 2021 ` 12.2376
Date Period Scheme Returns
(%)
Benchmark Returns
(%)#
Additional Benchmark
Returns (%) ##
Value of ` 10,000 invested
Scheme (`)
Benchmark (`)#
Additional Benchmark
(`)##
Jan 31, 20 Last 1 Year 8.32 11.30 5.52 10,830 11,127 10,551Jul 25, 18 Since Inception 8.35 10.96 6.85 12,238 12,993 11,816
# CRISIL Composite Bond Fund Index ## CRISIL 1 year T-Bill Index. The Scheme is in existence for more than 1 year but less than 3 years. The scheme is managed by Mr. Shobhit Mehrotra since inception.
HDFC FMP 1133D FEBRUARY 2019 (1) NAV as on Jan 29, 2021 ` 11.9266
Date Period Scheme Returns
(%)
Benchmark Returns
(%)#
Additional Benchmark
Returns (%) ##
Value of ` 10,000 invested
Scheme (`)
Benchmark (`)#
Additional Benchmark
(`)##
Jan 31, 20 Last 1 Year 8.99 11.30 5.52 10,896 11,127 10,551Mar 06, 19 Since Inception 9.69 11.73 6.26 11,927 12,350 11,226
# CRISIL Composite Bond Fund Index ## CRISIL 1 year T-Bill Index. The Scheme is in existence for more than 1 year but less than 3 years. The scheme is managed by Mr. Shobhit Mehrotra since inception.
HDFC FMP 1126D MARCH 2019 (1) NAV as on Jan 29, 2021 ` 11.8944
Date Period Scheme Returns
(%)
Benchmark Returns
(%)#
Additional Benchmark
Returns (%) ##
Value of ` 10,000 invested
Scheme (`)
Benchmark (`)#
Additional Benchmark
(`)##
Jan 31, 20 Last 1 Year 9.03 11.30 5.52 10,900 11,127 10,551Mar 13, 19 Since Inception 9.64 11.59 6.24 11,894 12,296 11,209
# CRISIL Composite Bond Fund Index ## CRISIL 1 year T-Bill Index. The Scheme is in existence for more than 1 year but less than 3 years. The scheme is managed by Mr. Shobhit Mehrotra since inception.
HDFC FMP 1127D MARCH 2019 (1) NAV as on Jan 29, 2021 ` 11.8130
Date Period Scheme Returns
(%)
Benchmark Returns
(%)#
Additional Benchmark
Returns (%) ##
Value of ` 10,000 invested
Scheme (`)
Benchmark (`)#
Additional Benchmark
(`)##
Jan 31, 20 Last 1 Year 8.80 11.30 5.52 10,877 11,127 10,551Mar 19, 19 Since Inception 9.33 11.58 6.20 11,813 12,273 11,189
# CRISIL Composite Bond Fund Index ## CRISIL 1 year T-Bill Index. The Scheme is in existence for more than 1 year but less than 3 years. The scheme is managed by Mr. Shobhit Mehrotra since inception.
HDFC FMP 1120D MARCH 2019 (1) NAV as on Jan 29, 2021 ` 11.7628
Date Period Scheme Returns
(%)
Benchmark Returns
(%)#
Additional Benchmark
Returns (%) ##
Value of ` 10,000 invested
Scheme (`)
Benchmark (`)#
Additional Benchmark
(`)##
Jan 31, 20 Last 1 Year 8.75 11.30 5.52 10,872 11,127 10,551Mar 26, 19 Since Inception 9.18 11.38 6.18 11,763 12,205 11,173
# CRISIL Composite Bond Fund Index ## CRISIL 1 year T-Bill Index. The Scheme is in existence for more than 1 year but less than 3 years. The scheme is managed by Mr. Shobhit Mehrotra since inception.
HDFC FMP 1118D MARCH 2019 (1) NAV as on Jan 29, 2021 ` 11.8003
Date Period Scheme Returns
(%)
Benchmark Returns
(%)#
Additional Benchmark
Returns (%) ##
Value of ` 10,000 invested
Scheme (`)
Benchmark (`)#
Additional Benchmark
(`)##
Jan 31, 20 Last 1 Year 8.81 11.30 5.52 10,879 11,127 10,551Mar 28, 19 Since Inception 9.39 11.34 6.19 11,800 12,190 11,171
# CRISIL Composite Bond Fund Index ## CRISIL 1 year T-Bill Index. The Scheme is in existence for more than 1 year but less than 3 years. The scheme is managed by Mr. Shobhit Mehrotra since inception.

January 2021 69
SCHEME PERFORMANCE - REGULAR PLAN - GROWTH OPTION (FUND MANAGER-WISE)
SHOBHIT MEHROTRA....CONTINUED
Past performance may or may not be sustained in the future. Returns greater than 1 year period are compounded annualized (CAGR). Different plans viz. Regular Plan and Direct Plan have a different expense structure. The expenses of the Direct Plan under the Scheme will be lower to the extent of the distribution expenses / commission charged in the Regular Plan. Load is not taken into consideration for computation of performance. n.A.: not Available
Performance of close-ended schemes, being close-ended in nature, is not strictly comparable with that of open-ended schemes since the investment strategy for close-ended schemes is primarily buy-and-hold whereas open-ended schemes are actively managed.
HDFC FMP 1100D APRIL 2019 (1) NAV as on Jan 29, 2021 ` 11.7748
Date Period Scheme Returns
(%)
Benchmark Returns
(%)#
Additional Benchmark
Returns (%) ##
Value of ` 10,000 invested
Scheme (`)
Benchmark (`)#
Additional Benchmark
(`)##
Jan 31, 20 Last 1 Year 8.92 11.30 5.52 10,890 11,127 10,551May 08, 19 Since Inception 9.89 11.84 6.27 11,775 12,137 11,111
# CRISIL Composite Bond Fund Index ## CRISIL 1 year T-Bill Index. The Scheme is in existence for more than 1 year but less than 3 years. The scheme is managed by Mr. Shobhit Mehrotra since inception.
ANIL BAMBOLI
HDFC FMP 1846D AUGUST 2013 (1) NAV as on Jan 29, 2021 ` 19.0830
Date Period Scheme Returns
(%)
Benchmark Returns
(%)#
Additional Benchmark
Returns (%) ##
Value of ` 10,000 invested
Scheme (`)
Benchmark (`)#
Additional Benchmark
(`)##
Jan 31, 20 Last 1 Year 11.40 11.30 5.52 11,137 11,127 10,551Jan 31, 18 Last 3 Years 9.01 9.67 6.67 12,950 13,186 12,135Jan 29, 16 Last 5 Years 8.36 9.12 6.60 14,944 15,477 13,769Aug 14, 13 Since Inception 9.04 9.73 7.22 19,083 20,004 16,827
# CRISIL Composite Bond Fund Index ## CRISIL 1 year T-Bill Index. The scheme is managed by Mr. Anil Bamboli since inception.
HDFC FMP 1181D APRIL 2018 (1) NAV as on Jan 29, 2021 ` 12.4490
Date Period Scheme Returns
(%)
Benchmark Returns
(%)#
Additional Benchmark
Returns (%) ##
Value of ` 10,000 invested
Scheme (`)
Benchmark (`)#
Additional Benchmark
(`)##Jan 31, 20 Last 1 Year 6.80 11.30 5.52 10,678 11,127 10,551Apr 27, 18 Since Inception 8.26 10.48 6.64 12,449 13,169 11,944
# CRISIL Composite Bond Fund Index ## CRISIL 1 year T-Bill Index. The Scheme is in existence for more than 1 year but less than 3 years. The scheme is managed by Mr. Anil Bamboli since inception.
HDFC FMP 1146D APRIL 2018 (1) NAV as on Jan 29, 2021 ` 12.2398
Date Period Scheme Returns
(%)
Benchmark Returns
(%)#
Additional Benchmark
Returns (%) ##
Value of ` 10,000 invested
Scheme (`)
Benchmark (`)#
Additional Benchmark
(`)##
Jan 31, 20 Last 1 Year 10.20 11.30 5.52 11,017 11,127 10,551May 10, 18 Since Inception 7.70 10.47 6.66 12,240 13,119 11,921
# CRISIL Composite Bond Fund Index ## CRISIL 1 year T-Bill Index. The Scheme is in existence for more than 1 year but less than 3 years. The scheme is managed by Mr. Anil Bamboli since inception.
HDFC FMP 1434D MAY 2018 (1) NAV as on Jan 29, 2021 ` 12.7687
Date Period Scheme Returns
(%)
Benchmark Returns
(%)#
Additional Benchmark
Returns (%) ##
Value of ` 10,000 invested
Scheme (`)
Benchmark (`)#
Additional Benchmark
(`)##
Jan 31, 20 Last 1 Year 8.64 11.30 5.52 10,862 11,127 10,551May 09, 18 Since Inception 9.37 10.45 6.66 12,769 13,116 11,922
# CRISIL Composite Bond Fund Index ## CRISIL 1 year T-Bill Index. The Scheme is in existence for more than 1 year but less than 3 years. The scheme is managed by Mr. Anil Bamboli since inception.
HDFC FMP 1134D MAY 2018 (1) NAV as on Jan 29, 2021 ` 12.4655
Date Period Scheme Returns
(%)
Benchmark Returns
(%)#
Additional Benchmark
Returns (%) ##
Value of ` 10,000 invested
Scheme (`)
Benchmark (`)#
Additional Benchmark
(`)##
Jan 31, 20 Last 1 Year 6.94 11.30 5.52 10,692 11,127 10,551May 24, 18 Since Inception 8.55 10.87 6.74 12,466 13,195 11,916
# CRISIL Composite Bond Fund Index ## CRISIL 1 year T-Bill Index. The Scheme is in existence for more than 1 year but less than 3 years. The scheme is managed by Mr. Anil Bamboli since inception.
HDFC FMP 1119D JUNE 2018 (1) NAV as on Jan 29, 2021 ` 12.4588
Date Period Scheme Returns
(%)
Benchmark Returns
(%)#
Additional Benchmark
Returns (%) ##
Value of ` 10,000 invested
Scheme (`)
Benchmark (`)#
Additional Benchmark
(`)##
Jan 31, 20 Last 1 Year 7.07 11.30 5.52 10,705 11,127 10,551Jun 08, 18 Since Inception 8.66 11.10 6.78 12,459 13,214 11,897
# CRISIL Composite Bond Fund Index ## CRISIL 1 year T-Bill Index. The Scheme is in existence for more than 1 year but less than 3 years. The scheme is managed by Mr. Anil Bamboli since inception.
HDFC FMP 1280D OCTOBER 2018 (1) NAV as on Jan 29, 2021 ` 12.4925
Date Period Scheme Returns
(%)
Benchmark Returns
(%)#
Additional Benchmark
Returns (%) ##
Value of ` 10,000 invested
Scheme (`)
Benchmark (`)#
Additional Benchmark
(`)##
Jan 31, 20 Last 1 Year 9.02 11.30 5.52 10,899 11,127 10,551Oct 11, 18 Since Inception 10.14 11.90 6.85 12,493 12,956 11,649
# CRISIL Composite Bond Fund Index ## CRISIL 1 year T-Bill Index. The Scheme is in existence for more than 1 year but less than 3 years. The scheme is managed by Mr. Anil Bamboli since inception.
HDFC FMP 1344D OCTOBER 2018 (1) NAV as on Jan 29, 2021 ` 12.4790
Date Period Scheme Returns
(%)
Benchmark Returns
(%)#
Additional Benchmark
Returns (%) ##
Value of ` 10,000 invested
Scheme (`)
Benchmark (`)#
Additional Benchmark
(`)##
Jan 31, 20 Last 1 Year 9.95 11.30 5.52 10,992 11,127 10,551Oct 24, 18 Since Inception 10.25 11.77 6.80 12,479 12,871 11,608
# CRISIL Composite Bond Fund Index ## CRISIL 1 year T-Bill Index. The Scheme is in existence for more than 1 year but less than 3 years. The scheme is managed by Mr. Anil Bamboli since inception.
HDFC FMP 1274D OCTOBER 2018 (1) NAV as on Jan 29, 2021 ` 12.4685
Date Period Scheme Returns
(%)
Benchmark Returns
(%)#
Additional Benchmark
Returns (%) ##
Value of ` 10,000 invested
Scheme (`)
Benchmark (`)#
Additional Benchmark
(`)##
Jan 31, 20 Last 1 Year 8.94 11.30 5.52 10,892 11,127 10,551Oct 17, 18 Since Inception 10.12 11.81 6.82 12,469 12,910 11,630
# CRISIL Composite Bond Fund Index ## CRISIL 1 year T-Bill Index. The Scheme is in existence for more than 1 year but less than 3 years. The scheme is managed by Mr. Anil Bamboli since inception.
HDFC FMP 1261D OCTOBER 2018 (1) NAV as on Jan 29, 2021 ` 12.3745
Date Period Scheme Returns
(%)
Benchmark Returns
(%)#
Additional Benchmark
Returns (%) ##
Value of ` 10,000 invested
Scheme (`)
Benchmark (`)#
Additional Benchmark
(`)##
Jan 31, 20 Last 1 Year 8.53 11.30 5.52 10,850 11,127 10,551Oct 25, 18 Since Inception 9.86 11.77 6.79 12,375 12,867 11,604
# CRISIL Composite Bond Fund Index ## CRISIL 1 year T-Bill Index. The Scheme is in existence for more than 1 year but less than 3 years. The scheme is managed by Mr. Anil Bamboli since inception.
HDFC FMP 1260D OCTOBER 2018 (1) NAV as on Jan 29, 2021 ` 12.4517
Date Period Scheme Returns
(%)
Benchmark Returns
(%)#
Additional Benchmark
Returns (%) ##
Value of ` 10,000 invested
Scheme (`)
Benchmark (`)#
Additional Benchmark
(`)##
Jan 31, 20 Last 1 Year 8.61 11.30 5.52 10,859 11,127 10,551Oct 31, 18 Since Inception 10.24 11.78 6.79 12,452 12,847 11,591
# CRISIL Composite Bond Fund Index ## CRISIL 1 year T-Bill Index. The Scheme is in existence for more than 1 year but less than 3 years. The scheme is managed by Mr. Anil Bamboli since inception.
HDFC FMP 1265D OCTOBER 2018 (1) NAV as on Jan 29, 2021 ` 12.4192
Date Period Scheme Returns
(%)
Benchmark Returns
(%)#
Additional Benchmark
Returns (%) ##
Value of ` 10,000 invested
Scheme (`)
Benchmark (`)#
Additional Benchmark
(`)##
Jan 31, 20 Last 1 Year 9.05 11.30 5.52 10,902 11,127 10,551nov 01, 18 Since Inception 10.12 11.74 6.78 12,419 12,831 11,587
# CRISIL Composite Bond Fund Index ## CRISIL 1 year T-Bill Index. The Scheme is in existence for more than 1 year but less than 3 years. The scheme is managed by Mr. Anil Bamboli since inception.
HDFC FMP 1246D NOVEMBER 2018 (1) NAV as on Jan 29, 2021 ` 12.3514
Date Period Scheme Returns
(%)
Benchmark Returns
(%)#
Additional Benchmark
Returns (%) ##
Value of ` 10,000 invested
Scheme (`)
Benchmark (`)#
Additional Benchmark
(`)##
Jan 31, 20 Last 1 Year 9.03 11.30 5.52 10,901 11,127 10,551nov 20, 18 Since Inception 10.10 11.65 6.66 12,351 12,736 11,519
# CRISIL Composite Bond Fund Index ## CRISIL 1 year T-Bill Index. The Scheme is in existence for more than 1 year but less than 3 years. The scheme is managed by Mr. Anil Bamboli since inception.

70 January 2021
SCHEME PERFORMANCE - REGULAR PLAN - GROWTH OPTION (FUND MANAGER-WISE)
ANIL BAMBOLI....CONTINUED
Past performance may or may not be sustained in the future. Returns greater than 1 year period are compounded annualized (CAGR). Different plans viz. Regular Plan and Direct Plan have a different expense structure. The expenses of the Direct Plan under the Scheme will be lower to the extent of the distribution expenses / commission charged in the Regular Plan. Load is not taken into consideration for computation of performance. n.A.: not Available
Performance of close-ended schemes, being close-ended in nature, is not strictly comparable with that of open-ended schemes since the investment strategy for close-ended schemes is primarily buy-and-hold whereas open-ended schemes are actively managed.
HDFC FMP 1232D NOVEMBER 2018 (1) NAV as on Jan 29, 2021 ` 12.3325
Date Period Scheme Returns
(%)
Benchmark Returns
(%)#
Additional Benchmark
Returns (%) ##
Value of ` 10,000 invested
Scheme (`)
Benchmark (`)#
Additional Benchmark
(`)##
Jan 31, 20 Last 1 Year 9.05 11.30 5.52 10,903 11,127 10,551nov 28, 18 Since Inception 10.13 11.44 6.64 12,333 12,654 11,499
# CRISIL Composite Bond Fund Index ## CRISIL 1 year T-Bill Index. The Scheme is in existence for more than 1 year but less than 3 years. The scheme is managed by Mr. Anil Bamboli since inception.
HDFC FMP 1224D DECEMBER 2018 (1) NAV as on Jan 29, 2021 ` 12.2185
Date Period Scheme Returns
(%)
Benchmark Returns
(%)#
Additional Benchmark
Returns (%) ##
Value of ` 10,000 invested
Scheme (`)
Benchmark (`)#
Additional Benchmark
(`)##
Jan 31, 20 Last 1 Year 8.97 11.30 5.52 10,895 11,127 10,551Dec 06, 18 Since Inception 9.76 10.99 6.58 12,219 12,513 11,468
# CRISIL Composite Bond Fund Index ## CRISIL 1 year T-Bill Index. The Scheme is in existence for more than 1 year but less than 3 years. The scheme is managed by Mr. Anil Bamboli since inception.
HDFC FMP 1218D DECEMBER 2018 (1) NAV as on Jan 29, 2021 ` 12.2389
Date Period Scheme Returns
(%)
Benchmark Returns
(%)#
Additional Benchmark
Returns (%) ##
Value of ` 10,000 invested
Scheme (`)
Benchmark (`)#
Additional Benchmark
(`)##
Jan 31, 20 Last 1 Year 9.02 11.30 5.52 10,899 11,127 10,551Dec 12, 18 Since Inception 9.93 11.08 6.56 12,239 12,514 11,451
# CRISIL Composite Bond Fund Index ## CRISIL 1 year T-Bill Index. The Scheme is in existence for more than 1 year but less than 3 years. The scheme is managed by Mr. Anil Bamboli since inception.
HDFC FMP 1211D DECEMBER 2018 (1) NAV as on Jan 29, 2021 ` 12.1744
Date Period Scheme Returns
(%)
Benchmark Returns
(%)#
Additional Benchmark
Returns (%) ##
Value of ` 10,000 invested
Scheme (`)
Benchmark (`)#
Additional Benchmark
(`)##
Jan 31, 20 Last 1 Year 8.91 11.30 5.52 10,889 11,127 10,551Dec 19, 18 Since Inception 9.75 10.76 6.53 12,174 12,413 11,431
# CRISIL Composite Bond Fund Index ## CRISIL 1 year T-Bill Index. The Scheme is in existence for more than 1 year but less than 3 years. The scheme is managed by Mr. Anil Bamboli since inception.
HDFC FMP 1203D DECEMBER 2018 (1) NAV as on Jan 29, 2021 ` 12.1513
Date Period Scheme Returns
(%)
Benchmark Returns
(%)#
Additional Benchmark
Returns (%) ##
Value of ` 10,000 invested
Scheme (`)
Benchmark (`)#
Additional Benchmark
(`)##
Jan 31, 20 Last 1 Year 9.04 11.30 5.52 10,902 11,127 10,551Dec 27, 18 Since Inception 9.76 10.78 6.51 12,151 12,389 11,411
# CRISIL Composite Bond Fund Index ## CRISIL 1 year T-Bill Index. The Scheme is in existence for more than 1 year but less than 3 years. The scheme is managed by Mr. Anil Bamboli since inception.
HDFC FMP 1196D DECEMBER 2018 (1) NAV as on Jan 29, 2021 ` 12.1289
Date Period Scheme Returns
(%)
Benchmark Returns
(%)#
Additional Benchmark
Returns (%) ##
Value of ` 10,000 invested
Scheme (`)
Benchmark (`)#
Additional Benchmark
(`)##
Jan 31, 20 Last 1 Year 9.07 11.30 5.52 10,905 11,127 10,551Jan 03, 19 Since Inception 9.75 11.09 6.50 12,129 12,438 11,396
# CRISIL Composite Bond Fund Index ## CRISIL 1 year T-Bill Index. The Scheme is in existence for more than 1 year but less than 3 years. The scheme is managed by Mr. Anil Bamboli since inception.
HDFC FMP 1190D JANUARY 2019 (1) NAV as on Jan 29, 2021 ` 12.1144
Date Period Scheme Returns
(%)
Benchmark Returns
(%)#
Additional Benchmark
Returns (%) ##
Value of ` 10,000 invested
Scheme (`)
Benchmark (`)#
Additional Benchmark
(`)##
Jan 31, 20 Last 1 Year 9.15 11.30 5.52 10,912 11,127 10,551Jan 09, 19 Since Inception 9.77 11.09 6.48 12,114 12,415 11,380
# CRISIL Composite Bond Fund Index ## CRISIL 1 year T-Bill Index. The Scheme is in existence for more than 1 year but less than 3 years. The scheme is managed by Mr. Anil Bamboli since inception.
HDFC FMP 1182D JANUARY 2019 (1) NAV as on Jan 29, 2021 ` 12.0942
Date Period Scheme Returns
(%)
Benchmark Returns
(%)#
Additional Benchmark
Returns (%) ##
Value of ` 10,000 invested
Scheme (`)
Benchmark (`)#
Additional Benchmark
(`)##
Jan 31, 20 Last 1 Year 9.19 11.30 5.52 10,916 11,127 10,551Jan 17, 19 Since Inception 9.79 11.23 6.45 12,094 12,420 11,356
# CRISIL Composite Bond Fund Index ## CRISIL 1 year T-Bill Index. The Scheme is in existence for more than 1 year but less than 3 years. The scheme is managed by Mr. Anil Bamboli since inception.
HDFC FMP 1175D JANUARY 2019 (1) NAV as on Jan 29, 2021 ` 12.0571
Date Period Scheme Returns
(%)
Benchmark Returns
(%)#
Additional Benchmark
Returns (%) ##
Value of ` 10,000 invested
Scheme (`)
Benchmark (`)#
Additional Benchmark
(`)##
Jan 31, 20 Last 1 Year 9.23 11.30 5.52 10,921 11,127 10,551Jan 23, 19 Since Inception 9.71 11.40 6.44 12,057 12,435 11,344
# CRISIL Composite Bond Fund Index ## CRISIL 1 year T-Bill Index. The Scheme is in existence for more than 1 year but less than 3 years. The scheme is managed by Mr. Anil Bamboli since inception.
HDFC FMP 1168D JANUARY 2019 (1) NAV as on Jan 29, 2021 ` 12.0430
Date Period Scheme Returns
(%)
Benchmark Returns
(%)#
Additional Benchmark
Returns (%) ##
Value of ` 10,000 invested
Scheme (`)
Benchmark (`)#
Additional Benchmark
(`)##
Jan 31, 20 Last 1 Year 9.14 11.30 5.52 10,911 11,127 10,551Jan 30, 19 Since Inception 9.74 11.41 6.42 12,043 12,411 11,325
# CRISIL Composite Bond Fund Index ## CRISIL 1 year T-Bill Index. The Scheme is in existence for more than 1 year but less than 3 years. The scheme is managed by Mr. Anil Bamboli since inception.
HDFC FMP 1154D FEBRUARY 2019 (1) NAV as on Jan 29, 2021 ` 11.9663
Date Period Scheme Returns
(%)
Benchmark Returns
(%)#
Additional Benchmark
Returns (%) ##
Value of ` 10,000 invested
Scheme (`)
Benchmark (`)#
Additional Benchmark
(`)##
Jan 31, 20 Last 1 Year 9.10 11.30 5.52 10,908 11,127 10,551Feb 13, 19 Since Inception 9.58 11.36 6.27 11,966 12,351 11,267
# CRISIL Composite Bond Fund Index ## CRISIL 1 year T-Bill Index. The Scheme is in existence for more than 1 year but less than 3 years. The scheme is managed by Mr. Anil Bamboli since inception.
HDFC FMP 1146D FEBRUARY 2019 (1) NAV as on Jan 29, 2021 ` 11.9673
Date Period Scheme Returns
(%)
Benchmark Returns
(%)#
Additional Benchmark
Returns (%) ##
Value of ` 10,000 invested
Scheme (`)
Benchmark (`)#
Additional Benchmark
(`)##
Jan 31, 20 Last 1 Year 9.10 11.30 5.52 10,907 11,127 10,551Feb 21, 19 Since Inception 9.70 11.61 6.27 11,967 12,375 11,252
# CRISIL Composite Bond Fund Index ## CRISIL 1 year T-Bill Index. The Scheme is in existence for more than 1 year but less than 3 years. The scheme is managed by Mr. Anil Bamboli since inception.
ANUPAM JOSHI
HDFC FMP 1158D FEBRUARY 2018 (1) NAV as on Jan 29, 2021 ` 12.4678
Date Period Scheme Returns
(%)
Benchmark Returns
(%)#
Additional Benchmark
Returns (%) ##
Value of ` 10,000 invested
Scheme (`)
Benchmark (`)#
Additional Benchmark
(`)##
Jan 31, 20 Last 1 Year 6.39 11.30 5.52 10,637 11,127 10,551Feb 27, 18 Since Inception 7.84 10.13 6.69 12,468 13,258 12,085
# CRISIL Composite Bond Fund Index ## CRISIL 1 year T-Bill Index. The Scheme is in existence for more than 1 year but less than 3 years. The scheme is managed by Mr. Anupam Joshi since inception.
HDFC FMP 1150D MARCH 2018 (1) NAV as on Jan 29, 2021 ` 12.3831
Date Period Scheme Returns
(%)
Benchmark Returns
(%)#
Additional Benchmark
Returns (%) ##
Value of ` 10,000 invested
Scheme (`)
Benchmark (`)#
Additional Benchmark
(`)##
Jan 31, 20 Last 1 Year 6.19 11.30 5.52 10,617 11,127 10,551Mar 07, 18 Since Inception 7.65 10.15 6.70 12,383 13,239 12,069
# CRISIL Composite Bond Fund Index ## CRISIL 1 year T-Bill Index. The Scheme is in existence for more than 1 year but less than 3 years. The scheme is managed by Mr. Anupam Joshi since inception.

January 2021 71
SCHEME PERFORMANCE - REGULAR PLAN - GROWTH OPTION (FUND MANAGER-WISE)
Past performance may or may not be sustained in the future. Returns greater than 1 year period are compounded annualized (CAGR). Different plans viz. Regular Plan and Direct Plan have a different expense structure. The expenses of the Direct Plan under the Scheme will be lower to the extent of the distribution expenses / commission charged in the Regular Plan. Load is not taken into consideration for computation of performance. n.A.: not Available
Performance of close-ended schemes, being close-ended in nature, is not strictly comparable with that of open-ended schemes since the investment strategy for close-ended schemes is primarily buy-and-hold whereas open-ended schemes are actively managed.
ANUPAM JOSHI....CONTINUED
HDFC FMP 1208D MARCH 2018 (1) NAV as on Jan 29, 2021 ` 12.5981
Date Period Scheme Returns
(%)
Benchmark Returns
(%)#
Additional Benchmark
Returns (%) ##
Value of ` 10,000 invested
Scheme (`)
Benchmark (`)#
Additional Benchmark
(`)##
Jan 31, 20 Last 1 Year 10.90 11.30 5.52 11,087 11,127 10,551Mar 16, 18 Since Inception 8.36 9.96 6.65 12,598 13,142 12,036
# CRISIL Composite Bond Fund Index ## CRISIL 1 year T-Bill Index. The Scheme is in existence for more than 1 year but less than 3 years. The scheme is managed by Mr. Anupam Joshi since inception.
HDFC FMP 1143D MARCH 2018 (1) NAV as on Jan 29, 2021 ` 12.3960
Date Period Scheme Returns
(%)
Benchmark Returns
(%)#
Additional Benchmark
Returns (%) ##
Value of ` 10,000 invested
Scheme (`)
Benchmark (`)#
Additional Benchmark
(`)##
Jan 31, 20 Last 1 Year 6.59 11.30 5.52 10,657 11,127 10,551Mar 13, 18 Since Inception 7.73 10.10 6.67 12,396 13,198 12,047
# CRISIL Composite Bond Fund Index ## CRISIL 1 year T-Bill Index. The Scheme is in existence for more than 1 year but less than 3 years. The scheme is managed by Mr. Anupam Joshi since inception.
HDFC FMP 1147D MARCH 2018 (1) NAV as on Jan 29, 2021 ` 12.3673
Date Period Scheme Returns
(%)
Benchmark Returns
(%)#
Additional Benchmark
Returns (%) ##
Value of ` 10,000 invested
Scheme (`)
Benchmark (`)#
Additional Benchmark
(`)##
Jan 31, 20 Last 1 Year 6.63 11.30 5.52 10,662 11,127 10,551Mar 22, 18 Since Inception 7.71 9.99 6.66 12,367 13,130 12,024
# CRISIL Composite Bond Fund Index ## CRISIL 1 year T-Bill Index. The Scheme is in existence for more than 1 year but less than 3 years. The scheme is managed by Mr. Anupam Joshi since inception.
HDFC FMP 1145D MARCH 2018 (1) NAV as on Jan 29, 2021 ` 12.3547
Date Period Scheme Returns
(%)
Benchmark Returns
(%)#
Additional Benchmark
Returns (%) ##
Value of ` 10,000 invested
Scheme (`)
Benchmark (`)#
Additional Benchmark
(`)##
Jan 31, 20 Last 1 Year 6.60 11.30 5.52 10,658 11,127 10,551Mar 23, 18 Since Inception 7.68 9.96 6.66 12,355 13,118 12,022
# CRISIL Composite Bond Fund Index ## CRISIL 1 year T-Bill Index. The Scheme is in existence for more than 1 year but less than 3 years. The scheme is managed by Mr. Anupam Joshi since inception.
HDFC FMP 1177D MARCH 2018 (1) NAV as on Jan 29, 2021 ` 12.5109
Date Period Scheme Returns
(%)
Benchmark Returns
(%)#
Additional Benchmark
Returns (%) ##
Value of ` 10,000 invested
Scheme (`)
Benchmark (`)#
Additional Benchmark
(`)##
Jan 31, 20 Last 1 Year 10.89 11.30 5.52 11,086 11,127 10,551Mar 28, 18 Since Inception 8.20 9.67 6.60 12,511 13,003 11,993
# CRISIL Composite Bond Fund Index ## CRISIL 1 year T-Bill Index. The Scheme is in existence for more than 1 year but less than 3 years. The scheme is managed by Mr. Anupam Joshi since inception.
HDFC FMP 1183D APRIL 2018 (1) NAV as on Jan 29, 2021 ` 12.3011
Date Period Scheme Returns
(%)
Benchmark Returns
(%)#
Additional Benchmark
Returns (%) ##
Value of ` 10,000 invested
Scheme (`)
Benchmark (`)#
Additional Benchmark
(`)##
Jan 31, 20 Last 1 Year 6.66 11.30 5.52 10,664 11,127 10,551Apr 17, 18 Since Inception 7.71 9.87 6.61 12,301 13,004 11,955
# CRISIL Composite Bond Fund Index ## CRISIL 1 year T-Bill Index. The Scheme is in existence for more than 1 year but less than 3 years. The scheme is managed by Mr. Anupam Joshi since inception.
HDFC FMP 1141D AUGUST 2018 (1) NAV as on Jan 29, 2021 ` 12.3062
Date Period Scheme Returns
(%)
Benchmark Returns
(%)#
Additional Benchmark
Returns (%) ##
Value of ` 10,000 invested
Scheme (`)
Benchmark (`)#
Additional Benchmark
(`)##
Jan 31, 20 Last 1 Year 11.14 11.30 5.52 11,110 11,127 10,551Aug 14, 18 Since Inception 8.79 11.03 6.86 12,306 12,940 11,776
# CRISIL Composite Bond Fund Index ## CRISIL 1 year T-Bill Index. The Scheme is in existence for more than 1 year but less than 3 years. The scheme is managed by Mr. Anupam Joshi since inception.
HDFC FMP 1105D AUGUST 2018 (1) NAV as on Jan 29, 2021 ` 12.3289
Date Period Scheme Returns
(%)
Benchmark Returns
(%)#
Additional Benchmark
Returns (%) ##
Value of ` 10,000 invested
Scheme (`)
Benchmark (`)#
Additional Benchmark
(`)##
Jan 31, 20 Last 1 Year 7.70 11.30 5.52 10,768 11,127 10,551Aug 08, 18 Since Inception 8.81 10.97 6.85 12,329 12,945 11,786
# CRISIL Composite Bond Fund Index ## CRISIL 1 year T-Bill Index. The Scheme is in existence for more than 1 year but less than 3 years. The scheme is managed by Mr. Anupam Joshi since inception.
HDFC FMP 1113D AUGUST 2018 (1) NAV as on Jan 29, 2021 ` 12.3225
Date Period Scheme Returns
(%)
Benchmark Returns
(%)#
Additional Benchmark
Returns (%) ##
Value of ` 10,000 invested
Scheme (`)
Benchmark (`)#
Additional Benchmark
(`)##
Jan 31, 20 Last 1 Year 8.94 11.30 5.52 10,892 11,127 10,551Aug 14, 18 Since Inception 8.85 11.03 6.86 12,323 12,940 11,776
# CRISIL Composite Bond Fund Index ## CRISIL 1 year T-Bill Index. The Scheme is in existence for more than 1 year but less than 3 years. The scheme is managed by Mr. Anupam Joshi since inception.
HDFC FMP 1105D AUGUST 2018 (2) NAV as on Jan 29, 2021 ` 12.2722
Date Period Scheme Returns
(%)
Benchmark Returns
(%)#
Additional Benchmark
Returns (%) ##
Value of ` 10,000 invested
Scheme (`)
Benchmark (`)#
Additional Benchmark
(`)##
Jan 31, 20 Last 1 Year 7.32 11.30 5.52 10,730 11,127 10,551Aug 29, 18 Since Inception 8.82 11.27 6.87 12,272 12,951 11,745
# CRISIL Composite Bond Fund Index ## CRISIL 1 year T-Bill Index. The Scheme is in existence for more than 1 year but less than 3 years. The scheme is managed by Mr. Anupam Joshi since inception.
HDFC FMP 1122D AUGUST 2018 (1) NAV as on Jan 29, 2021 ` 12.2548
Date Period Scheme Returns
(%)
Benchmark Returns
(%)#
Additional Benchmark
Returns (%) ##
Value of ` 10,000 invested
Scheme (`)
Benchmark (`)#
Additional Benchmark
(`)##
Jan 31, 20 Last 1 Year 7.22 11.30 5.52 10,720 11,127 10,551Sep 05, 18 Since Inception 8.83 11.65 6.88 12,255 13,031 11,734
# CRISIL Composite Bond Fund Index ## CRISIL 1 year T-Bill Index. The Scheme is in existence for more than 1 year but less than 3 years. The scheme is managed by Mr. Anupam Joshi since inception.
HDFC FMP 1487D AUGUST 2018 (1) NAV as on Jan 29, 2021 ` 12.4628
Date Period Scheme Returns
(%)
Benchmark Returns
(%)#
Additional Benchmark
Returns (%) ##
Value of ` 10,000 invested
Scheme (`)
Benchmark (`)#
Additional Benchmark
(`)##
Jan 31, 20 Last 1 Year 11.55 11.30 5.52 11,152 11,127 10,551Sep 04, 18 Since Inception 9.58 11.60 6.88 12,463 13,022 11,735
# CRISIL Composite Bond Fund Index ## CRISIL 1 year T-Bill Index. The Scheme is in existence for more than 1 year but less than 3 years. The scheme is managed by Mr. Anupam Joshi since inception.
HDFC FMP 1115D SEPTEMBER 2018 (1) NAV as on Jan 29, 2021 ` 12.3274
Date Period Scheme Returns
(%)
Benchmark Returns
(%)#
Additional Benchmark
Returns (%) ##
Value of ` 10,000 invested
Scheme (`)
Benchmark (`)#
Additional Benchmark
(`)##
Jan 31, 20 Last 1 Year 7.43 11.30 5.52 10,741 11,127 10,551Sep 12, 18 Since Inception 9.18 11.85 6.98 12,327 13,060 11,744
# CRISIL Composite Bond Fund Index ## CRISIL 1 year T-Bill Index. The Scheme is in existence for more than 1 year but less than 3 years. The scheme is managed by Mr. Anupam Joshi since inception.
HDFC FMP 1381D SEPTEMBER 2018 (1) NAV as on Jan 29, 2021 ` 12.6355
Date Period Scheme Returns
(%)
Benchmark Returns
(%)#
Additional Benchmark
Returns (%) ##
Value of ` 10,000 invested
Scheme (`)
Benchmark (`)#
Additional Benchmark
(`)##
Jan 31, 20 Last 1 Year 9.21 11.30 5.52 10,918 11,127 10,551Sep 19, 18 Since Inception 10.40 11.80 6.97 12,636 13,018 11,727
# CRISIL Composite Bond Fund Index ## CRISIL 1 year T-Bill Index. The Scheme is in existence for more than 1 year but less than 3 years. The scheme is managed by Mr. Anupam Joshi since inception.

72 January 2021
ANUPAM JOSHI....CONTINUED
SCHEME PERFORMANCE - REGULAR PLAN - GROWTH OPTION (FUND MANAGER-WISE)
Past performance may or may not be sustained in the future. Returns greater than 1 year period are compounded annualized (CAGR). Different plans viz. Regular Plan and Direct Plan have a different expense structure. The expenses of the Direct Plan under the Scheme will be lower to the extent of the distribution expenses / commission charged in the Regular Plan. Load is not taken into consideration for computation of performance. n.A.: not Available
Performance of close-ended Scheme is not strictly comparable with that of open-ended schemes since the investment strategy for close-ended schemes is primarily buy and hold whereas open ended schemes are actively managed.
HDFC FMP 1372D SEPTEMBER 2018 (1) NAV as on Jan 29, 2021 ` 12.5897
Date Period Scheme Returns
(%)
Benchmark Returns
(%)#
Additional Benchmark
Returns (%) ##
Value of ` 10,000 invested
Scheme (`)
Benchmark (`)#
Additional Benchmark
(`)##
Jan 31, 20 Last 1 Year 9.05 11.30 5.52 10,902 11,127 10,551Sep 28, 18 Since Inception 10.34 11.91 6.96 12,590 13,013 11,705
# CRISIL Composite Bond Fund Index ## CRISIL 1 year T-Bill Index. The Scheme is in existence for more than 1 year but less than 3 years. The scheme is managed by Mr. Anupam Joshi since inception.
AMIT B. GANATRA
HDFC EOF - II - 1126D MAY 2017 (1) NAV as on Jan 29, 2021 ` 10.6700
Date Period Scheme Returns
(%)
Benchmark Returns
(%)#
Additional Benchmark
Returns (%) ##
Value of ` 10,000 invested
Scheme (`)
Benchmark (`)#
Additional Benchmark
(`)##
Jan 31, 20 Last 1 Year 4.41 15.22 15.05 10,440 11,518 11,500Jan 31, 18 Last 3 Years -0.36 8.70 10.08 9,892 12,841 13,336Jun 15, 17 Since Inception 1.80 11.60 12.94 10,670 14,890 15,551
# nIFTY 50 (Total Returns Index) ## S&P BSE SEnSEx (Total Returns Index). The Scheme is in existence for more than 1 year but less than 5 years. The scheme is managed by Mr. Amit B. Ganatra from May 21, 2020.
HDFC EOF - II - 1100D JUNE 2017 (1) NAV as on Jan 29, 2021 ` 10.1280
Date Period Scheme Returns
(%)
Benchmark Returns
(%)#
Additional Benchmark
Returns (%) ##
Value of ` 10,000 invested
Scheme (`)
Benchmark (`)#
Additional Benchmark
(`)##
Jan 31, 20 Last 1 Year 1.06 15.22 15.05 10,105 11,518 11,500Jan 31, 18 Last 3 Years -0.87 8.70 10.08 9,742 12,841 13,336Jul 17, 17 Since Inception 0.36 10.71 12.15 10,128 14,336 15,008
# nIFTY 50 (Total Returns Index) ## S&P BSE SEnSEx (Total Returns Index). The Scheme is in existence for more than 1 year but less than 5 years. The scheme is managed by Mr. Amit B. Ganatra from May 21, 2020.
CO-MANAGED BY ANIL BAMBOLI & AMIT B. GANATRA
HDFC DYNAMIC PE RATIO FUND OF FUNDS NAV as on Jan 29, 2021 ` 21.7768
Date Period Scheme Returns
(%)
Benchmark Returns
(%)#
Additional Benchmark
Returns (%) ##
Value of ` 10,000 invested
Scheme (`)
Benchmark (`)#
Additional Benchmark
(`)##
Jan 31, 20 Last 1 Year 13.87 16.00 15.22 11,383 11,596 11,518Jan 31, 18 Last 3 Years 5.49 9.84 8.70 11,737 13,247 12,841Jan 29, 16 Last 5 Years 11.16 12.75 13.94 16,982 18,232 19,214Feb 06, 12 Since Inception 9.05 11.51 12.33 21,777 26,629 28,419
# nIFTY 50 Hybrid Composite Debt 65:35 Index ## nIFTY 50 (Total Returns Index). Scheme performance may not strictly be comparable with that of its Additional Benchmark in view of hybrid nature of the scheme where a portion of scheme’s investments are made in equity instruments. The scheme is co-managed by Mr. Amit B. Ganatra from May 21, 2020 & Mr. Anil Bamboli from June 28, 2014.

January 2021 73
SCHEME PERFORMANCE - DIRECT PLAN - GROWTH OPTION (FUND MANAGER-WISE)
PRASHANT JAIN
HDFC FLExI CAP FUND (ERSTWHILE HDFC EqUITY FUND) €
NAV as on Jan 29, 2021 ` 763.468
Date Period Scheme Returns
(%)
Benchmark Returns
(%)#
Additional Benchmark
Returns (%) ##
Value of ` 10,000 invested Scheme
(`)Benchmark
(`)#Additional
Benchmark (`)##
Jan 31, 20 Last 1 Year 9.62 15.82 15.22 10,959 11,578 11,518Jan 31, 18 Last 3 Years 2.96 6.49 8.70 10,913 12,073 12,841Jan 29, 16 Last 5 Years 12.93 13.61 13.94 18,383 18,938 19,214Jan 01, 13 Since Inception 12.40 12.50 12.16 25,717 25,898 25,286
# nIFTY 500 (Total Returns Index) ## nIFTY 50 (Total Returns Index). € HDFC Equity Fund has undergone changes in fundamental attributes and has been renamed as HDFC Flexi Cap Fund w.e.f. January 29, 2021.
HDFC TOP 100 FUND NAV as on Jan 29, 2021 ` 557.536
Date Period Scheme Returns
(%)
Benchmark Returns
(%)#
Additional Benchmark
Returns (%) ##
Value of ` 10,000 invested Scheme
(`)Benchmark
(`)#Additional
Benchmark (`)##
Jan 31, 20 Last 1 Year 9.47 14.92 15.05 10,944 11,487 11,500Jan 31, 18 Last 3 Years 3.84 7.78 10.08 11,195 12,519 13,336Jan 29, 16 Last 5 Years 12.84 13.85 14.65 18,303 19,139 19,826Jan 01, 13 Since Inception 11.64 12.45 12.73 24,353 25,824 26,344
# nIFTY 100 (Total Returns Index) ## S&P BSE SEnSEx (Total Returns Index).
HDFC BALANCED ADVANTAGE FUND NAV as on Jan 29, 2021 ` 227.699
Date Period Scheme Returns
(%)
Benchmark Returns
(%)#
Additional Benchmark
Returns (%) ##
Value of ` 10,000 invested Scheme
(`)Benchmark
(`)#Additional
Benchmark (`)##
Jan 31, 20 Last 1 Year 9.34 16.00 15.22 10,931 11,596 11,518Jan 31, 18 Last 3 Years 3.94 9.84 8.70 11,228 13,247 12,841Jan 29, 16 Last 5 Years 11.86 12.75 13.94 17,525 18,232 19,214Jan 01, 13 Since Inception 12.31 11.39 12.16 25,560 23,910 25,286
# nIFTY 50 Hybrid Composite Debt 65:35 Index ## nIFTY 50 (Total Returns Index). Scheme performance may not strictly be comparable with that of its Additional Benchmark in view of balanced nature of the scheme where a portion of scheme’s investments are made in debt instruments. Refer to note on performance disclosure on Page no. 18.
CHIRAG SETALVAD
HDFC MID-CAP OPPORTUNITIES FUNDNAV as on Jan 29, 2021 ` 69.421
Date Period Scheme Returns
(%)
Benchmark Returns
(%)#
Additional Benchmark
Returns (%) ##
Value of ` 10,000 invested
Scheme (`)
Benchmark (`)#
Additional Benchmark
(`)##Jan 31, 20 Last 1 Year 16.56 17.21 15.22 11,651 11,716 11,518Jan 31, 18 Last 3 Years 4.35 1.16 8.70 11,360 10,353 12,841Jan 29, 16 Last 5 Years 13.71 12.06 13.94 19,021 17,684 19,214Jan 01, 13 Since Inception 17.54 12.88 12.16 36,928 26,626 25,286
# nIFTY Midcap 100 (Total Returns Index) ## nIFTY 50 (Total Returns Index).
HDFC SMALL CAP FUND NAV as on Jan 29, 2021 ` 50.631
Date Period Scheme Returns
(%)
Benchmark Returns
(%)#
Additional Benchmark
Returns (%) ##
Value of ` 10,000 invested
Scheme (`)
Benchmark (`)#
Additional Benchmark
(`)##Jan 31, 20 Last 1 Year 16.53 16.54 15.22 11,648 11,649 11,518Jan 31, 18 Last 3 Years 1.70 -5.63 8.70 10,518 8,405 12,841Jan 29, 16 Last 5 Years 14.36 8.45 13.94 19,574 15,010 19,214Jan 01, 13 Since Inception 15.40 9.51 12.16 31,825 20,832 25,286
# nIFTY Smallcap 100 (Total Returns Index) ## nIFTY 50 (Total Returns Index).
HDFC HYBRID EqUITY FUND NAV as on Jan 29, 2021 ` 65.752
Date Period Scheme Returns
(%)
Benchmark Returns
(%)#
Additional Benchmark
Returns (%) ##
Value of ` 10,000 invested Scheme
(`)Benchmark
(`)#Additional
Benchmark (`)##
Jan 31, 20 Last 1 Year 13.73 16.00 15.22 11,369 11,596 11,518Jan 31, 18 Last 3 Years 6.16 9.84 8.70 11,962 13,247 12,841Jan 29, 16 Last 5 Years 12.64 12.75 13.94 18,145 18,232 19,214Jan 01, 13 Since Inception 14.47 11.39 12.16 29,817 23,910 25,286
# nIFTY 50 Hybrid Composite Debt 65:35 Index ## nIFTY 50 (Total Returns Index). Refer to note on performance disclosure on Page no. 20.
HDFC CHILDREN’S GIFT FUND NAV as on Jan 29, 2021 ` 154.346
Date Period Scheme Returns
(%)
Benchmark Returns
(%)#
Additional Benchmark
Returns (%) ##
Value of ` 10,000 invested
Scheme (`)
Benchmark (`)#
Additional Benchmark
(`)##
Jan 31, 20 Last 1 Year 15.63 16.00 15.22 11,558 11,596 11,518Jan 31, 18 Last 3 Years 7.74 9.84 8.70 12,505 13,247 12,841Jan 29, 16 Last 5 Years 13.48 12.75 13.94 18,832 18,232 19,214Jan 01, 13 Since Inception 14.73 11.39 12.16 30,352 23,910 25,286
# nIFTY 50 Hybrid Composite Debt 65:35 Index ## nIFTY 50 (Total Returns Index). Scheme performance may not strictly be comparable with that of its Additional Benchmark in view of balanced nature of the scheme where a portion of scheme’s investments are made in debt instruments.
HDFC LONG TERM ADVANTAGE FUND NAV as on Jan 29, 2021 ` 433.901
Date Period Scheme Returns
(%)
Benchmark Returns
(%)#
Additional Benchmark
Returns (%) ##
Value of ` 10,000 invested
Scheme (`)
Benchmark (`)#
Additional Benchmark
(`)##
Jan 31, 20 Last 1 Year 12.21 15.05 15.22 11,217 11,500 11,518Jan 31, 18 Last 3 Years 5.27 10.08 8.70 11,664 13,336 12,841Jan 29, 16 Last 5 Years 14.44 14.65 13.94 19,641 19,826 19,214Jan 01, 13 Since Inception 14.22 12.73 12.16 29,283 26,344 25,286
# S&P BSE SEnSEx (Total Returns Index) ## nIFTY 50 (Total Returns Index).
SHOBHIT MEHROTRA
HDFC INCOME FUND NAV as on Jan 29, 2021 ` 49.6753
Date Period Scheme Returns
(%)
Benchmark Returns
(%)#
Additional Benchmark
Returns (%) ##
Value of ` 10,000 invested
Scheme (`)
Benchmark (`)#
Additional Benchmark
(`)##
Jan 31, 20 Last 1 Year 9.47 12.13 9.14 10,944 11,209 10,911Jan 31, 18 Last 3 Years 7.95 9.57 9.04 12,576 13,153 12,963Jan 29, 16 Last 5 Years 8.08 8.90 7.93 14,755 15,322 14,654Jan 01, 13 Since Inception 8.10 8.65 7.44 18,765 19,558 17,857
# nIFTY Medium To Long Duration Debt Index ## CRISIL 10 year Gilt Index.
HDFC MEDIUM TERM DEBT FUND NAV as on Jan 29, 2021 ` 45.5213
Date Period Scheme Returns
(%)
Benchmark Returns
(%)#
Additional Benchmark
Returns (%) ##
Value of ` 10,000 invested
Scheme (`)
Benchmark (`)#
Additional Benchmark
(`)##
Jan 31, 20 Last 1 Year 10.05 11.76 5.52 11,002 11,172 10,551Jan 31, 18 Last 3 Years 9.06 9.41 6.67 12,968 13,092 12,135Jan 29, 16 Last 5 Years 9.03 8.84 6.60 15,413 15,279 13,769Jan 01, 13 Since Inception 9.00 8.88 6.94 20,072 19,889 17,205
# nIFTY Medium Duration Debt Index ## CRISIL 1 year T-Bill Index.
HDFC CREDIT RISk DEBT FUND NAV as on Jan 29, 2021 ` 19.0237
Date Period Scheme Returns
(%)
Benchmark Returns
(%)#
Additional Benchmark
Returns (%) ##
Value of ` 10,000 invested
Scheme (`)
Benchmark (`)#
Additional Benchmark
(`)##
Jan 31, 20 Last 1 Year 10.91 10.70 9.14 11,088 11,066 10,911Jan 31, 18 Last 3 Years 8.91 9.01 9.04 12,914 12,951 12,963Jan 29, 16 Last 5 Years 9.22 8.98 7.93 15,550 15,376 14,654Mar 25, 14 Since Inception 9.84 9.41 8.64 19,024 18,520 17,648
# nIFTY Credit Risk Bond Index ## CRISIL 10 year Gilt Index. Refer to note on performance disclosure on Page no. 42.
HDFC FMP 3360D MARCH 2014 (1) NAV as on Jan 29, 2021 ` 16.8409
Date Period Scheme Returns
(%)
Benchmark Returns
(%)#
Additional Benchmark
Returns (%) ##
Value of ` 10,000 invested
Scheme (`)
Benchmark (`)#
Additional Benchmark
(`)##
Jan 31, 20 Last 1 Year 9.46 11.30 9.14 10,943 11,127 10,911Jan 31, 18 Last 3 Years 9.21 9.67 9.04 13,022 13,186 12,963Jan 29, 16 Last 5 Years 9.42 9.12 7.93 15,692 15,477 14,654Mar 26, 14 Since Inception 7.90 9.69 8.63 16,841 18,850 17,638
# CRISIL Composite Bond Fund Index ## CRISIL 10 year Gilt Index. The scheme is managed by Mr. Shobhit Mehrotra since inception.
Past performance may or may not be sustained in the future. Returns greater than 1 year period are compounded annualized (CAGR). Different plans viz. Regular Plan and Direct Plan have a different expense structure. The expenses of the Direct Plan under the Scheme will be lower to the extent of the distribution expenses / commission charged in the Regular Plan. Load is not taken into consideration for computation of performance. n.A.: not Available

74 January 2021
SCHEME PERFORMANCE - DIRECT PLAN - GROWTH OPTION (FUND MANAGER-WISE)
HDFC FMP 1430D JULY 2017 (1) NAV as on Jan 29, 2021 ` 12.7875
Date Period Scheme Returns
(%)
Benchmark Returns
(%)#
Additional Benchmark
Returns (%) ##
Value of ` 10,000 invested
Scheme (`)
Benchmark (`)#
Additional Benchmark
(`)##
Jan 31, 20 Last 1 Year 6.62 11.30 5.52 10,660 11,127 10,551Jan 31, 18 Last 3 Years 7.93 9.67 6.67 12,569 13,186 12,135Aug 01, 17 Since Inception 7.28 8.14 6.51 12,788 13,148 12,470
# CRISIL Composite Bond Fund Index ## CRISIL 1 year T-Bill Index. The Scheme is in existence for more than 1 year but less than 5 years. The scheme is managed by Mr. Shobhit Mehrotra since inception.
HDFC FMP 1113D JUNE 2018 (1) NAV as on Jan 29, 2021 ` 12.5061
Date Period Scheme Returns
(%)
Benchmark Returns
(%)#
Additional Benchmark
Returns (%) ##
Value of ` 10,000 invested
Scheme (`)
Benchmark (`)#
Additional Benchmark
(`)##
Jan 31, 20 Last 1 Year 7.13 11.30 5.52 10,711 11,127 10,551Jun 14, 18 Since Inception 8.87 11.11 6.82 12,506 13,192 11,894
# CRISIL Composite Bond Fund Index ## CRISIL 1 year T-Bill Index. The Scheme is in existence for more than 1 year but less than 3 years. The scheme is managed by Mr. Shobhit Mehrotra since inception.
HDFC FMP 1124D JUNE 2018 (1) NAV as on Jan 29, 2021 ` 12.5636
Date Period Scheme Returns
(%)
Benchmark Returns
(%)#
Additional Benchmark
Returns (%) ##
Value of ` 10,000 invested
Scheme (`)
Benchmark (`)#
Additional Benchmark
(`)##
Jan 31, 20 Last 1 Year 11.37 11.30 5.52 11,134 11,127 10,551Jun 29, 18 Since Inception 9.21 11.06 6.80 12,564 13,119 11,858
# CRISIL Composite Bond Fund Index ## CRISIL 1 year T-Bill Index. The Scheme is in existence for more than 1 year but less than 3 years. The scheme is managed by Mr. Shobhit Mehrotra since inception.
HDFC FMP 1099D JUNE 2018 (1) NAV as on Jan 29, 2021 ` 12.4361
Date Period Scheme Returns
(%)
Benchmark Returns
(%)#
Additional Benchmark
Returns (%) ##
Value of ` 10,000 invested
Scheme (`)
Benchmark (`)#
Additional Benchmark
(`)##
Jan 31, 20 Last 1 Year 6.90 11.30 5.52 10,688 11,127 10,551Jun 28, 18 Since Inception 8.78 11.09 6.80 12,436 13,132 11,860
# CRISIL Composite Bond Fund Index ## CRISIL 1 year T-Bill Index. The Scheme is in existence for more than 1 year but less than 3 years. The scheme is managed by Mr. Shobhit Mehrotra since inception.
HDFC FMP 1122D JULY 2018 (1) NAV as on Jan 29, 2021 ` 12.4822
Date Period Scheme Returns
(%)
Benchmark Returns
(%)#
Additional Benchmark
Returns (%) ##
Value of ` 10,000 invested
Scheme (`)
Benchmark (`)#
Additional Benchmark
(`)##
Jan 31, 20 Last 1 Year 7.19 11.30 5.52 10,717 11,127 10,551Jul 04, 18 Since Inception 8.99 10.98 6.83 12,482 13,077 11,854
# CRISIL Composite Bond Fund Index ## CRISIL 1 year T-Bill Index. The Scheme is in existence for more than 1 year but less than 3 years. The scheme is managed by Mr. Shobhit Mehrotra since inception.
HDFC FMP 1133D JULY 2018 (1) NAV as on Jan 29, 2021 ` 12.3272
Date Period Scheme Returns
(%)
Benchmark Returns
(%)#
Additional Benchmark
Returns (%) ##
Value of ` 10,000 invested
Scheme (`)
Benchmark (`)#
Additional Benchmark
(`)##
Jan 31, 20 Last 1 Year 8.34 11.30 5.52 10,832 11,127 10,551Jul 25, 18 Since Inception 8.66 10.96 6.85 12,327 12,993 11,816
# CRISIL Composite Bond Fund Index ## CRISIL 1 year T-Bill Index. The Scheme is in existence for more than 1 year but less than 3 years. The scheme is managed by Mr. Shobhit Mehrotra since inception.
HDFC FMP 1133D FEBRUARY 2019 (1) NAV as on Jan 29, 2021 ` 12.0185
Date Period Scheme Returns
(%)
Benchmark Returns
(%)#
Additional Benchmark
Returns (%) ##
Value of ` 10,000 invested
Scheme (`)
Benchmark (`)#
Additional Benchmark
(`)##
Jan 31, 20 Last 1 Year 9.08 11.30 5.52 10,906 11,127 10,551Mar 06, 19 Since Inception 10.14 11.73 6.26 12,019 12,350 11,226
# CRISIL Composite Bond Fund Index ## CRISIL 1 year T-Bill Index. The Scheme is in existence for more than 1 year but less than 3 years. The scheme is managed by Mr. Shobhit Mehrotra since inception.
HDFC FMP 1126D MARCH 2019 (1) NAV as on Jan 29, 2021 ` 11.9858
Date Period Scheme Returns
(%)
Benchmark Returns
(%)#
Additional Benchmark
Returns (%) ##
Value of ` 10,000 invested
Scheme (`)
Benchmark (`)#
Additional Benchmark
(`)##
Jan 31, 20 Last 1 Year 9.14 11.30 5.52 10,911 11,127 10,551Mar 13, 19 Since Inception 10.09 11.59 6.24 11,986 12,296 11,209
# CRISIL Composite Bond Fund Index ## CRISIL 1 year T-Bill Index. The Scheme is in existence for more than 1 year but less than 3 years. The scheme is managed by Mr. Shobhit Mehrotra since inception.
HDFC FMP 1127D MARCH 2019 (1) NAV as on Jan 29, 2021 ` 11.9039
Date Period Scheme Returns
(%)
Benchmark Returns
(%)#
Additional Benchmark
Returns (%) ##
Value of ` 10,000 invested
Scheme (`)
Benchmark (`)#
Additional Benchmark
(`)##
Jan 31, 20 Last 1 Year 8.92 11.30 5.52 10,889 11,127 10,551Mar 19, 19 Since Inception 9.78 11.58 6.20 11,904 12,273 11,189
# CRISIL Composite Bond Fund Index ## CRISIL 1 year T-Bill Index. The Scheme is in existence for more than 1 year but less than 3 years. The scheme is managed by Mr. Shobhit Mehrotra since inception.
HDFC FMP 1120D MARCH 2019 (1) NAV as on Jan 29, 2021 ` 11.8533
Date Period Scheme Returns
(%)
Benchmark Returns
(%)#
Additional Benchmark
Returns (%) ##
Value of ` 10,000 invested
Scheme (`)
Benchmark (`)#
Additional Benchmark
(`)##
Jan 31, 20 Last 1 Year 8.89 11.30 5.52 10,886 11,127 10,551Mar 26, 19 Since Inception 9.63 11.38 6.18 11,853 12,205 11,173
# CRISIL Composite Bond Fund Index ## CRISIL 1 year T-Bill Index. The Scheme is in existence for more than 1 year but less than 3 years. The scheme is managed by Mr. Shobhit Mehrotra since inception.
HDFC FMP 1118D MARCH 2019 (1) NAV as on Jan 29, 2021 ` 11.8491
Date Period Scheme Returns
(%)
Benchmark Returns
(%)#
Additional Benchmark
Returns (%) ##
Value of ` 10,000 invested
Scheme (`)
Benchmark (`)#
Additional Benchmark
(`)##
Jan 31, 20 Last 1 Year 8.95 11.30 5.52 10,892 11,127 10,551Mar 28, 19 Since Inception 9.64 11.34 6.19 11,849 12,190 11,171
# CRISIL Composite Bond Fund Index ## CRISIL 1 year T-Bill Index. The Scheme is in existence for more than 1 year but less than 3 years. The scheme is managed by Mr. Shobhit Mehrotra since inception.
HDFC FMP 1100D APRIL 2019 (1) NAV as on Jan 29, 2021 ` 11.8412
Date Period Scheme Returns
(%)
Benchmark Returns
(%)#
Additional Benchmark
Returns (%) ##
Value of ` 10,000 invested
Scheme (`)
Benchmark (`)#
Additional Benchmark
(`)##
Jan 31, 20 Last 1 Year 9.10 11.30 5.52 10,907 11,127 10,551May 08, 19 Since Inception 10.25 11.84 6.27 11,841 12,137 11,111
# CRISIL Composite Bond Fund Index ## CRISIL 1 year T-Bill Index. The Scheme is in existence for more than 1 year but less than 3 years. The scheme is managed by Mr. Shobhit Mehrotra since inception.
ANUPAM JOSHI
HDFC CORPORATE BOND FUND NAV as on Jan 29, 2021 ` 25.1576
Date Period Scheme Returns
(%)
Benchmark Returns
(%)#
Additional Benchmark
Returns (%) ##
Value of ` 10,000 invested
Scheme (`)
Benchmark (`)#
Additional Benchmark
(`)##
Jan 31, 20 Last 1 Year 11.19 10.89 9.14 11,116 11,086 10,911Jan 31, 18 Last 3 Years 9.54 9.08 9.04 13,141 12,974 12,963Jan 29, 16 Last 5 Years 9.12 8.72 7.93 15,477 15,197 14,654Jan 01, 13 Since Inception 9.09 8.92 7.44 20,206 19,947 17,857
# nIFTY Corporate Bond Index ## CRISIL 10 year Gilt Index. Refer to note on performance disclosure on Page no. 41.
HDFC LOW DURATION FUND NAV as on Jan 29, 2021 ` 47.3552
Date Period Scheme Returns
(%)
Benchmark Returns
(%)#
Additional Benchmark
Returns (%) ##
Value of ` 10,000 invested
Scheme (`)
Benchmark (`)#
Additional Benchmark
(`)##Jan 31, 20 Last 1 Year 8.42 6.15 5.52 10,840 10,613 10,551Jan 31, 18 Last 3 Years 8.13 7.30 6.67 12,641 12,350 12,135Jan 29, 16 Last 5 Years 8.17 7.38 6.60 14,813 14,280 13,769Jan 01, 13 Since Inception 8.41 7.93 6.94 19,208 18,535 17,205
# nIFTY Low Duration Debt Index ## CRISIL 1 year T-Bill Index.
Past performance may or may not be sustained in the future. Returns greater than 1 year period are compounded annualized (CAGR). Different plans viz. Regular Plan and Direct Plan have a different expense structure. The expenses of the Direct Plan under the Scheme will be lower to the extent of the distribution expenses / commission charged in the Regular Plan. Load is not taken into consideration for computation of performance. n.A.: not Available
Performance of close-ended schemes, being close-ended in nature, is not strictly comparable with that of open-ended schemes since the investment strategy for close-ended schemes is primarily buy-and-hold whereas open-ended schemes are actively managed.
SHOBHIT MEHROTRA....CONTINUED

January 2021 75
SCHEME PERFORMANCE - DIRECT PLAN - GROWTH OPTION (FUND MANAGER-WISE)
HDFC LIqUID FUND NAV as on Jan 31, 2021 ` 4024.2206
Date Period Scheme Returns
(%)
Benchmark Returns
(%)#
Additional Benchmark
Returns (%) ##
Value of ` 10,000 invested
Scheme (`)
Benchmark (`)#
Additional Benchmark
(`)##Jan 24, 21 Last 7 days 3.43 3.52 -0.69 10,007 10,007 9,999Jan 16, 21 Last 15 days 3.24 3.41 3.40 10,013 10,014 10,014Dec 31, 20 Last 1 Month 2.79 3.23 1.58 10,024 10,027 10,013Jan 31, 20 Last 1 Year 4.01 4.40 5.53 10,402 10,441 10,555Jan 31, 18 Last 3 Years 5.94 6.24 6.66 11,890 11,994 12,137Jan 31, 16 Last 5 Years 6.40 6.57 6.59 13,643 13,752 13,766Dec 31, 12 Since Inception 7.36 7.40 6.95 17,766 17,819 17,216
Returns less than 1 year period are simple annualized. # CRISIL Liquid Fund Index ## CRISIL 1 year T-Bill Index.
HDFC FMP 1158D FEBRUARY 2018 (1) NAV as on Jan 29, 2021 ` 12.5219
Date Period Scheme Returns
(%)
Benchmark Returns
(%)#
Additional Benchmark
Returns (%) ##
Value of ` 10,000 invested
Scheme (`)
Benchmark (`)#
Additional Benchmark
(`)##Jan 31, 20 Last 1 Year 6.55 11.30 5.52 10,653 11,127 10,551Feb 27, 18 Since Inception 8.00 10.13 6.69 12,522 13,258 12,085
# CRISIL Composite Bond Fund Index ## CRISIL 1 year T-Bill Index. The Scheme is in existence for more than 1 year but less than 3 years. The scheme is managed by Mr. Anupam Joshi since inception.
HDFC FMP 1150D MARCH 2018 (1) NAV as on Jan 29, 2021 ` 12.4731
Date Period Scheme Returns
(%)
Benchmark Returns
(%)#
Additional Benchmark
Returns (%) ##
Value of ` 10,000 invested
Scheme (`)
Benchmark (`)#
Additional Benchmark
(`)##Jan 31, 20 Last 1 Year 6.45 11.30 5.52 10,643 11,127 10,551Mar 07, 18 Since Inception 7.91 10.15 6.70 12,473 13,239 12,069
# CRISIL Composite Bond Fund Index ## CRISIL 1 year T-Bill Index. The Scheme is in existence for more than 1 year but less than 3 years. The scheme is managed by Mr. Anupam Joshi since inception.
HDFC FMP 1208D MARCH 2018 (1) NAV as on Jan 29, 2021 ` 12.7074
Date Period Scheme Returns
(%)
Benchmark Returns
(%)#
Additional Benchmark
Returns (%) ##
Value of ` 10,000 invested
Scheme (`)
Benchmark (`)#
Additional Benchmark
(`)##Jan 31, 20 Last 1 Year 11.23 11.30 5.52 11,120 11,127 10,551Mar 16, 18 Since Inception 8.69 9.96 6.65 12,707 13,142 12,036
# CRISIL Composite Bond Fund Index ## CRISIL 1 year T-Bill Index. The Scheme is in existence for more than 1 year but less than 3 years. The scheme is managed by Mr. Anupam Joshi since inception.
HDFC FMP 1143D MARCH 2018 (1) NAV as on Jan 29, 2021 ` 12.4859
Date Period Scheme Returns
(%)
Benchmark Returns
(%)#
Additional Benchmark
Returns (%) ##
Value of ` 10,000 invested
Scheme (`)
Benchmark (`)#
Additional Benchmark
(`)##Jan 31, 20 Last 1 Year 6.86 11.30 5.52 10,684 11,127 10,551Mar 13, 18 Since Inception 8.00 10.10 6.67 12,486 13,198 12,047
# CRISIL Composite Bond Fund Index ## CRISIL 1 year T-Bill Index. The Scheme is in existence for more than 1 year but less than 3 years. The scheme is managed by Mr. Anupam Joshi since inception.
HDFC FMP 1147D MARCH 2018 (1) NAV as on Jan 29, 2021 ` 12.4561
Date Period Scheme Returns
(%)
Benchmark Returns
(%)#
Additional Benchmark
Returns (%) ##
Value of ` 10,000 invested
Scheme (`)
Benchmark (`)#
Additional Benchmark
(`)##Jan 31, 20 Last 1 Year 6.90 11.30 5.52 10,688 11,127 10,551Mar 22, 18 Since Inception 7.98 9.99 6.66 12,456 13,130 12,024
# CRISIL Composite Bond Fund Index ## CRISIL 1 year T-Bill Index. The Scheme is in existence for more than 1 year but less than 3 years. The scheme is managed by Mr. Anupam Joshi since inception.
HDFC FMP 1145D MARCH 2018 (1) NAV as on Jan 29, 2021 ` 12.4431
Date Period Scheme Returns
(%)
Benchmark Returns
(%)#
Additional Benchmark
Returns (%) ##
Value of ` 10,000 invested
Scheme (`)
Benchmark (`)#
Additional Benchmark
(`)##
Jan 31, 20 Last 1 Year 6.87 11.30 5.52 10,685 11,127 10,551Mar 23, 18 Since Inception 7.95 9.96 6.66 12,443 13,118 12,022
# CRISIL Composite Bond Fund Index ## CRISIL 1 year T-Bill Index. The Scheme is in existence for more than 1 year but less than 3 years. The scheme is managed by Mr. Anupam Joshi since inception.
HDFC FMP 1177D MARCH 2018 (1) NAV as on Jan 29, 2021 ` 12.6194
Date Period Scheme Returns
(%)
Benchmark Returns
(%)#
Additional Benchmark
Returns (%) ##
Value of ` 10,000 invested
Scheme (`)
Benchmark (`)#
Additional Benchmark
(`)##
Jan 31, 20 Last 1 Year 11.22 11.30 5.52 11,119 11,127 10,551Mar 28, 18 Since Inception 8.52 9.67 6.60 12,619 13,003 11,993
# CRISIL Composite Bond Fund Index ## CRISIL 1 year T-Bill Index. The Scheme is in existence for more than 1 year but less than 3 years. The scheme is managed by Mr. Anupam Joshi since inception.
HDFC FMP 1183D APRIL 2018 (1) NAV as on Jan 29, 2021 ` 12.3870
Date Period Scheme Returns
(%)
Benchmark Returns
(%)#
Additional Benchmark
Returns (%) ##
Value of ` 10,000 invested
Scheme (`)
Benchmark (`)#
Additional Benchmark
(`)##
Jan 31, 20 Last 1 Year 6.92 11.30 5.52 10,690 11,127 10,551Apr 17, 18 Since Inception 7.98 9.87 6.61 12,387 13,004 11,955
# CRISIL Composite Bond Fund Index ## CRISIL 1 year T-Bill Index. The Scheme is in existence for more than 1 year but less than 3 years. The scheme is managed by Mr. Anupam Joshi since inception.
HDFC FMP 1141D AUGUST 2018 (1) NAV as on Jan 29, 2021 ` 12.4146
Date Period Scheme Returns
(%)
Benchmark Returns
(%)#
Additional Benchmark
Returns (%) ##
Value of ` 10,000 invested
Scheme (`)
Benchmark (`)#
Additional Benchmark
(`)##
Jan 31, 20 Last 1 Year 11.16 11.30 5.52 11,113 11,127 10,551Aug 14, 18 Since Inception 9.18 11.03 6.86 12,415 12,940 11,776
# CRISIL Composite Bond Fund Index ## CRISIL 1 year T-Bill Index. The Scheme is in existence for more than 1 year but less than 3 years. The scheme is managed by Mr. Anupam Joshi since inception.
HDFC FMP 1105D AUGUST 2018 (1) NAV as on Jan 29, 2021 ` 12.4190
Date Period Scheme Returns
(%)
Benchmark Returns
(%)#
Additional Benchmark
Returns (%) ##
Value of ` 10,000 invested
Scheme (`)
Benchmark (`)#
Additional Benchmark
(`)##
Jan 31, 20 Last 1 Year 7.72 11.30 5.52 10,770 11,127 10,551Aug 08, 18 Since Inception 9.13 10.97 6.85 12,419 12,945 11,786
# CRISIL Composite Bond Fund Index ## CRISIL 1 year T-Bill Index. The Scheme is in existence for more than 1 year but less than 3 years. The scheme is managed by Mr. Anupam Joshi since inception.
HDFC FMP 1113D AUGUST 2018 (1) NAV as on Jan 29, 2021 ` 12.4119
Date Period Scheme Returns
(%)
Benchmark Returns
(%)#
Additional Benchmark
Returns (%) ##
Value of ` 10,000 invested
Scheme (`)
Benchmark (`)#
Additional Benchmark
(`)##
Jan 31, 20 Last 1 Year 8.96 11.30 5.52 10,894 11,127 10,551Aug 14, 18 Since Inception 9.17 11.03 6.86 12,412 12,940 11,776
# CRISIL Composite Bond Fund Index ## CRISIL 1 year T-Bill Index. The Scheme is in existence for more than 1 year but less than 3 years. The scheme is managed by Mr. Anupam Joshi since inception.
HDFC FMP 1105D AUGUST 2018 (2) NAV as on Jan 29, 2021 ` 12.3617
Date Period Scheme Returns
(%)
Benchmark Returns
(%)#
Additional Benchmark
Returns (%) ##
Value of ` 10,000 invested
Scheme (`)
Benchmark (`)#
Additional Benchmark
(`)##
Jan 31, 20 Last 1 Year 7.34 11.30 5.52 10,732 11,127 10,551Aug 29, 18 Since Inception 9.15 11.27 6.87 12,362 12,951 11,745
# CRISIL Composite Bond Fund Index ## CRISIL 1 year T-Bill Index. The Scheme is in existence for more than 1 year but less than 3 years. The scheme is managed by Mr. Anupam Joshi since inception.
HDFC FMP 1122D AUGUST 2018 (1) NAV as on Jan 29, 2021 ` 12.3442
Date Period Scheme Returns
(%)
Benchmark Returns
(%)#
Additional Benchmark
Returns (%) ##
Value of ` 10,000 invested
Scheme (`)
Benchmark (`)#
Additional Benchmark
(`)##
Jan 31, 20 Last 1 Year 7.24 11.30 5.52 10,722 11,127 10,551Sep 05, 18 Since Inception 9.16 11.65 6.88 12,344 13,031 11,734
# CRISIL Composite Bond Fund Index ## CRISIL 1 year T-Bill Index. The Scheme is in existence for more than 1 year but less than 3 years. The scheme is managed by Mr. Anupam Joshi since inception.
Past performance may or may not be sustained in the future. Returns greater than 1 year period are compounded annualized (CAGR). Different plans viz. Regular Plan and Direct Plan have a different expense structure. The expenses of the Direct Plan under the Scheme will be lower to the extent of the distribution expenses / commission charged in the Regular Plan. Load is not taken into consideration for computation of performance. n.A.: not Available
Performance of close-ended schemes, being close-ended in nature, is not strictly comparable with that of open-ended schemes since the investment strategy for close-ended schemes is primarily buy-and-hold whereas open-ended schemes are actively managed.
ANUPAM JOSHI....CONTINUED

76 January 2021
SCHEME PERFORMANCE - DIRECT PLAN - GROWTH OPTION (FUND MANAGER-WISE)
HDFC FMP 1487D AUGUST 2018 (1) NAV as on Jan 29, 2021 ` 12.6342
Date Period Scheme Returns
(%)
Benchmark Returns
(%)#
Additional Benchmark
Returns (%) ##
Value of ` 10,000 invested
Scheme (`)
Benchmark (`)#
Additional Benchmark
(`)##
Jan 31, 20 Last 1 Year 11.62 11.30 5.52 11,159 11,127 10,551Sep 04, 18 Since Inception 10.21 11.60 6.88 12,634 13,022 11,735
# CRISIL Composite Bond Fund Index ## CRISIL 1 year T-Bill Index. The Scheme is in existence for more than 1 year but less than 3 years. The scheme is managed by Mr. Anupam Joshi since inception.
HDFC FMP 1115D SEPTEMBER 2018 (1) NAV as on Jan 29, 2021 ` 12.4175
Date Period Scheme Returns
(%)
Benchmark Returns
(%)#
Additional Benchmark
Returns (%) ##
Value of ` 10,000 invested
Scheme (`)
Benchmark (`)#
Additional Benchmark
(`)##
Jan 31, 20 Last 1 Year 7.45 11.30 5.52 10,743 11,127 10,551Sep 12, 18 Since Inception 9.51 11.85 6.98 12,418 13,060 11,744
# CRISIL Composite Bond Fund Index ## CRISIL 1 year T-Bill Index. The Scheme is in existence for more than 1 year but less than 3 years. The scheme is managed by Mr. Anupam Joshi since inception.
HDFC FMP 1381D SEPTEMBER 2018 (1) NAV as on Jan 29, 2021 ` 12.7531
Date Period Scheme Returns
(%)
Benchmark Returns
(%)#
Additional Benchmark
Returns (%) ##
Value of ` 10,000 invested
Scheme (`)
Benchmark (`)#
Additional Benchmark
(`)##
Jan 31, 20 Last 1 Year 9.23 11.30 5.52 10,920 11,127 10,551Sep 19, 18 Since Inception 10.83 11.80 6.97 12,753 13,018 11,727
# CRISIL Composite Bond Fund Index ## CRISIL 1 year T-Bill Index. The Scheme is in existence for more than 1 year but less than 3 years. The scheme is managed by Mr. Anupam Joshi since inception.
HDFC FMP 1372D SEPTEMBER 2018 (1) NAV as on Jan 29, 2021 ` 12.6878
Date Period Scheme Returns
(%)
Benchmark Returns
(%)#
Additional Benchmark
Returns (%) ##
Value of ` 10,000 invested
Scheme (`)
Benchmark (`)#
Additional Benchmark
(`)##
Jan 31, 20 Last 1 Year 9.07 11.30 5.52 10,904 11,127 10,551Sep 28, 18 Since Inception 10.71 11.91 6.96 12,688 13,013 11,705
# CRISIL Composite Bond Fund Index ## CRISIL 1 year T-Bill Index. The Scheme is in existence for more than 1 year but less than 3 years. The scheme is managed by Mr. Anupam Joshi since inception.
ANIL BAMBOLI
HDFC DYNAMIC DEBT FUND NAV as on Jan 29, 2021 ` 72.3014
Date Period Scheme Returns
(%)
Benchmark Returns
(%)#
Additional Benchmark
Returns (%) ##
Value of ` 10,000 invested
Scheme (`)
Benchmark (`)#
Additional Benchmark
(`)##
Jan 31, 20 Last 1 Year 9.11 11.40 9.14 10,909 11,137 10,911Jan 31, 18 Last 3 Years 6.16 9.52 9.04 11,963 13,132 12,963Jan 29, 16 Last 5 Years 7.37 9.01 7.93 14,277 15,402 14,654Jan 01, 13 Since Inception 8.12 8.96 7.44 18,793 20,008 17,857
# CRISIL Dynamic Debt Index ## CRISIL 10 year Gilt Index.
HDFC SHORT TERM DEBT FUND NAV as on Jan 29, 2021 ` 24.8955
Date Period Scheme Returns
(%)
Benchmark Returns
(%)#
Additional Benchmark
Returns (%) ##
Value of ` 10,000 invested
Scheme (`)
Benchmark (`)#
Additional Benchmark
(`)##
Jan 31, 20 Last 1 Year 10.51 9.20 5.52 11,048 10,918 10,551Jan 31, 18 Last 3 Years 9.31 8.74 6.67 13,059 12,856 12,135Jan 29, 16 Last 5 Years 8.78 8.34 6.60 15,239 14,933 13,769Jan 01, 13 Since Inception 8.95 8.61 6.94 20,000 19,491 17,205
# CRISIL Short Term Bond Fund Index ## CRISIL 1 year T-Bill Index.
HDFC ULTRA SHORT TERM FUND NAV as on Jan 29, 2021 ` 11.8497
Date Period Scheme Returns
(%)
Benchmark Returns
(%)#
Additional Benchmark
Returns (%) ##
Value of ` 10,000 invested
Scheme (`)
Benchmark (`)#
Additional Benchmark
(`)##
Jan 31, 20 Last 1 Year 6.41 5.79 5.52 10,639 10,578 10,551Sep 25, 18 Since Inception 7.50 7.12 6.95 11,850 11,754 11,709
# CRISIL Ultra Short Term Debt Index ## CRISIL 1 year T-Bill Index. The Scheme is in existence for more than 1 year but less than 3 years. The scheme is managed by Mr. Anil Bamboli since inception.
HDFC GILT FUND NAV as on Jan 29, 2021 ` 45.2178
Date Period Scheme Returns
(%)
Benchmark Returns
(%)#
Additional Benchmark
Returns (%) ##
Value of ` 10,000 invested
Scheme (`)
Benchmark (`)#
Additional Benchmark
(`)##
Jan 31, 20 Last 1 Year 10.34 11.35 9.14 11,031 11,132 10,911Jan 31, 18 Last 3 Years 8.69 9.94 9.04 12,838 13,286 12,963Jan 29, 16 Last 5 Years 8.96 8.89 7.93 15,362 15,313 14,654Jan 01, 13 Since Inception 8.74 8.60 7.44 19,678 19,475 17,857
# CRISIL Dynamic Gilt Index ## CRISIL 10 year Gilt Index.
HDFC BANkING AND PSU DEBT FUND NAV as on Jan 29, 2021 ` 18.2336
Date Period Scheme Returns
(%)
Benchmark Returns
(%)#
Additional Benchmark
Returns (%) ##
Value of ` 10,000 invested
Scheme (`)
Benchmark (`)#
Additional Benchmark
(`)##
Jan 31, 20 Last 1 Year 10.15 9.48 5.52 11,012 10,946 10,551Jan 31, 18 Last 3 Years 9.20 8.28 6.67 13,019 12,694 12,135Jan 29, 16 Last 5 Years 9.03 8.07 6.60 15,415 14,749 13,769Mar 26, 14 Since Inception 9.16 8.54 7.06 18,234 17,533 15,963
# nIFTY Banking & PSU Index ## CRISIL 1 year T-Bill Index.
HDFC OVERNIGHT FUND NAV as on Jan 31, 2021 ` 3043.1775
Date Period Scheme Returns
(%)
Benchmark Returns
(%)#
Additional Benchmark
Returns (%) ##
Value of ` 10,000 invested
Scheme (`)
Benchmark (`)#
Additional Benchmark
(`)##
Jan 24, 21 Last 7 days 3.13 3.23 -0.69 10,006 10,006 9,999Jan 16, 21 Last 15 days n.A. n.A. n.A. n.A. n.A. n.A.Dec 31, 20 Last 1 Month 3.03 3.13 1.58 10,026 10,027 10,013Jan 31, 20 Last 1 Year 3.20 3.27 5.53 10,321 10,328 10,555Jan 31, 18 Last 3 Years 4.97 5.02 6.66 11,569 11,584 12,137Jan 31, 16 Last 5 Years 5.45 5.49 6.59 13,041 13,065 13,766Dec 31, 12 Since Inception 6.38 6.46 6.95 16,499 16,599 17,216
Returns less than 1 year period are simple annualized. # CRISIL Overnight Index ## CRISIL 1 year T-Bill Index.
HDFC FMP 1846D AUGUST 2013 (1) NAV as on Jan 29, 2021 ` 19.5188
Date Period Scheme Returns
(%)
Benchmark Returns
(%)#
Additional Benchmark
Returns (%) ##
Value of ` 10,000 invested
Scheme (`)
Benchmark (`)#
Additional Benchmark
(`)##
Jan 31, 20 Last 1 Year 11.74 11.30 5.52 11,170 11,127 10,551Jan 31, 18 Last 3 Years 9.34 9.67 6.67 13,070 13,186 12,135Jan 29, 16 Last 5 Years 8.69 9.12 6.60 15,172 15,477 13,769Aug 14, 13 Since Inception 9.37 9.73 7.22 19,519 20,004 16,827
# CRISIL Composite Bond Fund Index ## CRISIL 1 year T-Bill Index. The scheme is managed by Mr. Anil Bamboli since inception.
HDFC FMP 1181D APRIL 2018 (1) NAV as on Jan 29, 2021 ` 12.5352
Date Period Scheme Returns
(%)
Benchmark Returns
(%)#
Additional Benchmark
Returns (%) ##
Value of ` 10,000 invested
Scheme (`)
Benchmark (`)#
Additional Benchmark
(`)##
Jan 31, 20 Last 1 Year 7.07 11.30 5.52 10,705 11,127 10,551Apr 27, 18 Since Inception 8.53 10.48 6.64 12,535 13,169 11,944
# CRISIL Composite Bond Fund Index ## CRISIL 1 year T-Bill Index. The Scheme is in existence for more than 1 year but less than 3 years. The scheme is managed by Mr. Anil Bamboli since inception.
HDFC FMP 1146D APRIL 2018 (1) NAV as on Jan 29, 2021 ` 12.3395
Date Period Scheme Returns
(%)
Benchmark Returns
(%)#
Additional Benchmark
Returns (%) ##
Value of ` 10,000 invested
Scheme (`)
Benchmark (`)#
Additional Benchmark
(`)##
Jan 31, 20 Last 1 Year 10.53 11.30 5.52 11,050 11,127 10,551May 10, 18 Since Inception 8.02 10.47 6.66 12,340 13,119 11,921
# CRISIL Composite Bond Fund Index ## CRISIL 1 year T-Bill Index. The Scheme is in existence for more than 1 year but less than 3 years. The scheme is managed by Mr. Anil Bamboli since inception.
Past performance may or may not be sustained in the future. Returns greater than 1 year period are compounded annualized (CAGR). Different plans viz. Regular Plan and Direct Plan have a different expense structure. The expenses of the Direct Plan under the Scheme will be lower to the extent of the distribution expenses / commission charged in the Regular Plan. Load is not taken into consideration for computation of performance. n.A.: not Available
Performance of close-ended schemes, being close-ended in nature, is not strictly comparable with that of open-ended schemes since the investment strategy for close-ended schemes is primarily buy-and-hold whereas open-ended schemes are actively managed.
ANUPAM JOSHI....CONTINUED

January 2021 77
SCHEME PERFORMANCE - DIRECT PLAN - GROWTH OPTION (FUND MANAGER-WISE)
HDFC FMP 1434D MAY 2018 (1) NAV as on Jan 29, 2021 ` 12.8563
Date Period Scheme Returns
(%)
Benchmark Returns
(%)#
Additional Benchmark
Returns (%) ##
Value of ` 10,000 invested
Scheme (`)
Benchmark (`)#
Additional Benchmark
(`)##
Jan 31, 20 Last 1 Year 8.91 11.30 5.52 10,889 11,127 10,551May 09, 18 Since Inception 9.64 10.45 6.66 12,856 13,116 11,922
# CRISIL Composite Bond Fund Index ## CRISIL 1 year T-Bill Index. The Scheme is in existence for more than 1 year but less than 3 years. The scheme is managed by Mr. Anil Bamboli since inception.
HDFC FMP 1134D MAY 2018 (1) NAV as on Jan 29, 2021 ` 12.5571
Date Period Scheme Returns
(%)
Benchmark Returns
(%)#
Additional Benchmark
Returns (%) ##
Value of ` 10,000 invested
Scheme (`)
Benchmark (`)#
Additional Benchmark
(`)##
Jan 31, 20 Last 1 Year 6.96 11.30 5.52 10,694 11,127 10,551May 24, 18 Since Inception 8.84 10.87 6.74 12,557 13,195 11,916
# CRISIL Composite Bond Fund Index ## CRISIL 1 year T-Bill Index. The Scheme is in existence for more than 1 year but less than 3 years. The scheme is managed by Mr. Anil Bamboli since inception.
HDFC FMP 1119D JUNE 2018 (1) NAV as on Jan 29, 2021 ` 12.5485
Date Period Scheme Returns
(%)
Benchmark Returns
(%)#
Additional Benchmark
Returns (%) ##
Value of ` 10,000 invested
Scheme (`)
Benchmark (`)#
Additional Benchmark
(`)##
Jan 31, 20 Last 1 Year 7.09 11.30 5.52 10,707 11,127 10,551Jun 08, 18 Since Inception 8.96 11.10 6.78 12,549 13,214 11,897
# CRISIL Composite Bond Fund Index ## CRISIL 1 year T-Bill Index. The Scheme is in existence for more than 1 year but less than 3 years. The scheme is managed by Mr. Anil Bamboli since inception.
HDFC FMP 1280D OCTOBER 2018 (1) NAV as on Jan 29, 2021 ` 12.6085
Date Period Scheme Returns
(%)
Benchmark Returns
(%)#
Additional Benchmark
Returns (%) ##
Value of ` 10,000 invested
Scheme (`)
Benchmark (`)#
Additional Benchmark
(`)##
Jan 31, 20 Last 1 Year 9.04 11.30 5.52 10,901 11,127 10,551Oct 11, 18 Since Inception 10.58 11.90 6.85 12,609 12,956 11,649
# CRISIL Composite Bond Fund Index ## CRISIL 1 year T-Bill Index. The Scheme is in existence for more than 1 year but less than 3 years. The scheme is managed by Mr. Anil Bamboli since inception.
HDFC FMP 1344D OCTOBER 2018 (1) NAV as on Jan 29, 2021 ` 12.5643
Date Period Scheme Returns
(%)
Benchmark Returns
(%)#
Additional Benchmark
Returns (%) ##
Value of ` 10,000 invested
Scheme (`)
Benchmark (`)#
Additional Benchmark
(`)##
Jan 31, 20 Last 1 Year 10.28 11.30 5.52 11,025 11,127 10,551Oct 24, 18 Since Inception 10.59 11.77 6.80 12,564 12,871 11,608
# CRISIL Composite Bond Fund Index ## CRISIL 1 year T-Bill Index. The Scheme is in existence for more than 1 year but less than 3 years. The scheme is managed by Mr. Anil Bamboli since inception.
HDFC FMP 1274D OCTOBER 2018 (1) NAV as on Jan 29, 2021 ` 12.5780
Date Period Scheme Returns
(%)
Benchmark Returns
(%)#
Additional Benchmark
Returns (%) ##
Value of ` 10,000 invested
Scheme (`)
Benchmark (`)#
Additional Benchmark
(`)##
Jan 31, 20 Last 1 Year 8.97 11.30 5.52 10,894 11,127 10,551Oct 17, 18 Since Inception 10.55 11.81 6.82 12,578 12,910 11,630
# CRISIL Composite Bond Fund Index ## CRISIL 1 year T-Bill Index. The Scheme is in existence for more than 1 year but less than 3 years. The scheme is managed by Mr. Anil Bamboli since inception.
HDFC FMP 1261D OCTOBER 2018 (1) NAV as on Jan 29, 2021 ` 12.4448
Date Period Scheme Returns
(%)
Benchmark Returns
(%)#
Additional Benchmark
Returns (%) ##
Value of ` 10,000 invested
Scheme (`)
Benchmark (`)#
Additional Benchmark
(`)##
Jan 31, 20 Last 1 Year 8.80 11.30 5.52 10,877 11,127 10,551Oct 25, 18 Since Inception 10.13 11.77 6.79 12,445 12,867 11,604
# CRISIL Composite Bond Fund Index ## CRISIL 1 year T-Bill Index. The Scheme is in existence for more than 1 year but less than 3 years. The scheme is managed by Mr. Anil Bamboli since inception.
HDFC FMP 1260D OCTOBER 2018 (1) NAV as on Jan 29, 2021 ` 12.5219
Date Period Scheme Returns
(%)
Benchmark Returns
(%)#
Additional Benchmark
Returns (%) ##
Value of ` 10,000 invested
Scheme (`)
Benchmark (`)#
Additional Benchmark
(`)##
Jan 31, 20 Last 1 Year 8.89 11.30 5.52 10,886 11,127 10,551Oct 31, 18 Since Inception 10.52 11.78 6.79 12,522 12,847 11,591
# CRISIL Composite Bond Fund Index ## CRISIL 1 year T-Bill Index. The Scheme is in existence for more than 1 year but less than 3 years. The scheme is managed by Mr. Anil Bamboli since inception.
HDFC FMP 1265D OCTOBER 2018 (1) NAV as on Jan 29, 2021 ` 12.5438
Date Period Scheme Returns
(%)
Benchmark Returns
(%)#
Additional Benchmark
Returns (%) ##
Value of ` 10,000 invested
Scheme (`)
Benchmark (`)#
Additional Benchmark
(`)##
Jan 31, 20 Last 1 Year 9.07 11.30 5.52 10,904 11,127 10,551nov 01, 18 Since Inception 10.61 11.74 6.78 12,544 12,831 11,587
# CRISIL Composite Bond Fund Index ## CRISIL 1 year T-Bill Index. The Scheme is in existence for more than 1 year but less than 3 years. The scheme is managed by Mr. Anil Bamboli since inception.
HDFC FMP 1246D NOVEMBER 2018 (1) NAV as on Jan 29, 2021 ` 12.4407
Date Period Scheme Returns
(%)
Benchmark Returns
(%)#
Additional Benchmark
Returns (%) ##
Value of ` 10,000 invested
Scheme (`)
Benchmark (`)#
Additional Benchmark
(`)##
Jan 31, 20 Last 1 Year 9.05 11.30 5.52 10,903 11,127 10,551nov 20, 18 Since Inception 10.46 11.65 6.66 12,441 12,736 11,519
# CRISIL Composite Bond Fund Index ## CRISIL 1 year T-Bill Index. The Scheme is in existence for more than 1 year but less than 3 years. The scheme is managed by Mr. Anil Bamboli since inception.
HDFC FMP 1232D NOVEMBER 2018 (1) NAV as on Jan 29, 2021 ` 12.4219
Date Period Scheme Returns
(%)
Benchmark Returns
(%)#
Additional Benchmark
Returns (%) ##
Value of ` 10,000 invested
Scheme (`)
Benchmark (`)#
Additional Benchmark
(`)##
Jan 31, 20 Last 1 Year 9.08 11.30 5.52 10,905 11,127 10,551nov 28, 18 Since Inception 10.50 11.44 6.64 12,422 12,654 11,499
# CRISIL Composite Bond Fund Index ## CRISIL 1 year T-Bill Index. The Scheme is in existence for more than 1 year but less than 3 years. The scheme is managed by Mr. Anil Bamboli since inception.
HDFC FMP 1224D DECEMBER 2018 (1) NAV as on Jan 29, 2021 ` 12.3198
Date Period Scheme Returns
(%)
Benchmark Returns
(%)#
Additional Benchmark
Returns (%) ##
Value of ` 10,000 invested
Scheme (`)
Benchmark (`)#
Additional Benchmark
(`)##
Jan 31, 20 Last 1 Year 8.99 11.30 5.52 10,897 11,127 10,551Dec 06, 18 Since Inception 10.19 10.99 6.58 12,320 12,513 11,468
# CRISIL Composite Bond Fund Index ## CRISIL 1 year T-Bill Index. The Scheme is in existence for more than 1 year but less than 3 years. The scheme is managed by Mr. Anil Bamboli since inception.
HDFC FMP 1218D DECEMBER 2018 (1) NAV as on Jan 29, 2021 ` 12.3265
Date Period Scheme Returns
(%)
Benchmark Returns
(%)#
Additional Benchmark
Returns (%) ##
Value of ` 10,000 invested
Scheme (`)
Benchmark (`)#
Additional Benchmark
(`)##
Jan 31, 20 Last 1 Year 9.04 11.30 5.52 10,901 11,127 10,551Dec 12, 18 Since Inception 10.30 11.08 6.56 12,327 12,514 11,451
# CRISIL Composite Bond Fund Index ## CRISIL 1 year T-Bill Index. The Scheme is in existence for more than 1 year but less than 3 years. The scheme is managed by Mr. Anil Bamboli since inception.
HDFC FMP 1211D DECEMBER 2018 (1) NAV as on Jan 29, 2021 ` 12.2661
Date Period Scheme Returns
(%)
Benchmark Returns
(%)#
Additional Benchmark
Returns (%) ##
Value of ` 10,000 invested
Scheme (`)
Benchmark (`)#
Additional Benchmark
(`)##
Jan 31, 20 Last 1 Year 8.96 11.30 5.52 10,894 11,127 10,551Dec 19, 18 Since Inception 10.14 10.76 6.53 12,266 12,413 11,431
# CRISIL Composite Bond Fund Index ## CRISIL 1 year T-Bill Index. The Scheme is in existence for more than 1 year but less than 3 years. The scheme is managed by Mr. Anil Bamboli since inception.
Past performance may or may not be sustained in the future. Returns greater than 1 year period are compounded annualized (CAGR). Different plans viz. Regular Plan and Direct Plan have a different expense structure. The expenses of the Direct Plan under the Scheme will be lower to the extent of the distribution expenses / commission charged in the Regular Plan. Load is not taken into consideration for computation of performance. n.A.: not Available
Performance of close-ended schemes, being close-ended in nature, is not strictly comparable with that of open-ended schemes since the investment strategy for close-ended schemes is primarily buy-and-hold whereas open-ended schemes are actively managed.
ANIL BAMBOLI....CONTINUED

78 January 2021
SCHEME PERFORMANCE - DIRECT PLAN - GROWTH OPTION (FUND MANAGER-WISE)
HDFC FMP 1203D DECEMBER 2018 (1) NAV as on Jan 29, 2021 ` 12.2391
Date Period Scheme Returns
(%)
Benchmark Returns
(%)#
Additional Benchmark
Returns (%) ##
Value of ` 10,000 invested
Scheme (`)
Benchmark (`)#
Additional Benchmark
(`)##
Jan 31, 20 Last 1 Year 9.06 11.30 5.52 10,904 11,127 10,551Dec 27, 18 Since Inception 10.13 10.78 6.51 12,239 12,389 11,411
# CRISIL Composite Bond Fund Index ## CRISIL 1 year T-Bill Index. The Scheme is in existence for more than 1 year but less than 3 years. The scheme is managed by Mr. Anil Bamboli since inception.
HDFC FMP 1196D DECEMBER 2018 (1) NAV as on Jan 29, 2021 ` 12.2228
Date Period Scheme Returns
(%)
Benchmark Returns
(%)#
Additional Benchmark
Returns (%) ##
Value of ` 10,000 invested
Scheme (`)
Benchmark (`)#
Additional Benchmark
(`)##
Jan 31, 20 Last 1 Year 9.09 11.30 5.52 10,907 11,127 10,551Jan 03, 19 Since Inception 10.16 11.09 6.50 12,223 12,438 11,396
# CRISIL Composite Bond Fund Index ## CRISIL 1 year T-Bill Index. The Scheme is in existence for more than 1 year but less than 3 years. The scheme is managed by Mr. Anil Bamboli since inception.
HDFC FMP 1190D JANUARY 2019 (1) NAV as on Jan 29, 2021 ` 12.2018
Date Period Scheme Returns
(%)
Benchmark Returns
(%)#
Additional Benchmark
Returns (%) ##
Value of ` 10,000 invested
Scheme (`)
Benchmark (`)#
Additional Benchmark
(`)##
Jan 31, 20 Last 1 Year 9.17 11.30 5.52 10,914 11,127 10,551Jan 09, 19 Since Inception 10.15 11.09 6.48 12,202 12,415 11,380
# CRISIL Composite Bond Fund Index ## CRISIL 1 year T-Bill Index. The Scheme is in existence for more than 1 year but less than 3 years. The scheme is managed by Mr. Anil Bamboli since inception.
HDFC FMP 1182D JANUARY 2019 (1) NAV as on Jan 29, 2021 ` 12.1823
Date Period Scheme Returns
(%)
Benchmark Returns
(%)#
Additional Benchmark
Returns (%) ##
Value of ` 10,000 invested
Scheme (`)
Benchmark (`)#
Additional Benchmark
(`)##
Jan 31, 20 Last 1 Year 9.21 11.30 5.52 10,918 11,127 10,551Jan 17, 19 Since Inception 10.18 11.23 6.45 12,182 12,420 11,356
# CRISIL Composite Bond Fund Index ## CRISIL 1 year T-Bill Index. The Scheme is in existence for more than 1 year but less than 3 years. The scheme is managed by Mr. Anil Bamboli since inception.
HDFC FMP 1175D JANUARY 2019 (1) NAV as on Jan 29, 2021 ` 12.1562
Date Period Scheme Returns
(%)
Benchmark Returns
(%)#
Additional Benchmark
Returns (%) ##
Value of ` 10,000 invested
Scheme (`)
Benchmark (`)#
Additional Benchmark
(`)##
Jan 31, 20 Last 1 Year 9.25 11.30 5.52 10,923 11,127 10,551Jan 23, 19 Since Inception 10.15 11.40 6.44 12,156 12,435 11,344
# CRISIL Composite Bond Fund Index ## CRISIL 1 year T-Bill Index. The Scheme is in existence for more than 1 year but less than 3 years. The scheme is managed by Mr. Anil Bamboli since inception.
HDFC FMP 1168D JANUARY 2019 (1) NAV as on Jan 29, 2021 ` 12.1419
Date Period Scheme Returns
(%)
Benchmark Returns
(%)#
Additional Benchmark
Returns (%) ##
Value of ` 10,000 invested
Scheme (`)
Benchmark (`)#
Additional Benchmark
(`)##
Jan 31, 20 Last 1 Year 9.16 11.30 5.52 10,913 11,127 10,551Jan 30, 19 Since Inception 10.19 11.41 6.42 12,142 12,411 11,325
# CRISIL Composite Bond Fund Index ## CRISIL 1 year T-Bill Index. The Scheme is in existence for more than 1 year but less than 3 years. The scheme is managed by Mr. Anil Bamboli since inception.
HDFC FMP 1154D FEBRUARY 2019 (1) NAV as on Jan 29, 2021 ` 12.0586
Date Period Scheme Returns
(%)
Benchmark Returns
(%)#
Additional Benchmark
Returns (%) ##
Value of ` 10,000 invested
Scheme (`)
Benchmark (`)#
Additional Benchmark
(`)##
Jan 31, 20 Last 1 Year 9.15 11.30 5.52 10,913 11,127 10,551Feb 13, 19 Since Inception 10.01 11.36 6.27 12,059 12,351 11,267
# CRISIL Composite Bond Fund Index ## CRISIL 1 year T-Bill Index. The Scheme is in existence for more than 1 year but less than 3 years. The scheme is managed by Mr. Anil Bamboli since inception.
HDFC FMP 1146D FEBRUARY 2019 (1) NAV as on Jan 29, 2021 ` 12.0602
Date Period Scheme Returns
(%)
Benchmark Returns
(%)#
Additional Benchmark
Returns (%) ##
Value of ` 10,000 invested
Scheme (`)
Benchmark (`)#
Additional Benchmark
(`)##
Jan 31, 20 Last 1 Year 9.17 11.30 5.52 10,914 11,127 10,551Feb 21, 19 Since Inception 10.14 11.61 6.27 12,060 12,375 11,252
# CRISIL Composite Bond Fund Index ## CRISIL 1 year T-Bill Index. The Scheme is in existence for more than 1 year but less than 3 years. The scheme is managed by Mr. Anil Bamboli since inception.
AMIT B. GANATRA
HDFC TAxSAVER NAV as on Jan 29, 2021 ` 572.386
Date Period Scheme Returns
(%)
Benchmark Returns
(%)#
Additional Benchmark
Returns (%) ##
Value of ` 10,000 invested
Scheme (`)
Benchmark (`)#
Additional Benchmark
(`)##
Jan 31, 20 Last 1 Year 7.76 15.82 15.22 10,773 11,578 11,518Jan 31, 18 Last 3 Years -0.24 6.49 8.70 9,928 12,073 12,841Jan 29, 16 Last 5 Years 10.32 13.61 13.94 16,352 18,938 19,214Jan 01, 13 Since Inception 10.99 12.50 12.16 23,229 25,898 25,286
# nIFTY 500 (Total Returns Index) ## nIFTY 50 (Total Returns Index).
HDFC CAPITAL BUILDER VALUE FUND NAV as on Jan 29, 2021 ` 346.245
Date Period Scheme Returns
(%)
Benchmark Returns
(%)#
Additional Benchmark
Returns (%) ##
Value of ` 10,000 invested
Scheme (`)
Benchmark (`)#
Additional Benchmark
(`)##
Jan 31, 20 Last 1 Year 14.47 15.82 15.22 11,443 11,578 11,518Jan 31, 18 Last 3 Years 2.66 6.49 8.70 10,820 12,073 12,841Jan 29, 16 Last 5 Years 12.40 13.61 13.94 17,953 18,938 19,214Jan 01, 13 Since Inception 14.28 12.50 12.16 29,412 25,898 25,286
# nIFTY 500 (Total Returns Index) ## nIFTY 50 (Total Returns Index).
HDFC EOF - II - 1126D MAY 2017 (1) NAV as on Jan 29, 2021 ` 11.0220
Date Period Scheme Returns
(%)
Benchmark Returns
(%)#
Additional Benchmark
Returns (%) ##
Value of ` 10,000 invested
Scheme (`)
Benchmark (`)#
Additional Benchmark
(`)##Jan 31, 20 Last 1 Year 4.62 15.22 15.05 10,461 11,518 11,500Jan 31, 18 Last 3 Years 0.38 8.70 10.08 10,114 12,841 13,336Jun 15, 17 Since Inception 2.72 11.60 12.94 11,022 14,890 15,551
# nIFTY 50 (Total Returns Index) ## S&P BSE SEnSEx (Total Returns Index). The Scheme is in existence for more than 1 year but less than 5 years. The scheme is managed by Mr. Amit B. Ganatra from May 21, 2020.
HDFC EOF - II - 1100D JUNE 2017 (1) NAV as on Jan 29, 2021 ` 10.5010
Date Period Scheme Returns
(%)
Benchmark Returns
(%)#
Additional Benchmark
Returns (%) ##
Value of ` 10,000 invested
Scheme (`)
Benchmark (`)#
Additional Benchmark
(`)##Jan 31, 20 Last 1 Year 1.44 15.22 15.05 10,144 11,518 11,500Jan 31, 18 Last 3 Years 0.00 8.70 10.08 10,001 12,841 13,336Jul 17, 17 Since Inception 1.39 10.71 12.15 10,501 14,336 15,008
# nIFTY 50 (Total Returns Index) ## S&P BSE SEnSEx (Total Returns Index). The Scheme is in existence for more than 1 year but less than 5 years. The scheme is managed by Mr. Amit B. Ganatra from May 21, 2020.
Past performance may or may not be sustained in the future. Returns greater than 1 year period are compounded annualized (CAGR). Different plans viz. Regular Plan and Direct Plan have a different expense structure. The expenses of the Direct Plan under the Scheme will be lower to the extent of the distribution expenses / commission charged in the Regular Plan. Load is not taken into consideration for computation of performance. n.A.: not Available
ANIL BAMBOLI....CONTINUED
Performance of close-ended schemes, being close-ended in nature, is not strictly comparable with that of open-ended schemes since the investment strategy for close-ended schemes is primarily buy-and-hold whereas open-ended schemes are actively managed.

January 2021 79
SCHEME PERFORMANCE - DIRECT PLAN - GROWTH OPTION (FUND MANAGER-WISE)
RAkESH VYAS
HDFC INFRASTRUCTURE FUND NAV as on Jan 29, 2021 ` 14.914
Date Period Scheme Returns
(%)
Benchmark Returns
(%)#
Additional Benchmark
Returns (%) ##
Value of ` 10,000 invested
Scheme (`)
Benchmark (`)#
Additional Benchmark
(`)##Jan 31, 20 Last 1 Year -7.29 15.82 15.22 9,273 11,578 11,518Jan 31, 18 Last 3 Years -13.66 6.49 8.70 6,440 12,073 12,841Jan 29, 16 Last 5 Years 0.50 13.61 13.94 10,254 18,938 19,214Jan 01, 13 Since Inception 3.66 12.50 12.16 13,373 25,898 25,286
# nIFTY 500 (Total Returns Index) ## nIFTY 50 (Total Returns Index).
HDFC HOUSING OPPORTUNITIES FUND € NAV as on Jan 29, 2021 ` 9.7120
Date Period Scheme Returns
(%)
Benchmark Returns
(%)#
Additional Benchmark
Returns (%) ##
Value of ` 10,000 invested
Scheme (`)
Benchmark (`)#
Additional Benchmark
(`)##Jan 31, 20 Last 1 Year 1.48 13.71 15.22 10,148 11,367 11,518Jan 31, 18 Last 3 Years -2.09 5.90 8.70 9,387 11,875 12,841Dec 06, 17 Since Inception -0.92 8.88 11.53 9,712 13,073 14,103
# India Housing & Allied Businesses Index ## nIFTY 50 (Total Returns Index) The Scheme is in existence for more than 1 year but less than 5 years. € HDFC Housing opportunities Fund was launched as a close ended thematic Equity Scheme. The Scheme has been converted into open-ended scheme on January 19, 2021.
GOPAL AGRAWAL
HDFC FOCUSED 30 FUND NAV as on Jan 29, 2021 ` 85.540
Date Period Scheme Returns
(%)
Benchmark Returns
(%)#
Additional Benchmark
Returns (%) ##
Value of ` 10,000 invested Scheme
(`)Benchmark
(`)#Additional
Benchmark (`)##
Jan 31, 20 Last 1 Year 5.49 15.82 15.05 10,547 11,578 11,500Jan 31, 18 Last 3 Years -1.65 6.49 10.08 9,515 12,073 13,336Jan 29, 16 Last 5 Years 8.55 13.61 14.65 15,081 18,938 19,826Jan 01, 13 Since Inception 9.76 12.50 12.73 21,225 25,898 26,344
# nIFTY 500 (Total Returns Index) ## S&P BSE SEnSEx (Total Returns Index).
HDFC GROWTH OPPORTUNITIES FUND NAV as on Jan 29, 2021 ` 132.143
Date Period Scheme Returns
(%)
Benchmark Returns
(%)#
Additional Benchmark
Returns (%) ##
Value of ` 10,000 invested Scheme
(`)Benchmark
(`)#Additional
Benchmark (`)##
Jan 31, 20 Last 1 Year 12.85 17.26 15.05 11,282 11,721 11,500Jan 31, 18 Last 3 Years 3.75 6.18 10.08 11,168 11,969 13,336Jan 29, 16 Last 5 Years 10.57 14.34 14.65 16,538 19,555 19,826Jan 01, 13 Since Inception 8.78 14.10 12.73 19,744 29,035 26,344
# nIFTY Large Midcap 250 (Total Returns Index) ## S&P BSE SEnSEx (Total Returns Index). The Scheme, formerly a large cap fund, has undergone change in Fundamental attributes w.e.f. May 23, 2018 and become a Large and Mid-cap Fund. Accordingly, the Scheme’s benchmark has also changed. Hence, the past performance of the Scheme may not strictly be comparable with that of the new benchmark.
kRISHAN kUMAR DAGA
HDFC GOLD FUND NAV as on Jan 29, 2021 ` 16.0691
Date Period Scheme Returns (%)
Benchmark Returns
(%)#
Value of ` 10,000 invested
Scheme (`)
Benchmark (`)#
Jan 31, 20 Last 1 Year 19.89 19.73 11,983 11,967Jan 31, 18 Last 3 Years 16.69 17.42 15,882 16,182Jan 29, 16 Last 5 Years 12.01 12.81 17,639 18,283Jan 01, 13 Since Inception 4.73 6.04 14,531 16,063
# Domestic Price of Physical Gold. The scheme is managed by Mr. Krishan Kumar Daga since October 19, 2015.
CO-MANAGED BY CHIRAG SETALVAD & SHOBHIT MEHROTRA
HDFC RETIREMENT SAVINGS FUND - EqUITY PLAN
NAV as on Jan 29, 2021 ` 21.849
Date Period Scheme Returns
(%)
Benchmark Returns
(%)#
Additional Benchmark
Returns (%) ##
Value of ` 10,000 invested
Scheme (`)
Benchmark (`)#
Additional Benchmark
(`)##Jan 31, 20 Last 1 Year 17.85 15.82 15.22 11,780 11,578 11,518Jan 31, 18 Last 3 Years 6.49 6.49 8.70 12,073 12,073 12,841Feb 25, 16 Since Inception 17.17 15.81 16.06 21,849 20,626 20,842
# nIFTY 500 (Total Returns Index) ## nIFTY 50 (Total Returns Index). The Scheme is in existence for more than 1 year but less than 5 years
HDFC RETIREMENTSAVINGS FUND - HYBRID EqUITY PLAN
NAV as on Jan 29, 2021 ` 21.506
Date Period Scheme Returns
(%)
Benchmark Returns
(%)#
Additional Benchmark
Returns (%) ##
Value of ` 10,000 invested
Scheme (`)
Benchmark (`)#
Additional Benchmark
(`)##Jan 31, 20 Last 1 Year 16.17 16.00 15.22 11,612 11,596 11,518Jan 31, 18 Last 3 Years 8.64 9.84 8.70 12,820 13,247 12,841Feb 25, 16 Since Inception 16.80 14.23 16.06 21,506 19,270 20,842
# nIFTY 50 Hybrid Composite Debt 65:35 Index ## nIFTY 50 (Total Returns Index). The Scheme is in existence for more than 1 year but less than 5 years
HDFC RETIREMENT SAVINGS FUND - HYBRID DEBT PLAN
NAV as on Jan 29, 2021 ` 16.2198
Date Period Scheme Returns
(%)
Benchmark Returns
(%)#
Additional Benchmark
Returns (%) ##
Value of ` 10,000 invested
Scheme (`)
Benchmark (`)#
Additional Benchmark
(`)##Jan 31, 20 Last 1 Year 10.37 13.22 9.14 11,034 11,318 10,911Jan 31, 18 Last 3 Years 7.51 9.96 9.04 12,424 13,292 12,963Feb 26, 16 Since Inception 10.31 10.54 8.10 16,220 16,384 14,677
# nIFTY 50 Hybrid Composite Debt 15:85 Index ## CRISIL 10 Year Gilt Index. The Scheme is in existence for more than 1 years but less than 5 years
CO-MANAGED BY AMIT B. GANATRA, ANIL BAMBOLI, kRISHAN kUMAR DAGA & ARUN AGARWAL
HDFC MULTI - ASSET FUND NAV as on Jan 29, 2021 ` 41.6630
Date Period Scheme Returns
(%)
Benchmark Returns
(%)#
Additional Benchmark
Returns (%) ##
Value of ` 10,000 invested
Scheme (`)
Benchmark (`)#
Additional Benchmark
(`)##Jan 31, 20 Last 1 Year 17.03 16.72 15.22 11,698 11,667 11,518Jan 31, 18 Last 3 Years 8.90 10.76 8.70 12,911 13,584 12,841Jan 29, 16 Last 5 Years 9.95 12.92 13.94 16,079 18,370 19,214Jan 01, 13 Since Inception 10.10 11.02 12.16 21,757 23,276 25,286
# 90% NIFTY 50 Hybrid Composite Debt 65:35 Index + 10% Domestic Price of Gold ## nIFTY 50 (Total Returns Index). The Scheme formerly, a debt oriented hybrid fund, has undergone change in Fundamental attributes w.e.f. May 23, 2018 and become a multi asset fund investing in equities, debt and gold related instruments. Accordingly, the Scheme’s benchmark and additional benchmarks have also changed. Hence, the past performance of the Scheme since inception till May 22, 2018 may not strictly be comparable with those of the new benchmark and the additional benchmark. Scheme performance may not strictly be comparable with that of its Additional Benchmark in view of hybrid nature of the scheme where a portion of scheme’s investments are made in debt instruments and gold related instruments.
Past performance may or may not be sustained in the future. Returns greater than 1 year period are compounded annualized (CAGR). Different plans viz. Regular Plan and Direct Plan have a different expense structure. The expenses of the Direct Plan under the Scheme will be lower to the extent of the distribution expenses / commission charged in the Regular Plan. Load is not taken into consideration for computation of performance. n.A.: not Available
Performance of close-ended schemes, being close-ended in nature, is not strictly comparable with that of open-ended schemes since the investment strategy for close-ended schemes is primarily buy-and-hold whereas open-ended schemes are actively managed.

80 January 2021
SCHEME PERFORMANCE - DIRECT PLAN - GROWTH OPTION (FUND MANAGER-WISE)
CO-MANAGED BY GOPAL AGRAWAL, ARUN AGARWAL, kRISHAN kUMAR DAGA & ANIL BAMBOLI
HDFC EqUITY SAVINGS FUND NAV as on Jan 29, 2021 ` 43.9840
Date Period Scheme Returns
(%)
Benchmark Returns
(%)#
Additional Benchmark
Returns (%) ##
Value of ` 10,000 invested
Scheme (`)
Benchmark (`)#
Additional Benchmark
(`)##Jan 31, 20 Last 1 Year 9.82 9.08 15.22 10,979 10,905 11,518Jan 31, 18 Last 3 Years 5.95 7.50 8.70 11,891 12,420 12,841Jan 29, 16 Last 5 Years 10.91 8.90 13.94 16,790 15,325 19,214Jan 01, 13 Since Inception 9.55 8.96 12.16 20,893 20,008 25,286
# 40% NIFTY 50 Arbitrage Index, 30% CRISIL Short Term Bond Fund Index and 30% NIFTY 50 (Total Returns Index) ## nIFTY 50 (Total Returns Index). Scheme performance may not strictly be comparable with that of its Additional Benchmark, since a portion of scheme’s investments are made in equity instruments.
CO-MANAGED BY PRASHANT JAIN & SHOBHIT MEHROTRA
HDFC HYBRID DEBT FUND NAV as on Jan 29, 2021 ` 54.5848
Date Period Scheme Returns
(%)
Benchmark Returns
(%)#
Additional Benchmark
Returns (%) ##
Value of ` 10,000 invested
Scheme (`)
Benchmark (`)#
Additional Benchmark
(`)##
Jan 31, 20 Last 1 Year 10.24 13.22 9.14 11,022 11,318 10,911Jan 31, 18 Last 3 Years 6.39 9.96 9.04 12,039 13,292 12,963Jan 29, 16 Last 5 Years 9.19 9.99 7.93 15,525 16,107 14,654Jan 01, 13 Since Inception 9.37 9.50 7.44 20,618 20,824 17,857
# nIFTY 50 Hybrid Composite Debt 15:85 Index ## CRISIL 10 year Gilt Index. Refer to note on performance disclosure on Page no. 37.
CO-MANAGED BY ANIL BAMBOLI & AMIT B. GANATRA
HDFC DYNAMIC PE RATIO FUND OF FUNDS NAV as on Jan 29, 2021 ` 23.243
Date Period Scheme Returns
(%)
Benchmark Returns
(%)#
Additional Benchmark
Returns (%) ##
Value of ` 10,000 invested
Scheme (`)
Benchmark (`)#
Additional Benchmark
(`)##
Jan 31, 20 Last 1 Year 14.74 16.00 15.22 11,470 11,596 11,518Jan 31, 18 Last 3 Years 6.35 9.84 8.70 12,026 13,247 12,841Jan 29, 16 Last 5 Years 12.13 12.75 13.94 17,734 18,232 19,214Jan 01, 13 Since Inception 9.85 11.39 12.16 21,362 23,910 25,286
# nIFTY 50 Hybrid Composite Debt 65:35 Index ## nIFTY 50 (Total Returns Index). Scheme performance may not strictly be comparable with that of its Additional Benchmark in view of hybrid nature of the scheme where a portion of scheme’s investments are made in equity instruments. The scheme is co-managed by Mr. Amit B. Ganatra from May 21, 2020 & Mr. Anil Bamboli from June 28, 2014.
CO-MANAGED BY SHOBHIT MEHROTRA & VIkASH AGARWAL
HDFC FLOATING RATE DEBT FUND NAV as on Jan 29, 2021 ` 38.1181
Date Period Scheme Returns
(%)
Benchmark Returns
(%)#
Additional Benchmark
Returns (%) ##
Value of ` 10,000 invested
Scheme (`)
Benchmark (`)#
Additional Benchmark
(`)##
Jan 31, 20 Last 1 Year 8.91 4.39 5.52 10,888 10,438 10,551Jan 31, 18 Last 3 Years 8.38 6.25 6.67 12,727 11,992 12,135Jan 29, 16 Last 5 Years 8.22 6.58 6.60 14,850 13,755 13,769Jan 01, 13 Since Inception 8.56 7.40 6.94 19,418 17,812 17,205
# CRISIL Liquid Fund Index ## CRISIL 1 year T-Bill Index. The Scheme is co-managed by Shobhit Mehrotra & Vikash Agarwal from July 01, 2020.
CO-MANAGED BY ANIL BAMBOLI & VIkASH AGARWAL
HDFC MONEY MARkET FUND NAV as on Jan 29, 2021 ` 4441.4099
Date Period Scheme Returns
(%)
Benchmark Returns
(%)#
Additional Benchmark
Returns (%) ##
Value of ` 10,000 invested
Scheme (`)
Benchmark (`)#
Additional Benchmark
(`)##
Jan 31, 20 Last 1 Year 6.45 4.85 5.52 10,643 10,483 10,551Jan 31, 18 Last 3 Years 7.43 6.47 6.67 12,397 12,067 12,135Jan 29, 16 Last 5 Years 7.31 6.77 6.60 14,235 13,877 13,769Dec 31, 12 Since Inception 7.91 7.57 6.95 18,512 18,041 17,212
# nIFTY Money Market Index ## CRISIL 1 year T-Bill Index. The Scheme is co-managed by Anil Bamboli & Vikash Agarwal from July 01, 2020.
CO-MANAGED BY kRISHAN kUMAR DAGA & ARUN AGARWAL
HDFC ARBITRAGE FUND - WHOLESALE PLAN NAV as on Jan 29, 2021 ` 15.315
Date Period Scheme Returns
(%)
Benchmark Returns
(%)#
Additional Benchmark
Returns (%) ##
Value of ` 10,000 invested
Scheme (`)
Benchmark (`)#
Additional Benchmark
(`)##
Jan 31, 20 Last 1 Year 3.85 1.84 15.22 10,384 10,183 11,518Jan 31, 18 Last 3 Years 5.51 4.42 8.70 11,743 11,385 12,841Jan 29, 16 Last 5 Years 5.95 4.77 13.94 13,352 12,626 19,214Apr 07, 14 Since Inception 6.45 5.64 12.38 15,315 14,535 22,166
# nIFTY 50 Arbitrage Index ## nIFTY 50 (Total Returns Index). Scheme performance is not strictly comparable with that of its Additional Benchmark since the scheme does not take directional call in equity markets but is limited to availing arbitrage opportunities, etc.
HDFC INDEx FUND - SENSEx PLAN NAV as on Jan 29, 2021 ` 419.7827
Date Period Scheme Returns
(%)
Benchmark Returns
(%)#
Additional Benchmark
Returns (%) ##
Value of ` 10,000 invested
Scheme (`)
Benchmark (`)#
Additional Benchmark
(`)##
Jan 31, 20 Last 1 Year 14.43 15.05 15.22 11,439 11,500 11,518Jan 31, 18 Last 3 Years 9.65 10.08 8.70 13,181 13,336 12,841Jan 29, 16 Last 5 Years 14.28 14.65 13.94 19,508 19,826 19,214Jan 01, 13 Since Inception 12.36 12.73 12.16 25,654 26,344 25,286
# S&P BSE SEnSEx (Total Returns Index) ## nIFTY 50 (Total Returns Index). Refer to note on performance disclosure on Page no. 26.
HDFC INDEx FUND - NIFTY 50 PLAN NAV as on Jan 29, 2021 ` 126.5548
Date Period Scheme Returns
(%)
Benchmark Returns
(%)#
Additional Benchmark
Returns (%) ##
Value of ` 10,000 invested
Scheme (`)
Benchmark (`)#
Additional Benchmark
(`)##
Jan 31, 20 Last 1 Year 14.43 15.22 15.05 11,439 11,518 11,500Jan 31, 18 Last 3 Years 8.32 8.70 10.08 12,707 12,841 13,336Jan 29, 16 Last 5 Years 13.49 13.94 14.65 18,844 19,214 19,826Jan 01, 13 Since Inception 11.80 12.16 12.73 24,631 25,286 26,344
# nIFTY 50 (Total Returns Index) ## S&P BSE SEnSEx (Total Returns Index).
Past performance may or may not be sustained in the future. Returns greater than 1 year period are compounded annualized (CAGR). Different plans viz. Regular Plan and Direct Plan have a different expense structure. The expenses of the Direct Plan under the Scheme will be lower to the extent of the distribution expenses / commission charged in the Regular Plan. Load is not taken into consideration for computation of performance. n.A.: not Available
Performance of close-ended schemes, being close-ended in nature, is not strictly comparable with that of open-ended schemes since the investment strategy for close-ended schemes is primarily buy-and-hold whereas open-ended schemes are actively managed.

January 2021 81
Managing Portfolio Since
Returns (%) (As on January 31, 2021)
Last 1 year (%) Last 3 years (%) Last 5 years (%)
Permitted Category FPI Portfolio (managed under a bilateral agreement under Regulation 24(b) and subject to applicable laws)
March 22, 2016 10.43 5.78 n.A.
Benchmark- MSCI India (Total Returns) 16.21 7.69 n.A.
Past performance may or may not be sustained in the future. Returns greater than 1 year period are compounded annualised (CAGR). The above returns are computed using the Time Weighted Rate of Return (TWRR) methodology, to make them more comparable with the mutual fund scheme's returns. Inception date is March 22, 2016. The performance is not comparable with the performance of the aforementioned scheme(s) of HDFC Mutual Fund due to differing investment objective/s and fundamental differences in asset allocation, investment strategy and the regulatory environment. The said disclosure is pursuant to SEBI Circular no. Cir/IMD/DF/7/2012 dated February 28, 2012 pertaining to Regulation 24(b) of SEBI (Mutual Funds) Regulations, 1996. FPI - Foreign Portfolio Investor.
PERFORMANCE OF PERMITTED CATEGORY FPI PORTFOLIO (MANAGED BY PRASHANT JAIN)

82 January 2021
DIVIDEND HISTORY ^
^ Past performance may or may not be sustained in the future. There is no assurance or guarantee to Unit holders as to rate/quantum of dividend distribution nor that the dividends will be paid regularly. After payment of the dividend, the per Unit nAV falls to the extent of the payout and statutory levy, if any. Please log on to www.hdfcfund.com for Record Date-wise listing of dividends declared.
HDFC Flexi Cap Fund (Erstwhile HDFC Equity Fund) (Past 3 years) Dividend Option
Record Date Regular Plan Direct Plan
Cum Div NAV (`)
Dividend per Unit (`) For Cum Div NAV (`)
Dividend per Unit (`) For
Individuals & HUF Others Individuals & HUF Others
Mar 22, 18 55.480 5.50 5.50 58.320 5.50 5.50Mar 20, 19 56.417 5.25 5.25 60.153 5.25 5.25Mar 19, 20 33.678 4.250 4.250 36.364 4.250 4.250
HDFC Top 100 Fund (Past 3 years) Dividend Option
Record Date Regular Plan Direct Plan
Cum Div NAV (`)
Dividend per Unit (`) For Cum Div NAV (`)
Dividend per Unit (`) For
Individuals & HUF Others Individuals & HUF Others
Mar 06, 18 54.454 6.00 6.00 56.705 6.00 6.00Mar 07, 19 52.212 5.50 5.50 55.052 5.50 5.50Mar 12, 20 43.674 5.00 5.00 46.622 5.00 5.00
HDFC Capital Builder Value Fund (Past 3 years) Dividend Option
Record Date Regular Plan Direct Plan
Cum Div NAV (`)
Dividend per Unit (`) For Cum Div NAV (`)
Dividend per Unit (`) For
Individuals & HUF Others Individuals & HUF Others
Feb 22, 18 31.809 3.50 3.50 33.423 3.50 3.50Feb 21, 19 26.710 2.75 2.75 28.618 2.75 2.75Feb 20, 20 24.565 2.75 2.75 26.809 2.75 2.75
HDFC Focused 30 Fund (Past 3 years) Dividend Option
Record Date Regular Plan Direct Plan
Cum Div NAV (`)
Dividend per Unit (`) For Cum Div NAV (`)
Dividend per Unit (`) For
Individuals & HUF Others Individuals & HUF Others
Feb 22, 18 21.508 2.25 2.25 22.914 2.25 2.25Feb 21, 19 16.853 1.75 1.75 18.257 1.75 1.75Feb 20, 20 16.110 1.75 1.75 17.776 1.75 1.75
HDFC Arbitrage Fundnormal Dividend Option (Past 3 months)
Record Date Wholesale Plan Direct Plan
Cum Div NAV (`)
Dividend per Unit (`) For Cum Div NAV (`)
Dividend per Unit (`) For
Individuals & HUF Others Individuals & HUF Others
Jul 23, 20 - - - 10.692 0.020 0.020 Oct 22, 20 10.383 0.030 0.030 10.778 0.090 0.090nov 19, 20 - - - 10.721 0.030 0.030
Monthly Dividend Option (Past 3 months)
Record Date Wholesale Plan Wholesale Plan - Direct Plan
Cum Div NAV (`)
Dividend per Unit (`) For Cum Div NAV (`)
Dividend per Unit (`) For
Individuals & HUF Others Individuals & HUF Others
Jul 23, 20 - - - 10.444 0.020 0.020 Oct 22, 20 10.856 0.030 0.030 10.527 0.090 0.090nov 19, 20 - - - 10.469 0.030 0.030
HDFC Growth Opportunities Fund (Past 3 years) Dividend Option
Record Date Regular Plan Direct Plan
Cum Div NAV (`)
Dividend per Unit (`) For Cum Div NAV (`)
Dividend per Unit (`) For
Individuals & HUF Others Individuals & HUF Others
Mar 01, 18 22.901 2.25 2.25 25.854 2.25 2.25Feb 28, 19 19.807 2.00 2.00 22.663 2.00 2.00Feb 27, 20 18.745 2.00 2.00 21.836 2.00 2.00
HDFC Mid-Cap Opportunities Fund (Past 3 years) Dividend Option
Record Date Regular Plan Direct Plan
Cum Div NAV (`)
Dividend per Unit (`) For Cum Div NAV (`)
Dividend per Unit (`) For
Individuals & HUF Others Individuals & HUF Others
Mar 01, 18 34.912 3.00 3.00 41.189 3.00 3.00Feb 28, 19 28.574 2.50 2.50 34.574 2.50 2.50Feb 27, 20 28.084 2.50 2.50 34.848 2.50 2.50
HDFC Small Cap Fund (Past 3 years) Dividend Option
Record Date Regular Plan Direct Plan
Cum Div NAV (`)
Dividend per Unit (`) For Cum Div NAV (`)
Dividend per Unit (`) For
Individuals & HUF Others Individuals & HUF Others
Mar 01, 17 22.892 2.00 2.00 24.040 2.00 2.00Mar 22, 18 28.810 2.75 2.75 30.776 1.00 1.00Mar 27, 19 25.955 2.50 2.50 30.135 0.99 0.99
HDFC Hybrid Equity Fund (Past 3 quarters) Dividend Option
Record Date Regular Plan Direct Plan
Cum Div NAV (`)
Dividend per Unit (`) For Cum Div NAV (`)
Dividend per Unit (`) For
Individuals & HUF Others Individuals & HUF Others
Dec 26, 19 11.4030 0.3200 0.3200 12.1830 0.3200 0.3200Sep 25, 20 10.3190 0.2500 0.2500 11.1000 0.2500 0.2500Dec 28, 20 12.1730 0.2500 0.2500 13.1370 0.2500 0.2500
HDFC Balanced Advantage Fund (Past 3 months) Dividend Option
Record Date Regular Plan Direct Plan
Cum Div NAV (`)
Dividend per Unit (`) For Cum Div NAV (`)
Dividend per Unit (`) For
Individuals & HUF Others Individuals & HUF Others
nov 25, 20 23.343 0.230 0.230 25.271 0.230 0.230Dec 28, 20 25.080 0.230 0.230 - - -Jan 25, 21 25.304 0.230 0.230 27.458 0.230 0.230
HDFC TaxSaver (Past 3 years) Dividend Option(An open-ended equity linked savings scheme with a lock-in period of 3 years)
Record Date Regular Plan Direct Plan
Cum Div NAV (`)
Dividend per Unit (`) For Cum Div NAV (`)
Dividend per Unit (`) For
Individuals & HUF Others Individuals & HUF Others
Mar 15, 18 66.562 7.00 7.00 69.256 7.00 7.00Mar 14, 19 59.483 6.00 6.00 62.638 6.00 6.00Mar 12, 20 39.950 5.00 5.00 42.588 2.37 2.37
HDFC Infrastructure Fund (Past 3 years) Dividend Option
Record Date Regular Plan Direct Plan
Cum Div NAV (`)
Dividend per Unit (`) For Cum Div NAV (`)
Dividend per Unit (`) For
Individuals & HUF Others Individuals & HUF Others
Mar 23, 17 14.388 1.500 1.500 17.736 1.500 1.500Mar 15, 18 14.630 1.750 1.750 18.570 1.750 1.750Mar 27, 19 11.308 1.000 1.000 14.899 1.000 1.000
HDFC Hybrid Debt Fund Monthly Dividend Option (Past 3 months)
Record Date Regular Plan Direct Plan
Cum Div NAV (`)
Dividend per Unit (`) For Cum Div NAV (`)
Dividend per Unit (`) For
Individuals & HUF Others Individuals & HUF Others
nov 25, 20 12.5320 0.0800 0.0800 13.2658 0.0800 0.0800Dec 28, 20 12.8515 0.0800 0.0800 13.6139 0.0800 0.0800Jan 25, 21 12.8668 0.0800 0.0800 13.6395 0.0800 0.0800
quarterly Dividend Option (Past 3 quarters)
Record Date Regular Plan Direct Plan
Cum Div NAV (`)
Dividend per Unit (`) For Cum Div NAV (`)
Dividend per Unit (`) For
Individuals & HUF Others Individuals & HUF Others
Mar 18, 20 12.2732 0.2400 0.2222 12.9046 0.2400 0.2222 Sep 25, 20 12.7280 0.2400 0.2400 13.4441 0.2400 0.2400Dec 28, 20 13.7013 0.2400 0.2400 14.5023 0.2400 0.2400
HDFC Equity Savings Fund (Past 3 quarters) Dividend Option
Record Date Regular Plan Direct Plan
Cum Div NAV (`)
Dividend per Unit (`) For Cum Div NAV (`)
Dividend per Unit (`) For
Individuals & HUF Others Individuals & HUF Others
Dec 26, 19 10.790 0.2210 0.2210 11.715 0.2210 0.2210Sep 25, 20 10.2810 0.2200 0.2200 11.2430 0.2200 0.2200Dec 28, 20 11.2210 0.2200 0.2200 12.3190 0.2200 0.2200

January 2021 83
DIVIDEND HISTORY ^
^ Past performance may or may not be sustained in the future. There is no assurance or guarantee to Unit holders as to rate/quantum of dividend distribution nor that the dividends will be paid regularly. After payment of the dividend, the per Unit nAV falls to the extent of the payout and statutory levy, if any. Please log on to www.hdfcfund.com for Record Date-wise listing of dividends declared.
HDFC Multi-Asset Fund (Past 3 years) Dividend Option
Record Date Regular Plan Direct Plan
Cum Div NAV (`)
Dividend per Unit (`) For Cum Div NAV (`)
Dividend per Unit (`) For
Individuals & HUF Others Individuals & HUF Others
Mar 03, 16 11.9008 0.7223 0.6692 12.5570 0.7223 0.6692Mar 09, 17 12.3216 0.7945 0.7361 13.1369 0.7945 0.7361Mar 01, 18 12.2077 0.7945 0.7361 13.1690 0.7945 0.7361
HDFC Income Fund (Past 3 quarters) quarterly Dividend Option
Record Date Regular Plan Direct Plan
Cum Div NAV (`)
Dividend per Unit (`) For Cum Div NAV (`)
Dividend per Unit (`) For
Individuals & HUF Others Individuals & HUF Others
Jun 25, 20 11.4735 0.2000 0.2000 12.2291 0.2000 0.2000 Sep 25, 20 11.4189 0.1500 0.1500 12.2001 0.1500 0.1500Dec 28, 20 11.5514 0.2000 0.2000 12.3723 0.2000 0.2000
HDFC Dynamic Debt Fundquarterly Dividend Option (Past 3 quarters)
Record Date Regular Plan Direct Plan
Cum Div NAV (`)
Dividend per Unit (`) For Cum Div NAV (`)
Dividend per Unit (`) For
Individuals & HUF Others Individuals & HUF Others
Jun 25, 20 11.8846 0.2000 0.2000 12.6560 0.2000 0.2000 Sep 25, 20 - - - 12.6821 0.2000 0.2000Dec 28, 20 11.9549 0.2000 0.2000 12.7980 0.2000 0.2000
Half-yearly (Dividend Option) (Past 2 years)
Record Date Regular Plan Direct Plan
Cum Div NAV (`)
Dividend per Unit (`) For Cum Div NAV (`)
Dividend per Unit (`) For
Individuals & HUF Others Individuals & HUF Others
Sep 25, 19 11.2879 0.1500 0.1389 - - -Mar 18, 20 11.3908 0.4000 0.3704 - - -Sep 25, 20 11.4630 0.4000 0.4000 - - -
Yearly (Dividend Option) (Past 3 years)
Record Date Regular Plan Direct Plan
Cum Div NAV (`)
Dividend per Unit (`) For Cum Div NAV (`)
Dividend per Unit (`) For
Individuals & HUF Others Individuals & HUF Others
Mar 26, 18 13.0626 0.4000 0.3706 13.6262 0.4000 0.3706Mar 25, 19 12.9184 0.3500 0.3241 13.5824 0.3500 0.3241Mar 18, 20 12.9884 0.5500 0.5093 13.7778 0.5500 0.5093
HDFC Corporate Bond Fundquarterly Dividend Option (Past 3 quarters)
Record Date Regular Plan Direct Plan
Cum Div NAV (`)
Dividend per Unit (`) For Cum Div NAV (`)
Dividend per Unit (`) For
Individuals & HUF Others Individuals & HUF Others
Jun 25, 20 10.8564 0.3810 0.3810 10.9295 0.3650 0.3650 Sep 25, 20 10.6503 0.2120 0.2120 10.7493 0.2910 0.2910Dec 28, 20 10.7407 0.1550 0.1550 10.7698 0.2640 0.2640
HDFC Gilt Fund(Dividend Option) (Past 3 quarters)
Record Date Regular Plan Direct Plan
Cum Div NAV (`)
Dividend per Unit (`) For Cum Div NAV (`)
Dividend per Unit (`) For
Individuals & HUF Others Individuals & HUF Others
Jun 25, 20 12.0405 0.2500 0.2500 12.5041 0.2500 0.2500 Sep 25, 20 11.8842 0.0500 0.0500 12.3650 0.0500 0.0500Dec 28, 20 12.1459 0.2000 0.2000 12.6549 0.2000 0.2000
HDFC Liquid FundMonthly Dividend Option (Past 3 months)
Record Date Regular Plan Direct Plan
Cum Div NAV (`)
Dividend per Unit (`) For Cum Div NAV (`)
Dividend per Unit (`) For
Individuals & HUF Others Individuals & HUF Others
Oct 26, 20 1028.9808 2.6808 2.6808 1029.0598 2.7598 2.7598Dec 01, 20 1029.3488 3.0488 3.0488 1029.4505 3.1505 3.1505Dec 28, 20 1028.2872 1.9872 1.9872 1028.3628 2.0628 2.0628Jan 25, 21 1028.4052 2.1052 2.1052 1028.4868 2.1868 2.1868
HDFC Floating Rate Debt FundMonthly Dividend Option (Past 3 months)
Record Date Regular Plan Direct Plan
Cum Div NAV (`)
Dividend per Unit (`) For Cum Div NAV (`)
Dividend per Unit (`) For
Individuals & HUF Others Individuals & HUF Others
Oct 26, 20 10.2463 0.1022 0.1022 10.2456 0.1015 0.1015Dec 01, 20 10.2335 0.0894 0.0894 10.2359 0.0918 0.0918Dec 28, 20 10.1920 0.0479 0.0479 10.1939 0.0498 0.0498Jan 25, 21 10.1615 0.0174 0.0174 10.1633 0.0192 0.0192
HDFC Low Duration FundMonthly Dividend Option (Past 3 months)
Record Date Regular Plan Direct Plan
Cum Div NAV (`)
Dividend per Unit (`) For Cum Div NAV (`)
Dividend per Unit (`) For
Individuals & HUF Others Individuals & HUF Others
Oct 26, 20 10.2186 0.0786 0.0786 10.2257 0.0832 0.0832Dec 01, 20 10.2138 0.0738 0.0738 10.2224 0.0799 0.0799Dec 28, 20 10.1813 0.0413 0.0413 10.1884 0.0459 0.0459Jan 25, 21 10.1657 0.0257 0.0257 10.1729 0.0304 0.0304
HDFC Credit Risk Debt Fundquarterly Dividend Option (Past 3 quarters)
Record Date Regular Plan Direct Plan
Cum Div NAV (`)
Dividend per Unit (`) For Cum Div NAV (`)
Dividend per Unit (`) For
Individuals & HUF Others Individuals & HUF Others
Jun 25, 20 10.5083 0.1970 0.1970 10.6425 0.2110 0.2110 Sep 25, 20 10.6294 0.3440 0.3440 10.7664 0.3590 0.3590Dec 28, 20 10.6803 0.2150 0.2150 10.8213 0.2050 0.2050
HDFC Ultra Short Term FundMonthly Dividend Option (Past 3 months)
Record Date Regular Plan Direct Plan
Cum Div NAV (`)
Dividend per Unit (`) For Cum Div NAV (`)
Dividend per Unit (`) For
Individuals & HUF Others Individuals & HUF Others
Oct 26, 20 10.1988 0.0488 0.0488 10.1007 0.0507 0.0507Dec 01, 20 10.1942 0.0442 0.0442 10.0968 0.0468 0.0468Dec 28, 20 10.1711 0.0211 0.0211 10.0731 0.0231 0.0231Jan 25, 21 10.1680 0.0180 0.0180 10.0701 0.0201 0.0201

Disclaimer: The views expressed herein are based on internal data, publicly available information and other sources believed to be reliable, but involve uncertainties that could cause actual events to differ materially from those expressed or implied in such statements. The document is given for general and information purpose and is neither an investment advice nor an offer to sell nor a solicitation. While due care has been exercised while preparing this document, HDFC Asset Management Company Limited (“HDFC AMC”) does not warrant the completeness or accuracy of the information. neither HDFC AMC, nor any person connected with it, accepts any liability arising from the use of this material. The recipient of this material should rely on their investigations and take their own professional advice. For latest riskometers, please refer www.hdfcfund.com
HDFC SEnSEx ETF, HDFC Index Fund - SEnSEx Plan (“Schemes”) is based on the S&P BSE SEnSEx Index. S&P® is a registered trademark of S&P Financial Services Limited (S&P). BSE® and SEnSEx® are registered trademarks of BSE Limited. The Schemes is not sponsored, endorsed marketed or promoted by S&P, BSE or their respective affiliates. Please refer to the Scheme Information Document for disclaimers w.r.t. S&P BSE SENSEX Index.
For HDFC nIFTY 50 ETF, HDFC Index Fund - nIFTY 50 Plan and HDFC Banking ETF: The Scheme of HDFC Mutual Fund (the “Product(s)”) are not sponsored, endorsed, sold or promoted by nifty Indices Limited [formerly India Index Services & Products Limited] (“nIL”). nIL does not make any representation or warranty, express or implied, to the owners of the Product(s) or any member of the public regarding the advisability of investing in securities generally or in the Product(s) particularly or the ability of the nIFTY Indices to track general stock market performance in India. The relationship of nIL with HDFC Asset Management Company Limited (“the Issuer/Licensee”) is only in respect of the licensing of the Indices and certain trademarks and trade names associated with such Indices which is determined, composed and calculated by nIL without regard to the Issuer /Licensee or the Product(s). nIL does not have any obligation to take the needs of the Issuer/Licensee or the owners of the Product(s) into consideration in determining, composing or calculating the nIFTY Indices. nIL is not responsible for or has participated in the determination of the timing of, prices at, or quantities of the Product(s) to be issued or in the determination or calculation of the equation by which the Product(s) is to be converted into cash. nIL has no obligation or liability in connection with the administration, marketing or trading of the Product(s).
nIL is engaged in the business of developing, constructing, compiling, computing and maintaining various equity indices. The relationship of nIL to HDFC AMC is only in respect of the rights granted to use certain trademarks and trade names of the Index in connection with the utilisation of the Index data relating to such Index. The Index is determined, composed and calculated by nIL without regard to HDFC AMC. nIL has no obligation to take the needs of HDFC AMC into consideration in determining, composing or calculating the nIFTY Indices.
nIL do not guarantee the accuracy and/or the completeness of nIFTY Indices or any data included therein and they shall have no liability for any errors, omissions, or interruptions therein. nIL make no warranty, express or implied, as to results to be obtained by HDFC AMC or any other person or entity from the use of nIFTY Indices or any data included therein. nIL make no express or implied warranties, and expressly disclaim all warranties of merchantability or fitness for a particular purpose or use with respect to the Index or any data included therein. Without limiting any of the foregoing, NIL expressly disclaim any and all liability for any damages or losses arising out of the use of NIFTY Indices or any data included therein by any third party, including any and all direct, special, punitive, indirect, or consequential damages (including lost profits), even if notified of the possibility of such damages. An investor, by subscribing or purchasing an interest in the Product(s), will be regarded as having acknowledged, understood and accepted the disclaimer referred to in Clauses above and will be bound by it.
WANT TO HAVE THE LATEST INFORMATION ABOUT US?
Visit us at www.hdfcfund.com
Telephone ServicesToll-free number: 1800 3010 6767 / 1800 419 7676
For any query or suggestions:-
Investors may contact us at:[email protected]
Distributors may contact us at:[email protected]
SMS: HDFCMF to 56767
Registered Office: HDFC House, 2nd Floor, H.T. Parekh Marg, 165-166 Backbay Reclamation, Churchgate, Mumbai - 400 020.
MUTUAL FUND INVESTMENTS ARE SUBJECT TO MARkET RISkS, READ ALL SCHEME RELATED DOCUMENTS CAREFULLY.
UPDATION OF PAN OF ALL UNITHOLDERS IN THE FOLIOS IS MANDATORY FOR PROCESSING OF REDEMPTION AND RELATED TRANSACTIONS
It is Mandatory to complete the kYC requirements for all unit holders, including for all joint holders and the guardian in case of folio of a minor investor. Accordingly, financial transactions (including redemptions, switches and all types of systematic plans) will not be processed if the unit holders have not completed kYC requirements
Date of Release: February 12, 2021