Embed Size (px)
Citation preview

Inversion of spectral absorption in the optically complex coastal
waters of the Mid-Atlantic Bight
Oscar Schofield,1 Trisha Bergmann,1 Mathew J. Oliver,1 Andrew Irwin,1
Gary Kirkpatrick,2 W. Paul Bissett,3 Mark A. Moline,4 and Cris Orrico4
Received 29 July 2003; revised 11 June 2004; accepted 21 July 2004; published 28 December 2004.
[1] Recent advances in hydrologic optics offer the potential for quantitative maps ofinherent optical properties, which can be inverted into optically significant constituents.During summer experiments in the Mid-Atlantic Bight (MAB) a procedure to invert bulkabsorption measurements from off-the-shelf technology was developed. The inversionprovides optical concentration estimates of phytoplankton, colored dissolved organicmatter (CDOM), and detritus. Inversion estimates were validated against chlorophyllfluorescence, filter pad absorption, and phytoplankton pigment measurements. Theinversion could account for up to 90% of the observed variance in particulates, CDOM,and detritus. Robust estimates for phytoplankton community composition could beachieved but required constraints on the inversion that phytoplankton dominate the redlight absorption. Estimates for the composition, as indicated by spectral slopes, for CDOMand detritus were not robust. During the summer months in nearshore waters of the MAB,total absorption was almost equally associated (±10%) with phytoplankton, detritus,and CDOM, and the regions of variability were associated with major frontal boundaries.The variance between particulates, CDOM, and detritus varied spatially and with year;which precluded robust correlations. INDEX TERMS: 4847 Oceanography: Biological and
Chemical: Optics; 4855 Oceanography: Biological and Chemical: Plankton; 4899 Oceanography: Biological
and Chemical: General or miscellaneous; KEYWORDS: absorption, phytoplankton, bio-optics, water mass
analysis
Citation: Schofield, O., T. Bergmann, M. J. Oliver, A. Irwin, G. Kirkpatrick, W. P. Bissett, M. A. Moline, and C. Orrico (2004),
Inversion of spectral absorption in the optically complex coastal waters of the Mid-Atlantic Bight, J. Geophys. Res., 109, C12S04,
doi:10.1029/2003JC002071.
1. Introduction
[2] Traditional ‘‘conservative’’ parameters (e.g., temper-ature and salinity) have been used to track water masses fornearly a century but developing additional parameters fromchemical signatures to extend water type identification andwater mass analysis into multidimensional space is of greatutility [Tomczak, 1999]. Such a capability would improveadaptive sampling strategies [Robinson and Glenn, 1999],allowing researchers to study how water masses evolve andoptimize ocean observing networks.[3] It has been suggested that traditional water mass
markers might be complemented with standard biologicalmeasurements such as chlorophyll [Tomczak, 1999] as anadditional dimension would improve resolving water typesin parameter space. Chlorophyll is a logical choice for this
additional discrimination dimension, as it the preeminentproxy for phytoplankton abundance and can be estimatedrelatively easily by satellites and in situ sensors. Fluorometryis a powerful in situ mapping approach; however, variabilityin the fluorescence quantum yields requires local calibrationdata for deriving any quantitative estimate. This is difficultas changes in the fluorescence quantum yield reflect sensi-tivities to both the incident spectral irradiance and overallphytoplankton physiology [Kiefer, 1973; Cullen, 1982;Falkowski and Kiefer, 1985], both of which can change onthe timescale of hours to days [cf. Falkowski and Raven,1997].[4] Another potential variable might be colored dissolved
organic matter (CDOM), which has been used successfullyto calibrate mass transport [Aarup et al., 1996; Højerslevet al., 1996]. Most coastal systems reflect the opticalcontributions of numerous in-water constituents (water,phytoplankton, CDOM, detritus, and sediment). This opticalcomplexity compromises the accuracy of the satellite-derived products [cf. Kirk, 1994; Mobley, 1994]; however,this complex matrix of materials provides a potential libraryof parameters that might be effective for discriminatingwater types if methods could be developed that providereliable estimates of the optically significant constituentspresent.
JOURNAL OF GEOPHYSICAL RESEARCH, VOL. 109, C12S04, doi:10.1029/2003JC002071, 2004
1Coastal Ocean Observation Lab, Institute of Marine and CoastalSciences, Rutgers University, New Brunswick, New Jersey, USA.
2Mote Marine Laboratory, Sarasota, Florida, USA.3Florida Environmental Research Institute, Tampa, Florida, USA.4Biological Sciences Department, California Polytechnic State
University, San Luis Obispo, California, USA.
Copyright 2004 by the American Geophysical Union.0148-0227/04/2003JC002071$09.00
C12S04 1 of 12
[5] Significant effort over the last decade has focused onmeasuring the spectral dependency of the in situ inherentoptical properties (IOPs). The reliability in situ instrumenta-tion that can measure the spectral IOPs is increasing [Pegauet al., 1995; Twardowski et al., 1999; Chang and Dickey,1999; Schofield et al., 1999; Boss et al., 2001]. A majoradvantage of these parameters is that they can be inverted toprovide weights for optically active components (e.g., water,colored dissolved organic matter (CDOM), phytoplankton,detritus, sediment, etc.). These optical weights are propor-tional to component concentration [Roesler and Perry, 1995;Chang and Dickey, 1999; Schofield et al., 1999; Gallegosand Neale, 2002]. These inversion techniques are oftenbased on estimating the total absorption using generalizedspectral absorption shapes for one or more of the individualabsorbing components or using absorption ratios of differentwavelengths that vary in a predictable way according to thecomponents present. While promising in theory, the accuracyof these inverted measurements have not been systematicallyassessed over the wide optical gradients present in thenearshore coastal ocean. Furthermore, the performance ofinversion techniques that do not require any ‘‘optimized’’local in situ data to derive the generalized shapes has yet tobe assessed. Ideally, minimal ‘‘local’’ tuning should beapplied to these inversion techniques as this would allowfor a ‘‘global’’ mechanistic approach, which is particularlyimportant in complex coastal waters where local empiricalrelationships are likely to be extremely variable.[6] In this manuscript, we assess the application of a
simple optical inversion method using off-the-shelf ocean-ographic equipment for deriving optical parameters andassess the utility of the derived optical parameters todifferentiate water types in the coastal ocean. Our goal isto assess how much information can be inverted fromabsorption data given a fixed number of wavelengths, whichcan then be used to determine the ‘‘optical’’ state ofnearshore coastal waters.
2. Methods
2.1. Field Data
[7] The field efforts were conducted at the Long-termEcosystem Observatory (LEO) off the central coast of NewJersey [Glenn et al., 1998, 2000; Schofield et al., 2002]during the ONR-sponsored Hyperspectral Coastal OceanDynamics Experiments (HyCODE) and the Coastal OceanModeling and Observation Program (COMOP). The LEOsystem is a highly instrumented 30 by 30 km research sitethat represents a coupled model/observation system wherereal-time data and model forecasts are provided to optimizefield sampling [Glenn et al., 1998; Schofield et al., 2002].For bio-optical research, one advantage of the field site isthat it ranges from very turbid estuarine waters to relativelyclear offshore waters within the 30 km research box. Theseoptical gradients reflect the variable contributions ofmany optically active constituents such as phytoplankton,sediments, CDOM, and detritus.[8] The standard shipboard transects consisted of several
15–25 km cross-shelf transects. Specific transect lines andthe locations of the stations were determined by the real-time data from ocean forecast models, ships, and satellitesfocused on characterizing coastal upwelling dynamics
[Schofield et al., 2002]. At each station, vertical profiles ofoptical and physical data were collected using an integratedbio-optical package. The bio-optical package consisted ofa WET Labs Inc. absorption/attenuation meter (ac-9), aFalmouth CTD, a profiling Satlantic spectral radiometer,and a HOBI Labs backscatter sensor (Hydroscat-6). Themeasurements of the inherent optical properties used in thisstudy were collected using the standard nine wavelengths(412, 440, 488, 510, 555, 630, 650, 676, and 715 nm) of theWET Labs Inc. ac-9. At each station, the instrument waslowered to depth to remove air bubbles and the instrumentwas allowed to equilibrate with ambient temperature beforedata were collected. Only data from the upcasts wereutilized. Data were averaged into 0.25 m depth bins for allsubsequent analyses. The instruments were factory calibratedprior to the field season. Manufacturer recommended pro-tocols (http://www.WET Labs Inc.com/otherinfo/ugftp.htm)were used to track instrument calibration throughout thefield season. This included clean water, temperature, andsalinity calibrations. Whenever possible daily water calibra-tions were conducted; however, sampling schedules did notalways allow for a daily calibration. Under these circum-stances the most recent water calibration was used. It shouldbe noted that this period without a calibration was at mostthree days.[9] A CDOM absorption mapping system was installed
on the ship [Kirkpatrick et al., 2003], which consisted of aliquid waveguide capillary cell (LWCC, World PrecisionInstruments, Inc.) coupled to a fiber-optic spectrometer(S2000, Ocean Optics, Inc.) and a fiber-optic xenon flashlamp (PS-2, Ocean Optics, Inc.). Water was pumped byminiature peristaltic pump (P625, Instech Laboratories, Inc.)through size fractionation and cross-flow filters (MicroKros,Spectrum Laboratories, Inc.) and then through the LWCCfor optical density spectra measurements. A continuousunderway water supply was provided by tapping the flowthrough the ship’s fire suppression system. Details regardingthe LWCC operation procedures are given by Kirkpatrick etal. [2003].[10] At each ship occupied station, water was collected
with Niskin bottles from both surface and bottom waters.Aliquots were filtered, under low vacuum (<10 cm Hg),through GF/F (Whatman) glass fiber filters to concentratethe particles for pigment and absorption determinations.Filters were placed into snap top vials and quick frozen inliquid nitrogen. Samples were stored at �80�C until lateranalysis. Filters were analyzed for photosynthetic andphotoprotective pigment complements were determinedusing high-performance liquid chromatography (HPLC)according to procedures of Wright et al. [1991]. Filter padabsorption was measured on a laboratory spectrophotome-ter; spectra were corrected for the path length amplificationfactor according to the procedures outlined by Roesler[1998]. Detrital absorption was determined by methanolextraction of particulate material according to Kishino et al.[1985]. The detrital absorption was subtracted from partic-ulate absorption to provide an estimate of phytoplanktonabsorption. For discrete CDOM spectra, water was filteredthrough a 0.2 micron Nucleopore filter, and measured on aspectrophotometer using a 5 cm long path length cuvette.[11] A second in situ data set was collected using a
bottom mounted winch that profiled an instrument package
C12S04 SCHOFIELD ET AL.: INVERSION OF BULK OPTICS
2 of 12
C12S04
containing The Optical Profiler included a WET Labs ac-9sampling at 6 Hz, and a two-wavelength backscatter/fluo-rometer HOBI Labs HydroScat-2 sampling at 2 Hz. TheOptical Profiler was also profiled at 2 cm s�1. The profilerwas connected to the electro-fiber-optic LEO cable, allow-ing real-time data transmission back to shore. A detaileddescription of this system is provided by Oliver et al.[2004b]. This data set was complemented with a radioiso-tope data set [cf. Oliver et al., 2004b] and that allowed us toassess the proportion of the water that was light saturatedfor photosynthesis.
2.2. Inversion of in Situ Absorption Data
[12] The optical signature inversion method (OSI) usesmeasured spectral absorption data collected from the ac-9 tocalculate optical weight specific absorption coefficients formaterial present in the water column. The OSI modelcalculates optical weight specific coefficients (wi) andexponential slopes (s, r) using a nonlinear constrainedleast-squares regression according to
atotal lð Þ ¼ w1aPhyto1 lð Þ þ w2aPhyto2 lð Þ þ w3aPhyto3 lð Þþ w4aCDOM l; sð Þ þ w5aDetritus l; rð Þ ð1Þ
where atotal(l) is the total spectral absorption measured withthe ac-9 (note that ac-9 provides an absorption that hasalready subtracted the contribution due to water), aPhyto1(l),aPhyto2(l), and aPhyto3(l) are generalized spectral absorptionof chlorophyll a-c, phycobilin, and chlorophyll a-b contain-ing phytoplankton, respectively, and aCDOM(l, s) andaDetritus(l, r) are the spectral absorption of CDOM anddetritus (Figure 1). The CDOM absorption (and detritusabsorption) can be described as an idealized curve as afunction of wavelength and exponential slope [Kalle, 1966;Bricaud et al., 1981; Green and Blough, 1994],
aCDOM lð Þ ¼ aCDOM exp �s � l� 412nmð Þ½ � ð2Þ
The exponential s parameter (unitless) is dependent on thecomposition of the CDOM present and is highly variable[Carder et al., 1989; Roesler et al., 1989]. Therefore it wasnecessary to allow the CDOM and detritus exponentialslopes to vary spatially and temporally to achieve reason-able estimates. The initial exponential slopes of CDOM
were set to 0.010. The detritus exponential slope wasinitially set to 0.008. The slopes of the detrital curves (r)are lower [cf. Kirk, 1994] and detritus is described byequation (3),
aDetritus lð Þ ¼ aDetritus exp �r � l� 412nmð Þ½ � ð3Þ
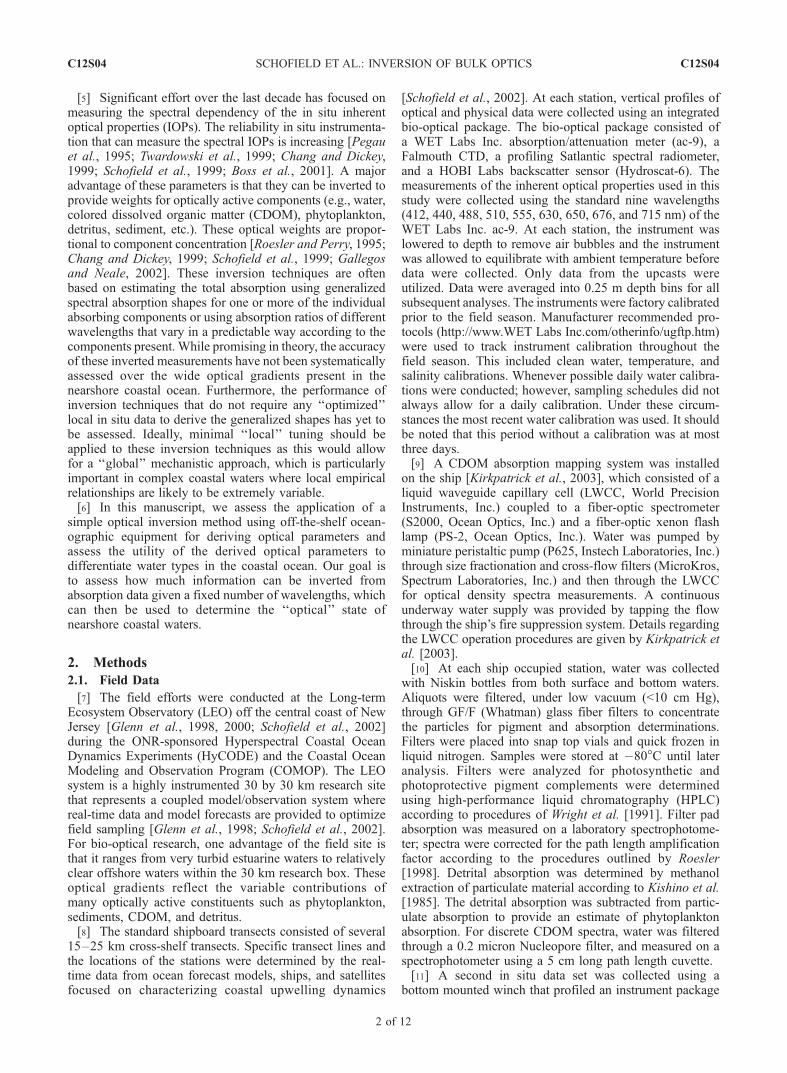
[13] The values of w1, w2, w3, w4, and w5 are nonspec-trally dependent scalar coefficients of these input spectra.We used fixed absorption spectra measured on laboratorycultures in order to ensure that inversion was completelyindependent from any spectral curves encountered in thefield. Spectral phytoplankton curves were of averages ofhigh-light- and low-light-acclimated phytoplankton spectrathat were normalized to absorption at 676 nm. The spectrallibrary used was taken from Johnsen et al. [1994] (Figure 1).While not optimal, we believe it was reasonable since thefirst-order determinant of spectral optical signals reflects theoverall concentration of material rather than spectral char-acteristics of the materials present [Barnard et al., 1998].[14] We used two different inversion approaches, one
with more constraints than the other. The minimal constraintOSI (OSIm) only required that all solutions be positive(equation (4)), that CDOM and detritus absorption weightswere equal in the red wavelengths of light (equation (5)),and that the CDOM exponential slope is steeper than thedetrital slope (equation (6)). The assumption that theCDOM and detritus absorption is equal is artificial but weknow that CDOM and detritus absorption is very low in thered wavelengths as both are exponentially decreasingcurves. There are two artificial ways to ensure that theCDOM and detritus absorption do not dominate the redlight absorption where phytoplankton absorption dominates.One method, more commonly used, is to set the magnitudeof CDOM and detritus red absorption to a fixed low value.The second method is to anchor both curves to each other inthe red, which allows the exponential slopes and amplitudesto be determined largely by the blue wavelength absorption.This second method allows the red light absorption ofCDOM and detritus to be variable. The second OSI method(OSIc) added constraints so that phytoplankton absorptiondominated in the red wavelengths (equations (7) and (8)),and that minor phytoplankton communities in these waters(here chlorophytes) were never dominant (equations (9) and(10)). Specifically, the constraints on the OSI optimizationswere:
w1aPhyto1 lð Þ;w2aPhyto2 lð Þ;w3aPhyto3 lð Þ;w4aCDOM l; sð Þ;w5aDetritus l; rð Þ 0 ð4Þ
w4aCDOM 676nm; sð Þ ¼ w5aDetritus 676nm; rð Þ ð5Þ
s r ð6Þ
w1aPhyto1 676nmð Þ w4aCDOM 676nm; sð Þþ w5aDetritus 676nm; rð Þ 0 ð7Þ
w2aPhyto2 676nmð Þ w4aCDOM 676nm; sð Þþ w5aDetritus 676nm; rð Þ 0 ð8Þ
w1aPhyto1 lð Þ w3aPhyto3 lð Þ ð9Þ
w2aPhyto2 lð Þ w3aPhyto3 lð Þ ð10Þ
Figure 1. The input spectra used in the ac-9 inversion.Note that the spectral slopes for the CDOM and detrituswere allowed to vary.
C12S04 SCHOFIELD ET AL.: INVERSION OF BULK OPTICS
3 of 12
C12S04
[15] These assumptions were based on 5 years ofexperience in coastal New Jersey waters spanning boththe nearshore and offshore. It should be noted that theOSIm and OSIc inversion methods using the sameassumptions have been successfully used in both theoligotrophic Gulf of Mexico and the southern basin ofLake Michigan (unpublished data). When the OSI method(OSIm and OSIc) did not converge on a solution, the datawere omitted from the later analysis (<5% of the totalNew Jersey data set). This generally reflected noise in theac-9 data most often in near surface waters, presumablyrelated to air bubbles, which interfered with naturalinflections in the absorption curve. Of all the constraints,the requirement that green algae were always less abun-dant than chlorophyll c and phycobilin containing algaewas admittedly the most artificial. However, running theinversion without the constraint greatly compromised theefficacy of the inversion for the overall phytoplanktonabsorption spectra. Omitting the chlorophytic algae alsocompromised the efficacy of the OSI method (data notshown). Phytoplankton pigment concentrations from dis-crete measurements during this study also confirmed thatthis assumption was valid as it was also confirmed abackground population of green algae was detectable [Molineet al., 2004]. To assess the stability of the OSI, random noisewas introduced into the ac-9 spectra. For this analysis weadded +0.005 m�1 to the data randomly across all wave-lengths. Results indicated that there was no spectral bias andthe quantitative impact was less than 1%.
3. Results and Discussion
3.1. Verification of the Derived Optical Products
[16] OSI-derived particulate, detrital, and phytoplanktonloads were compared to three independent data sets thatincluded stimulated chlorophyll fluorescence, phytoplanktonfilter pad absorption measurements, and HPLC phytoplank-ton pigment concentrations. All three data comparisonssuggested that the OSI method provided reasonable estimates
of particulate, phytoplankton, detritus, and CDOM opticalweights.3.1.1. Fluorescence[17] The ac-9-derived phytoplankton absorption and stim-
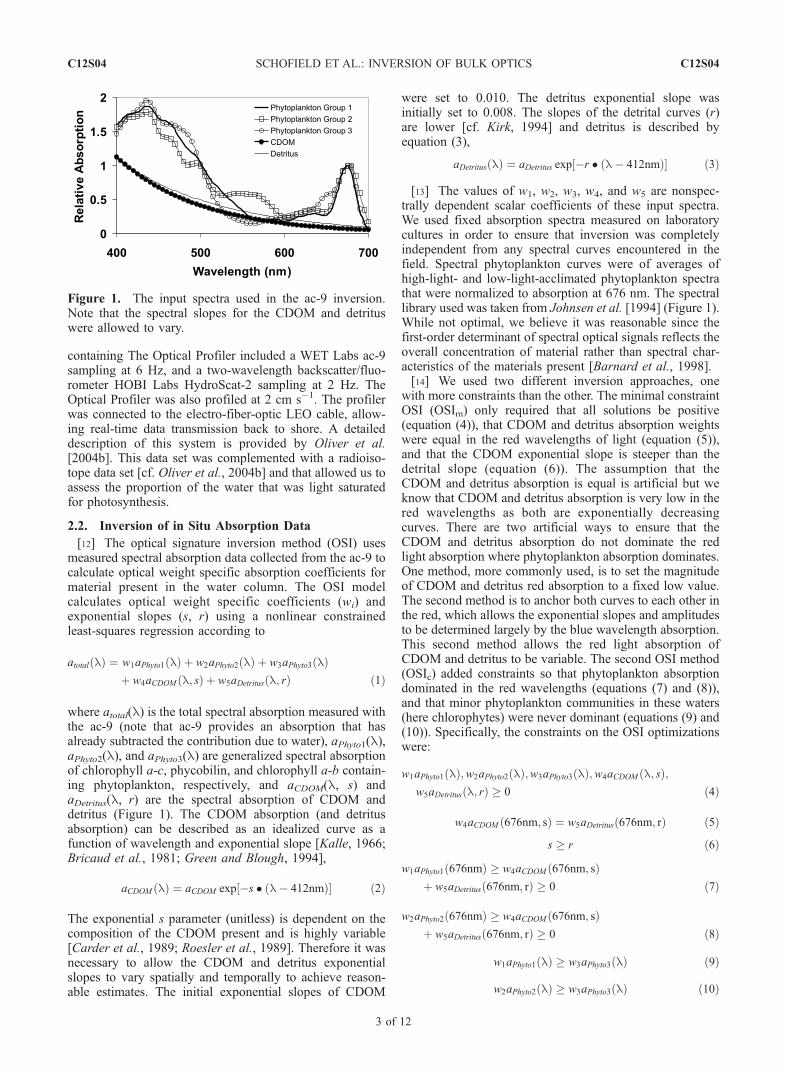
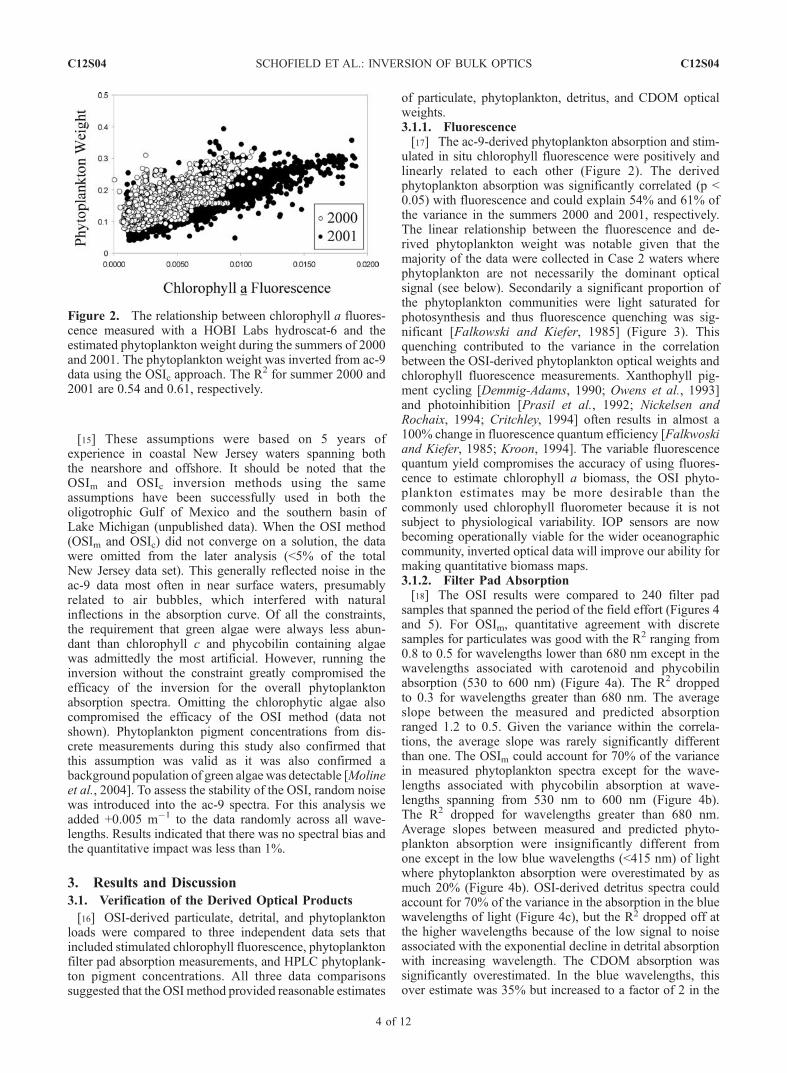
ulated in situ chlorophyll fluorescence were positively andlinearly related to each other (Figure 2). The derivedphytoplankton absorption was significantly correlated (p <0.05) with fluorescence and could explain 54% and 61% ofthe variance in the summers 2000 and 2001, respectively.The linear relationship between the fluorescence and de-rived phytoplankton weight was notable given that themajority of the data were collected in Case 2 waters wherephytoplankton are not necessarily the dominant opticalsignal (see below). Secondarily a significant proportion ofthe phytoplankton communities were light saturated forphotosynthesis and thus fluorescence quenching was sig-nificant [Falkowski and Kiefer, 1985] (Figure 3). Thisquenching contributed to the variance in the correlationbetween the OSI-derived phytoplankton optical weights andchlorophyll fluorescence measurements. Xanthophyll pig-ment cycling [Demmig-Adams, 1990; Owens et al., 1993]and photoinhibition [Prasil et al., 1992; Nickelsen andRochaix, 1994; Critchley, 1994] often results in almost a100% change in fluorescence quantum efficiency [Falkwoskiand Kiefer, 1985; Kroon, 1994]. The variable fluorescencequantum yield compromises the accuracy of using fluores-cence to estimate chlorophyll a biomass, the OSI phyto-plankton estimates may be more desirable than thecommonly used chlorophyll fluorometer because it is notsubject to physiological variability. IOP sensors are nowbecoming operationally viable for the wider oceanographiccommunity, inverted optical data will improve our ability formaking quantitative biomass maps.3.1.2. Filter Pad Absorption[18] The OSI results were compared to 240 filter pad
samples that spanned the period of the field effort (Figures 4and 5). For OSIm, quantitative agreement with discretesamples for particulates was good with the R2 ranging from0.8 to 0.5 for wavelengths lower than 680 nm except in thewavelengths associated with carotenoid and phycobilinabsorption (530 to 600 nm) (Figure 4a). The R2 droppedto 0.3 for wavelengths greater than 680 nm. The averageslope between the measured and predicted absorptionranged 1.2 to 0.5. Given the variance within the correla-tions, the average slope was rarely significantly differentthan one. The OSIm could account for 70% of the variancein measured phytoplankton spectra except for the wave-lengths associated with phycobilin absorption at wave-lengths spanning from 530 nm to 600 nm (Figure 4b).The R2 dropped for wavelengths greater than 680 nm.Average slopes between measured and predicted phyto-plankton absorption were insignificantly different fromone except in the low blue wavelengths (<415 nm) of lightwhere phytoplankton absorption were overestimated by asmuch 20% (Figure 4b). OSI-derived detritus spectra couldaccount for 70% of the variance in the absorption in the bluewavelengths of light (Figure 4c), but the R2 dropped off atthe higher wavelengths because of the low signal to noiseassociated with the exponential decline in detrital absorptionwith increasing wavelength. The CDOM absorption wassignificantly overestimated. In the blue wavelengths, thisover estimate was 35% but increased to a factor of 2 in the
Figure 2. The relationship between chlorophyll a fluores-cence measured with a HOBI Labs hydroscat-6 and theestimated phytoplankton weight during the summers of 2000and 2001. The phytoplankton weight was inverted from ac-9data using the OSIc approach. The R
2 for summer 2000 and2001 are 0.54 and 0.61, respectively.
C12S04 SCHOFIELD ET AL.: INVERSION OF BULK OPTICS
4 of 12
C12S04
green orange wavelengths of light (Figure 4d); however,the OSIm-derived CDOM absorption could account 88%of the variance in the measured CDOM absorption in theblue wavelengths of light. Similar to the detritus the R2
decreased with increasing wavelength because of decreasingsignal to noise.[19] For the OSIc the quantitative agreement between
measured and modeled particulate spectra was good, withthe R2 ranging from 0. 5 to 0.9 with low values associatedwith wavelengths greater than 680 nm (Figure 5a). Theslope between the measured and modeled particulate spectraranged from 1.2 to 0.8 depending on wavelength (Figure 5a)and the variance was reduced from the OSIm approachespecially in the wavelengths associated with phycobilinand carotenoid absorption (530–580 nm). For the majorityof the wavelengths, the deviations of the average slope from1 were rarely statistically significant (Figure 5a). Quantita-tive agreement decreased in the red wavelengths of lightwhere signal was low. Results indicate that the derivedparticulate spectra could be quantitatively derived from theac-9 with minor spectral biases despite that only idealizedspectral absorption shapes were used. Like the particulatespectra, the agreement for the OSI and measured phyto-plankton spectra were good (Figure 5b). The largestmismatches were in the blue wavelengths of light but 70–80% of the observed variance in the measured spectra weredescribed by the OSIc and as with the particulate spectrathe errors were lower compared to the OSIm method.
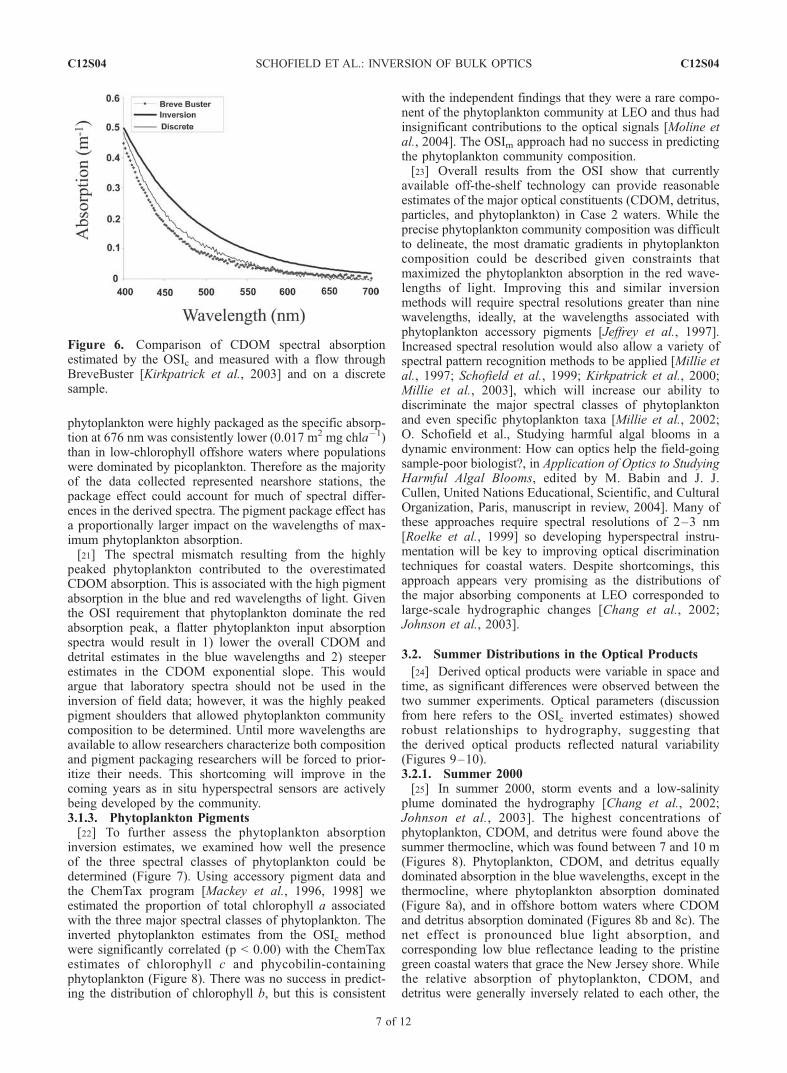
Quantitative estimates for detritus were good (Figure 5c),but accuracy dropped in the higher wavelengths because oflow detrital absorption. The OSIc method showed noimprovements over the OSIm method for predicting CDOMabsorption, with the overall CDOM absorption beingoverestimated significantly (Figure 5d). For both OSImand OSIc the spectral slope of the CDOM was underesti-mated especially when discrete samples indicated highslopes (Figure 6).[20] In our approach, the input spectra for the OSI
were based on laboratory data [Johnsen et al., 1994] andtheoretical curves, so the OSI methods could undoubtedlybe improved by customizing the input spectra for anyparticular location. Our goal, however, was to assess whatcould be derived using no local input data. The relativeparticulate spectra derived by the OSIc approach overesti-mated absorption at wavelengths of peak phytoplanktonabsorption (420–540 and 660–680 nm). This is consistentwith the well-documented package effect, where absorptionspectra are ‘‘flattened’’ when pigment packaged within acell [Morel and Bricaud, 1986]. The package effect isgreatest in the wavelengths of maximal absorption andincreases with increasing cell size and cellular concentrationof pigment. In higher-chlorophyll waters nearshore, watersamples revealed high populations of large net diatoms[Moline et al., 2004], which have been found to be greatlyaffected by the pigment package effect [Bricaud et al.,1995]. Filter pad measurements support the hypothesis that
Figure 3. The relationship between chlorophyll for fluorescence and the OSIc-derived spectrallyweighted absorption for phytoplankton communities at the Optical Profiler. Note that the nonlinearitybetween phytoplankton absorption and chlorophyll fluorescence measurements occurs in surface watersduring periods of light saturation as a result of fluorescence quenching, which reflects a lowerfluorescence quantum yield. Light saturation was determined with radio isotope productivitymeasurements [Oliver et al., 2004b] were made on discrete water samples collected at the OpticalProfiler.
C12S04 SCHOFIELD ET AL.: INVERSION OF BULK OPTICS
5 of 12
C12S04
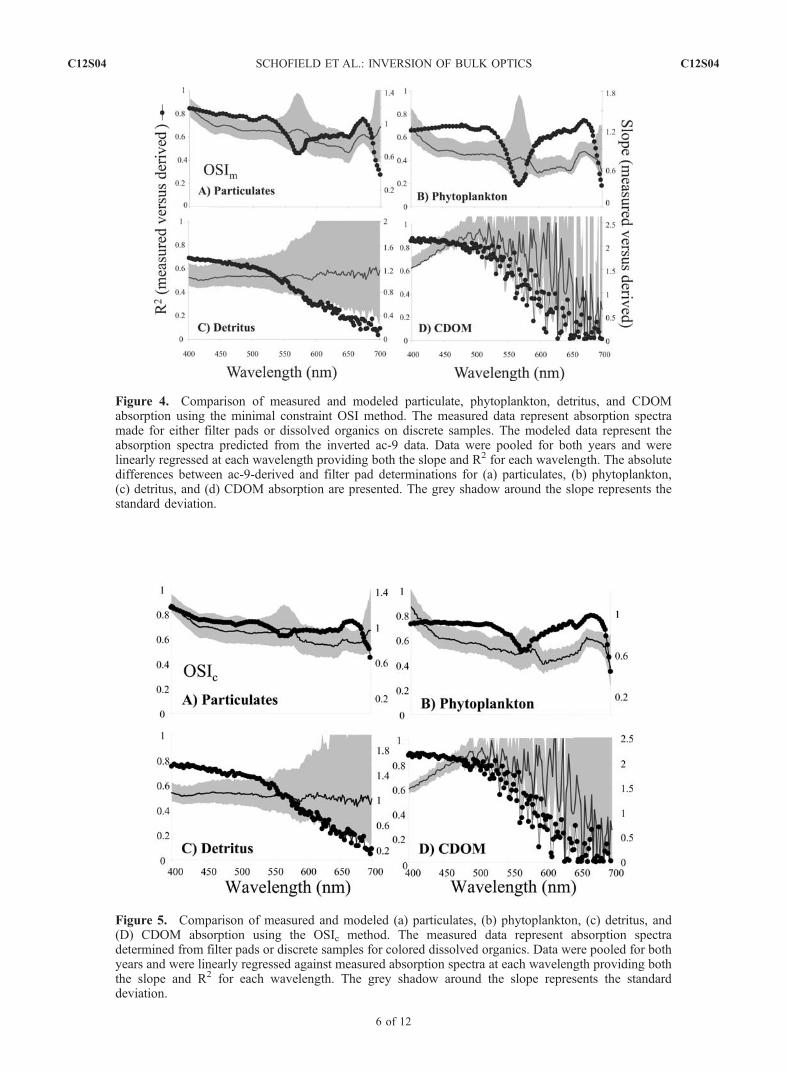
Figure 5. Comparison of measured and modeled (a) particulates, (b) phytoplankton, (c) detritus, and(D) CDOM absorption using the OSIc method. The measured data represent absorption spectradetermined from filter pads or discrete samples for colored dissolved organics. Data were pooled for bothyears and were linearly regressed against measured absorption spectra at each wavelength providing boththe slope and R2 for each wavelength. The grey shadow around the slope represents the standarddeviation.
Figure 4. Comparison of measured and modeled particulate, phytoplankton, detritus, and CDOMabsorption using the minimal constraint OSI method. The measured data represent absorption spectramade for either filter pads or dissolved organics on discrete samples. The modeled data represent theabsorption spectra predicted from the inverted ac-9 data. Data were pooled for both years and werelinearly regressed at each wavelength providing both the slope and R2 for each wavelength. The absolutedifferences between ac-9-derived and filter pad determinations for (a) particulates, (b) phytoplankton,(c) detritus, and (d) CDOM absorption are presented. The grey shadow around the slope represents thestandard deviation.
C12S04 SCHOFIELD ET AL.: INVERSION OF BULK OPTICS
6 of 12
C12S04
phytoplankton were highly packaged as the specific absorp-tion at 676 nm was consistently lower (0.017 m2 mg chla�1)than in low-chlorophyll offshore waters where populationswere dominated by picoplankton. Therefore as the majorityof the data collected represented nearshore stations, thepackage effect could account for much of spectral differ-ences in the derived spectra. The pigment package effect hasa proportionally larger impact on the wavelengths of max-imum phytoplankton absorption.[21] The spectral mismatch resulting from the highly
peaked phytoplankton contributed to the overestimatedCDOM absorption. This is associated with the high pigmentabsorption in the blue and red wavelengths of light. Giventhe OSI requirement that phytoplankton dominate the redabsorption peak, a flatter phytoplankton input absorptionspectra would result in 1) lower the overall CDOM anddetrital estimates in the blue wavelengths and 2) steeperestimates in the CDOM exponential slope. This wouldargue that laboratory spectra should not be used in theinversion of field data; however, it was the highly peakedpigment shoulders that allowed phytoplankton communitycomposition to be determined. Until more wavelengths areavailable to allow researchers characterize both compositionand pigment packaging researchers will be forced to prior-itize their needs. This shortcoming will improve in thecoming years as in situ hyperspectral sensors are activelybeing developed by the community.3.1.3. Phytoplankton Pigments[22] To further assess the phytoplankton absorption
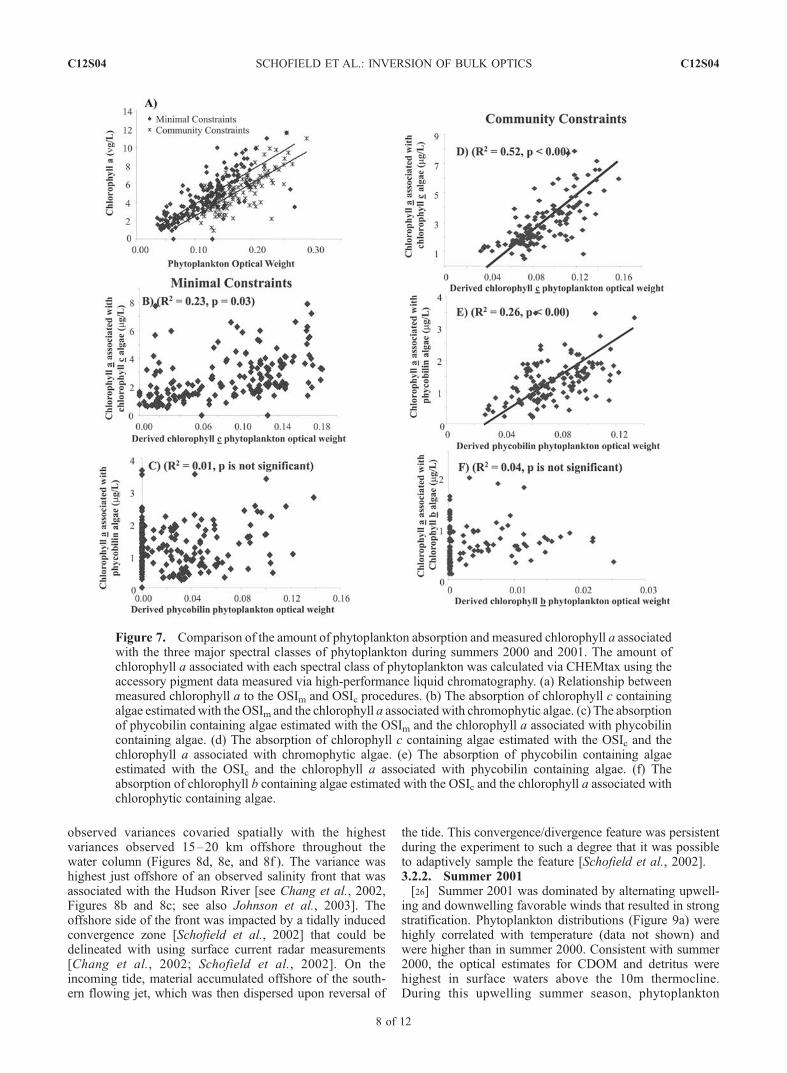
inversion estimates, we examined how well the presenceof the three spectral classes of phytoplankton could bedetermined (Figure 7). Using accessory pigment data andthe ChemTax program [Mackey et al., 1996, 1998] weestimated the proportion of total chlorophyll a associatedwith the three major spectral classes of phytoplankton. Theinverted phytoplankton estimates from the OSIc methodwere significantly correlated (p < 0.00) with the ChemTaxestimates of chlorophyll c and phycobilin-containingphytoplankton (Figure 8). There was no success in predict-ing the distribution of chlorophyll b, but this is consistent
with the independent findings that they were a rare compo-nent of the phytoplankton community at LEO and thus hadinsignificant contributions to the optical signals [Moline etal., 2004]. The OSIm approach had no success in predictingthe phytoplankton community composition.[23] Overall results from the OSI show that currently
available off-the-shelf technology can provide reasonableestimates of the major optical constituents (CDOM, detritus,particles, and phytoplankton) in Case 2 waters. While theprecise phytoplankton community composition was difficultto delineate, the most dramatic gradients in phytoplanktoncomposition could be described given constraints thatmaximized the phytoplankton absorption in the red wave-lengths of light. Improving this and similar inversionmethods will require spectral resolutions greater than ninewavelengths, ideally, at the wavelengths associated withphytoplankton accessory pigments [Jeffrey et al., 1997].Increased spectral resolution would also allow a variety ofspectral pattern recognition methods to be applied [Millie etal., 1997; Schofield et al., 1999; Kirkpatrick et al., 2000;Millie et al., 2003], which will increase our ability todiscriminate the major spectral classes of phytoplanktonand even specific phytoplankton taxa [Millie et al., 2002;O. Schofield et al., Studying harmful algal blooms in adynamic environment: How can optics help the field-goingsample-poor biologist?, in Application of Optics to StudyingHarmful Algal Blooms, edited by M. Babin and J. J.Cullen, United Nations Educational, Scientific, and CulturalOrganization, Paris, manuscript in review, 2004]. Many ofthese approaches require spectral resolutions of 2–3 nm[Roelke et al., 1999] so developing hyperspectral instru-mentation will be key to improving optical discriminationtechniques for coastal waters. Despite shortcomings, thisapproach appears very promising as the distributions ofthe major absorbing components at LEO corresponded tolarge-scale hydrographic changes [Chang et al., 2002;Johnson et al., 2003].
3.2. Summer Distributions in the Optical Products
[24] Derived optical products were variable in space andtime, as significant differences were observed between thetwo summer experiments. Optical parameters (discussionfrom here refers to the OSIc inverted estimates) showedrobust relationships to hydrography, suggesting thatthe derived optical products reflected natural variability(Figures 9–10).3.2.1. Summer 2000[25] In summer 2000, storm events and a low-salinity
plume dominated the hydrography [Chang et al., 2002;Johnson et al., 2003]. The highest concentrations ofphytoplankton, CDOM, and detritus were found above thesummer thermocline, which was found between 7 and 10 m(Figures 8). Phytoplankton, CDOM, and detritus equallydominated absorption in the blue wavelengths, except in thethermocline, where phytoplankton absorption dominated(Figure 8a), and in offshore bottom waters where CDOMand detritus absorption dominated (Figures 8b and 8c). Thenet effect is pronounced blue light absorption, andcorresponding low blue reflectance leading to the pristinegreen coastal waters that grace the New Jersey shore. Whilethe relative absorption of phytoplankton, CDOM, anddetritus were generally inversely related to each other, the
Figure 6. Comparison of CDOM spectral absorptionestimated by the OSIc and measured with a flow throughBreveBuster [Kirkpatrick et al., 2003] and on a discretesample.
C12S04 SCHOFIELD ET AL.: INVERSION OF BULK OPTICS
7 of 12
C12S04
observed variances covaried spatially with the highestvariances observed 15–20 km offshore throughout thewater column (Figures 8d, 8e, and 8f ). The variance washighest just offshore of an observed salinity front that wasassociated with the Hudson River [see Chang et al., 2002,Figures 8b and 8c; see also Johnson et al., 2003]. Theoffshore side of the front was impacted by a tidally inducedconvergence zone [Schofield et al., 2002] that could bedelineated with using surface current radar measurements[Chang et al., 2002; Schofield et al., 2002]. On theincoming tide, material accumulated offshore of the south-ern flowing jet, which was then dispersed upon reversal of
the tide. This convergence/divergence feature was persistentduring the experiment to such a degree that it was possibleto adaptively sample the feature [Schofield et al., 2002].3.2.2. Summer 2001[26] Summer 2001 was dominated by alternating upwell-
ing and downwelling favorable winds that resulted in strongstratification. Phytoplankton distributions (Figure 9a) werehighly correlated with temperature (data not shown) andwere higher than in summer 2000. Consistent with summer2000, the optical estimates for CDOM and detritus werehighest in surface waters above the 10m thermocline.During this upwelling summer season, phytoplankton
Figure 7. Comparison of the amount of phytoplankton absorption and measured chlorophyll a associatedwith the three major spectral classes of phytoplankton during summers 2000 and 2001. The amount ofchlorophyll a associated with each spectral class of phytoplankton was calculated via CHEMtax using theaccessory pigment data measured via high-performance liquid chromatography. (a) Relationship betweenmeasured chlorophyll a to the OSIm and OSIc procedures. (b) The absorption of chlorophyll c containingalgae estimatedwith the OSIm and the chlorophyll a associated with chromophytic algae. (c) The absorptionof phycobilin containing algae estimated with the OSIm and the chlorophyll a associated with phycobilincontaining algae. (d) The absorption of chlorophyll c containing algae estimated with the OSIc and thechlorophyll a associated with chromophytic algae. (e) The absorption of phycobilin containing algaeestimated with the OSIc and the chlorophyll a associated with phycobilin containing algae. (f) Theabsorption of chlorophyll b containing algae estimated with the OSIc and the chlorophyll a associated withchlorophytic containing algae.
C12S04 SCHOFIELD ET AL.: INVERSION OF BULK OPTICS
8 of 12
C12S04
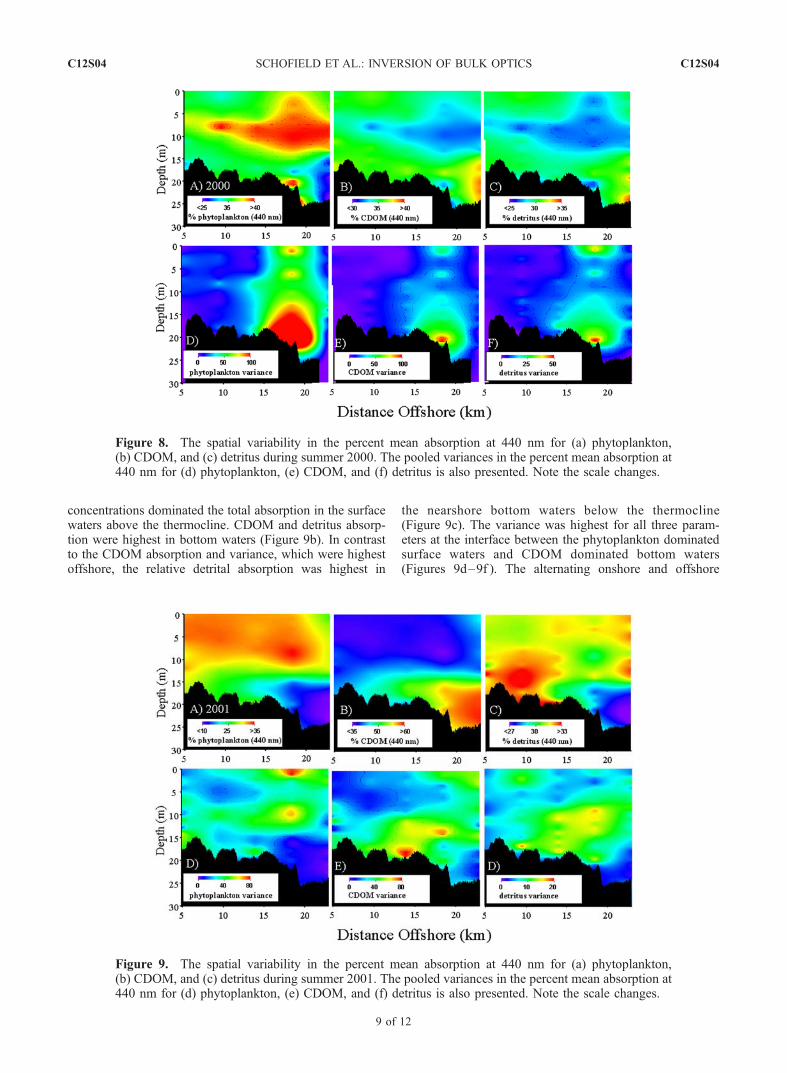
concentrations dominated the total absorption in the surfacewaters above the thermocline. CDOM and detritus absorp-tion were highest in bottom waters (Figure 9b). In contrastto the CDOM absorption and variance, which were highestoffshore, the relative detrital absorption was highest in
the nearshore bottom waters below the thermocline(Figure 9c). The variance was highest for all three param-eters at the interface between the phytoplankton dominatedsurface waters and CDOM dominated bottom waters(Figures 9d–9f ). The alternating onshore and offshore
Figure 8. The spatial variability in the percent mean absorption at 440 nm for (a) phytoplankton,(b) CDOM, and (c) detritus during summer 2000. The pooled variances in the percent mean absorption at440 nm for (d) phytoplankton, (e) CDOM, and (f) detritus is also presented. Note the scale changes.
Figure 9. The spatial variability in the percent mean absorption at 440 nm for (a) phytoplankton,(b) CDOM, and (c) detritus during summer 2001. The pooled variances in the percent mean absorption at440 nm for (d) phytoplankton, (e) CDOM, and (f) detritus is also presented. Note the scale changes.
C12S04 SCHOFIELD ET AL.: INVERSION OF BULK OPTICS
9 of 12
C12S04
transport of the cold bottom waters transported opticallydistinct waters into our study site. The total absorptionin these cold bottom waters was dominated by CDOMabsorption with only minor contributions from phyto-plankton or detritus. Detrital absorption was highest inbottom waters, which correlated with discrete measure-ments that indicated the presence marine snow andtransparent exopolymer particles [Alldredge and Silver,1988; Alldredge et al., 1993; Passow et al., 1994]. Thiscold offshore water was also delineated by the back-scattered to total scattered light (bb/b) ratio. This ratioreflects both the size and the refractive index of the
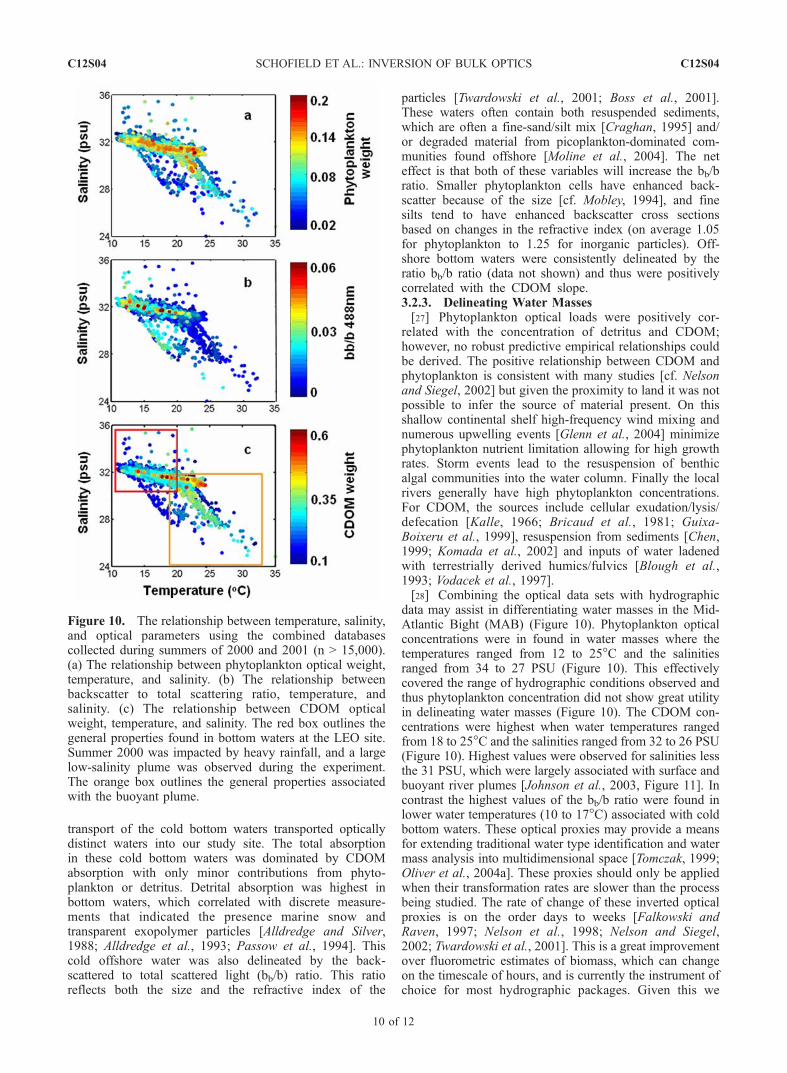
particles [Twardowski et al., 2001; Boss et al., 2001].These waters often contain both resuspended sediments,which are often a fine-sand/silt mix [Craghan, 1995] and/or degraded material from picoplankton-dominated com-munities found offshore [Moline et al., 2004]. The neteffect is that both of these variables will increase the bb/bratio. Smaller phytoplankton cells have enhanced back-scatter because of the size [cf. Mobley, 1994], and finesilts tend to have enhanced backscatter cross sectionsbased on changes in the refractive index (on average 1.05for phytoplankton to 1.25 for inorganic particles). Off-shore bottom waters were consistently delineated by theratio bb/b ratio (data not shown) and thus were positivelycorrelated with the CDOM slope.3.2.3. Delineating Water Masses[27] Phytoplankton optical loads were positively cor-
related with the concentration of detritus and CDOM;however, no robust predictive empirical relationships couldbe derived. The positive relationship between CDOM andphytoplankton is consistent with many studies [cf. Nelsonand Siegel, 2002] but given the proximity to land it was notpossible to infer the source of material present. On thisshallow continental shelf high-frequency wind mixing andnumerous upwelling events [Glenn et al., 2004] minimizephytoplankton nutrient limitation allowing for high growthrates. Storm events lead to the resuspension of benthicalgal communities into the water column. Finally the localrivers generally have high phytoplankton concentrations.For CDOM, the sources include cellular exudation/lysis/defecation [Kalle, 1966; Bricaud et al., 1981; Guixa-Boixeru et al., 1999], resuspension from sediments [Chen,1999; Komada et al., 2002] and inputs of water ladenedwith terrestrially derived humics/fulvics [Blough et al.,1993; Vodacek et al., 1997].[28] Combining the optical data sets with hydrographic
data may assist in differentiating water masses in the Mid-Atlantic Bight (MAB) (Figure 10). Phytoplankton opticalconcentrations were in found in water masses where thetemperatures ranged from 12 to 25�C and the salinitiesranged from 34 to 27 PSU (Figure 10). This effectivelycovered the range of hydrographic conditions observed andthus phytoplankton concentration did not show great utilityin delineating water masses (Figure 10). The CDOM con-centrations were highest when water temperatures rangedfrom 18 to 25�C and the salinities ranged from 32 to 26 PSU(Figure 10). Highest values were observed for salinities lessthe 31 PSU, which were largely associated with surface andbuoyant river plumes [Johnson et al., 2003, Figure 11]. Incontrast the highest values of the bb/b ratio were found inlower water temperatures (10 to 17�C) associated with coldbottom waters. These optical proxies may provide a meansfor extending traditional water type identification and watermass analysis into multidimensional space [Tomczak, 1999;Oliver et al., 2004a]. These proxies should only be appliedwhen their transformation rates are slower than the processbeing studied. The rate of change of these inverted opticalproxies is on the order days to weeks [Falkowski andRaven, 1997; Nelson et al., 1998; Nelson and Siegel,2002; Twardowski et al., 2001]. This is a great improvementover fluorometric estimates of biomass, which can changeon the timescale of hours, and is currently the instrument ofchoice for most hydrographic packages. Given this we
Figure 10. The relationship between temperature, salinity,and optical parameters using the combined databasescollected during summers of 2000 and 2001 (n > 15,000).(a) The relationship between phytoplankton optical weight,temperature, and salinity. (b) The relationship betweenbackscatter to total scattering ratio, temperature, andsalinity. (c) The relationship between CDOM opticalweight, temperature, and salinity. The red box outlines thegeneral properties found in bottom waters at the LEO site.Summer 2000 was impacted by heavy rainfall, and a largelow-salinity plume was observed during the experiment.The orange box outlines the general properties associatedwith the buoyant plume.
C12S04 SCHOFIELD ET AL.: INVERSION OF BULK OPTICS
10 of 12
C12S04
recommend that IOP sensors be routinely incorporated intostandard hydrographic surveys.
4. Conclusions
[29] Inversion of absorption data measured using off theshelf technology is possible and shows great promise. Theseand similar inversion approaches can be applied to opticallycomplex Case 2 waters. Particulate spectra were derivedwith great efficacy. Deriving phytoplankton spectra wasmore difficult but achievable. This will provide the marineecologist a key technology to map specific phytoplanktontaxa over ecologically relevant spatial temporal scales. Theabsorption during the summer upwelling season in thenearshore waters in the Mid-Atlantic Bight were dominatedalmost equally (±10%) by phytoplankton, detritus, andCDOM; however, the relative absorption of light in offshorebottom waters was dominated by CDOM. Low-salinityriver plumes were best delineated by high loads of CDOM.These inverted bio-optical parameters will show utility indelineating waters masses in the nearshore coastal ocean.
[30] Acknowledgments. The support of the National Ocean Partner-ship Program (N00014-97-1-1019) and the Office of Naval ResearchCOMOP and HyCODE programs (N00014-97-0767, N0014-99-0196,and N0014-99-0197) are gratefully acknowledged. The other ONR andNRL supported researchers are acknowledged for their patience, humor,and highly valued partnership. The detailed and incredibly constructivereviews provided by Grace Chang and Emmanuel Boss greatly improvedthis manuscript. Finally the continuing support from the great state of NewJersey is acknowledged.
ReferencesAarup, T., N. Holt, and N. Højerslev (1996), Optical measurements in theNorth Sea-Baltic Sea transition zone. II. Water mass classification alongthe Jutland west coast from salinity and spectral irradiance measurements,Cont. Shelf. Res., 16, 1343–1353.
Alldredge, A. L., and M. W. Silver (1988), Characteristics, dynamics andsignificance of marine snow, Prog. Oceanogr., 20, 41–82.
Alldredge, A. L., U. Passow, and B. Logan (1993), The abundance andsignificance of a class of large transparent organic particles in the ocean,Deep Sea Res., Part I, 40, 1131–1140.
Barnard, A. H., W. S. Pegau, and J. R. V. Zaneveld (1998), Global relation-ships of the inherent optical properties of the oceans, J. Geophys. Res.,103, 24,955–24,968.
Blough, N. V., O. C. Zafririou, and J. Bonilla (1993), Optical absorptionspectra of waters from the Orinoco River outflow—Terrestrial input ofcolored organic matter to the Carribean, J. Geophys. Res., 98, 2271–2278.
Boss, E., W. S. Pegau, W. D. Gardner, J. R. V. Zaneveld, A. H. Barnard,M. S. Twardowski, G. C. Chang, and T. D. Dickey (2001), Spectralparticulate attenuation and particle size distribution in the bottom bound-ary layer of a continental shelf, J. Geophys. Res., 106, 509–516.
Bricaud, A., A. Morel, and L. Prieur (1981), Absorption by dissolvedorganic matter of the sea (yellow substance) in the UV and visibledomains, Limnol. Oceanogr., 26, 45–53.
Bricaud, A., M. Babin, A. Morel, and H. Claustre (1995), Variability inthe chlorophyll-specific absorption coefficients of natural phytoplank-ton: Analysis and parameterization, J. Geophys. Res., 100, 13,321–13,332.
Carder, K. L., R. G. Steward, G. R. Harvey, and P. B. Ortner (1989), Marinehumic and fulvic acids: Their effects on remote sensing of chlorophyll a,Limnol. Oceanogr., 34, 68–81.
Chang, G. C., and T. D. Dickey (1999), Partitioning in situ spectral absorp-tion by use of moored spectral absorption-attenuation meters, Appl. Opt.,38, 3876–3887.
Chang, G. C., T. D. Dickey, O. M. Schofield, A. D. Weidemann, E. Boss,W. S. Pegau, M. A. Moline, and S. M. Glenn (2002), Nearshore physicalprocesses and bio-optical properties in the New York Bight, J. Geophys.Res., 107(C9), 3133, doi:10.1029/2001JC001018.
Chen, R. F. (1999), In situ fluorescence of dissolved organic matter inseawater, Mar. Chem., 37, 191–221.
Craghan, M. (1995), Topographic changes and sediment characteristics at ashoreface sand ridge: Beach Haven Ridge, New Jersey, M.S. thesis,Rutgers Univ., New Brunswick, N. J.
Critchley, C. (1994), D1 protein turnover: Response to photodamageor regulatory mechanism?, in Photoinhibition of Photosynthesis FromMolecular Mechanisms to the Field, edited by N. R. Baker and J. R.Bowyer, pp. 195–201, BIOS Sci., Oxford, UK.
Cullen, J. J. (1982), The deep chlorophyll maximum: Comparing profiles ofchlorophyll a, Can. J. Fish. Aquat. Sci., 39, 791–803.
Demmig-Adams, B. (1990), Carotenoids and photoprotection: A role forthe xanthophyll zeaxanthin, Biochim. Biophys. Acta, 1020, 1–24.
Falkowski, P. G., and D. A. Kiefer (1985), Chlorophyll a fluorescence andphytoplankton: Relationship to photosynthesis and biomass, J. PlanktonRes., 7, 715–731.
Falkowski, P. G., and J. A. Raven (1997), Aquatic Photosynthesis, 375 pp.,Blackwell Sci., Malden, Mass.
Gallegos, C. L., and P. J. Neale (2002), Partitioning spectral absorption incase 2 waters: Discrimination of dissolved and particulate components,Appl. Opt., 41, 4220–4233.
Glenn, S. M., D. B. Haidvogel, O. Schofield, J. F. Grassle, C. J. von Alt,E. R. Levine, and D. C. Webb (1998), Coastal predictive skill experi-ments at the LEO-15 national littoral laboratory, Sea Tech., 39, 63–69.
Glenn, S., T. D. Dickey, B. Parker, and W. Boicourt (2000), Long-term real-time coastal ocean observation networks, Oceanography, 13, 24–34.
Glenn, S., et al. (2004), Biogeochemical impact of summertime coastalupwelling on the New Jersey Shelf, J. Geophys. Res., 109, C12S02,doi:10.1029/2003JC002265.
Green, S. A., and N. V. Blough (1994), Optical absorption and fluorescenceproperties of chromophoric dissolved organic matter in natural waters,Limnol. Oceanogr., 39, 1903–1916.
Guixa-Boixeru, N., D. Vaque, J. M. Gasol, and C. Pedros-Alio (1999),Distribution of viruses and the potential effect on bacterioplankton inan oligotrophic marine system, Aquat. Microbiol. Ecol., 19, 205–213.
Højerslev, N. K., N. Holt, and T. Aarup (1996), Optical measurements inthe North Sea-Baltic Sea transition zone. I. On the origin of the deepwater in Kattegat, Cont. Shelf. Res., 16, 1329–1342.
Jeffrey, S. W., R. F. C. Mantoura, and S. W. Wright (1997), PhytoplanktonPigments in Oceanography, 661 pp., U.N. Educ., Sci., and Cult. Org.,Paris.
Johnsen, G., O. Samset, L. Granskog, and E. Sakshaug (1994), In vivoabsorption characteristics in 10 classes of bloom-forming phytoplankton:Taxonomic characteristics and responses to photoadaptation by meansto discriminant and HPLC analysis,Mar. Ecol. Prog. Ser., 105, 149–157.
Johnson, D. R., J. Miller, and O. Schofield (2003), Dynamics and optics ofthe Hudson River outflow plume, J. Geophys. Res., 108(C10), 3323,doi:10.1029/2002JC001485.
Kalle, K. (1966), The problem of the gelbstoff in the sea, Oceanogr. Mar.Biol. Rev., 4, 91–104.
Kiefer, D. A. (1973), Chlorophyll a fluorescence in marine centric diatoms:Responses of chloroplasts to light and nutrient stress, Mar. Biol., 23, 39–46.
Kirk, J. T. O. (1994), Light and Photosynthesis in Aquatic Ecosystems,509 pp., Cambridge Univ. Press, New York.
Kirkpatrick, G., D. F. Millie, M. A. Moline, and O. Schofield (2000),Absorption-based discrimination of phytoplankton species in naturallymixed populations, Limnol. Oceanogr., 42, 467–471.
Kirkpatrick, G. J., C. Orrico, M. J. Oliver, M. A. Moline, and O. Schofield(2003), Continuous real-time determination of hyperspectral absorptionof colored dissolved organic matter, Appl. Opt., 42, 6564–6568.
Kishino, M., M. Takahashi, N. Okami, and S. Ichimura (1985), Estimationof the spectral absorption coefficients of phytoplankton in the sea, Bull.Mar. Sci., 37, 634–642.
Komada, T., O. Schofield, and C. Reimers (2002), Fluorescence character-istics of organic matter released from coastal sediments during resuspen-sion, Mar. Chem., 79, 81–97.
Kroon, B. M. A. (1994), Variability of photosystem II quantum yields andrelated processes in Chlorella pyrenoidsa (Chlorophyta) acclimated to anoscillating light regime simulating a mixed photic zone, J. Phycol., 30,841–852.
Mackey, M., D. Mackey, H. Higgins, and S. Wright (1996), CHEMTAX—A program for estimating class abundances from chemical markers:Application to HPLC measurements of phytoplankton, Mar. Ecol. Prog.Ser., 144, 265–283.
Mackey, M. D., H. W. Higgins, D. J. Mackey, and D. Holdsworth (1998),Algal class abundances in the western equatorial Pacific: Estimation fromHPLC measurements of chloroplast pigments using CHEMTAX, DeepSea Res., Part I, 45, 1441–1468.
Millie, D. F., O. Schofield, G. J. Kirkpatrick, G. Johnsen, P. A. Tester, andB. T. Vinyard (1997), Phytoplankton pigments and absorption spectra as
C12S04 SCHOFIELD ET AL.: INVERSION OF BULK OPTICS
11 of 12
C12S04
potential ‘biomarkers’ for harmful algal blooms: A case study of theFlorida red-tide dinoflagellate, Gymnodinium breve, Limnol. Oceanogr.,42, 1240–1251.
Millie, D. F., O. Schofield, G. J. Kirkpatrick, G. Johnsen, and T. J. Evens(2002), Using absorbance and fluorescence spectra to discriminate micro-algae, Eur. J. Phycol., 37, 313–322.
Mobley, C. D. (1994), Light and Water Radiative Transfer in NaturalWaters, 591 pp., Academic, San Diego, Calif.
Moline, M. A., S. Blackwell, R. Chant, M. J. Oliver, T. Bergmann,S. Glenn, and O. M. E. Schofield (2004), Episodic physical forcing andthe structure of phytoplankton communities in the coastal waters ofNew Jersey, J. Geophys. Res., 109, C12S05, doi:10.1029/2003JC001985.
Morel, A., and A. Bricaud (1986), Inherent optical properties of algal cellsincluding picoplankton: Theoretical and experimental results, in Photo-synthetic Picoplankton, edited by T. Platt and W. K. W. Li, Can. Bull.Fish. Aquat. Sci., 214, 521–559.
Nelson, N. B., and D. A. Siegel (2002), Chromophoric DOM in the openocean, in Biogeochemistry of Marine Dissolved Organic Matter, pp. 547–578, Elsevier Sci., New York.
Nelson, N. B., D. A. Siegel, and A. F. Michaels (1998), Seasonal dynamicsof colored dissolved organic material in the Sargasso Sea, Deep Sea Res.,Part I, 45, 931–957.
Nickelsen, J., and J. D. Rochaix (1994), Regulation of synthesis of D1 andD2 proteins of photosystem II., in Photoinhibition of PhotosynthesisFrom Molecular Mechanisms to the Field, pp. 179–190, edited byN. R. Baker and J. R. Bowyer, BIOS Sci., Oxford, UK.
Oliver, M. J., S. Glenn, J. T. Kohut, A. J. Irwin, O. M. Schofield, M. A.Moline, and W. P. Bissett (2004a), Bioinformatic approaches for objec-tive detection of water masses on continental shelves, J. Geophys. Res.,109, C07S04, doi:10.1029/2003JC002072.
Oliver, M. J., O. Schofield, T. Bergmann, S. Glenn, C. Orrico, andM. Moline (2004b), Deriving in situ phytoplankton absorption for bio-optical productivity models in turbid waters, J. Geophys. Res., 109,C07S11, doi:10.1029/2002JC001627.
Owens, T. G., A. P. Shreve, and A. C. Albrecht (1993), Dynamics andmechanism of singlet energy transfer between carotenoids and chloro-phylls: Light-harvesting and nonphotochemical fluorescence quenching,in Research in Photosynthesis, vol. IV, edited by N. Murata, pp. 179–186, Kluwer Acad., Norwell, Mass.
Passow, U., A. L. Alldredge, and B. E. Logan (1994), The role of particu-late carbohydrate exudates in the flocculation of diatom blooms, DeepSea Res., Part I, 41, 335–357.
Pegau, S. W., et al. (1995), A comparison of methods for the measurementof the absorption coefficient in natural waters, J. Geophys. Res., 100,13,201–13,221.
Prasil, O., N. Adir, and I. Ohad (1992), Dynamics of photosystem II:Mechanism of photoinhibition and recovery processes, in The Photosys-tems: Structure, Function and Molecular Biology, edited by J. Barber,pp. 295–348, Elsevier, New York.
Robinson, A. R., and S. Glenn (1999), Adaptive sampling for ocean fore-casting, Nav. Res. Rev., 51, 26–38.
Roelke, D. L., C. D. Kennedy, and A. D. Weidemann (1999), Useof discriminant and fourth-derivative analyses with high-resolution
absorption spectra for phytoplankton research: Limitations at variedsignal to noise ratio and spectral resolution, Fish. Aquat. Ecol., 17,17–28.
Roesler, C. S. (1998), Theoretical and experimental approaches to improvethe accuracy of particulate absorption coefficients derived from the quan-titative filter technique, Limnol. Oceanogr., 43, 1649–1660.
Roesler, C. S., and M. J. Perry (1995), In situ phytoplankton absorption,fluorescence emission, and particulate backscattering spectra determinedfrom reflectance, J. Geophys. Res., 100, 13,279–13,294.
Roesler, C. S., M. J. Perry, and K. L. Carder (1989), Modeling in situphytoplankton absorption from total absorption spectra in productiveinland marine waters, Limnol. Oceanogr., 34, 1510–1523.
Schofield, O., J. Gryzmski, W. P. Bissett, G. J. Kirkpatrick, D. F. Millie,M. A. Moline, and C. R. Roesler (1999), Optical monitoring and fore-casting systems for harmful algal blooms: Possibility or pipedream?,J. Phycol., 35, 125–145.
Schofield, O., T. Bergmann, W. P. Bisset, F. Grassle, D. Haidvogel,J. Kohut, M. Moline, and S. Glenn (2002), The long term ecosystemobservatory: An integrated coastal observatory, IEEE J. Oceanic Eng.,27, 146–154.
Tomczak, M. (1999), Some historical, theoretical and applied aspects ofquantitative water mass analysis, J. Mar. Res., 57, 275–303.
Twardowski, M. S., J. M. Sullivan, P. L. Donaghay, and J. R. V. Zaneveld(1999), Microscale quantification of the absorption by dissolved andparticulate material in coastal waters with an ac-9, J. Atmos. OceanicTechnol., 16, 691–707.
Twardowski, S. M., E. Boss, J. B. MacDonald, W. S. Pegau, A. H. Barnard,and J. R. V. Zaneveld (2001), A model for estimating bulk refractiveindex from optical backscattering ratio and implications for understand-ing particle composition in case I and case II waters, J. Geophys. Res.,106, 14,129–14,142.
Vodacek, A., N. V. Blough, M. D. DeGrandpre, E. T. Peltzer, and R. K.Nelson (1997), Seasonal variation of CDOM and DOC in the MiddleAtlantic Bight: Terrestrial inputs and photooxidation, Limnol. Oceanogr.,42, 674–686.
Wright, S. W., S. W. Jeffrey, R. F. C. Mantoura, C. A. Llewellyn,T. Bjornland, D. Repeta, and N. Welschmeyer (1991), Improved HPLCmethod for the analysis of chlorophylls and carotenoids from marinephytoplankton, Mar. Ecol. Prog. Ser., 77, 183–196.
�����������������������T. Bergmann, A. Irwin, M. J. Oliver, and O. Schofield, Coastal Ocean
Observation Lab, Institute of Marine and Coastal Sciences, RutgersUniversity, New Brunswick, NJ 08901, USA. ([email protected])W. P. Bissett, Florida Environmental Research Institute, 4807 Bayshore
Blvd. Suite 101, Tampa, FL 33611, USA.G. Kirkpatrick, Mote Marine Laboratory, 1600 Ken Thompson Parkway,
Sarasota, FL 34236, USA.M. A. Moline and C. Orrico, Biological Sciences Department, California
Polytechnic State University, San Luis Obispo, CA 93407, USA.
C12S04 SCHOFIELD ET AL.: INVERSION OF BULK OPTICS
12 of 12
C12S04