Embed Size (px)
Citation preview
Inverse Opals for Fluid Delivery in Electronics Cooling Systems
Thomas J. Dusseault, Julie Gires, Michael T. Barako, Yoonjin Won, Damena D. Agonafer, Mehdi Asheghi, Juan G. Santiago, Kenneth E. Goodson Stanford University
440 Escondido Mall, Bldg 530/Rm 224 Stanford, CA, United States of America, 94305-3030
Phone: (774) 571-9557 Fax: (650) 723-7657
Email: [email protected]
ABSTRACT
We report the fabrication and fluid flow characterization of a class of open-cell copper foams known as copper inverse opals (CIOs). This material has finely controlled structure at the pore level, which may enable its use in microscale heat exchangers for microelectronics cooling. We fabricated CIOs by electrodepositing copper around a sacrificial template of packed polystyrene microspheres. We then removed the CIOs from their substrates and used electroetching to vary the pore structure and porosity. We characterized the geometry of the samples at various stages of fabrication with visual inspection and image analysis of scanning electron micrographs. We characterized the permeability with a through-plane flow rig and developed computational models for fluid flow in ideal face-centered cubic and hexagonally close-packed unit cells. Here we report the simulated and experimentally measured values of permeability. We also report experimental challenges that arise from the microscale dimensions of the samples. KEY WORDS: metal foam, inverse opal, porous media, fabrication, modeling, permeability
NOMENCLATURE d diameter, m K permeability, m2
P pressure, Pa Pg gauge pressure, Pa q flow rate, m3/s Red Reynolds number based on pore diameter
Greek symbols µ dynamic viscosity, Pa∙s ϕ porosity σ standard deviation
Subscripts p pore n neck!s! microspheres sh shell
INTRODUCTION Open-cell metal foams are employed in a variety of designs for heat pipes and compact heat exchangers [1-4]. The combination of the high thermal conductivity of the metal (~100 – 400 Wm-1K-1) and the high surface area to volume ratio (103 – 106 m2/m3) makes foams attractive for convective cooling applications [5]. The open-cell porosity exerts
capillary force that can wick fluid towards hot spots during evaporation/condensation cycles in heat pipes. The phenomena associated with heat transfer, phase change, and single and two-phase flows in a wide variety of metal foams have been extensively explored in the literature using both effective medium and pore-level approaches [6-11].
20µm
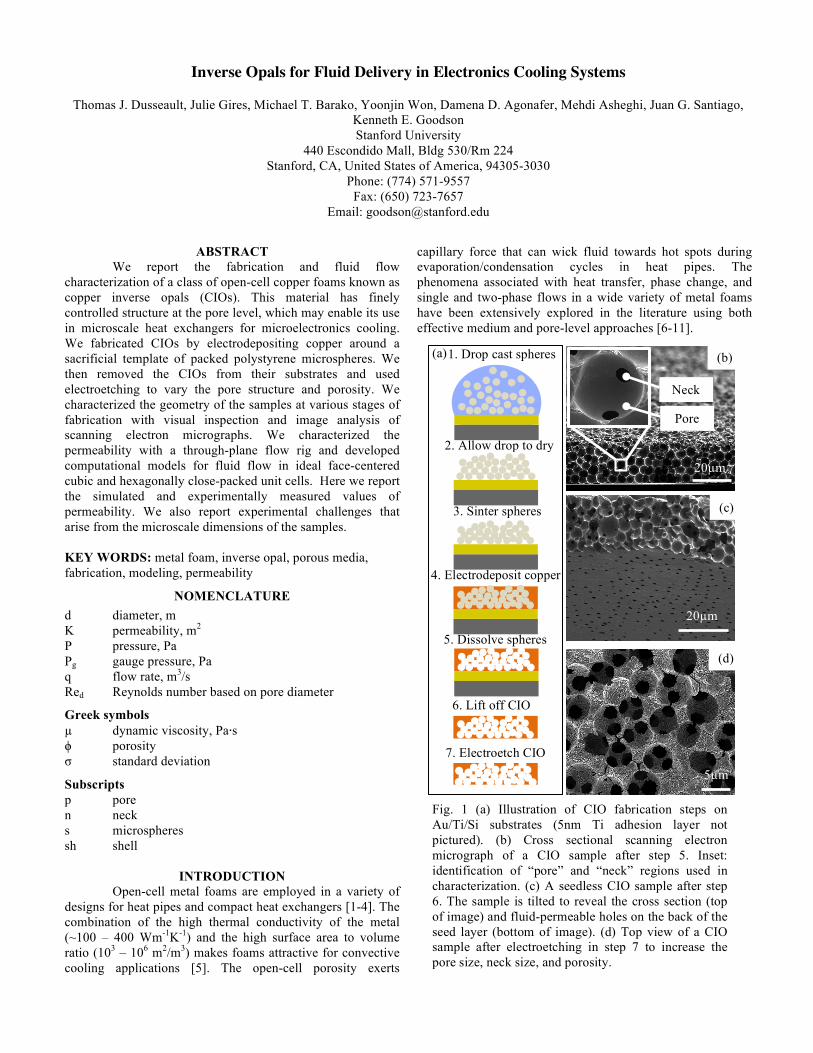
Fig. 1 (a) Illustration of CIO fabrication steps on Au/Ti/Si substrates (5nm Ti adhesion layer not pictured). (b) Cross sectional scanning electron micrograph of a CIO sample after step 5. Inset: identification of “pore” and “neck” regions used in characterization. (c) A seedless CIO sample after step 6. The sample is tilted to reveal the cross section (top of image) and fluid-permeable holes on the back of the seed layer (bottom of image). (d) Top view of a CIO sample after electroetching in step 7 to increase the pore size, neck size, and porosity.
6. Lift off CIO
7. Electroetch CIO
!
!!
!
! ! ! ! ! ! ! ! ! !! ! !
!!! ! ! !! !! ! !! !! !!
!!!
! ! !! ! ! !! ! !! ! ! !! ! ! ! !! !! !! ! !! !!
!!!
! ! !! ! ! !! ! !! ! ! !! ! ! ! !! !! !! ! !! !!
!!!
!! ! !! ! ! !! ! !! ! ! !! ! ! ! !! !! !! ! !! !!
!!!
!! ! !! ! ! !! ! !! ! ! !! ! ! ! !! !! !! ! !! !!
! !! ! !! ! ! !! ! !! ! ! !! ! ! ! !! !! !! ! !! !!
! !! ! !! ! ! !! ! !! ! ! !! ! ! ! !! !! !! ! !! !!
2. Allow drop to dry
3. Sinter spheres
4. Electrodeposit copper
5. Dissolve spheres
1. Drop cast spheres (a)
!
5µm
20µm !
Neck
Pore
(b)
(c)
(d)
Metal foams have been traditionally employed for cooling hotspots with areas on the order of square centimeters. However, the properties that make foams attractive for macroscale applications also apply to the field of microelectronics, where the rising power densities that accompany persistent downscaling have fueled a revival of interest in single and two-phase fluid cooling technology. As device dimensions reach the micrometer scale and heat removal requirements reach the tens of kilowatts per square centimeter, precise control of the fabrication of the foam at the pore level becomes important. Copper inverse opals (CIOs) are open cell metal foams grown by depositing metal within a sacrificial template of packed microspheres [12-16]. These structures originally attracted interest as photonic crystals, which inherently require extremely precise control of the structure at the pore level [17-19]. Despite the maturity of the existing body of literature on CIOs, there has been no demonstration of sustained and experimentally characterized fluid flow through CIOs. In this work, we synthesize permeable, free-standing CIOs and characterize their pore structure and permeability.
GROWTH OF COPPER INVERSE OPALS The process used to fabricate CIOs is described in the
literature [20] and illustrated schematically in Figure 1. We prepared two types of substrates by thermally evaporating thin films of metal on polished monocrystalline silicon wafers. The first type of substrate consisted of a 5nm titanium adhesion layer under 50nm of gold (Au/Ti/Si, Figure 1). The second type had 50nm of copper under 50nm of gold with no adhesion layer (Au/Cu/Si). We synthesized polystyrene microspheres (ds~5µm) using dispersion polymerization [21,22] and assembled them into randomly packed beds on the substrates by drop casting. We then sintered the samples at 95˚C for 24 hours to form necks between the spheres. We wet the resulting hydrophobic sphere bed with a small drop of ethanol to allow aqueous CuSO4 to reach the seed layer and electrodeposited copper into the interstitial voids with a three-electrode electrochemical cell at a fixed potential of -200mV. The spheres readily dissolved in tetrahydrofuran to reveal the CIOs.
We removed the CIOs from their substrates using a water-assisted liftoff technique [23] to allow for through-plane fluid flow. In the Au/Cu/Si samples, the weakness of the Cu/Si interface compared to the CIO/Au/Cu interfaces allowed removal of the CIOs with the seed layers attached. In contrast, the strength of the Au/Ti/Si interfaces compared to the CIO/Au interface in the Au/Ti/Si samples allowed complete removal of the CIOs from the seed layers. For clarity, we will distinguish the two groups of samples as seed-backed CIOs and seedless CIOs. We removed the CIOs in both cases by cleaving from the backside of the silicon in a beaker of water and peeling the silicon away. CIO samples thicker than ~25µm had enough mechanical strength to survive removal from the substrate.
We tuned the structure of the pores by electroetching in 85% phosphoric acid [24,25]. The recipe consisted of an 80ms pulse of 1V with respect to a silver/silver chloride reference electrode followed by 16s of 0V. The pulsed voltage
ensured uniform etching through the thickness of the CIOs by allowing dissolved species to diffuse out of the porous structure. Etching uniformity was ensured by visual inspection of cross-sectional SEM images. Figure 1(d) shows that electroetching also increased the surface roughness of the porous structure. Electroetching removed the copper portion of the seed layer in the seed-backed CIOs, but it did not remove the gold portion.
CHARACTERIZATION OF COPPER INVERSE OPALS Porous media are typically characterized by their porosity ϕ and pore size dp. The porosity or void fraction is given by
! = volume!open!spacetotal!volume !!!!!(1)
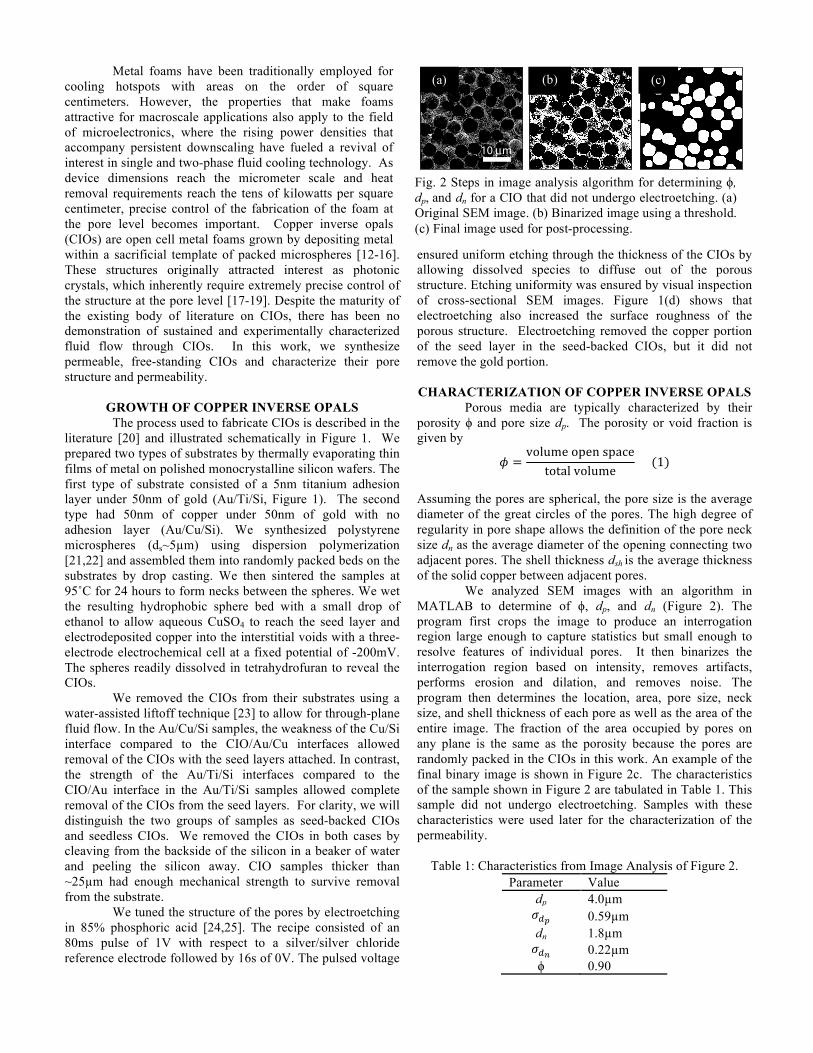
Assuming the pores are spherical, the pore size is the average diameter of the great circles of the pores. The high degree of regularity in pore shape allows the definition of the pore neck size dn as the average diameter of the opening connecting two adjacent pores. The shell thickness dsh is the average thickness of the solid copper between adjacent pores. We analyzed SEM images with an algorithm in MATLAB to determine of ϕ, dp, and dn (Figure 2). The program first crops the image to produce an interrogation region large enough to capture statistics but small enough to resolve features of individual pores. It then binarizes the interrogation region based on intensity, removes artifacts, performs erosion and dilation, and removes noise. The program then determines the location, area, pore size, neck size, and shell thickness of each pore as well as the area of the entire image. The fraction of the area occupied by pores on any plane is the same as the porosity because the pores are randomly packed in the CIOs in this work. An example of the final binary image is shown in Figure 2c. The characteristics of the sample shown in Figure 2 are tabulated in Table 1. This sample did not undergo electroetching. Samples with these characteristics were used later for the characterization of the permeability.
Table 1: Characteristics from Image Analysis of Figure 2. Parameter Value
dp 4.0µm !!! 0.59µm dn 1.8µm !!! 0.22µm ϕ! 0.90
10 m10 m10 m
(a) (b) (c)
Fig. 2 Steps in image analysis algorithm for determining ϕ, dp, and dn for a CIO that did not undergo electroetching. (a) Original SEM image. (b) Binarized image using a threshold. (c) Final image used for post-processing.
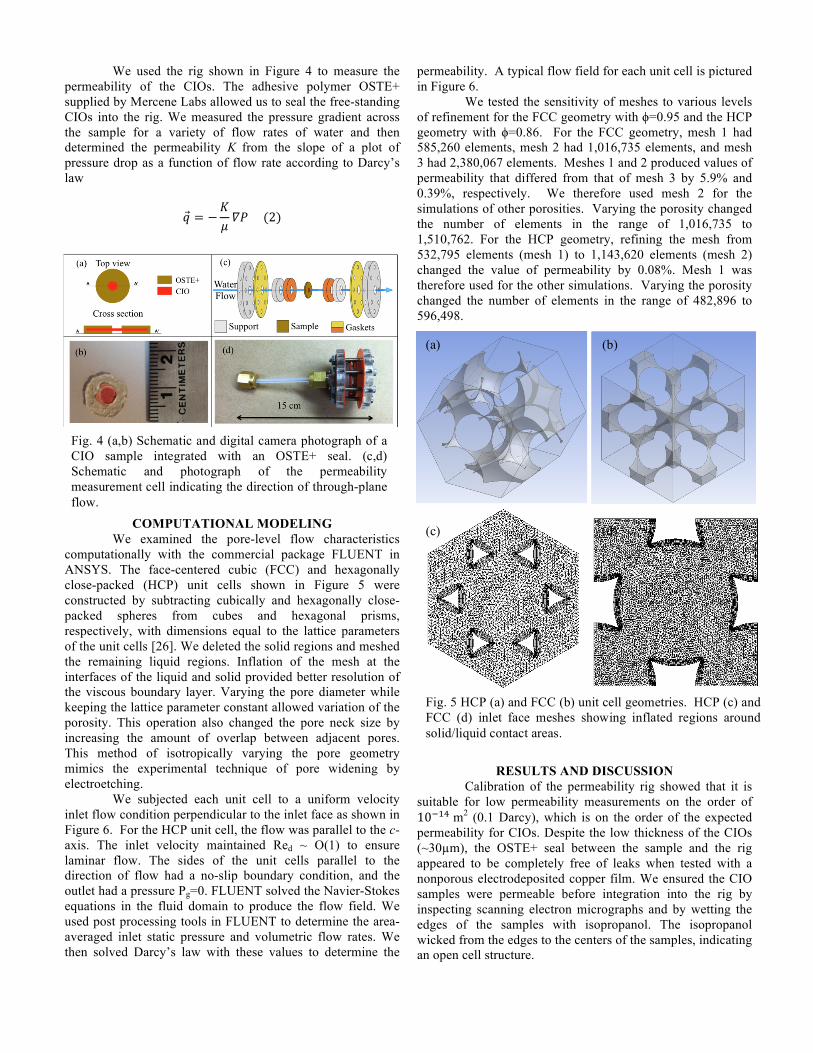
We used the rig shown in Figure 4 to measure the permeability of the CIOs. The adhesive polymer OSTE+ supplied by Mercene Labs allowed us to seal the free-standing CIOs into the rig. We measured the pressure gradient across the sample for a variety of flow rates of water and then determined the permeability K from the slope of a plot of pressure drop as a function of flow rate according to Darcy’s law
! = −!! !"!!!!!(2)
COMPUTATIONAL MODELING We examined the pore-level flow characteristics computationally with the commercial package FLUENT in ANSYS. The face-centered cubic (FCC) and hexagonally close-packed (HCP) unit cells shown in Figure 5 were constructed by subtracting cubically and hexagonally close-packed spheres from cubes and hexagonal prisms, respectively, with dimensions equal to the lattice parameters of the unit cells [26]. We deleted the solid regions and meshed the remaining liquid regions. Inflation of the mesh at the interfaces of the liquid and solid provided better resolution of the viscous boundary layer. Varying the pore diameter while keeping the lattice parameter constant allowed variation of the porosity. This operation also changed the pore neck size by increasing the amount of overlap between adjacent pores. This method of isotropically varying the pore geometry mimics the experimental technique of pore widening by electroetching.
We subjected each unit cell to a uniform velocity inlet flow condition perpendicular to the inlet face as shown in Figure 6. For the HCP unit cell, the flow was parallel to the c-axis. The inlet velocity maintained Red ~ O(1) to ensure laminar flow. The sides of the unit cells parallel to the direction of flow had a no-slip boundary condition, and the outlet had a pressure Pg=0. FLUENT solved the Navier-Stokes equations in the fluid domain to produce the flow field. We used post processing tools in FLUENT to determine the area-averaged inlet static pressure and volumetric flow rates. We then solved Darcy’s law with these values to determine the
permeability. A typical flow field for each unit cell is pictured in Figure 6.
We tested the sensitivity of meshes to various levels of refinement for the FCC geometry with ϕ=0.95 and the HCP geometry with ϕ=0.86. For the FCC geometry, mesh 1 had 585,260 elements, mesh 2 had 1,016,735 elements, and mesh 3 had 2,380,067 elements. Meshes 1 and 2 produced values of permeability that differed from that of mesh 3 by 5.9% and 0.39%, respectively. We therefore used mesh 2 for the simulations of other porosities. Varying the porosity changed the number of elements in the range of 1,016,735 to 1,510,762. For the HCP geometry, refining the mesh from 532,795 elements (mesh 1) to 1,143,620 elements (mesh 2) changed the value of permeability by 0.08%. Mesh 1 was therefore used for the other simulations. Varying the porosity changed the number of elements in the range of 482,896 to 596,498.
RESULTS AND DISCUSSION
Calibration of the permeability rig showed that it is suitable for low permeability measurements on the order of 10!!" m2 (0.1 Darcy), which is on the order of the expected permeability for CIOs. Despite the low thickness of the CIOs (~30µm), the OSTE+ seal between the sample and the rig appeared to be completely free of leaks when tested with a nonporous electrodeposited copper film. We ensured the CIO samples were permeable before integration into the rig by inspecting scanning electron micrographs and by wetting the edges of the samples with isopropanol. The isopropanol wicked from the edges to the centers of the samples, indicating an open cell structure.
Fig. 4 (a,b) Schematic and digital camera photograph of a CIO sample integrated with an OSTE+ seal. (c,d) Schematic and photograph of the permeability measurement cell indicating the direction of through-plane flow.
Fig. 5 HCP (a) and FCC (b) unit cell geometries. HCP (c) and FCC (d) inlet face meshes showing inflated regions around solid/liquid contact areas.
(b) (a)
(d) (c)
The seed-backed CIOs were unable to support fluid flow even at the lowest flow rate possible with the setup (0.1mL/min). The build up of pressure in the samples eventually caused rupture along the inner perimeter of the OSTE+ seal. Visual inspection of the back of the samples after rupture showed that the seed layer was still present, which indicates that the flow failed to break through the seed layer. The gold seed layer likely has low mechanical strength due to its 50nm thickness. However, the force required to break through the seed layer below each pore is clearly greater than the material can tolerate with the current setup.
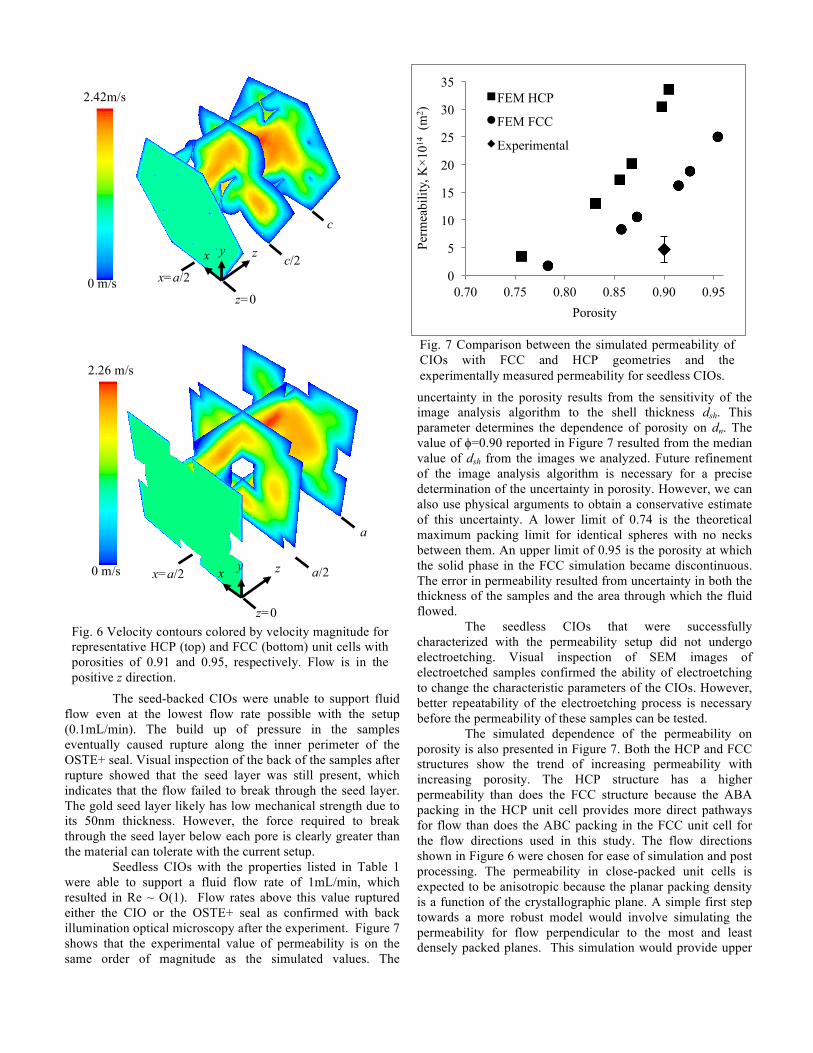
Seedless CIOs with the properties listed in Table 1 were able to support a fluid flow rate of 1mL/min, which resulted in Re ~ O(1). Flow rates above this value ruptured either the CIO or the OSTE+ seal as confirmed with back illumination optical microscopy after the experiment. Figure 7 shows that the experimental value of permeability is on the same order of magnitude as the simulated values. The
uncertainty in the porosity results from the sensitivity of the image analysis algorithm to the shell thickness dsh. This parameter determines the dependence of porosity on dn. The value of ϕ=0.90 reported in Figure 7 resulted from the median value of dsh from the images we analyzed. Future refinement of the image analysis algorithm is necessary for a precise determination of the uncertainty in porosity. However, we can also use physical arguments to obtain a conservative estimate of this uncertainty. A lower limit of 0.74 is the theoretical maximum packing limit for identical spheres with no necks between them. An upper limit of 0.95 is the porosity at which the solid phase in the FCC simulation became discontinuous. The error in permeability resulted from uncertainty in both the thickness of the samples and the area through which the fluid flowed.
The seedless CIOs that were successfully characterized with the permeability setup did not undergo electroetching. Visual inspection of SEM images of electroetched samples confirmed the ability of electroetching to change the characteristic parameters of the CIOs. However, better repeatability of the electroetching process is necessary before the permeability of these samples can be tested. The simulated dependence of the permeability on porosity is also presented in Figure 7. Both the HCP and FCC structures show the trend of increasing permeability with increasing porosity. The HCP structure has a higher permeability than does the FCC structure because the ABA packing in the HCP unit cell provides more direct pathways for flow than does the ABC packing in the FCC unit cell for the flow directions used in this study. The flow directions shown in Figure 6 were chosen for ease of simulation and post processing. The permeability in close-packed unit cells is expected to be anisotropic because the planar packing density is a function of the crystallographic plane. A simple first step towards a more robust model would involve simulating the permeability for flow perpendicular to the most and least densely packed planes. This simulation would provide upper
2.42m/s
0 m/s
c/2
c
z=0
x=a/2
y x z
0 m/s
2.26 m/s
z=0
a/2
a
x=a/2 y x z
Fig. 6 Velocity contours colored by velocity magnitude for representative HCP (top) and FCC (bottom) unit cells with porosities of 0.91 and 0.95, respectively. Flow is in the positive z direction.
Fig. 7 Comparison between the simulated permeability of CIOs with FCC and HCP geometries and the experimentally measured permeability for seedless CIOs.
0
5
10
15
20
25
30
35
0.70 0.75 0.80 0.85 0.90 0.95
Perm
eabi
lity,
K×1
014 (
m2 )
Porosity
FEM HCP
FEM FCC
Experimental

and lower bounds on permeability at each porosity for the FCC and HCP cells.
Stacking multiple unit cells in the flow direction and simulating the development of the flow would also improve the computational model. Entrance effects may be significant in the actual samples because the sample thickness is less than an order of magnitude greater than the pore diameter. The approach of stacking multiple cells is therefore advantageous over implementing periodic boundary conditions on the boundaries perpendicular to the flow direction. The no slip condition on the walls parallel to the flow direction should be replaced with symmetry conditions. Application of the computational model to design situations requires a link between the ideal close-packed structures used in the pore-level simulation and the randomly packed structure present in the actual material. The current simulations do not take into account the fact that for constant pore and neck sizes, a sample with randomly packed pores will have a lower porosity than a sample with close-packed pores because of the lower packing density. A sample with randomly packed pores will also have more tortuous flow paths. The best connection between the simulations and the actual samples may be that the simulations illustrate an upper limit of the permeability.
CONCLUSIONS Copper inverse opals are a class of metal foams whose geometry can be tightly controlled at the pore level by the sacrificial template of spheres around which the metal is grown. Here we have demonstrated the first experimental characterization of fluid flow in inverse opals. The ultimate aim of future work is a governing equation for flow in inverse opals that will enable the development of this material for heat transfer applications. Verifying such an equation experimentally will require measuring the permeability for CIOs with a wide range of parameters. Future experiments will also improve the characterization of how the pore level structure varies when the sphere bed is sintered and when the CIO is electroetched. The characterization could be greatly enhanced by techniques such as µ-CT scanning and mercury intrusion porosimetry. Alternatively, advanced characterization methods could be avoided if the CIOs were ideally close packed.
ACKNOWLEGMENTS The authors are thankful for the support of the Defense Advanced Research Projects Agency ICECool Fundamentals program (agreement #HR0011-13-2-0011, “Phase Separation Diamond Microfluidics for HEMT Cooling”) and the National Science Foundation Graduate Research Fellowship Program. The authors would also like to acknowledge the technical and financial support of Toyota, IBM, and Boeing.
REFERENCES [1] G. J. Davies and S. Zhen, “Metallic foams: their production, properties and applications”, Journal of Materials Science, vol. 18, no. 7, pp. 1899–1911, 1983.
[2] A. G. Evans et al., “The topological design of multifunctional cellular metals”, Progress in Materials Science, vol. 46, no. 3, pp. 309–327, 2001. [3] L. P. Lefebvre et al., “Porous metals and metallic foams: current status and recent developments”, Advanced Engineering Materials, vol. 10, no. 9, pp. 775–787, 2008. [4] J. M. Hugo and F. Topin, “Metal Foams Design for Heat Exchangers: Structure and Effectives Transport Properties”, Advanced Structured Materials, vol. 13, pp. 219–244, 2011. [5] J. Banhart, “Manufacture, characterization and application of cellular metals and metal foams”, Progress in Materials Science, vol. 46, no. 6, pp. 559–632, 2001. [6] M. Kaviany, Principles of Heat Transfer in Porous Media, 2nd Edition, Springer Verlag, 1995. [7] S. G. Liter and M. Kaviany, “Pool-boiling CHF enhancement by modulated porous-layer coating: theory and experiment”, International Journal of Heat and Mass Transfer, vol. 44, no. 22, pp. 4287–4311, 2011. [8] V. V. Calmidi and R. L. Mahajan, “Forced convection in high porosity metal foams”, ASME Transactions Journal of Heat Transfer, vol. 122, no. 3, pp. 557–565, 2000. [9] R. Ranjan et al., “A microscale model for thin-film evaporation in capillary wick structures”, International Journal of Heat and Mass Transfer, vol. 54, no. 1-3, pp. 169–179, 2011. [10] K. K. Bodla et al., “Direct Simulation of Thermal Transport Through Sintered Wick Microstructures”, Journal of Heat Transfer, vol. 134, no. 1, 2012. [11] K. K. Bodla et al., “Evaporation analysis in sintered wick microstructures”, International Journal of Heat and Mass Transfer, vol. 61, pp. 729–741, 2013 [12] O.D. Velev et al., “Materials: a class of porous metallic nanostructures”, Nature, vol. 401, no. 6753, pp. 548–548. 1999. [13] P. Jiang et al., “Preparation of macroporous metal films from colloidal crystals”, Journal of the American Chemical Society, vol. 121, no. 34, pp. 7957–7958, 1999. [14] O.D. Velev and E. W. Kaler, “Structured porous materials via colloidal crystal templating: from inorganic oxides to metals”, Advanced Materials, vol. 12, no. 7, pp. 531–534, 2000. [15] K. M. Kulinowski et al., “Porous metals from colloidal templates”, Advanced Materials, vol. 12, no. 11, pp. 833–838, 2000. [16] O.D. Velev and A. M. Lenhoff, “Colloidal crystals as templates for porous materials”, Current Opinion in Colloid & Interface Science, vol. 5, no. 1, pp. 56–63, 2000. [17] P.V. Braun and P. Wiltzius, “Microporous materials: Electrochemically grown photonic crystals, Nature, vol. 402, no. 6762, pp. 603–604, 1999. [18] A. Blanco et al., “Large-scale synthesis of a silicon photonic crystal with a complete three-dimensional bandgap near 1.5 micrometres”, Nature, vol. 405, no. 6785, pp. 437–440, 2000. [19] P.V. Braun and P. Wiltzius, “Macroporous materials—electrochemically grown photonic crystals”, Current Opinion in Colloid & Interface Science, vol. 7,no. 1, pp. 116–123, 2002.
[20] X. Yu et al., “Filling Fraction Dependent Properties of Inverse Opal Metallic Photonic Crystals”, Advanced Materials, vol. 19, no. 13, pp. 1689–1692, 2007. [21] J. S. Song and M. A. Winnik, “Cross-Linked, Monodisperse, Micron-Sized Polystyrene Particles by Two-Stage Dispersion Polymerization”, Macromolecules, vol. 38, no. 20, pp. 8300–8307, 2005. [22] J. S. Song et al., “Two-Stage Dispersion Polymerization toward Monodisperse, Controlled Micrometer-Sized Copolymer Particles”, Journal of the American Chemical Society, vol. 126, no. 21, pp. 6562–6563, 2004. [23]! Lee, et al., “Peel-and-Stick: Mechanism Study for Efficient Fabrication of Flexible/Transparent Thin-film Electronics,” Scientific Reports, vol. 3, pp. 1 – 6, 2013. [24] H. Zhang et al., “Three-dimensional bicontinuous ultrafast-charge and -discharge bulk battery electrodes”, Nature Nanotechnology, vol. 6, no. 5, pp. 277–281, 2011. [25] R. Vidal and A. C. West, “Copper Electropolishing in Concentrated Phosphoric Acid I. Experimental Findings”, Journal of the Electrochemical Society, vol. 142, no. 8, pp. 2682–2689, 1995. [26] S. Krishnan et al., “Direct Simulation of Transport in Open-Cell Metal Foam”, Journal of Heat Transfer, vol. 128, no. 8, pp. 793, 2006.


![Opals [Waltz] - free-scores.com · Title: Opals [Waltz] Author: Cobb, George L. - Editeur: Boston, MA: Walter Jacobs, 1918 Subject: Public Domain Created Date: 3/13/2010 3:40:48 PM](https://img.pdfslide.us/doc/110x75/5f2a25cfa37f5b7c0d44b85b/opals-waltz-free-title-opals-waltz-author-cobb-george-l-editeur-boston.jpg)