Embed Size (px)
Citation preview

Inverse Modeling of Asian CO and NOx emissions
Yuxuan WangYuxuan Wang
M.B. McElroy, T. Wang, and P. I. PalmerM.B. McElroy, T. Wang, and P. I. Palmer
22ndnd GEOS-CHEM Users’ Meeting GEOS-CHEM Users’ Meeting
April 5, 2005April 5, 2005

2
Nested grid version of GEOS-CHEM
11 x1 x1
44 x5 x5
v5-07-08

3
TRACE-P Aircraft and Chinese Stations Data
Time frame: Jan – Apr., 2001
Hong Kong
Lin An

4
A priori Emissions of CO and NOx
r
Uncertainties: 154% for CO, 27% for NOx
Source: Streets et al. [2003]

5
Model Underestimates Aircraft Observations of CO and NOy

6
Model Underestimates Surface Measurements
CO
NOy
Lin An
Hong Kong
Lin An
Hong Kong

7
Tagged Tracer Simulation
Assume the model concentration fields are linear combinations of contributions from tagged sources

8
Tagged Tracer Simulation
Assume the model concentration fields are linear combinations of contributions from tagged sources
9
NOy Chemistry and Deposition Scheme
1. Model has no bias in simulating 1. Model has no bias in simulating contributions of contributions of component NOcomponent NOyy species to total NO species to total NOyy below 6km below 6km
no systematic bias in NOno systematic bias in NOyy chemistry and relative chemistry and relative deposition rate in the model deposition rate in the model
2. Linear relationship between NO2. Linear relationship between NOxx emissions and NO emissions and NOyy concentrations can thus be adopted. concentrations can thus be adopted.
NOx/NOy HNO3/NOy PAN/NOy

10
Error specification
RRE method for aircraft observations RRE method for aircraft observations (spatially selected bins) [Palmer et al., 2003](spatially selected bins) [Palmer et al., 2003]RE = (modeled – observed ) / observedRE = (modeled – observed ) / observed mean of RE due to bias in emissions; mean of RE due to bias in emissions;
std. of RE due to total model errorstd. of RE due to total model error Values of RRE for the aircraft data: 20% for Values of RRE for the aircraft data: 20% for
CO and 30% for NOCO and 30% for NOyy
RRE method for station data (temporal RRE method for station data (temporal selected bins) selected bins)
mean of RE due to bias in emissions; std. of mean of RE due to bias in emissions; std. of RE due to total model errorRE due to total model error
)Kx(ySK)SKS(Kxx a1
ΣT11
a1
ΣT
a
11
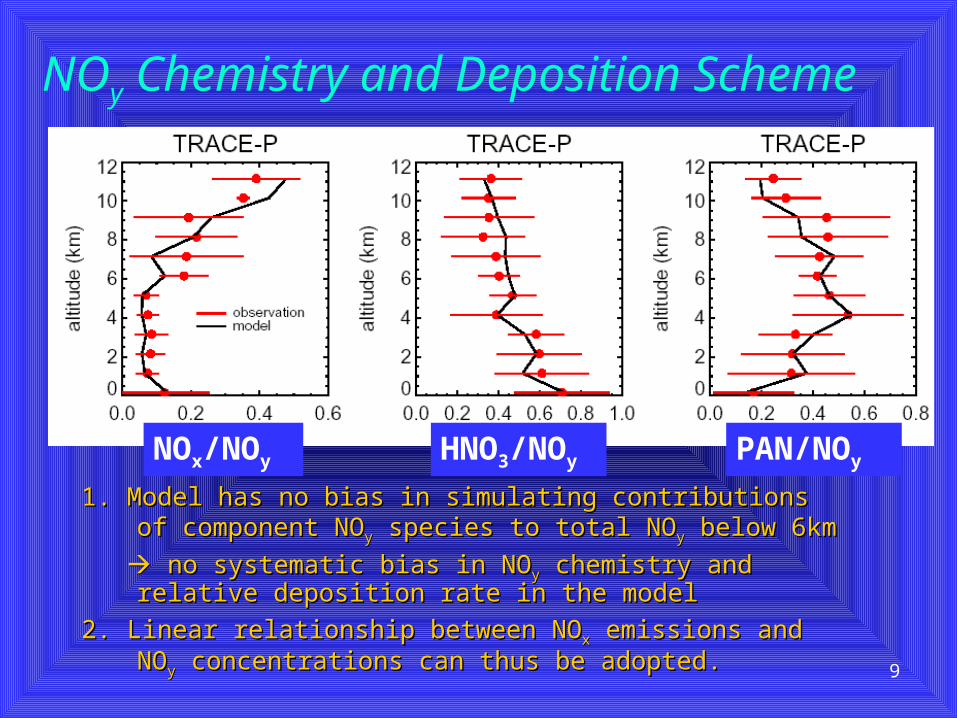
Treatment for the station data
N
tt
kN
tktt
k
xx
xxxx
kN
Nr
1
2
1
)(
))((
1.1. average the observed and simulated concentrations of CO average the observed and simulated concentrations of CO and NOand NOyy every 2 days (~76 data) every 2 days (~76 data)
2.2. Errors: 7% (Feb) ~15% (Apr) for CO and NOErrors: 7% (Feb) ~15% (Apr) for CO and NOyy at Lin An; at Lin An; 14% ~ 7% for CO at HK, 47% ~ 24% for NO14% ~ 7% for CO at HK, 47% ~ 24% for NOyy at HK at HK
12
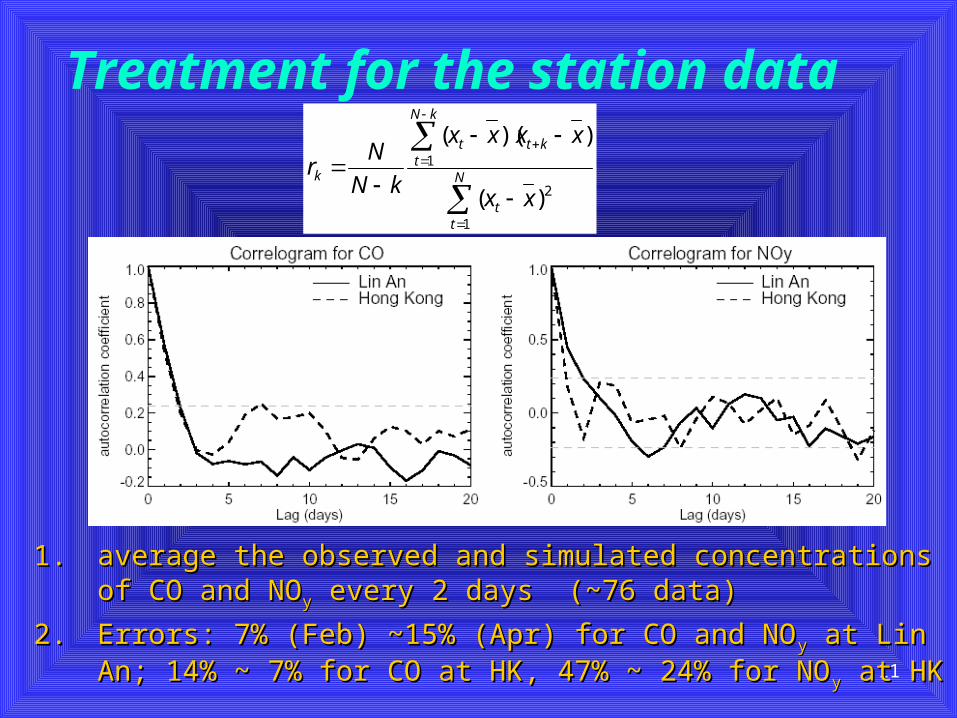
Uncertainties are from ensemble simulations

13
?
Uncertainties are from ensemble simulations

14
Microbial Sources of NOx and N2O
Nitrification: NHNitrification: NH44++ NO NO22
-- NO NO33--
Denitrification: NODenitrification: NO33-- N N22O O N N22
The weight of the evidence suggests The weight of the evidence suggests that nitrification provides the that nitrification provides the dominant source of Ndominant source of N22O. O.
NH2OH
N2O, NO
O2 O2
N2O, NO
Low levels of O2 Aerobic denitr.
15
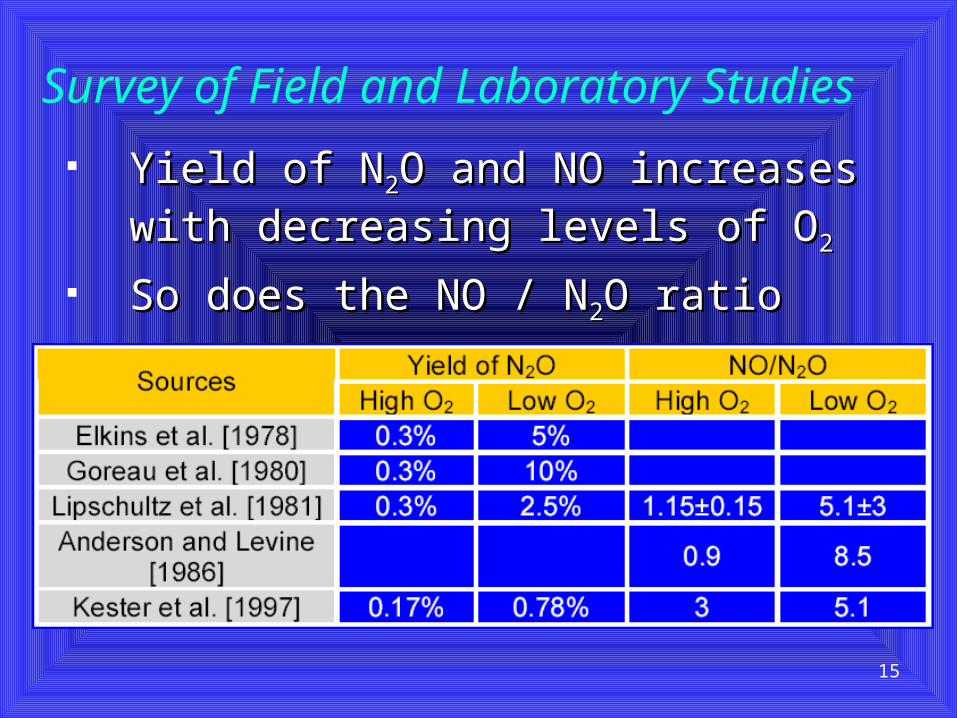
Survey of Field and Laboratory Studies
Yield of NYield of N22O and NO increases with O and NO increases with
decreasing levels of Odecreasing levels of O22
So does the NO / NSo does the NO / N22O ratio O ratio

16
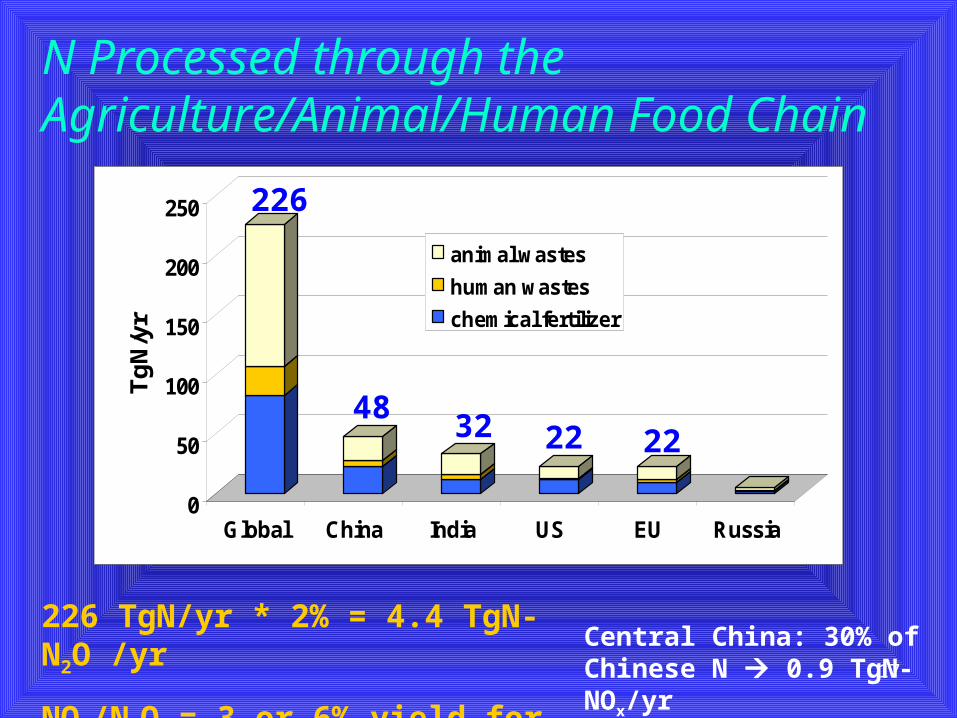
N Processed through the Agriculture/Animal/Human Food Chain
0
50
100
150
200
250
Tg
N/y
r
Global China India US EU Russia
animal wastes
human wastes
chemical fertilizer
226
Data from FAO
4832 22 22
17
N Processed through the Agriculture/Animal/Human Food Chain
226 TgN/yr * 2% = 4.4 TgN-N2O /yr
NOx/N2O = 3 or 6% yield for NOx
0
50
100
150
200
250
Tg
N/y
r
Global China India US EU Russia
animal wastes
human wastes
chemical fertilizer
Central China: 30% of Chinese N 0.9 TgN-NOx/yr
226
4832 22 22

18
Biological and combustion sources of NOx
0
5
10
15
20
25
30
35
Global China India US EU Russia
Tg
N-N
Ox/
yr
biological NOx sources
fossil fuel sources
Biomass burning sources are excluded

19
Future Work
1.1. Reconcile our results with previous top-Reconcile our results with previous top-down estimates of NOdown estimates of NOxx emissions (e.g., emissions (e.g.,
GOME NOGOME NO22 column) column)
2.2. Seasonality of biological sources Seasonality of biological sources (relative abundance of NO(relative abundance of NO22
-- and O and O22) )
3.3. Impact of biological sources of NOImpact of biological sources of NOxx on on
ozone and OHozone and OH
4.4. 3-D modeling of N3-D modeling of N22O O