Embed Size (px)
DESCRIPTION
Inventory Quantities - Merchandiser. Consists of many different items Owned by the company In a form ready for sale to customers One inventory classification: merchandise inventory. Inventory Quantities - Manufacturer. Some inventory not ready for sale - PowerPoint PPT Presentation
Citation preview
Chapter 5
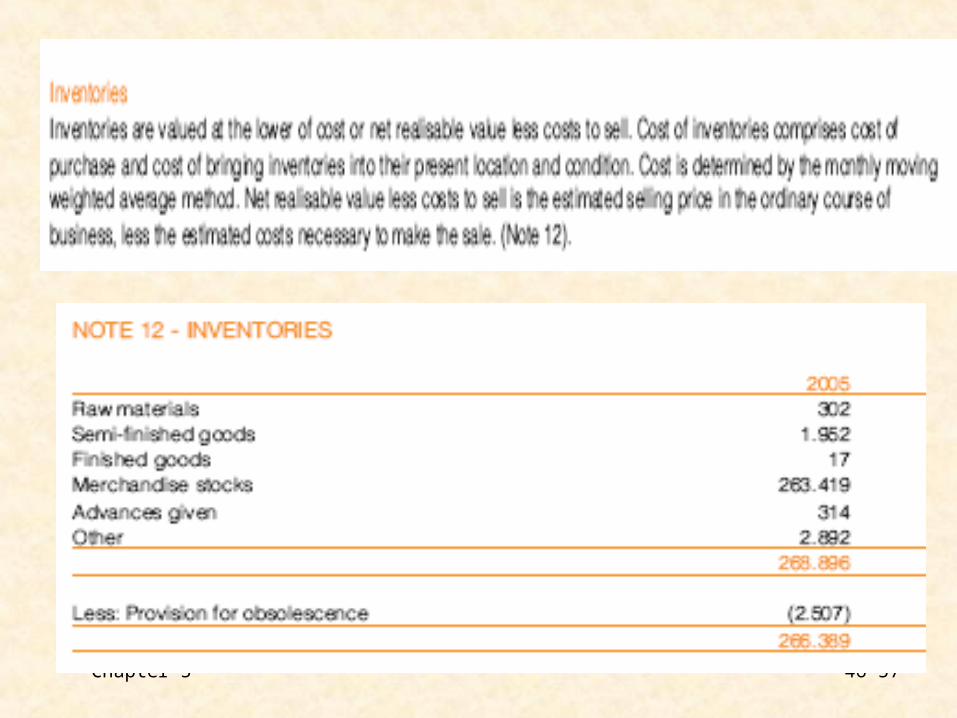
Inventories
Chapter 5 2-57
Inventory Quantities - Inventory Quantities - MerchandiserMerchandiser
• Consists of many different itemsConsists of many different items
• Owned by the companyOwned by the company
• In a form ready for sale to customersIn a form ready for sale to customers
• One inventory classification: One inventory classification: merchandise inventorymerchandise inventory
Chapter 5 3-57
Inventory Quantities - Inventory Quantities - ManufacturerManufacturer
• Some inventory not ready for saleSome inventory not ready for sale
• Classify inventory into three categoriesClassify inventory into three categories
– Finished goodsFinished goods
– Work in processWork in process
– Raw materialsRaw materials
Chapter 5 4-57
Finished Goods InventoryFinished Goods Inventory
Manufactured items that are complete Manufactured items that are complete and ready for sale.and ready for sale.
Chapter 5 5-57
Work in ProcessWork in Process
Manufactured inventory that has been Manufactured inventory that has been placed into production but is not yet placed into production but is not yet
complete.complete.
Chapter 5 6-57
Raw MaterialsRaw Materials
The basic goods that will be used in The basic goods that will be used in production, but have not been placed in production, but have not been placed in
production.production.
Chapter 5 7-57
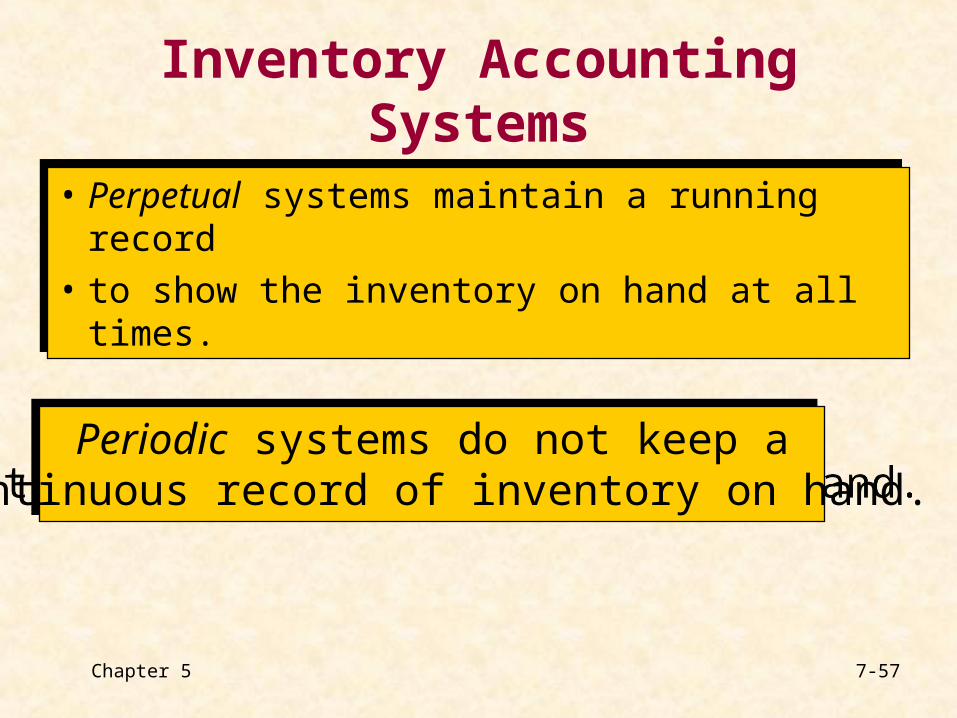
Inventory Accounting Systems
• Perpetual systems maintain a running record
• to show the inventory on hand at all times.
• Perpetual systems maintain a running record
• to show the inventory on hand at all times.
Periodic systems do not keep acontinuous record of inventory on hand.
Periodic systems do not keep acontinuous record of inventory on hand.
Chapter 5 8-57
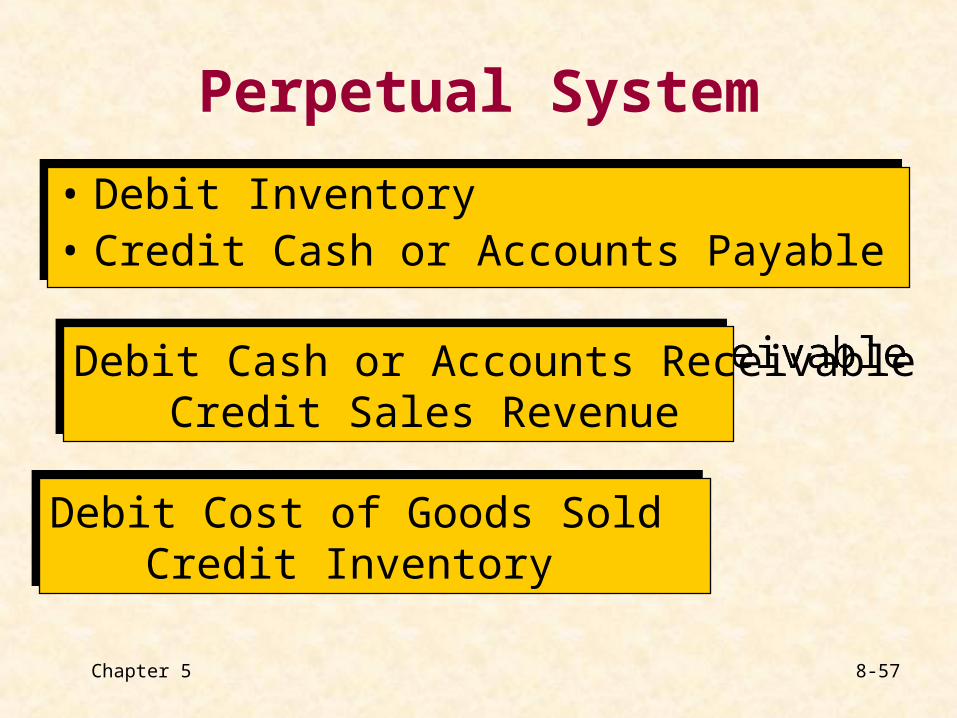
Perpetual System
• Debit Inventory• Credit Cash or Accounts Payable• Debit Inventory• Credit Cash or Accounts Payable
Debit Cash or Accounts ReceivableCredit Sales Revenue
Debit Cash or Accounts ReceivableCredit Sales Revenue
Debit Cost of Goods SoldCredit Inventory
Debit Cost of Goods SoldCredit Inventory
Chapter 5 9-57
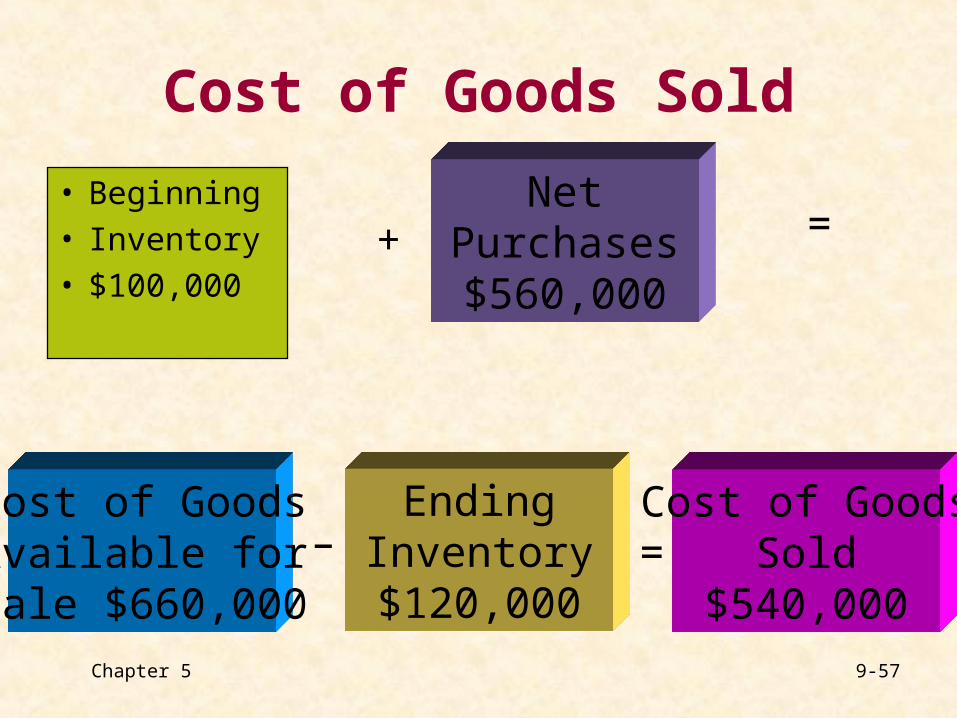
Cost of Goods Sold
• Beginning• Inventory• $100,000
+Net
Purchases$560,000
=
Cost of GoodsAvailable forSale $660,000
–Ending
Inventory$120,000
=Cost of Goods
Sold$540,000
Chapter 5 10-57
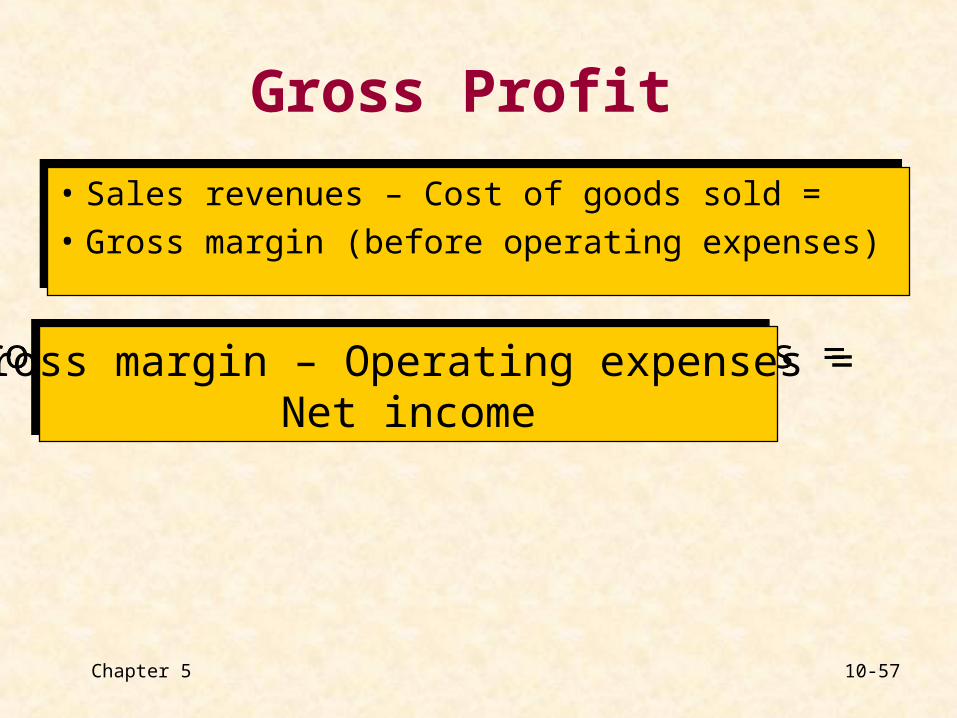
Gross Profit
• Sales revenues – Cost of goods sold =
• Gross margin (before operating expenses)• Sales revenues – Cost of goods sold =
• Gross margin (before operating expenses)
Gross margin – Operating expenses =Net income
Gross margin – Operating expenses =Net income
Chapter 5 11-57
Why inventories are so important?
Chapter 5 12-57
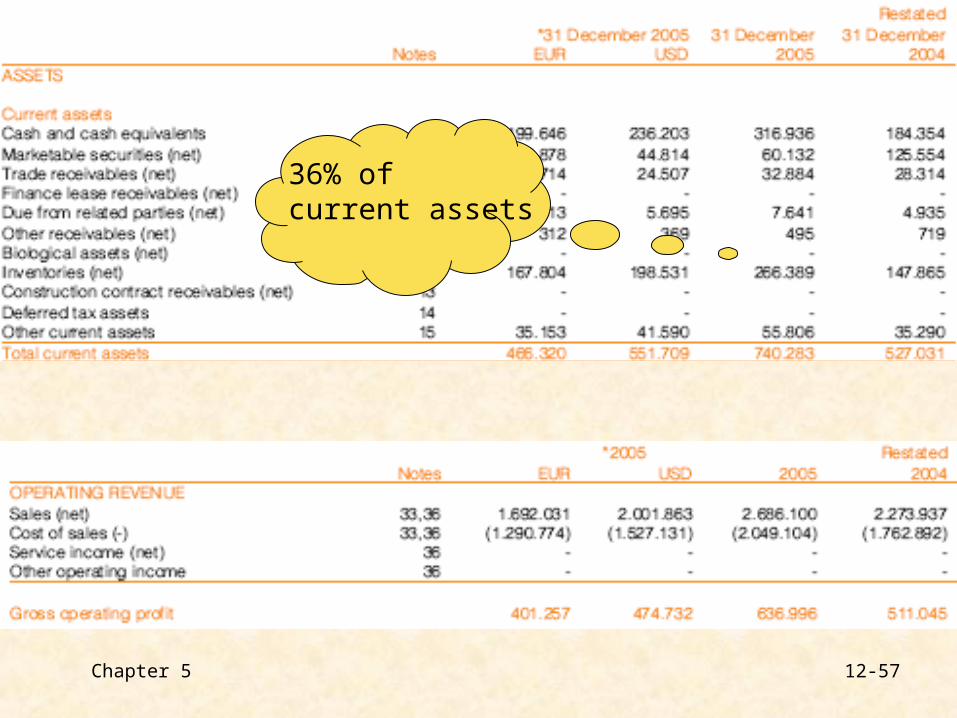
36% of current assets
Chapter 5 13-57
Composition of Inventories
Quantity• taking a physical count of inventories• determining the ownership of goods.
INVENTORY = Unit cost * Quantity
Unit Cost• Cost Flow Assumptions
Chapter 5 14-57
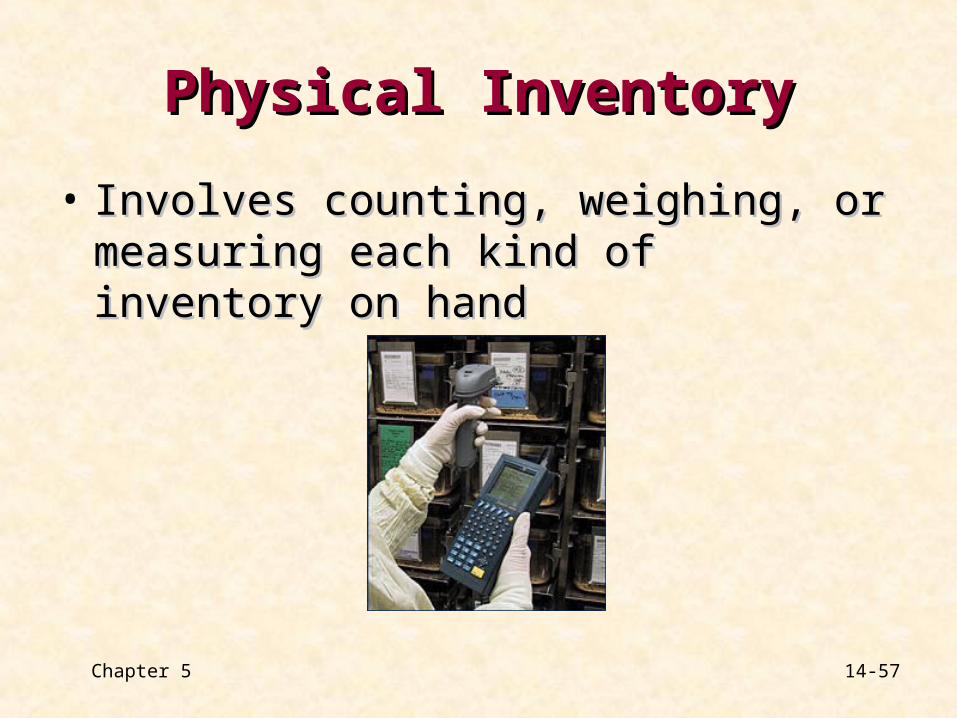
Physical InventoryPhysical Inventory
• Involves counting, weighing, or measuring Involves counting, weighing, or measuring each kind of inventory on handeach kind of inventory on hand
Chapter 5 15-57
Taking Physical Count
During the physical count, a company should pay very close attention to the following issues in order to have an effective internal control and also to minimize the errors and fraud:1. the employees who are responsible from safekeeping of
inventory items should not count them,2. it has to be made sure that the items are complete and what
they are supposed to be,3. items should be re-counted by another independent employee
for verification,4. counting process should be documented by tagging the
inventory items,5. a supervisor should oversee that each item has only one tag,
and that each item is counted, and6. there should be no inventory movements during the count
Chapter 5 16-57
Determine OwnershipDetermine Ownership
• Do all the goods included in the count Do all the goods included in the count belong to the company?belong to the company?
• Does the company own any goods that Does the company own any goods that were not included in the count?were not included in the count?
Chapter 5 17-57
Whose ?
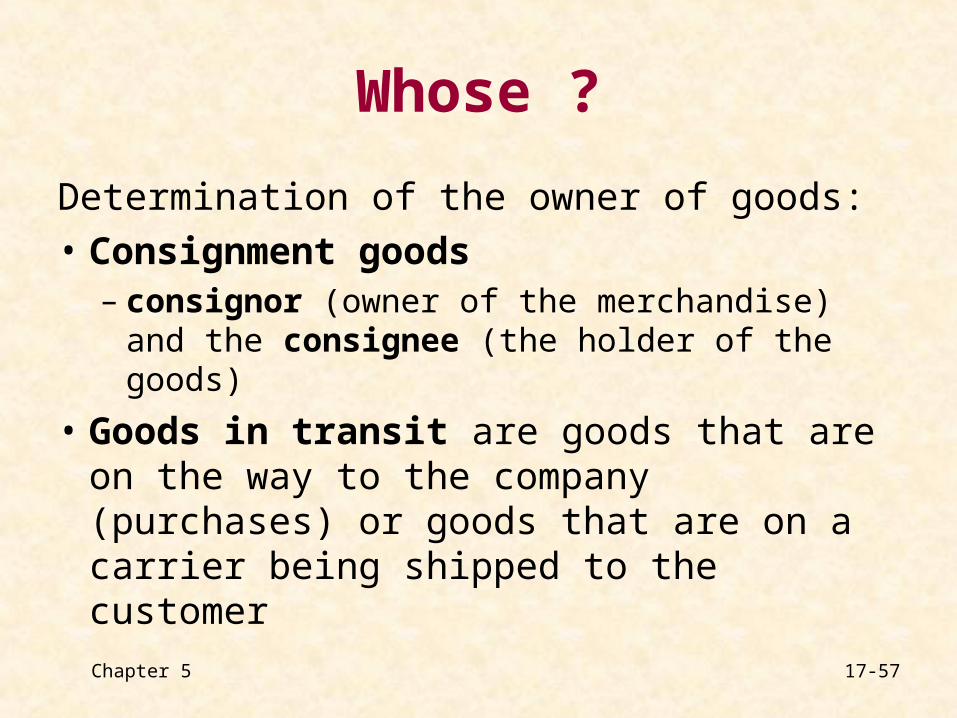
Determination of the owner of goods:
• Consignment goods – consignor (owner of the merchandise) and
the consignee (the holder of the goods)
• Goods in transit are goods that are on the way to the company (purchases) or goods that are on a carrier being shipped to the customer
Chapter 5 18-57
Goods in TransitGoods in Transit
• Goods are shipped on board trucks, trains, Goods are shipped on board trucks, trains, ships, and airplanesships, and airplanes
• To arrive at an accurate count, ownership To arrive at an accurate count, ownership of goods in transit must be determinedof goods in transit must be determined
• Goods in transit should be included in Goods in transit should be included in the inventory of the company that has the inventory of the company that has legal title to the goodslegal title to the goods
Chapter 5 19-57
Goods in TransitGoods in Transit
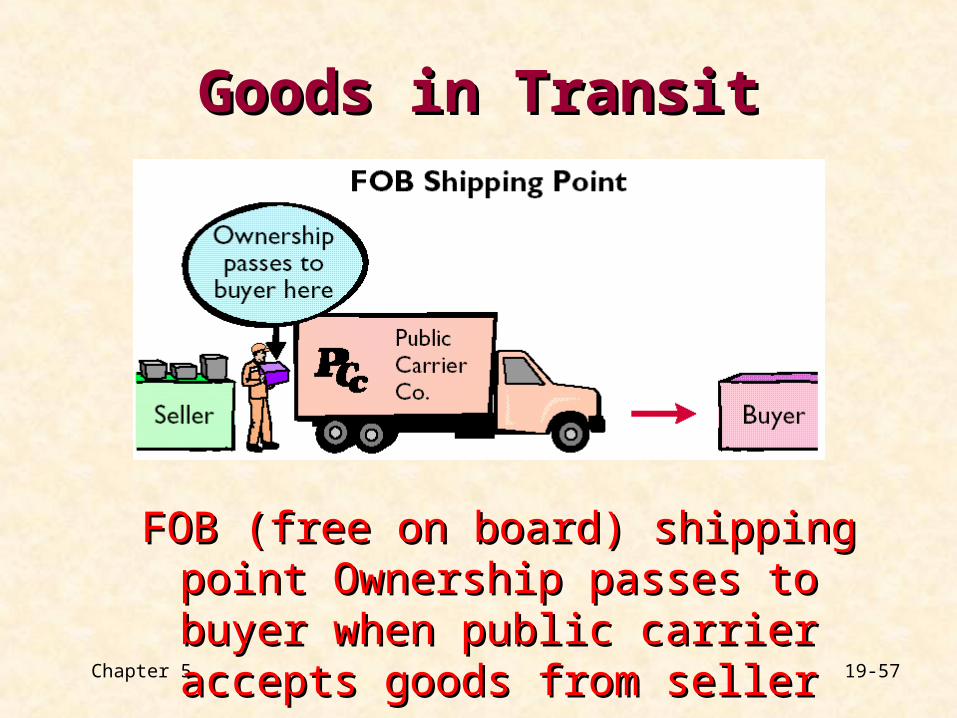
FOB (free on board) shipping point FOB (free on board) shipping point Ownership passes to buyer when public Ownership passes to buyer when public
carrier accepts goods from sellercarrier accepts goods from seller
Chapter 5 20-57
Goods in TransitGoods in Transit
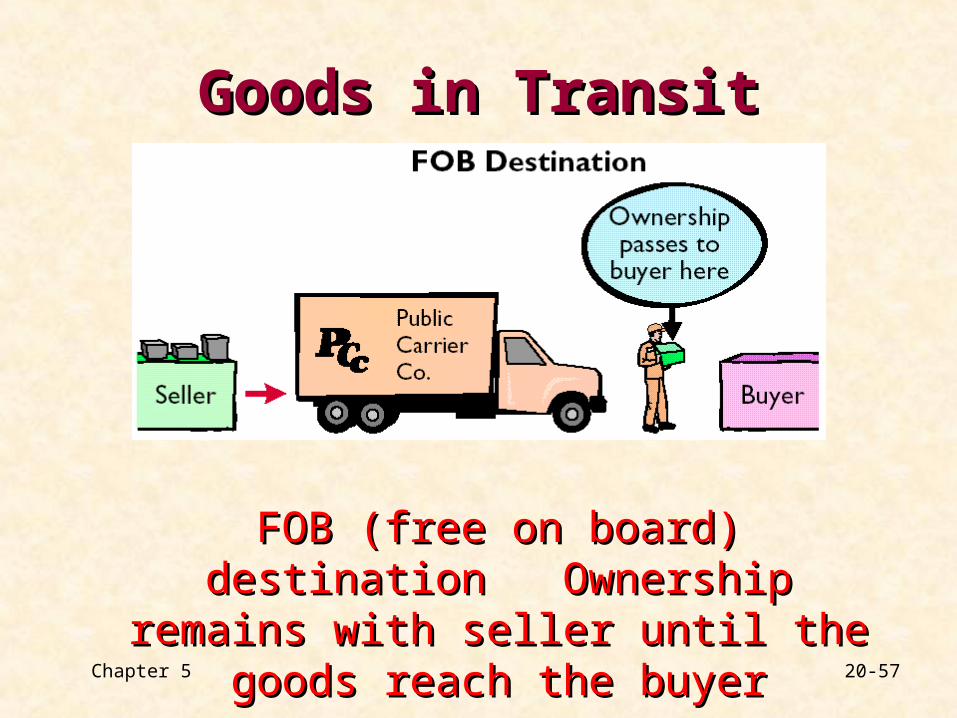
FOB (free on board) destination FOB (free on board) destination Ownership remains with seller until the Ownership remains with seller until the
goods reach the buyergoods reach the buyer
Chapter 5 21-57
Consigned GoodsConsigned Goods
• In some lines of business, it is customary In some lines of business, it is customary to hold the goods of other parties and try to hold the goods of other parties and try to sell the goods for them for a fee, but to sell the goods for them for a fee, but without taking ownershipwithout taking ownership
Chapter 5 22-57
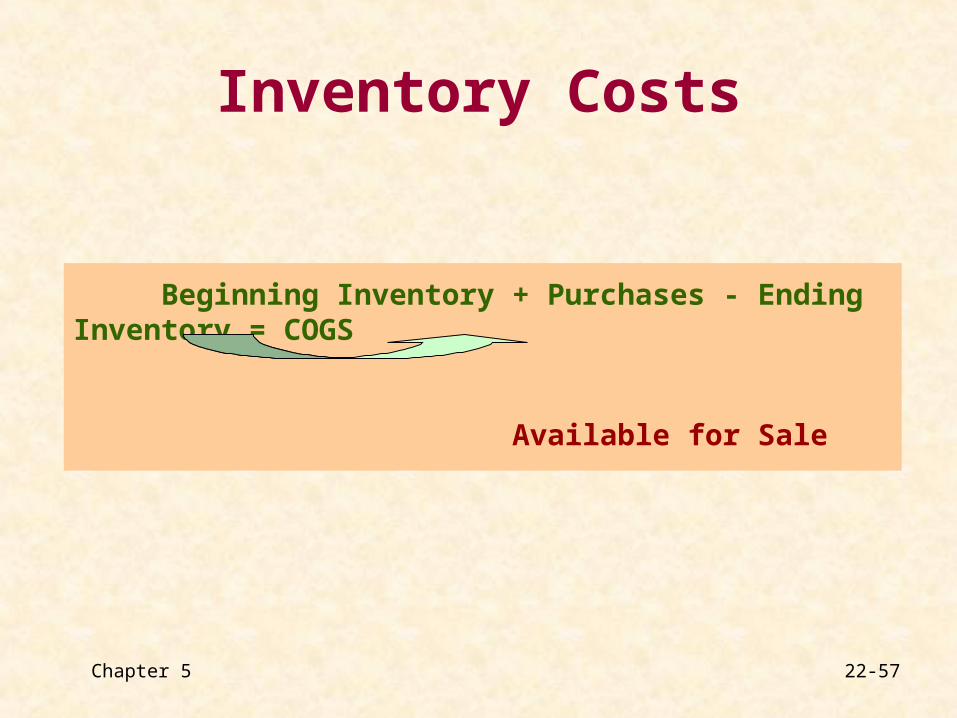
Inventory Costs
Beginning Inventory + Purchases - Ending Inventory = COGS
Available for Sale
Chapter 5 23-57
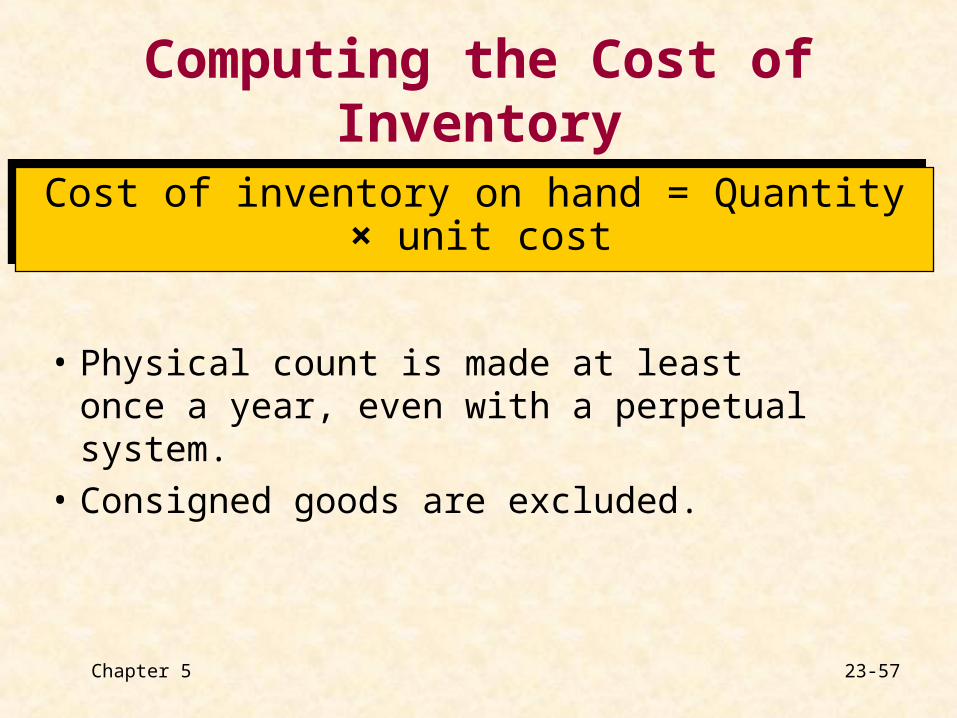
Computing the Cost of Inventory
Cost of inventory on hand = Quantity × unit cost Cost of inventory on hand = Quantity × unit cost
• Physical count is made at least once a year, even with a perpetual system.
• Consigned goods are excluded.
Chapter 5 24-57
Inventory Cost Flows
• Specific Identification Method
• First-in First-out
• Weighted Average
• Last-in First-out – not allowed by IFRS or CMB
Chapter 5 25-57
Specific Identification Method
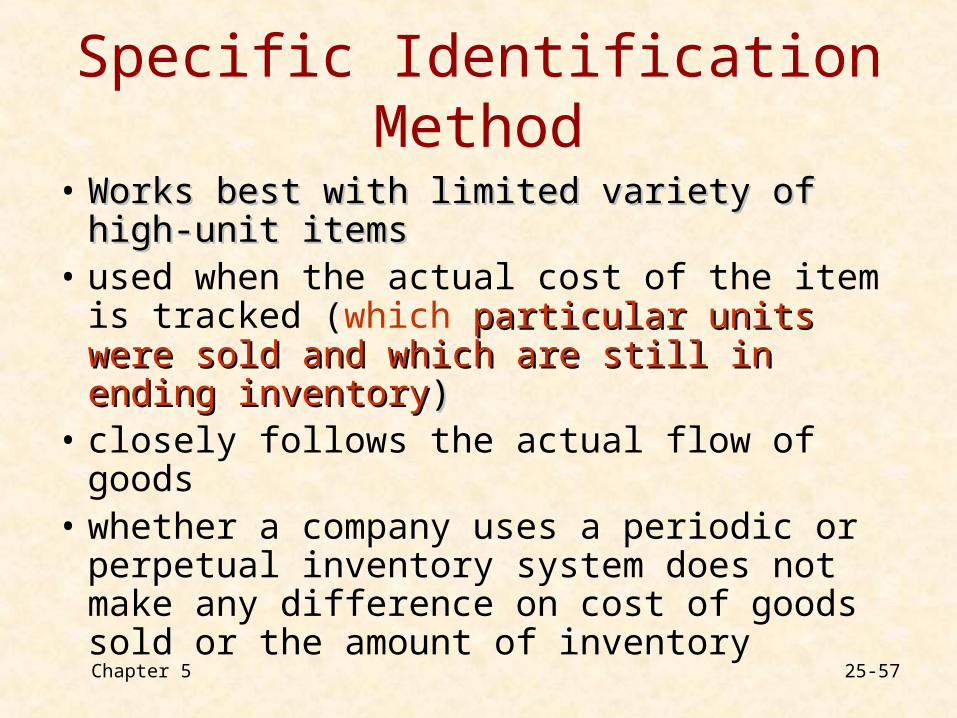
• Works best with limited variety of high-unit Works best with limited variety of high-unit itemsitems
• used when the actual cost of the item is tracked (which particular units were sold particular units were sold and which are still in ending inventoryand which are still in ending inventory))
• closely follows the actual flow of goods • whether a company uses a periodic or
perpetual inventory system does not make any difference on cost of goods sold or the amount of inventory
Chapter 5 26-57
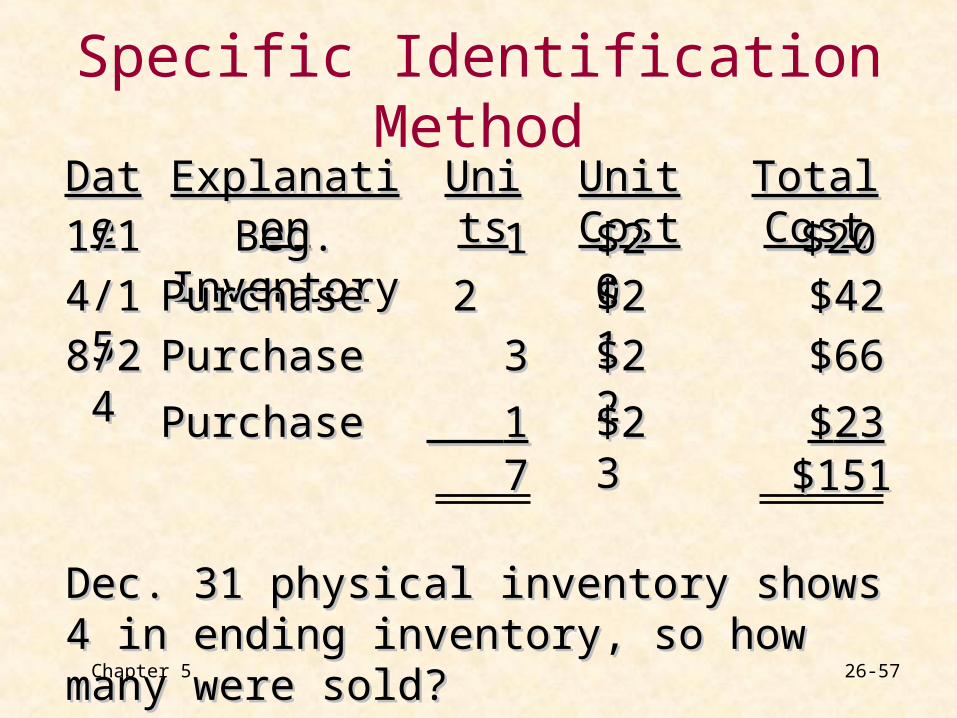
Specific Identification MethodDateDate
1/11/1
4/154/15
8/248/24
ExplanationExplanation UnitUnitss
Unit CostUnit Cost Total CostTotal Cost
Beg. InventoryBeg. Inventory
PurchasePurchase
PurchasePurchase
PurchasePurchase
11
22
33
1177
$$2200
$$2121
$$2222
$$2233
$$2200
$$4242
$$6666
$$2323$$151151
Dec. 31 physical inventory shows 4 in ending Dec. 31 physical inventory shows 4 in ending inventory, so how many were sold?inventory, so how many were sold?
Chapter 5 27-57
Cost Flow Methods
• When When there is sales of thousand units of there is sales of thousand units of identical products, the identity of the goods identical products, the identity of the goods purchased at a specific cost is lost and purchased at a specific cost is lost and management may choose a cost flow management may choose a cost flow method method such as such as FIFOFIFO, WA instead of , WA instead of Specific Identification Method.Specific Identification Method.
Chapter 5 28-57
Cost Flow vs. Physical Flow
• First-in First-out (FIFO), and weighted average methods assume that flow of costs may be unrelated to physical flow of goods
• The accounting regulations do not require that the physical flow of goods and the related cost flow to be the same
Chapter 5 29-57
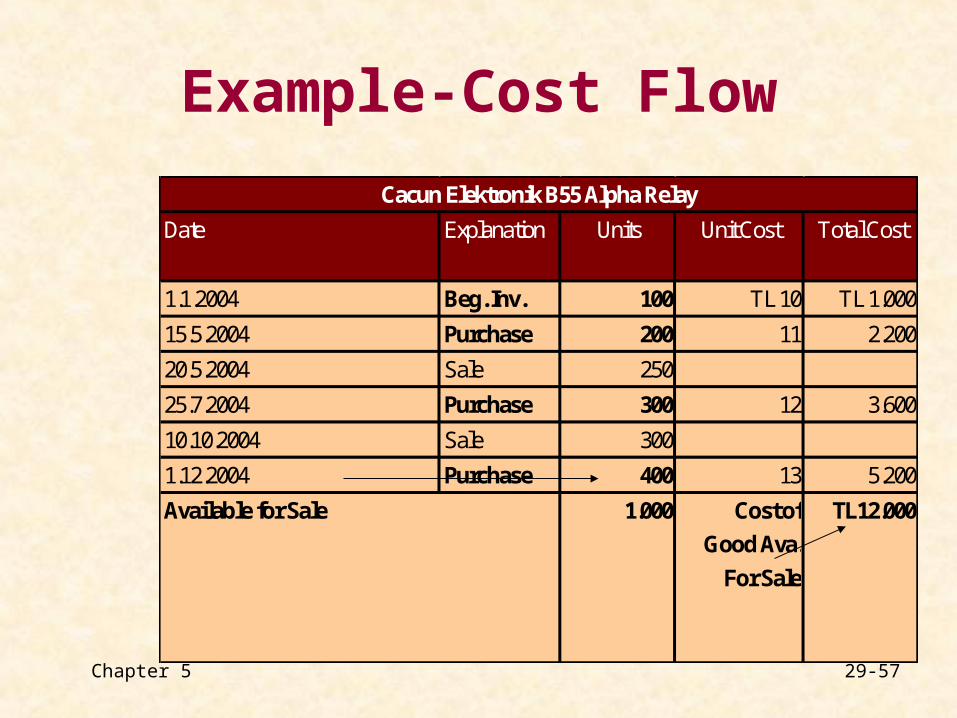
Example-Cost Flow
Date Explanation Units Unit Cost Total Cost
1.1.2004 Beg. Inv. 100 TL 10 TL 1.000
15.5.2004 Purchase 200 11 2.200
20.5.2004 Sale 250
25.7.2004 Purchase 300 12 3.600
10.10.2004 Sale 300
1.12.2004 Purchase 400 13 5.200
1.000 Cost of
Good Ava.
For Sale
TL12.000
Cacun Elektronik B55 Alpha Relay
Available for Sale
Chapter 5 30-57
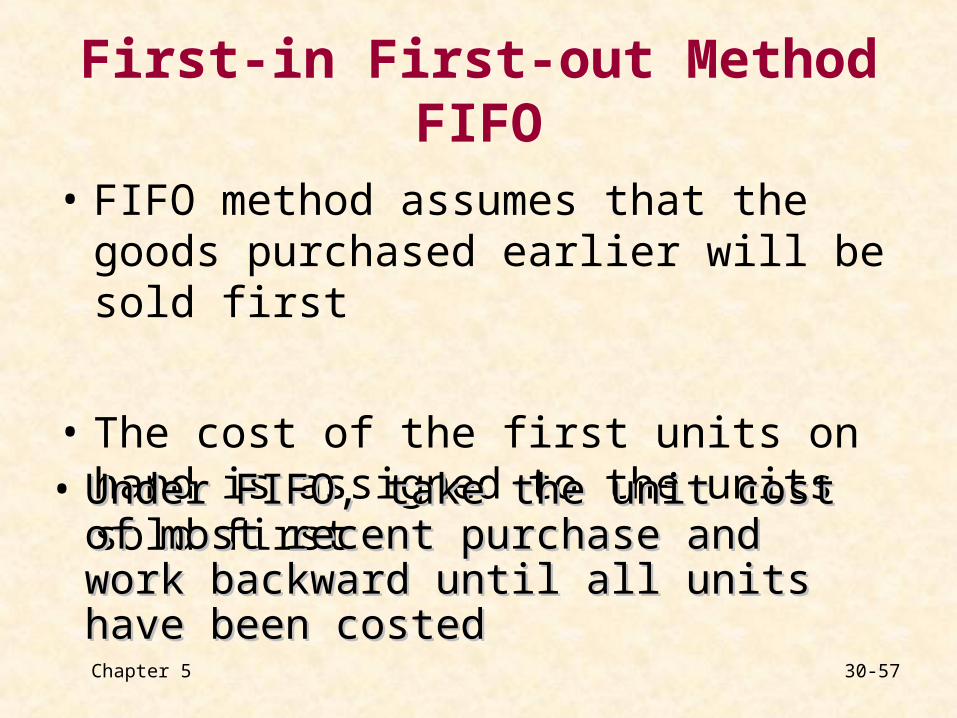
First-in First-out MethodFIFO
• FIFO method assumes that the goods purchased earlier will be sold first
• The cost of the first units on hand is assigned to the units sold first
• Under FIFO, take the unit cost of most Under FIFO, take the unit cost of most recent purchase and work backward recent purchase and work backward until all units have been costeduntil all units have been costed
Chapter 5 31-57
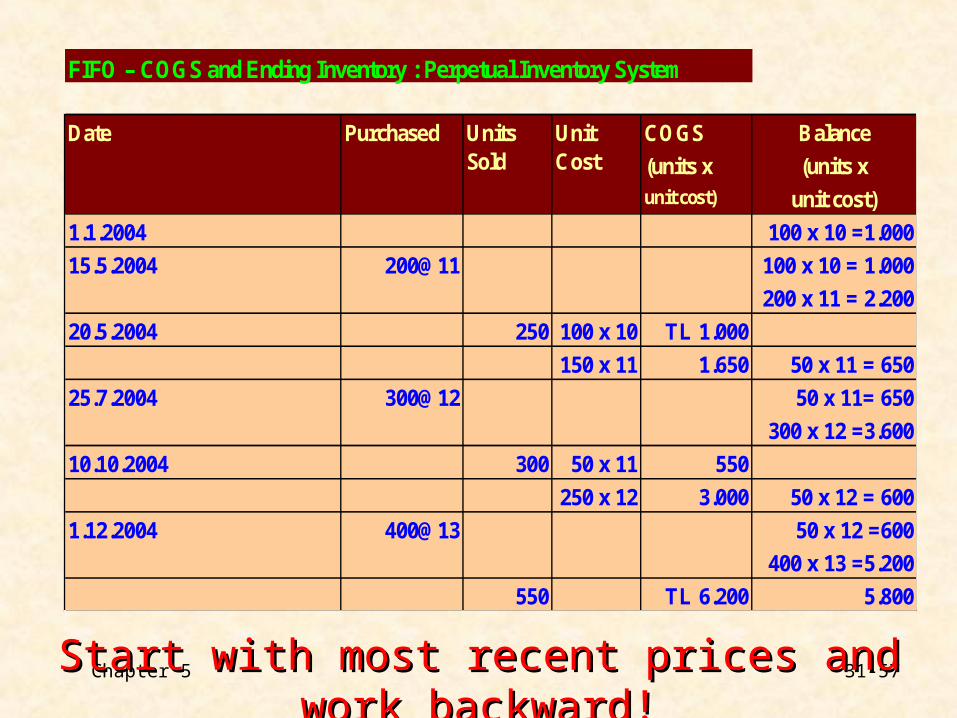
FIFO – COGS and Ending Inventory : Perpetual Inventory System
COGS Balance
(units x (units xunit cost) unit cost)
1.1.2004 100 x 10 =1.000
100 x 10 = 1.000
200 x 11 = 2.200
20.5.2004 250 100 x 10 TL 1.000
150 x 11 1.650 50 x 11 = 650
50 x 11= 650
300 x 12 =3.600
10.10.2004 300 50 x 11 550
250 x 12 3.000 50 x 12 = 600
50 x 12 =600
400 x 13 =5.200
550 TL 6.200 5.800
Date Purchased Units Sold
Unit Cost
25.7.2004 300@12
15.5.2004 200@11
1.12.2004 400@13
Start with most recent prices and Start with most recent prices and work backwardwork backward!!
Chapter 5 32-57
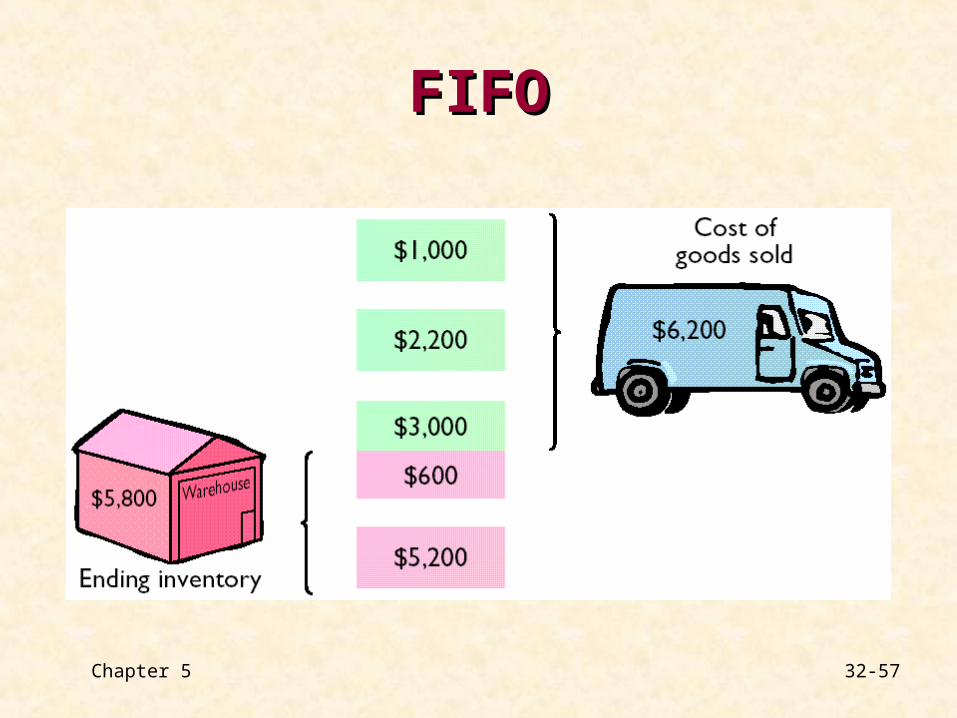
FIFOFIFO
Chapter 5 33-57
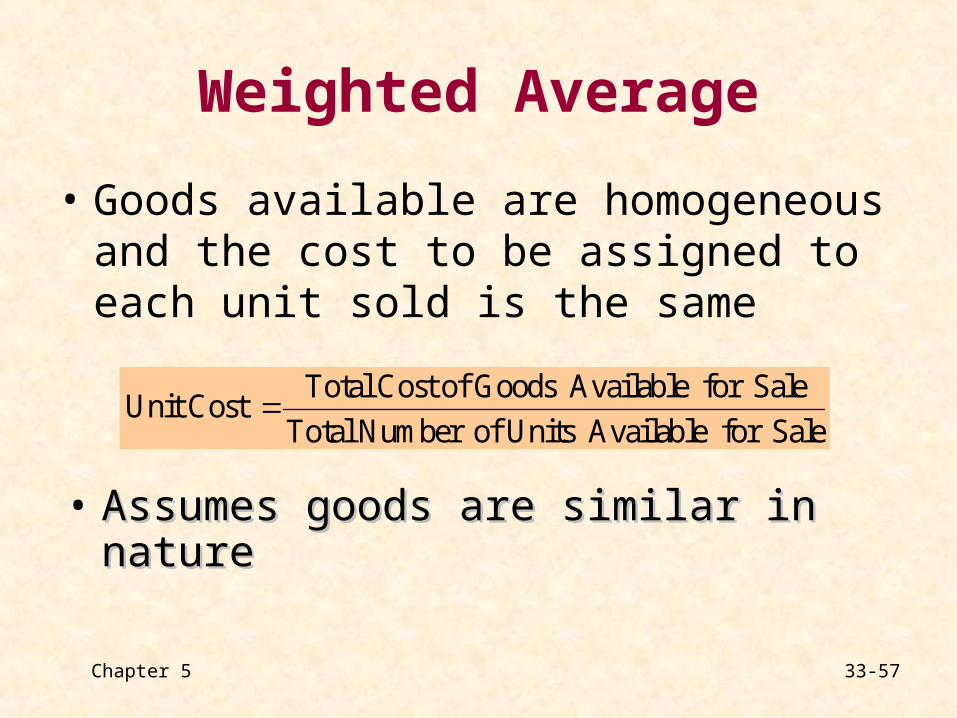
Weighted Average
• Goods available are homogeneous and the cost to be assigned to each unit sold is the same
Total Cost of Goods Available for SaleUnit Cost
Total Number of Units Available for Sale
• Assumes goods are similar in natureAssumes goods are similar in nature
Chapter 5 34-57
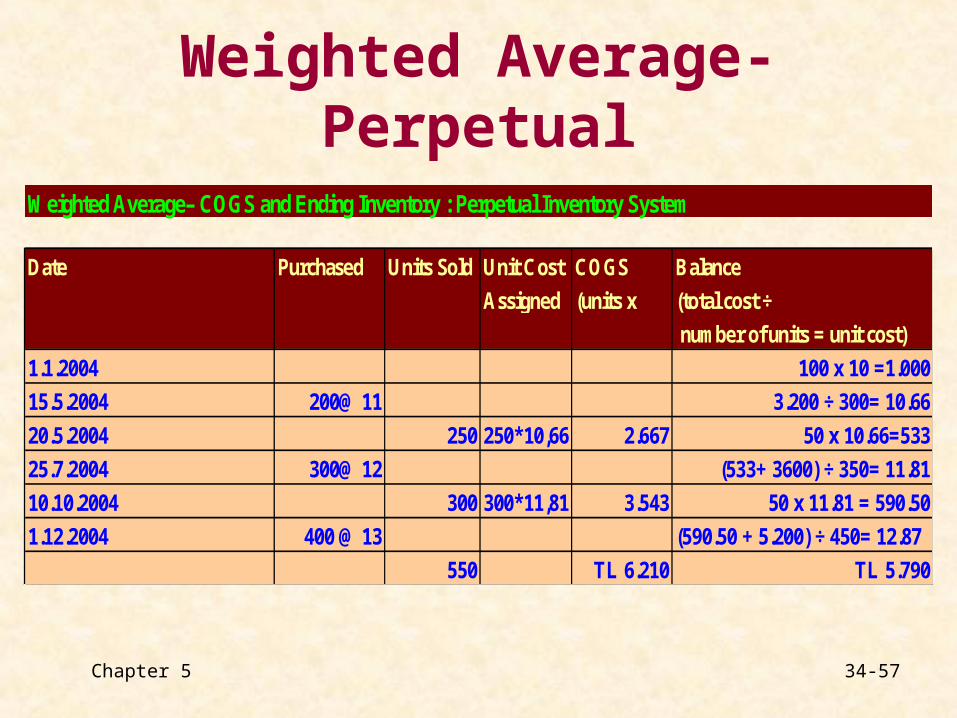
Weighted Average-Perpetual
Weighted Average– COGS and Ending Inventory : Perpetual Inventory System
Unit Cost COGS Balance
Assigned (units x unit cost)
(total cost ÷
number of units = unit cost)
1.1.2004 100 x 10 =1.000
15.5.2004 200@ 11 3.200 ÷ 300= 10.66
20.5.2004 250 250*10,66 2.667 50 x 10.66=533
25.7.2004 300@ 12 (533+ 3600) ÷ 350= 11.81
10.10.2004 300 300*11,81 3.543 50 x 11.81 = 590.50
1.12.2004 400 @ 13 (590.50 + 5.200) ÷ 450= 12.87
550 TL 6.210 TL 5.790
Date Purchased Units Sold
Chapter 5 35-57
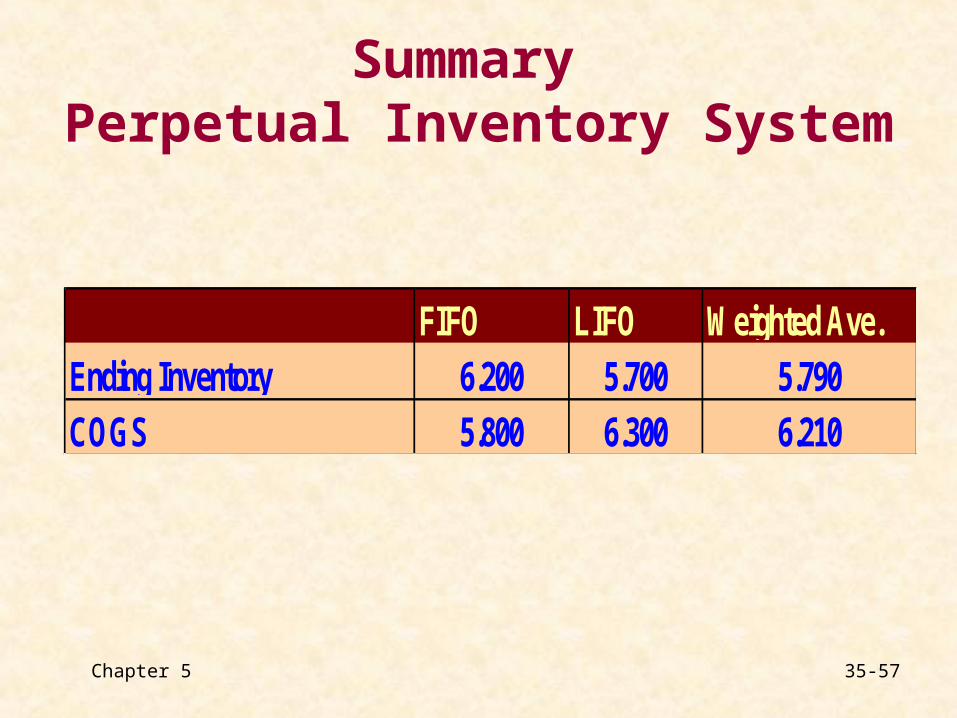
Summary Perpetual Inventory System
FIFO LIFO Weighted Ave.Ending Inventory 6.200 5.700 5.790COGS 5.800 6.300 6.210
Chapter 5 36-57
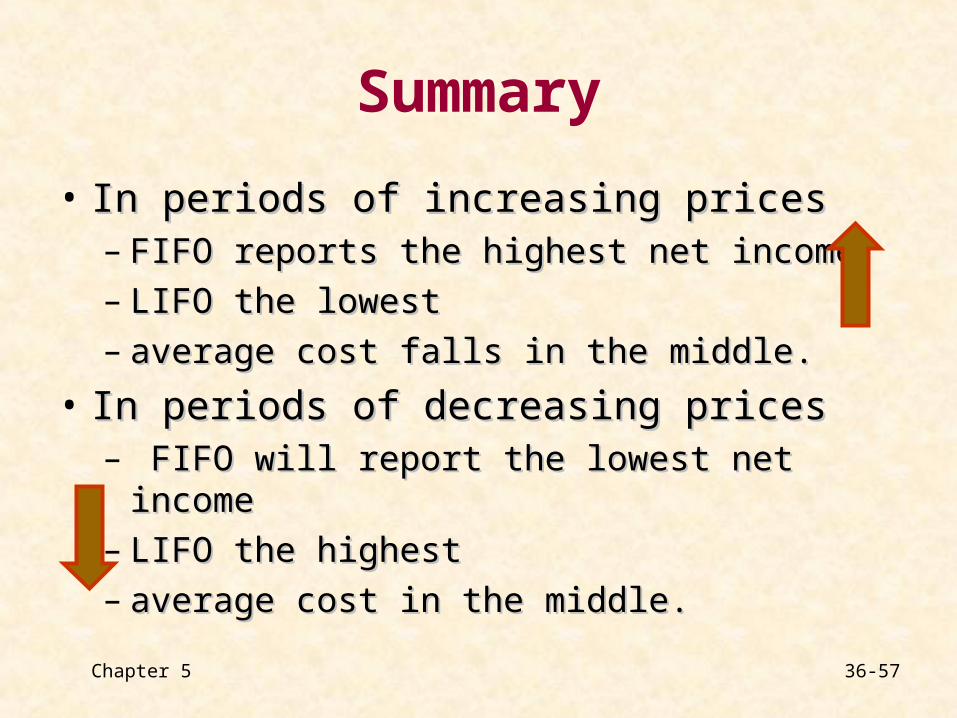
Summary
• In periods of increasing pricesIn periods of increasing prices– FIFO reports the highest net income FIFO reports the highest net income – LIFO the lowestLIFO the lowest– average cost falls in the middle. average cost falls in the middle.
• In periods of decreasing pricesIn periods of decreasing prices– FIFO will report the lowest net incomeFIFO will report the lowest net income– LIFO the highestLIFO the highest– average cost in the middle.average cost in the middle.
Chapter 5 37-57
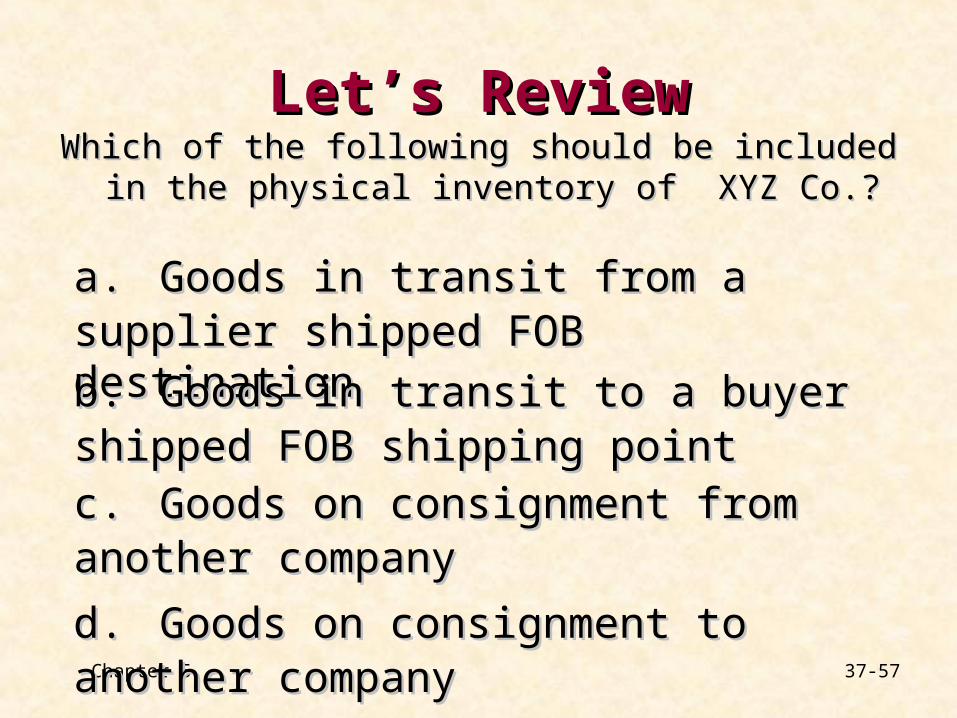
Let’s ReviewLet’s ReviewWhich of the following should be included in Which of the following should be included in
the physical inventory of XYZ Co.?the physical inventory of XYZ Co.?
a.a. Goods in transit from a supplier shipped Goods in transit from a supplier shipped FOB destinationFOB destination
b.b. Goods in transit to a buyer shipped FOB Goods in transit to a buyer shipped FOB shipping pointshipping point
c.c. Goods on consignment from another Goods on consignment from another companycompany
d.d. Goods on consignment to another companyGoods on consignment to another company
Chapter 5 38-57
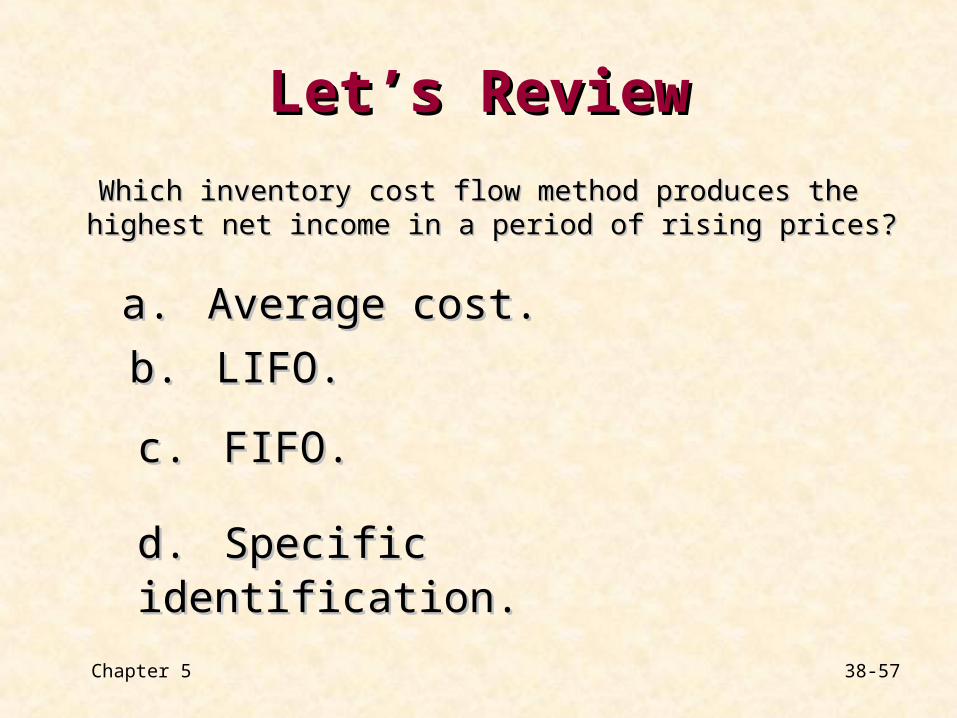
Let’s ReviewLet’s Review
Which inventory cost flow method produces the Which inventory cost flow method produces the highest net income in a period of rising prices?highest net income in a period of rising prices?
a.a. Average cost.Average cost.
b.b. LIFO.LIFO.
c.c. FIFO.FIFO.
d.d. Specific identification.Specific identification.
Chapter 5 39-57
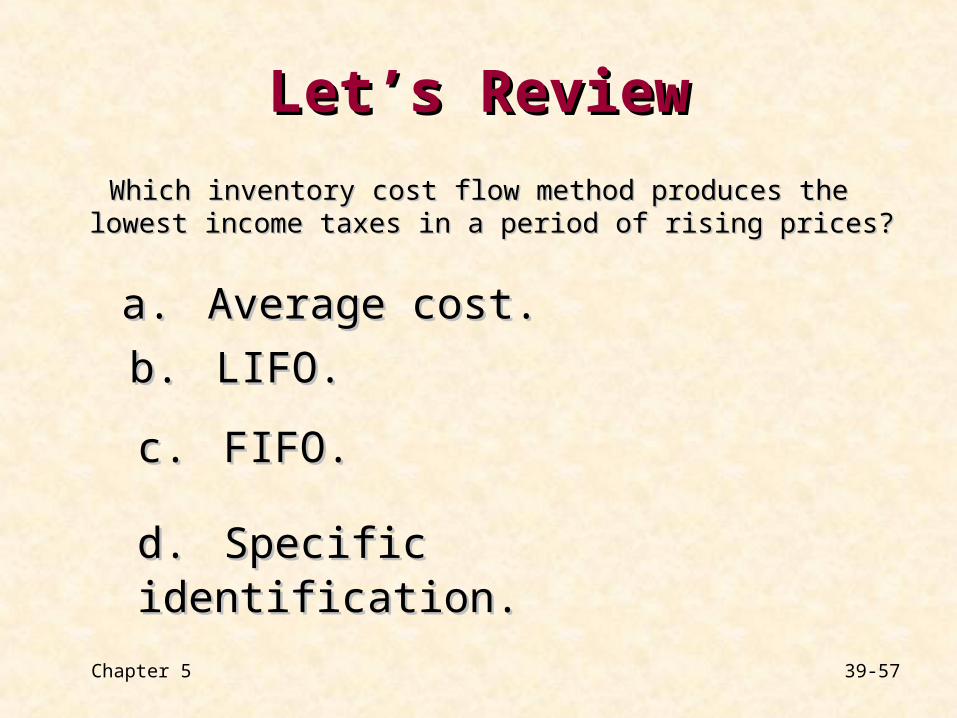
Let’s ReviewLet’s Review
Which inventory cost flow method produces the Which inventory cost flow method produces the lowestlowest income income taxes taxes in a period of rising prices? in a period of rising prices?
a.a. Average cost.Average cost.
b.b. LIFO.LIFO.
c.c. FIFO.FIFO.
d.d. Specific identification.Specific identification.
Chapter 5 40-57
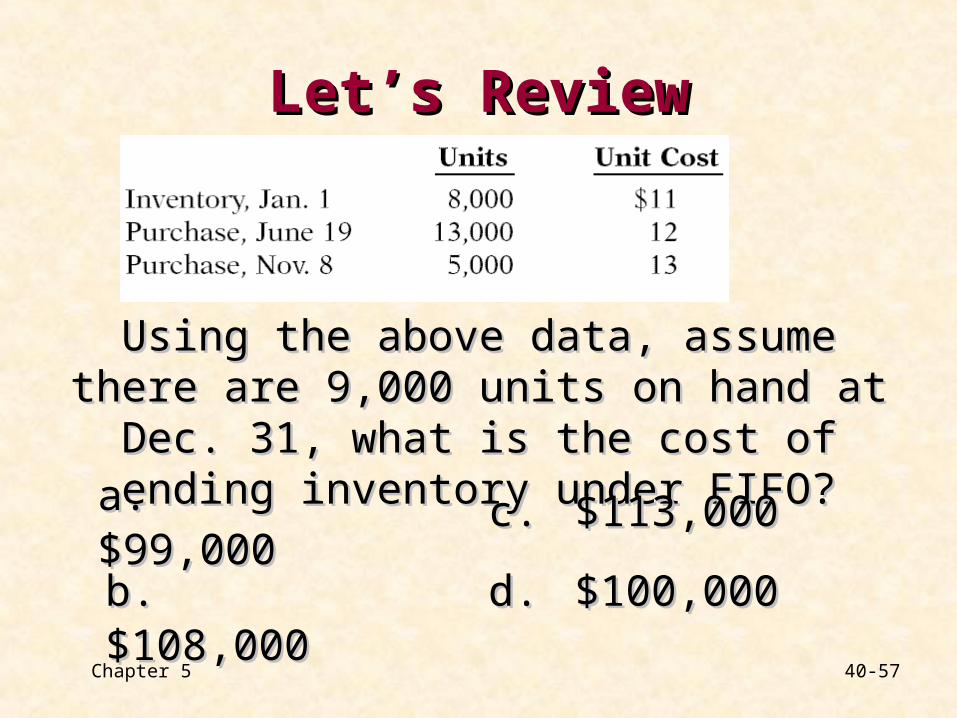
Let’s ReviewLet’s Review
Using the above data, assume there are 9,000 Using the above data, assume there are 9,000 units on hand at Dec. 31, what is the cost of units on hand at Dec. 31, what is the cost of
ending inventory under FIFO?ending inventory under FIFO?
a.a. $99,000$99,000
b.b. $108,000$108,000
c.c. $113,000$113,000
d.d. $100,000$100,000
Chapter 5 41-57
The Lower of Cost or Market The Lower of Cost or Market Basis of Accounting for Basis of Accounting for
InventoriesInventories
When the value of inventory is lower than When the value of inventory is lower than
its cost, the inventory is written down to its its cost, the inventory is written down to its
market value by valuing the inventory at market value by valuing the inventory at
the lower of cost or market (LCM) in the the lower of cost or market (LCM) in the
period in which the price decline occurs.period in which the price decline occurs.
Chapter 5 42-57
Lower of Cost or Market
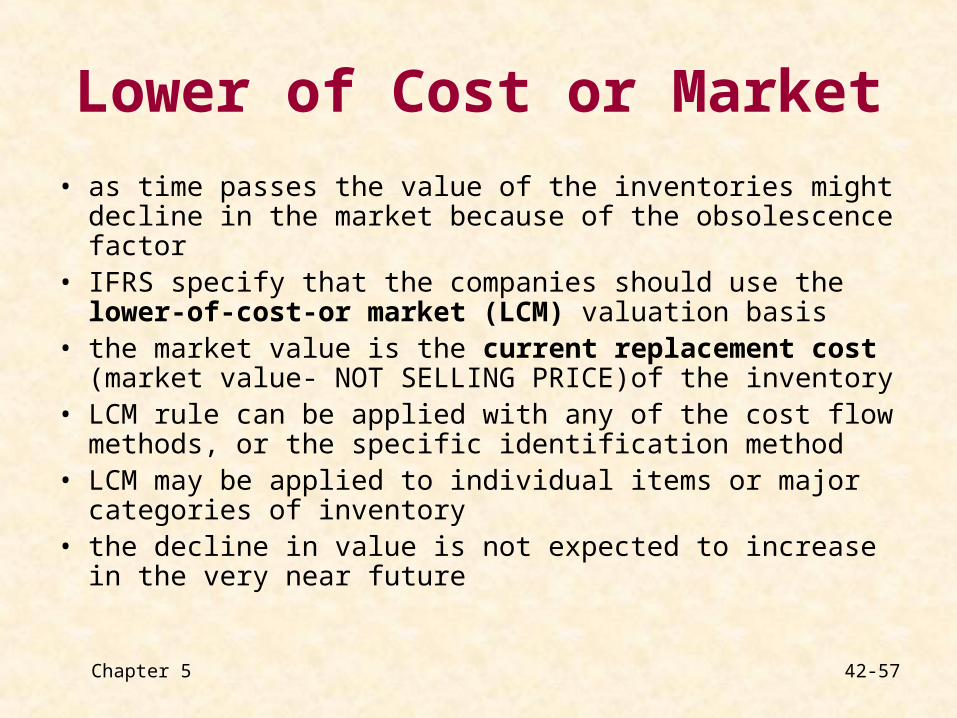
• as time passes the value of the inventories might decline in the market because of the obsolescence factor
• IFRS specify that the companies should use the lower-of-cost-or market (LCM) valuation basis
• the market value is the current replacement cost (market value- NOT SELLING PRICE)of the inventory
• LCM rule can be applied with any of the cost flow methods, or the specific identification method
• LCM may be applied to individual items or major categories of inventory
• the decline in value is not expected to increase in the very near future
Chapter 5 43-57
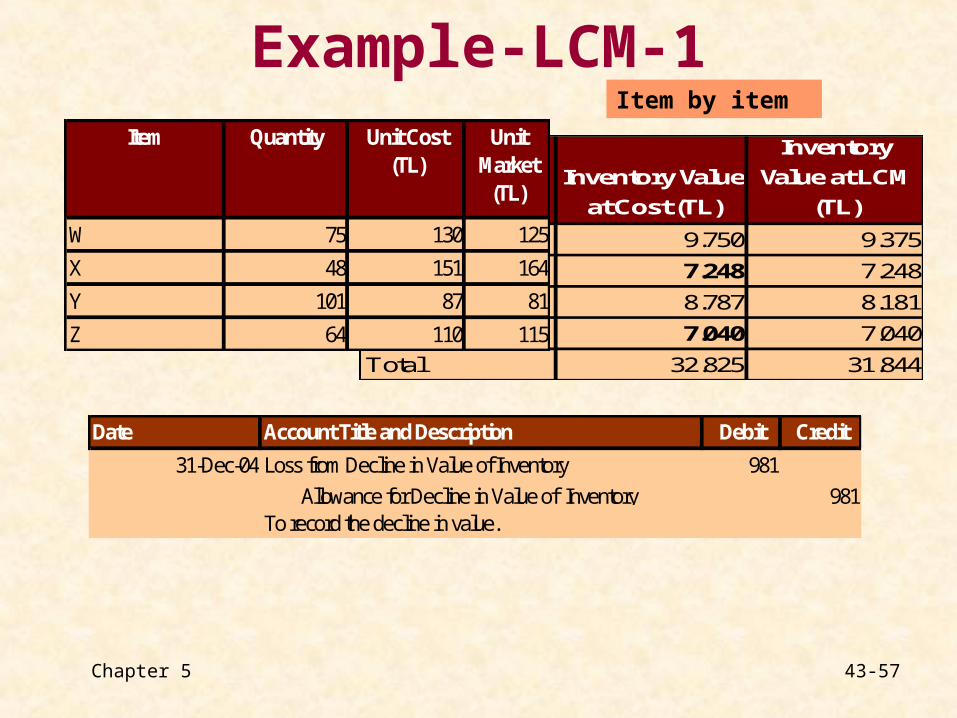
Item
Inventory Value
at Cost (TL)
Inventory
Value at LCM
(TL)
W 9.750 9.375
X 7.248 7.248
Y 8.787 8.181
Z 7.040 7.040
Total 32.825 31.844
Example-LCM-1Item Quantity Unit Cost
(TL)Unit
Market (TL)
W 75 130 125
X 48 151 164
Y 101 87 81
Z 64 110 115
Item by item
Date Account Title and Description Debit Credit
Loss from Decline in Value of Inventory Allowance for Decline in Value of Inventory 981To record the decline in value.
31-Dec-04 981

Chapter 5 44-57
Example-LCM-2
Date Account Title and Description Debit Credit15-Aug-05 Cash 1.890
Sales 1.890To recognize the sale of 15 units of item W
15-Aug-05 COGS (*) 1.875 Inventories 1.875To record COGS of the sale of 15 units of item W
(*) Use the declined value of the unit TL 125*15
on 15 August 2005, the company sold 15 units of Item W at TL 126 per unit
Chapter 5 45-57
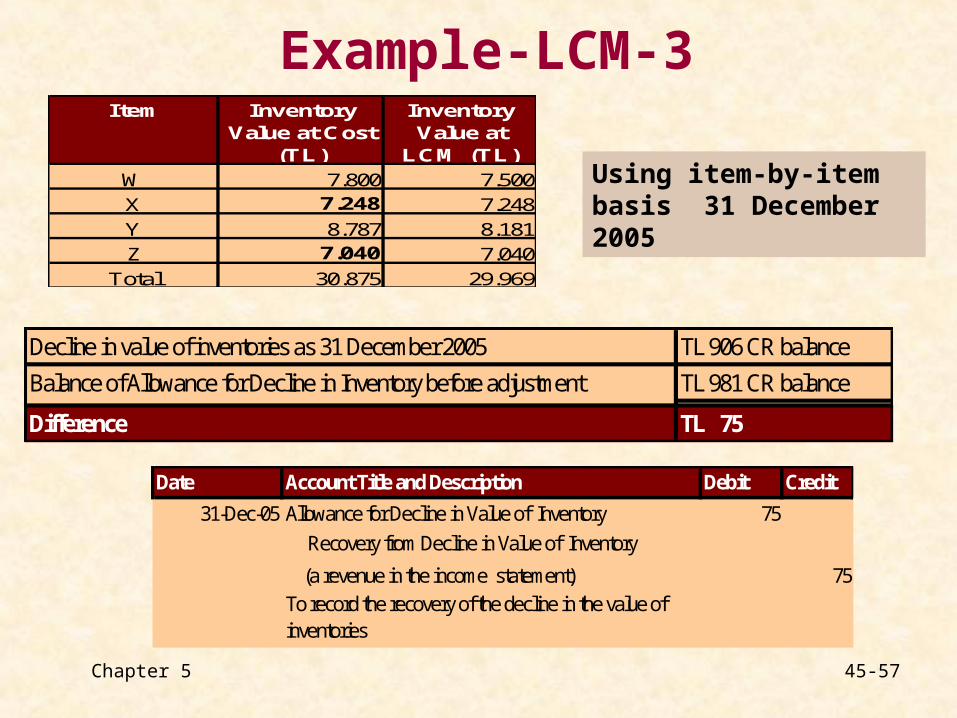
Example-LCM-3Item Inventory
Value at Cost (TL)
Inventory Value at
LCM (TL)
W 7.800 7.500
X 7.248 7.248
Y 8.787 8.181
Z 7.040 7.040
Total 30.875 29.969
Decline in value of inventories as 31 December 2005 TL 906 CR balance
TL 981 CR balance
TL 981 CR balanceDifference TL 75
Balance of Allowance for Decline in Inventory before adjustment
Date Account Title and Description Debit Credit
31-Dec-05 Allowance for Decline in Value of Inventory 75 Recovery from Decline in Value of Inventory
(a revenue in the income statement) 75To record the recovery of the decline in the value of inventories
Using item-by-item basis 31 December 2005
Chapter 5 46-57
Chapter 5 47-57
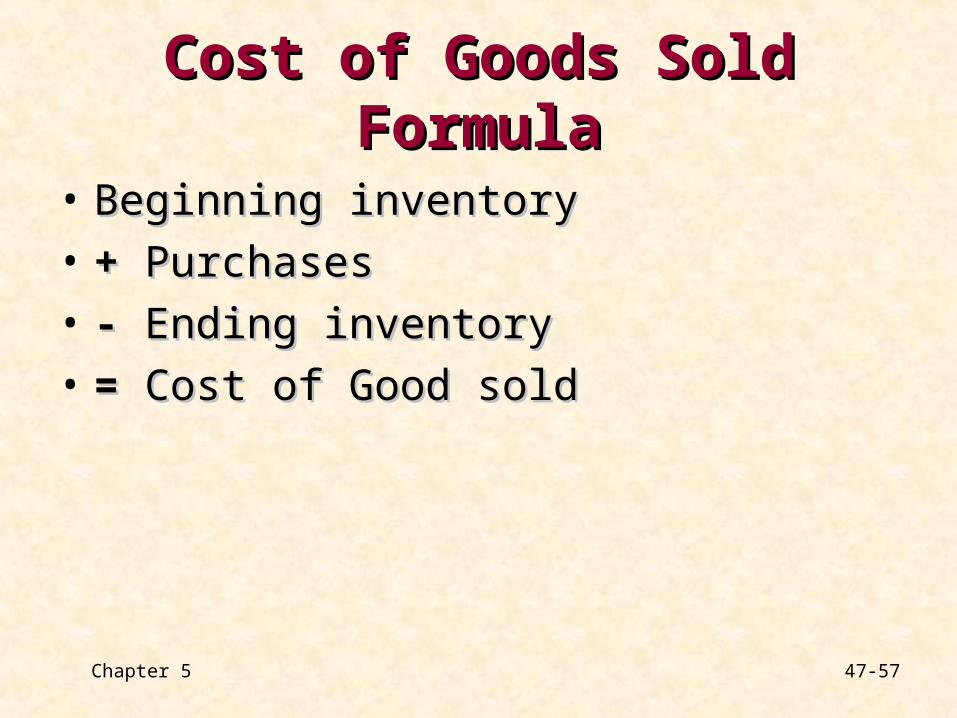
Cost of Goods Sold FormulaCost of Goods Sold Formula
• Beginning inventory Beginning inventory
• ++ Purchases Purchases
• - - Ending inventoryEnding inventory
• == Cost of Good sold Cost of Good sold
Chapter 5 48-57
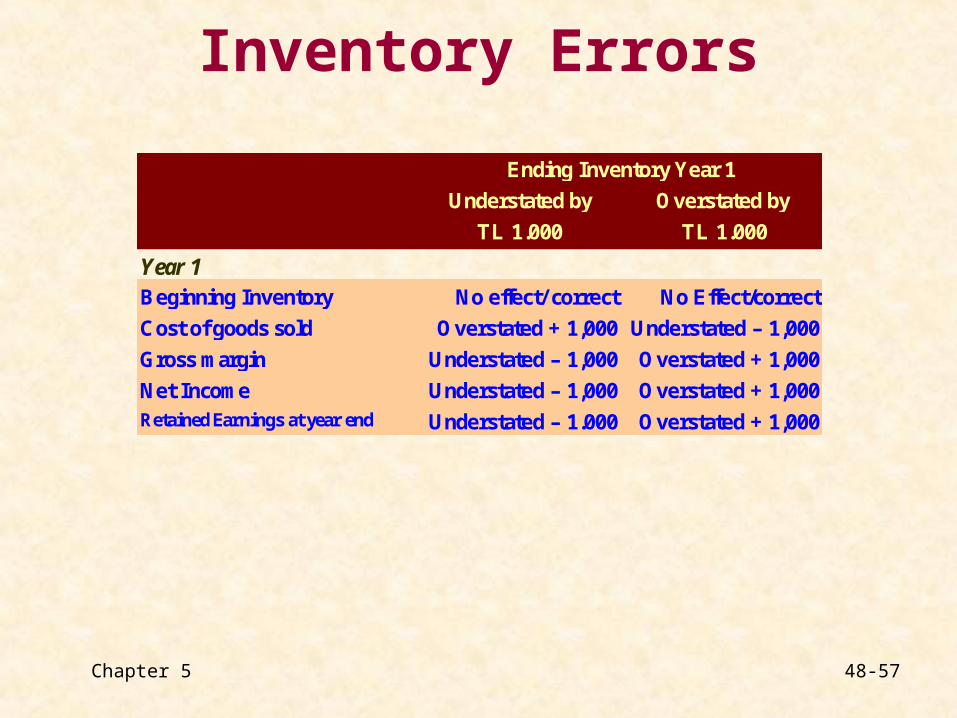
Inventory Errors
Understated by Overstated by
TL 1.000 TL 1.000
Year 1Beginning Inventory No effect/ correct No Effect/correct
Cost of goods sold Overstated + 1,000 Understated – 1,000
Gross margin Understated – 1,000 Overstated + 1,000
Net Income Understated – 1,000 Overstated + 1,000Retained Earnings at year end Understated – 1.000 Overstated + 1,000
Ending Inventory Year 1
Chapter 5 49-57
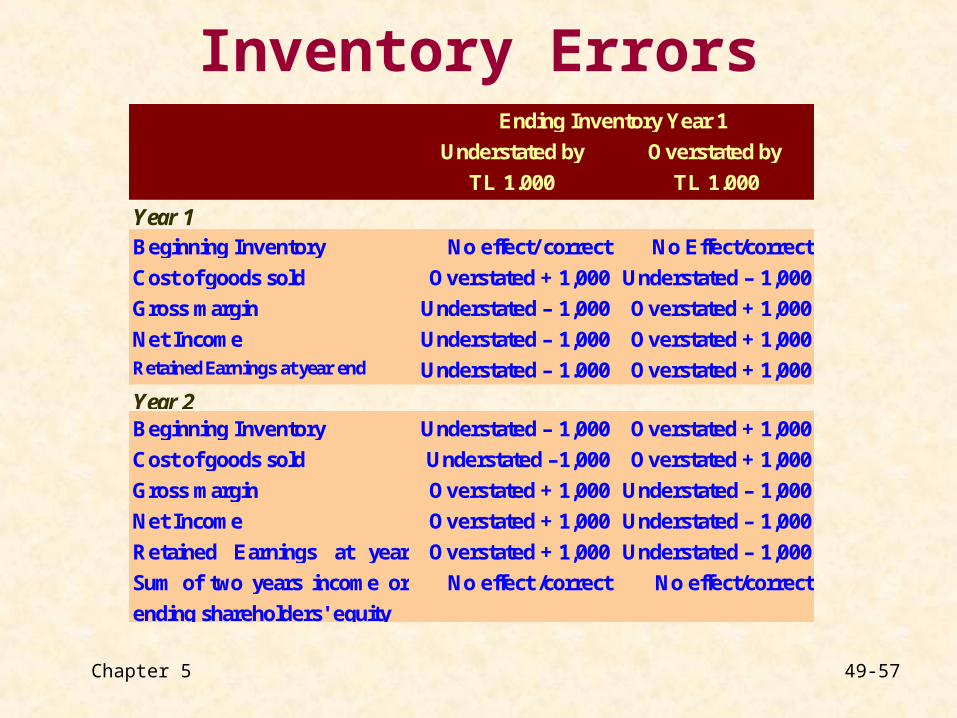
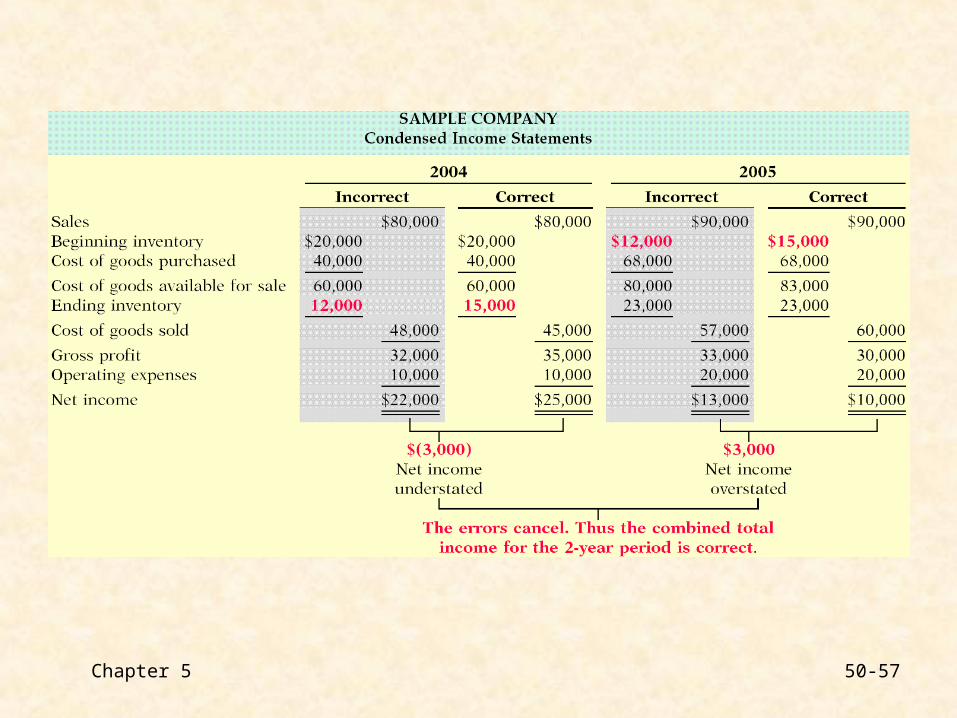
Inventory Errors
Understated by Overstated by
TL 1.000 TL 1.000
Year 1Beginning Inventory No effect/ correct No Effect/correct
Cost of goods sold Overstated + 1,000 Understated – 1,000
Gross margin Understated – 1,000 Overstated + 1,000
Net Income Understated – 1,000 Overstated + 1,000Retained Earnings at year end Understated – 1.000 Overstated + 1,000
Year 2Beginning Inventory Understated – 1,000 Overstated + 1,000
Cost of goods sold Understated –1,000 Overstated + 1,000
Gross margin Overstated + 1,000 Understated – 1,000
Net Income Overstated + 1,000 Understated – 1,000
Retained Earnings at yearend
Overstated + 1,000 Understated – 1,000
Sum of two years income orending shareholders’ equity
No effect /correct No effect/correct
ending shareholders' equity
Ending Inventory Year 1
Chapter 5 50-57
Chapter 5 51-57
Inventory Management and Ethical Issues
• inventories are closely related with net income and thus with the shareholders’ equity, and the assets
• taking decisions that would affect the ending inventory and cost of goods sold amount, the management can manipulate income
• for example, management might decide to make a large purchase at the end of the period, in order to maximize profits in that period, and then return the goods at the beginning of the following period stating that they are not according to specifications
Chapter 5 52-57
Analysis of Inventories
• To check whether adequate profits are generated by the operations
• To check whether inventory is adequate to meet future demands
Chapter 5 53-57
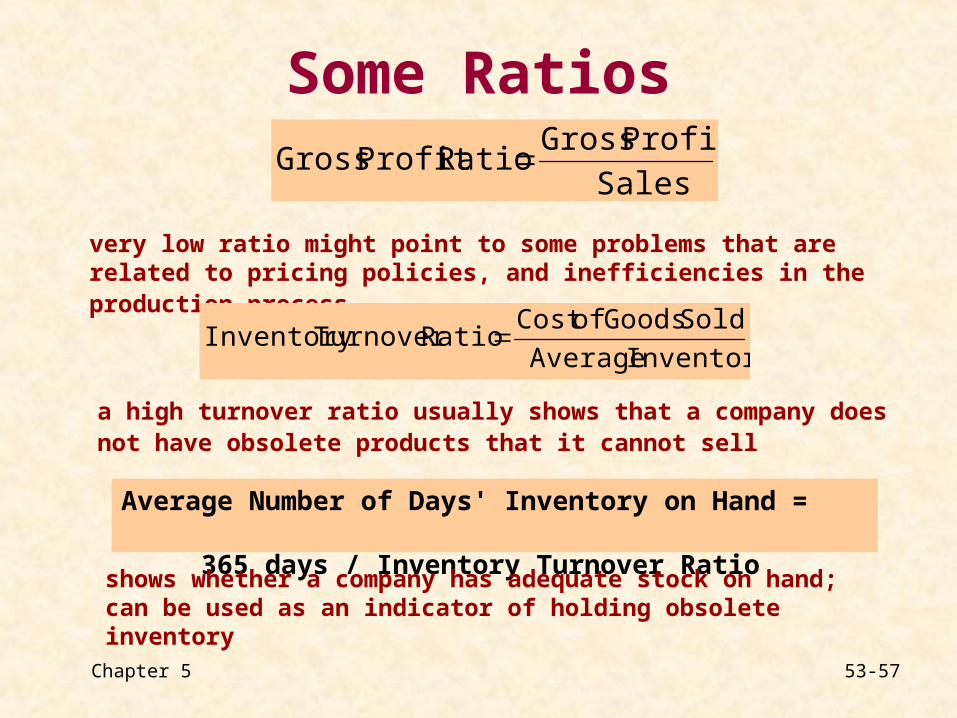
Some Ratios
Sales
Profit Gross RatioProfit Gross
very low ratio might point to some problems that are related to pricing policies, and inefficiencies in the production process
Inventory Average
Sold Goods ofCost RatioTurnover Inventory
a high turnover ratio usually shows that a company does not have obsolete products that it cannot sell
Average Number of Days' Inventory on Hand = 365 days / Inventory Turnover Ratio
shows whether a company has adequate stock on hand; can be used as an indicator of holding obsolete inventory
Chapter 5 54-57
Moving fast… Are we not?
Chapter 5 55-57
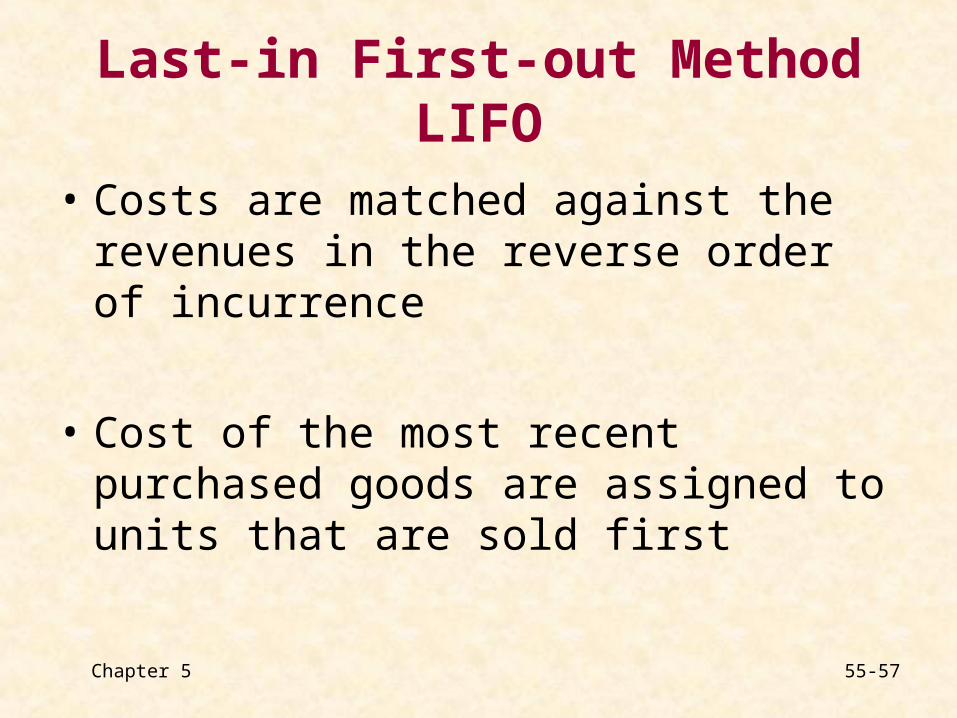
Last-in First-out MethodLIFO
• Costs are matched against the revenues in the reverse order of incurrence
• Cost of the most recent purchased goods are assigned to units that are sold first
Chapter 5 56-57
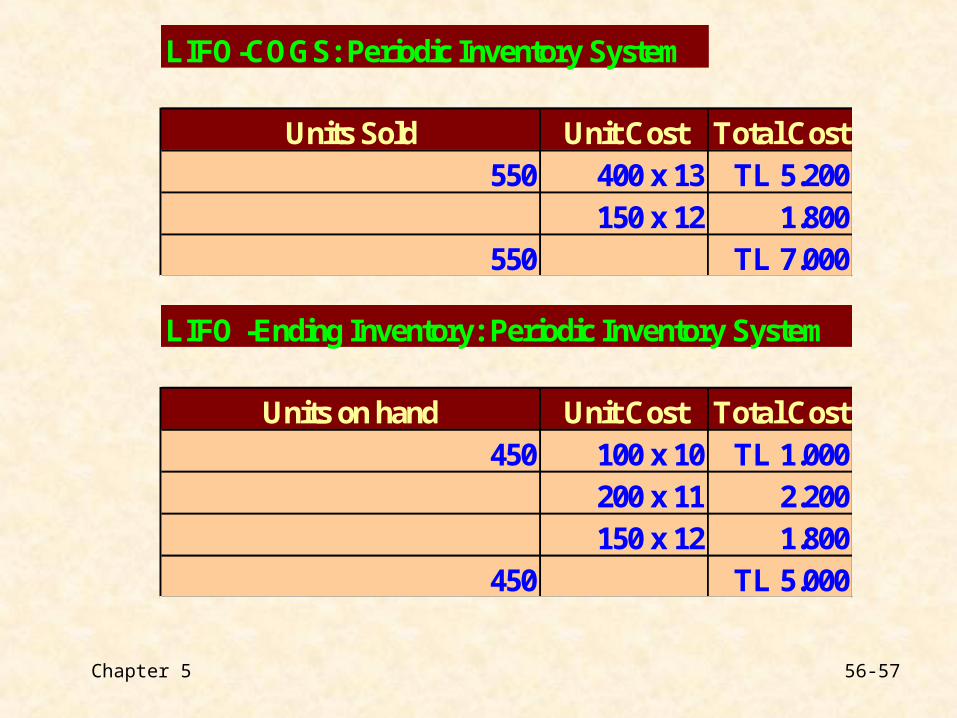
LIFO-COGS: Periodic Inventory System
Units Sold Unit Cost Total Cost550 400 x 13 TL 5.200
150 x 12 1.800550 TL 7.000
LIFO -Ending Inventory: Periodic Inventory System
Units on hand Unit Cost Total Cost450 100 x 10 TL 1.000
200 x 11 2.200150 x 12 1.800
450 TL 5.000
Chapter 5 57-57
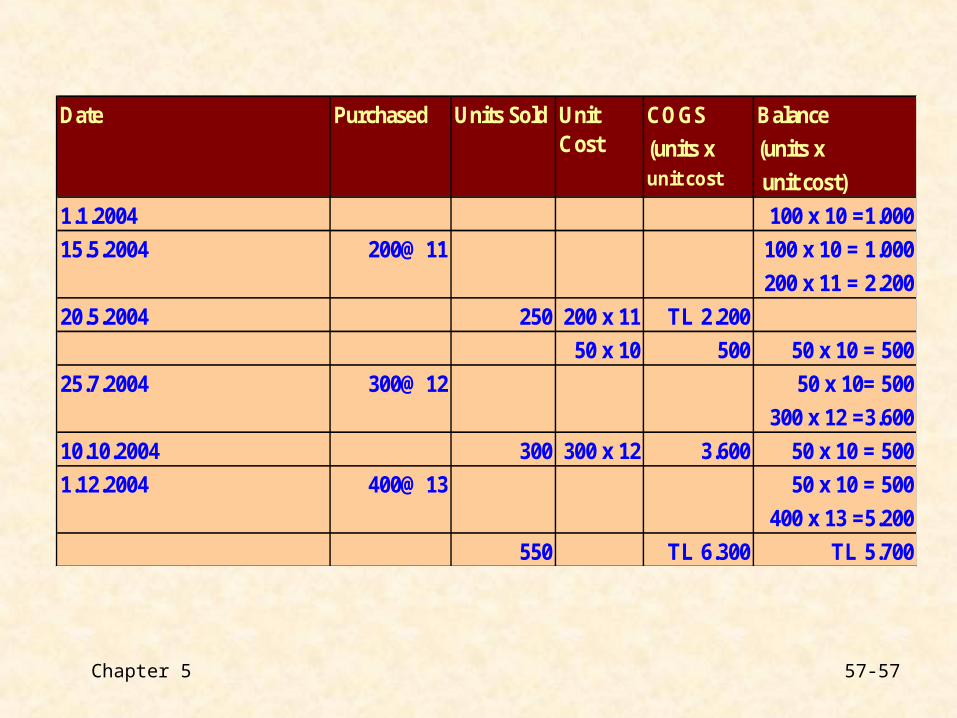
COGS Balance
(units x (units xunit cost unit cost)
1.1.2004 100 x 10 =1.000
100 x 10 = 1.000
200 x 11 = 2.200
20.5.2004 250 200 x 11 TL 2.200
50 x 10 500 50 x 10 = 500
50 x 10= 500
300 x 12 =3.600
10.10.2004 300 300 x 12 3.600 50 x 10 = 500
50 x 10 = 500
400 x 13 =5.200
550 TL 6.300 TL 5.700
Date Purchased Units Sold Unit Cost
25.7.2004 300@ 12
15.5.2004 200@ 11
1.12.2004 400@ 13