Embed Size (px)
Citation preview

Inventory Optimisation
8 March 2018©Copyright silverbacklogistics.com. All rights reserved
The place to go for free supply chain advice1
What is inventory?
8 March 2018©Copyright silverbacklogistics.com. All rights reserved
The place to go for free supply chain advice2
Inventory is the raw materials, component parts, work-in-process, or finished products that are held at a location in the
supply chain.
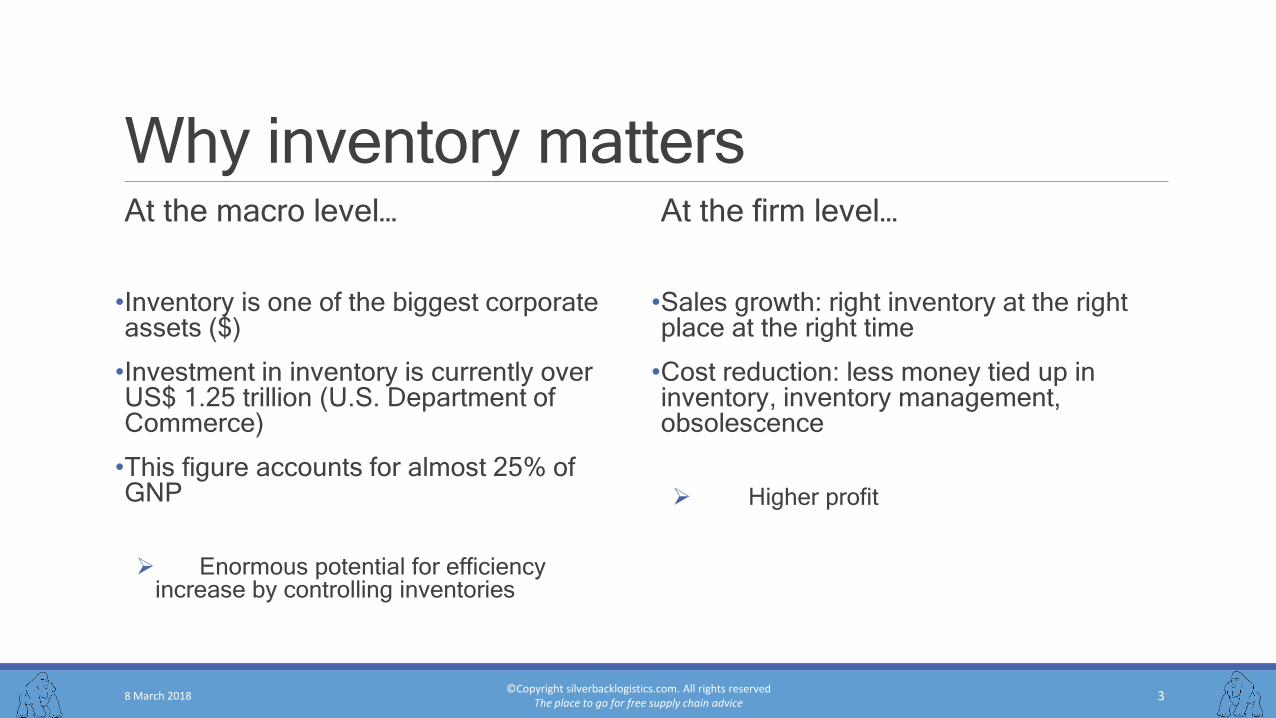
Why inventory mattersAt the macro level…
•Inventory is one of the biggest corporate assets ($)
•Investment in inventory is currently over US$ 1.25 trillion (U.S. Department of Commerce)
•This figure accounts for almost 25% of GNP
➢ Enormous potential for efficiency increase by controlling inventories
8 March 2018©Copyright silverbacklogistics.com. All rights reserved
The place to go for free supply chain advice3
At the firm level…
•Sales growth: right inventory at the right place at the right time
•Cost reduction: less money tied up in inventory, inventory management, obsolescence
➢ Higher profit

Inventory optimization in the midst of demand variation Adrian May, Transformation Manager, BP Lubricants Supply Chain Europe, 2007?
Lubricants supply chain Europe
> 170 logistics providers
> 20,000
> 40,000 delivery points
10 different ERPs used across Europe
96% IFOT across Europe (In full on time = IFOT)
Supply chain is reactive and has a high cost to serve
Stock levels are rising
Key challenges:◦ Supply chain moving from static reorder levels to
dynamic◦ Standardisation of data to enable regional
consolidation◦ Local country engagement
8 March 2018©Copyright silverbacklogistics.com. All rights reserved
The place to go for free supply chain advice4

8 March 2018©Copyright silverbacklogistics.com. All rights reserved
The place to go for free supply chain advice5
ToolsGroup Mastering the ‘long tail’ of demand Cornacchia & Shamir, 2008
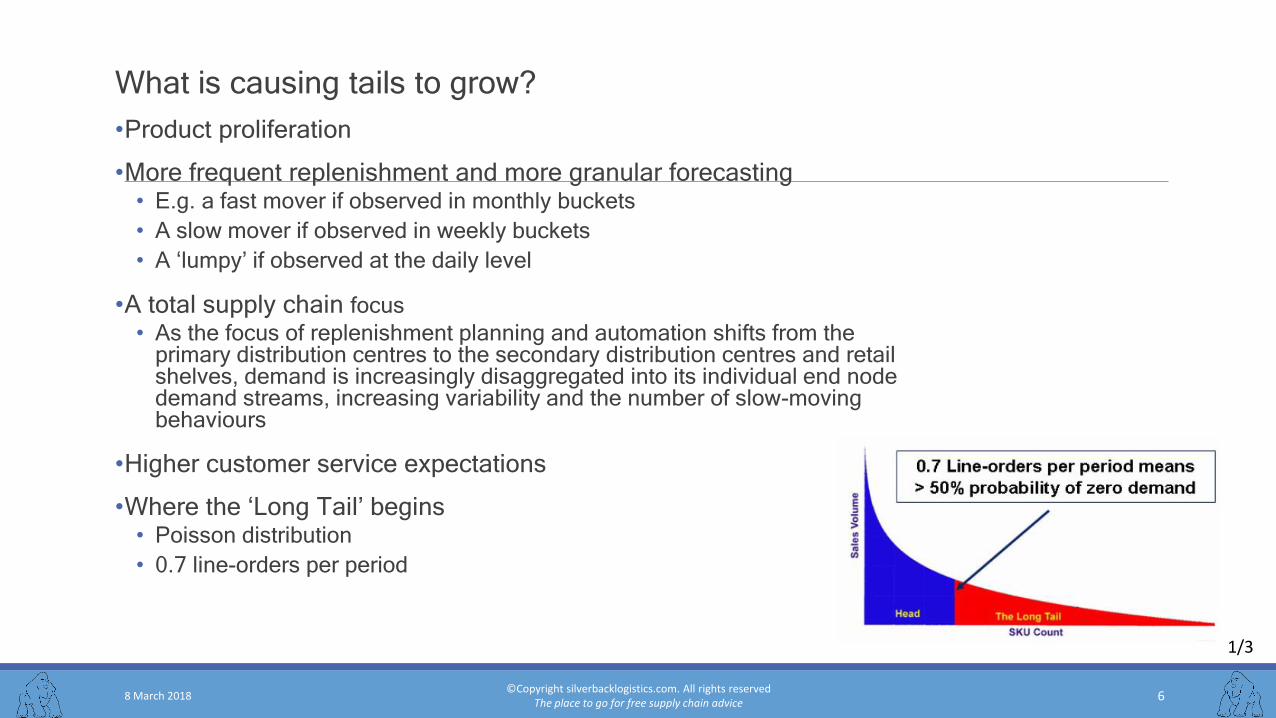
What is causing tails to grow?
•Product proliferation
•More frequent replenishment and more granular forecasting• E.g. a fast mover if observed in monthly buckets
• A slow mover if observed in weekly buckets
• A ‘lumpy’ if observed at the daily level
•A total supply chain focus
• As the focus of replenishment planning and automation shifts from the primary distribution centres to the secondary distribution centres and retail shelves, demand is increasingly disaggregated into its individual end node demand streams, increasing variability and the number of slow-moving behaviours
•Higher customer service expectations
•Where the ‘Long Tail’ begins• Poisson distribution
• 0.7 line-orders per period
8 March 2018©Copyright silverbacklogistics.com. All rights reserved
The place to go for free supply chain advice6
1/3
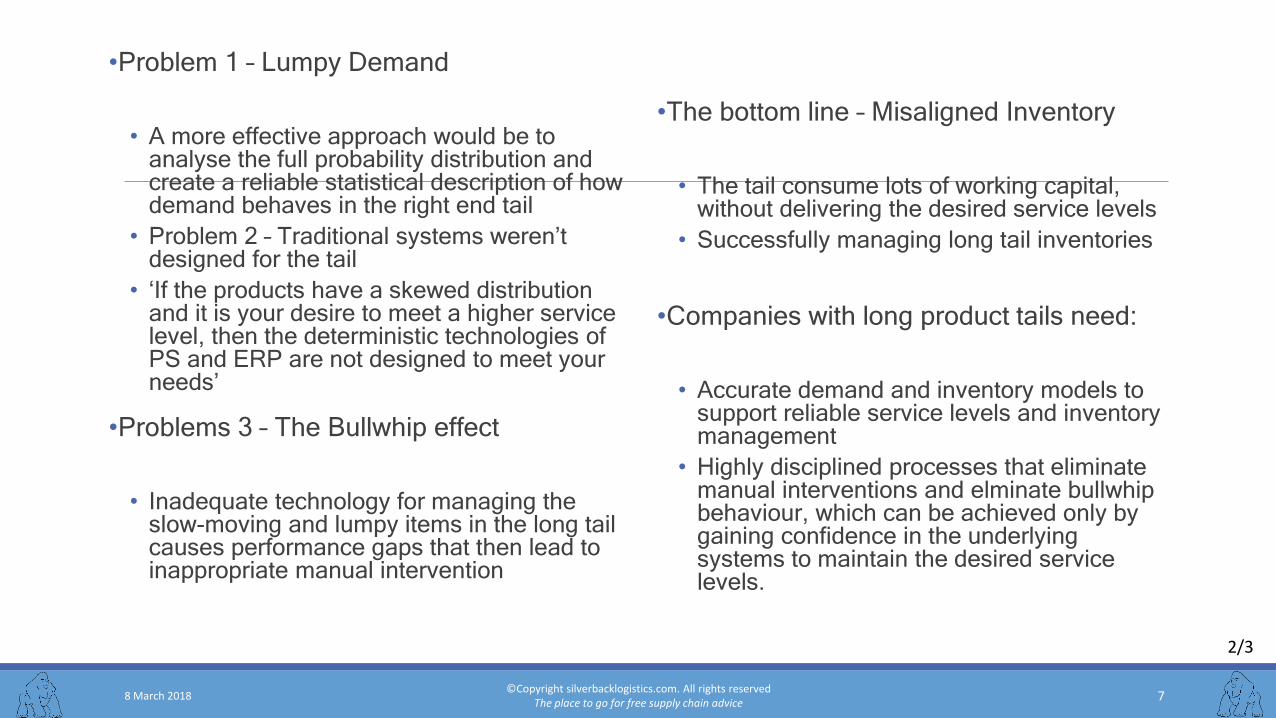
•Problem 1 – Lumpy Demand
• A more effective approach would be to analyse the full probability distribution and create a reliable statistical description of how demand behaves in the right end tail
• Problem 2 – Traditional systems weren’t designed for the tail
• ‘If the products have a skewed distribution and it is your desire to meet a higher service level, then the deterministic technologies of PS and ERP are not designed to meet your needs’
•Problems 3 – The Bullwhip effect
• Inadequate technology for managing the slow-moving and lumpy items in the long tail causes performance gaps that then lead to inappropriate manual intervention
•The bottom line – Misaligned Inventory
• The tail consume lots of working capital, without delivering the desired service levels
• Successfully managing long tail inventories
•Companies with long product tails need:
• Accurate demand and inventory models to support reliable service levels and inventory management
• Highly disciplined processes that eliminate manual interventions and elminate bullwhip behaviour, which can be achieved only by gaining confidence in the underlying systems to maintain the desired service levels.
8 March 2018©Copyright silverbacklogistics.com. All rights reserved
The place to go for free supply chain advice7
2/3
8 March 2018©Copyright silverbacklogistics.com. All rights reserved
The place to go for free supply chain advice8
Normal distributions don’t work in the long tail
Items in the long tail cannot be treated with a normal
demand distribution
Succeeding in the long tail environment
Optimising trade-offs between inventory and service in
the long tail world requires the following capabilities:
A very reliable demand modelling technology that auto-
adjusts all relevant statistical parameters across a wide
range of sku behaviours
An advanced inventory modelling technology which
eliminates the gross errors of traditional techniques.
Demand signals from logic which combine both demand
modelling and inventory management
A solution which is so good in PvA terms that need for
emergency interventions is reduced
Summary:
‘By taking no shortcuts and mastering the full
probability distributions of both demand and
inventory across a wide range of possible
behaviours, you can reach unprecedented
efficiency and service level excellence in an
increasingly challenging ‘long tail’ world’.
3/3
8 March 2018©Copyright silverbacklogistics.com. All rights reserved
The place to go for free supply chain advice9
ToolsGroup Matching inventories to changing demand patterns: A quick three step approach
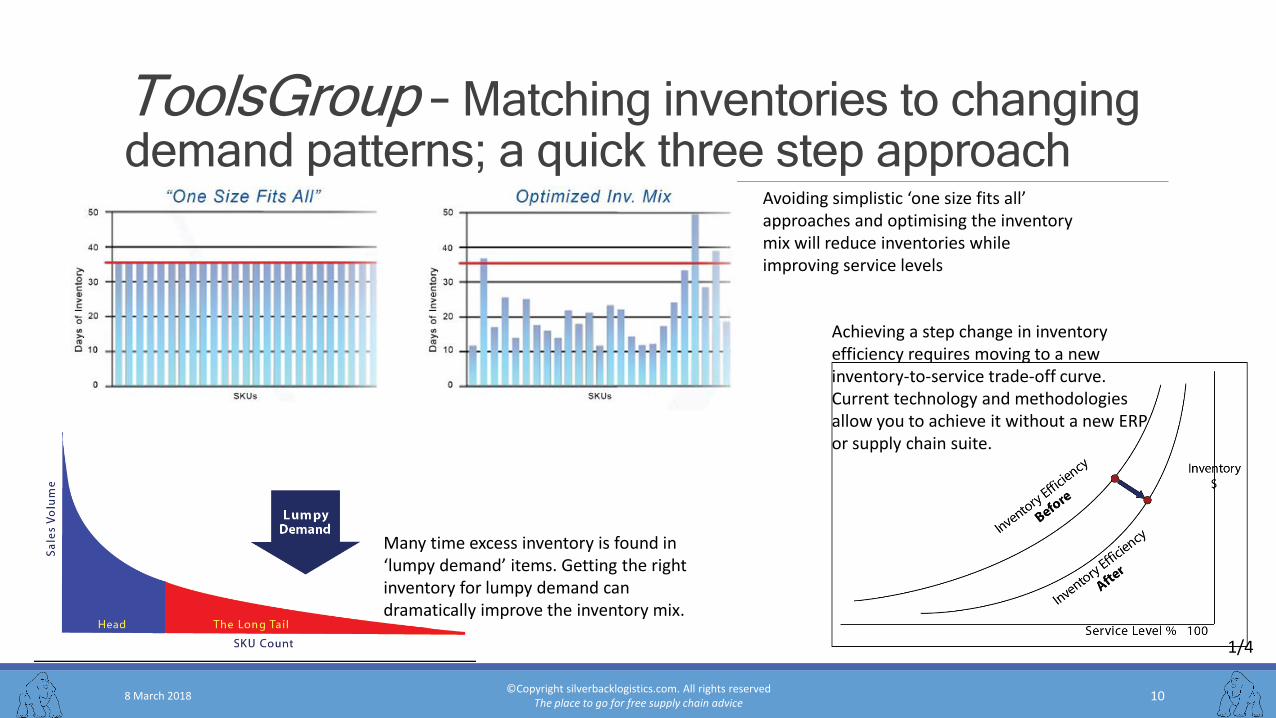
ToolsGroup – Matching inventories to changing demand patterns; a quick three step approach
8 March 2018©Copyright silverbacklogistics.com. All rights reserved
The place to go for free supply chain advice10
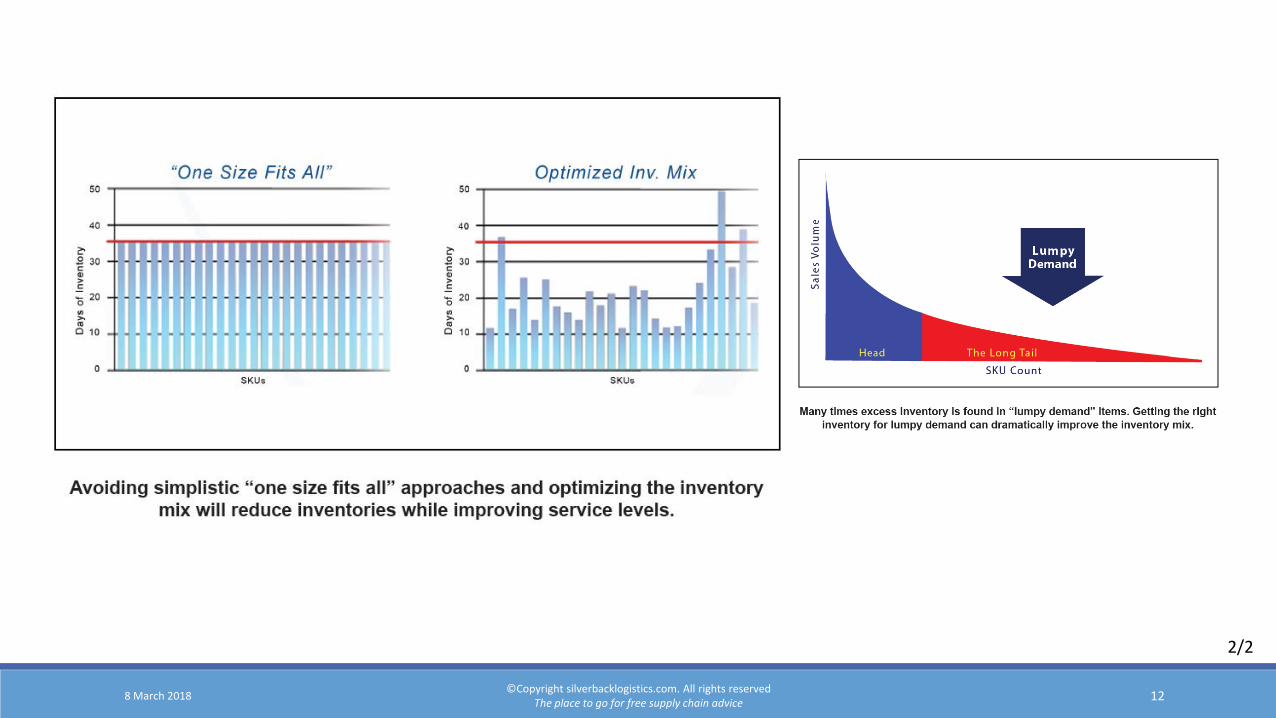
Avoiding simplistic ‘one size fits all’ approaches and optimising the inventory mix will reduce inventories while improving service levels
Achieving a step change in inventory efficiency requires moving to a new inventory-to-service trade-off curve. Current technology and methodologies allow you to achieve it without a new ERP or supply chain suite.
Many time excess inventory is found in ‘lumpy demand’ items. Getting the right inventory for lumpy demand can dramatically improve the inventory mix.
1/4
8 March 2018©Copyright silverbacklogistics.com. All rights reserved
The place to go for free supply chain advice11
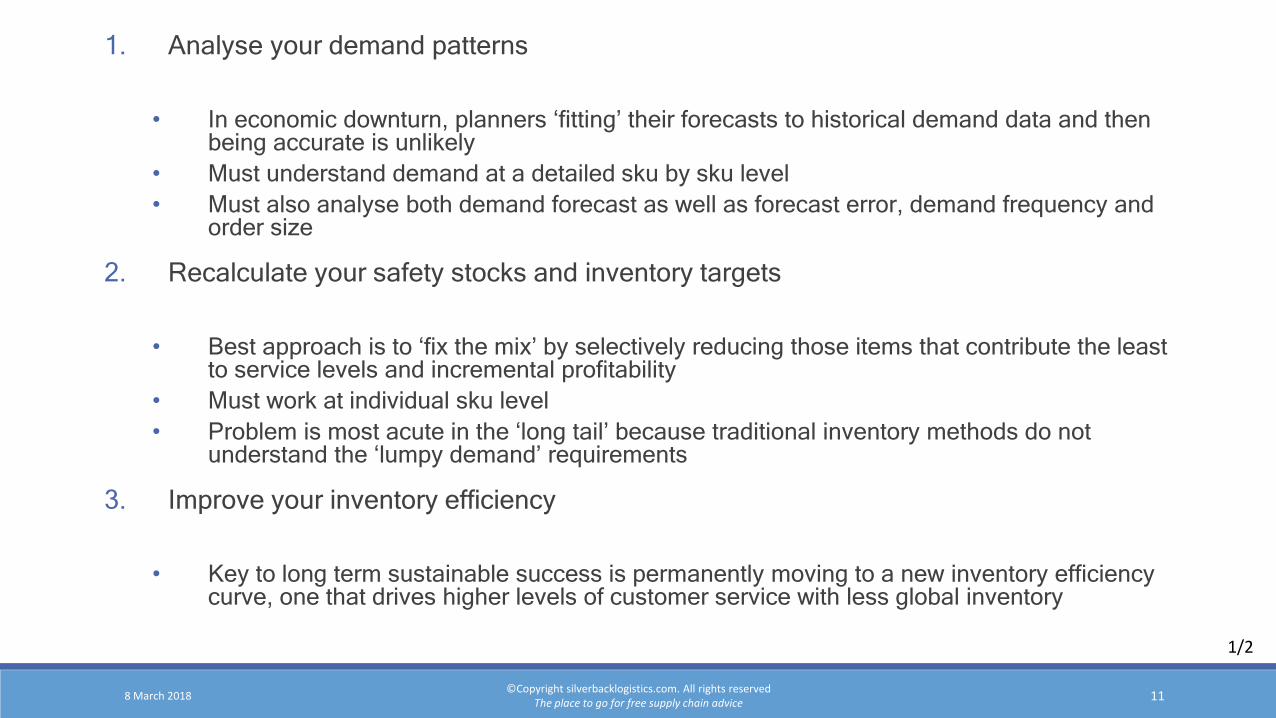
1. Analyse your demand patterns
• In economic downturn, planners ‘fitting’ their forecasts to historical demand data and then being accurate is unlikely
• Must understand demand at a detailed sku by sku level
• Must also analyse both demand forecast as well as forecast error, demand frequency and order size
2. Recalculate your safety stocks and inventory targets
• Best approach is to ‘fix the mix’ by selectively reducing those items that contribute the least to service levels and incremental profitability
• Must work at individual sku level
• Problem is most acute in the ‘long tail’ because traditional inventory methods do not understand the ‘lumpy demand’ requirements
3. Improve your inventory efficiency
• Key to long term sustainable success is permanently moving to a new inventory efficiency curve, one that drives higher levels of customer service with less global inventory
1/2
8 March 2018©Copyright silverbacklogistics.com. All rights reserved
The place to go for free supply chain advice12
2/2
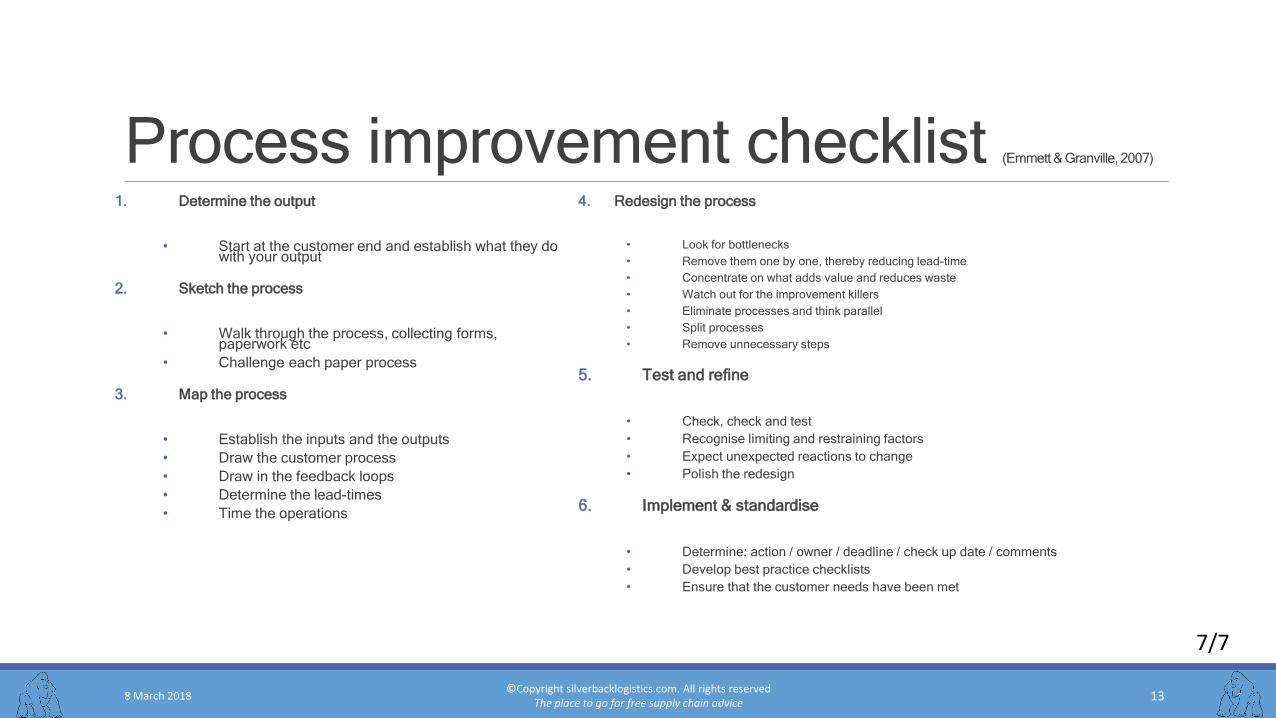
Process improvement checklist (Emmett & Granville, 2007)
1. Determine the output
• Start at the customer end and establish what they do with your output
2. Sketch the process
• Walk through the process, collecting forms, paperwork etc
• Challenge each paper process
3. Map the process
• Establish the inputs and the outputs
• Draw the customer process
• Draw in the feedback loops
• Determine the lead-times
• Time the operations
4. Redesign the process
• Look for bottlenecks
• Remove them one by one, thereby reducing lead-time
• Concentrate on what adds value and reduces waste
• Watch out for the improvement killers
• Eliminate processes and think parallel
• Split processes
• Remove unnecessary steps
5. Test and refine
• Check, check and test
• Recognise limiting and restraining factors
• Expect unexpected reactions to change
• Polish the redesign
6. Implement & standardise
• Determine: action / owner / deadline / check up date / comments
• Develop best practice checklists
• Ensure that the customer needs have been met
8 March 2018©Copyright silverbacklogistics.com. All rights reserved
The place to go for free supply chain advice13
7/7
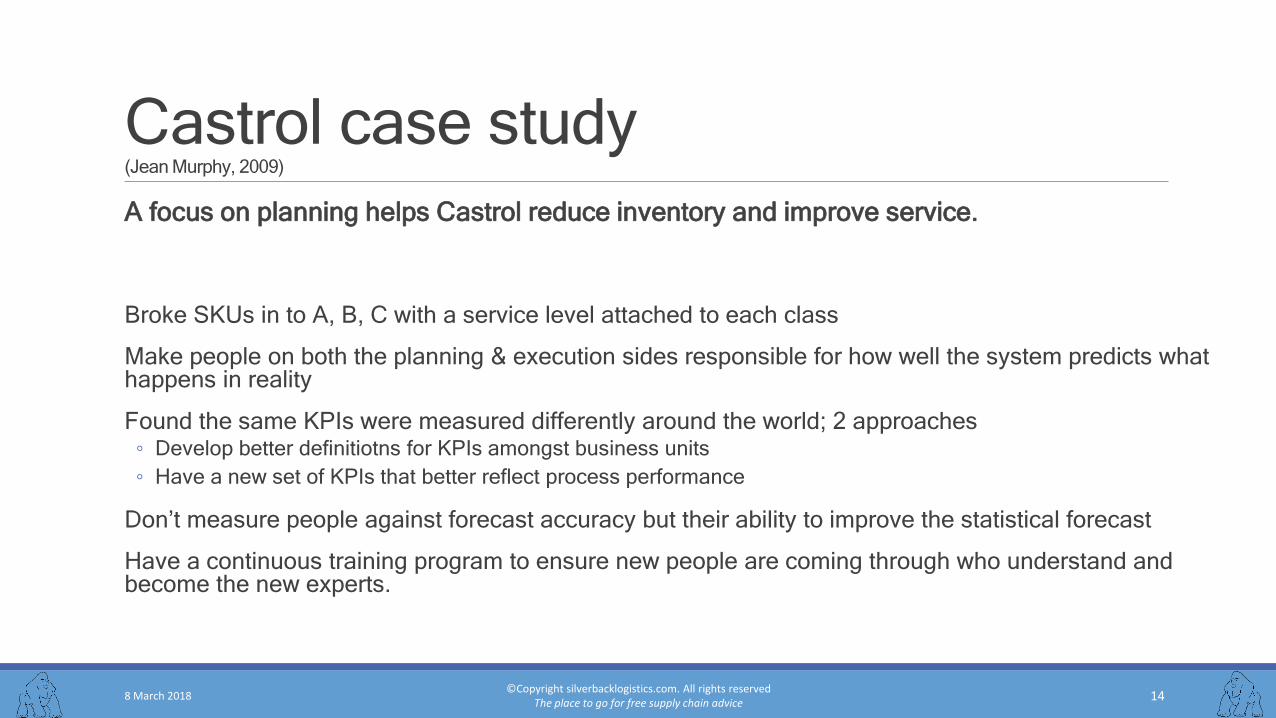
Castrol case study(Jean Murphy, 2009)
A focus on planning helps Castrol reduce inventory and improve service.
8 March 2018©Copyright silverbacklogistics.com. All rights reserved
The place to go for free supply chain advice14
Broke SKUs in to A, B, C with a service level attached to each class
Make people on both the planning & execution sides responsible for how well the system predicts what happens in reality
Found the same KPIs were measured differently around the world; 2 approaches◦ Develop better definitiotns for KPIs amongst business units
◦ Have a new set of KPIs that better reflect process performance
Don’t measure people against forecast accuracy but their ability to improve the statistical forecast
Have a continuous training program to ensure new people are coming through who understand and become the new experts.
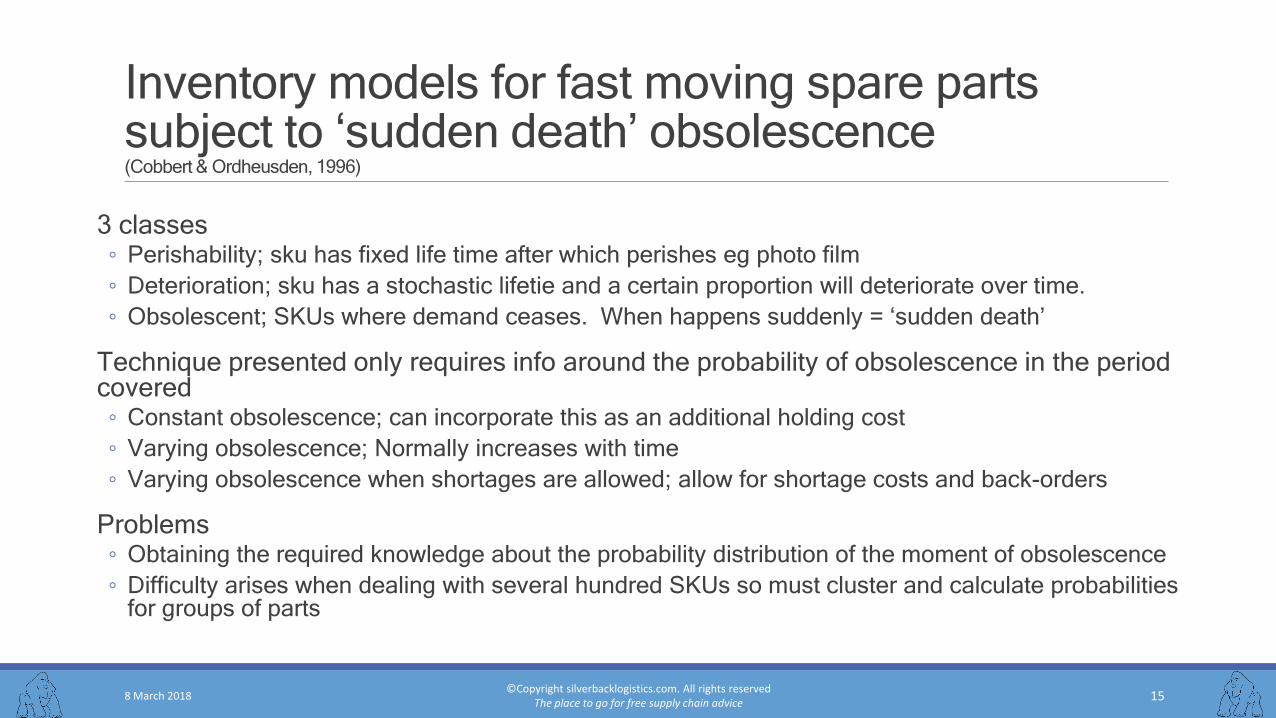
Inventory models for fast moving spare parts subject to ‘sudden death’ obsolescence(Cobbert & Ordheusden, 1996)
8 March 2018©Copyright silverbacklogistics.com. All rights reserved
The place to go for free supply chain advice15
3 classes ◦ Perishability; sku has fixed life time after which perishes eg photo film
◦ Deterioration; sku has a stochastic lifetie and a certain proportion will deteriorate over time.
◦ Obsolescent; SKUs where demand ceases. When happens suddenly = ‘sudden death’
Technique presented only requires info around the probability of obsolescence in the period covered
◦ Constant obsolescence; can incorporate this as an additional holding cost
◦ Varying obsolescence; Normally increases with time
◦ Varying obsolescence when shortages are allowed; allow for shortage costs and back-orders
Problems◦ Obtaining the required knowledge about the probability distribution of the moment of obsolescence
◦ Difficulty arises when dealing with several hundred SKUs so must cluster and calculate probabilities for groups of parts
8 March 2018©Copyright silverbacklogistics.com. All rights reserved
The place to go for free supply chain advice16
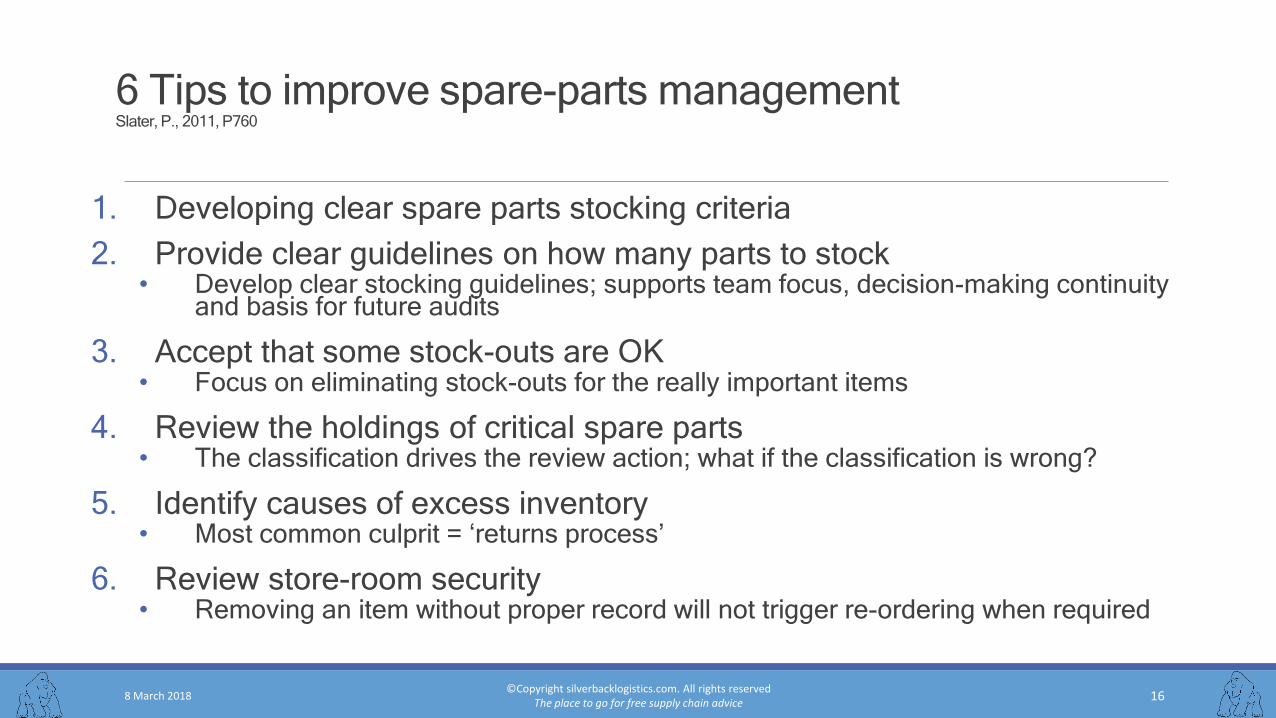
6 Tips to improve spare-parts managementSlater, P., 2011, P760
1. Developing clear spare parts stocking criteria
2. Provide clear guidelines on how many parts to stock• Develop clear stocking guidelines; supports team focus, decision-making continuity
and basis for future audits
3. Accept that some stock-outs are OK• Focus on eliminating stock-outs for the really important items
4. Review the holdings of critical spare parts• The classification drives the review action; what if the classification is wrong?
5. Identify causes of excess inventory• Most common culprit = ‘returns process’
6. Review store-room security• Removing an item without proper record will not trigger re-ordering when required
8 March 2018©Copyright silverbacklogistics.com. All rights reserved
The place to go for free supply chain advice17
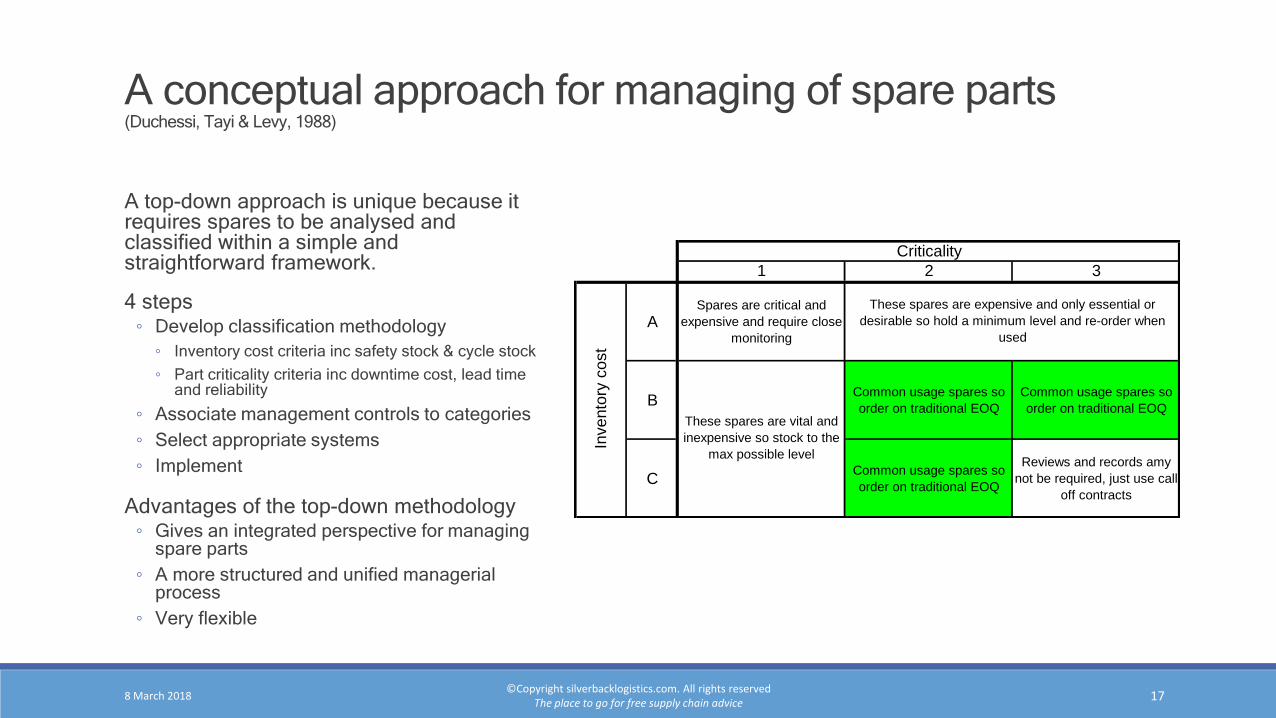
A conceptual approach for managing of spare parts(Duchessi, Tayi & Levy, 1988)
A top-down approach is unique because it requires spares to be analysed and classified within a simple and straightforward framework.
4 steps◦ Develop classification methodology
◦ Inventory cost criteria inc safety stock & cycle stock
◦ Part criticality criteria inc downtime cost, lead time and reliability
◦ Associate management controls to categories
◦ Select appropriate systems
◦ Implement
Advantages of the top-down methodology◦ Gives an integrated perspective for managing
spare parts
◦ A more structured and unified managerial process
◦ Very flexible
1 2 3
ASpares are critical and
expensive and require close
monitoring
BCommon usage spares so
order on traditional EOQ
Common usage spares so
order on traditional EOQ
CCommon usage spares so
order on traditional EOQ
Reviews and records amy
not be required, just use call-
off contracts
Criticality
Invento
ry c
ost
These spares are expensive and only essential or
desirable so hold a minimum level and re-order when
used
These spares are vital and
inexpensive so stock to the
max possible level
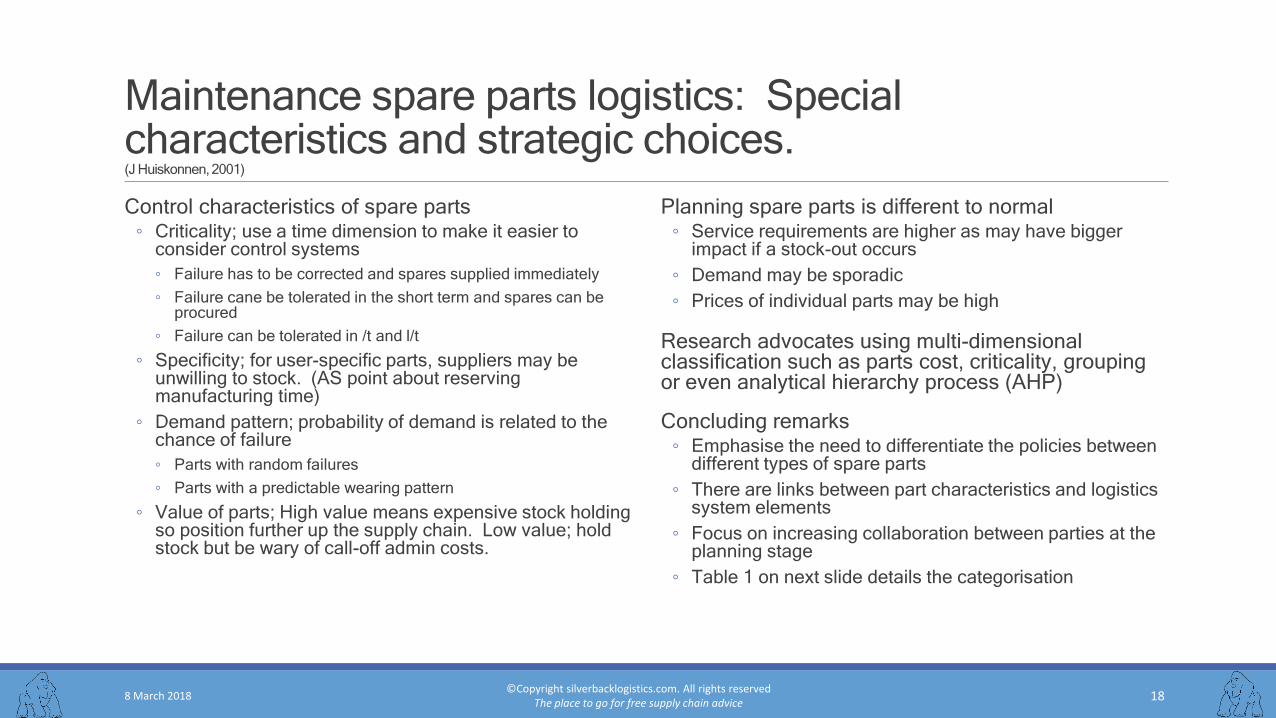
Maintenance spare parts logistics: Special characteristics and strategic choices.(J Huiskonnen, 2001)
Control characteristics of spare parts◦ Criticality; use a time dimension to make it easier to
consider control systems
◦ Failure has to be corrected and spares supplied immediately
◦ Failure cane be tolerated in the short term and spares can be procured
◦ Failure can be tolerated in /t and l/t
◦ Specificity; for user-specific parts, suppliers may be unwilling to stock. (AS point about reserving manufacturing time)
◦ Demand pattern; probability of demand is related to the chance of failure
◦ Parts with random failures
◦ Parts with a predictable wearing pattern
◦ Value of parts; High value means expensive stock holding so position further up the supply chain. Low value; hold stock but be wary of call-off admin costs.
Planning spare parts is different to normal◦ Service requirements are higher as may have bigger
impact if a stock-out occurs
◦ Demand may be sporadic
◦ Prices of individual parts may be high
Research advocates using multi-dimensional classification such as parts cost, criticality, grouping or even analytical hierarchy process (AHP)
Concluding remarks◦ Emphasise the need to differentiate the policies between
different types of spare parts
◦ There are links between part characteristics and logistics system elements
◦ Focus on increasing collaboration between parties at the planning stage
◦ Table 1 on next slide details the categorisation
8 March 2018©Copyright silverbacklogistics.com. All rights reserved
The place to go for free supply chain advice18
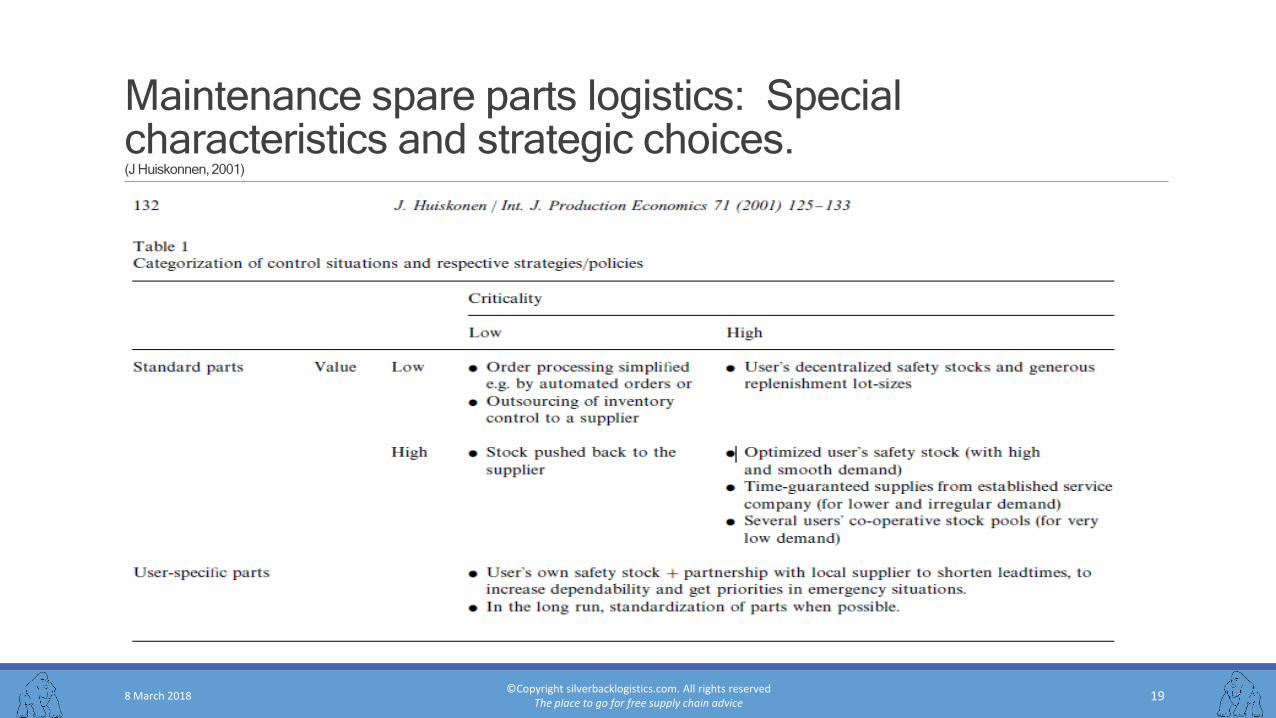
Maintenance spare parts logistics: Special characteristics and strategic choices.(J Huiskonnen, 2001)
8 March 2018©Copyright silverbacklogistics.com. All rights reserved
The place to go for free supply chain advice19
8 March 2018©Copyright silverbacklogistics.com. All rights reserved
The place to go for free supply chain advice20
Multi-item classification and generic inventory stock control policies(Cohen & Ernst, 1988)
ABC approach does not account for other significant variables relating to production, distribution & sourcing
Use Org to define group-based operational control policies
Applying ORG to SKU grouping, unconstrained by operational performance requirements provides a significant improvement over the ABC method
May not be easy to introduce ORG method because tends to group items in a different way to normal
The ORG method◦ Collect a data set and include physical and technical descriptions, attributes of its market, production and distribution-
related parameters, and financial data
◦ The calculate the minimum number of groups which satisfy both operational performance and statistical constraints
Conclusions◦ This approach can handle any combination of SKU attribute
◦ This approach can consider statistical discrimination criteria
◦ ORG much better than ABC because ABC can only operate on three criteria but ORG can utilise a complete range of SKU descriptions
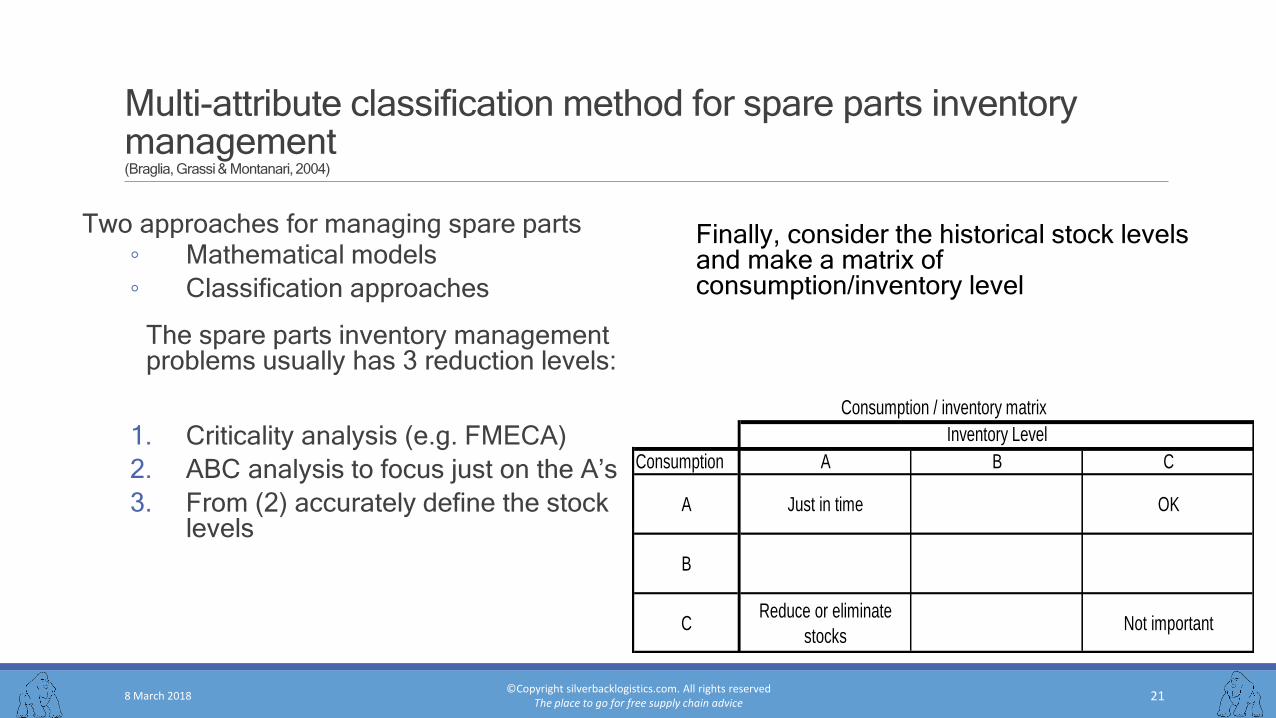
Multi-attribute classification method for spare parts inventory management(Braglia, Grassi & Montanari, 2004)
8 March 2018©Copyright silverbacklogistics.com. All rights reserved
The place to go for free supply chain advice21
Two approaches for managing spare parts◦ Mathematical models
◦ Classification approaches
The spare parts inventory management problems usually has 3 reduction levels:
1. Criticality analysis (e.g. FMECA)
2. ABC analysis to focus just on the A’s
3. From (2) accurately define the stock levels
Consumption A B C
A Just in time OK
B
C Reduce or eliminate
stocksNot important
Inventory Level
Consumption / inventory matrix
Finally, consider the historical stock levels and make a matrix of consumption/inventory level
8 March 2018©Copyright silverbacklogistics.com. All rights reserved
The place to go for free supply chain advice22
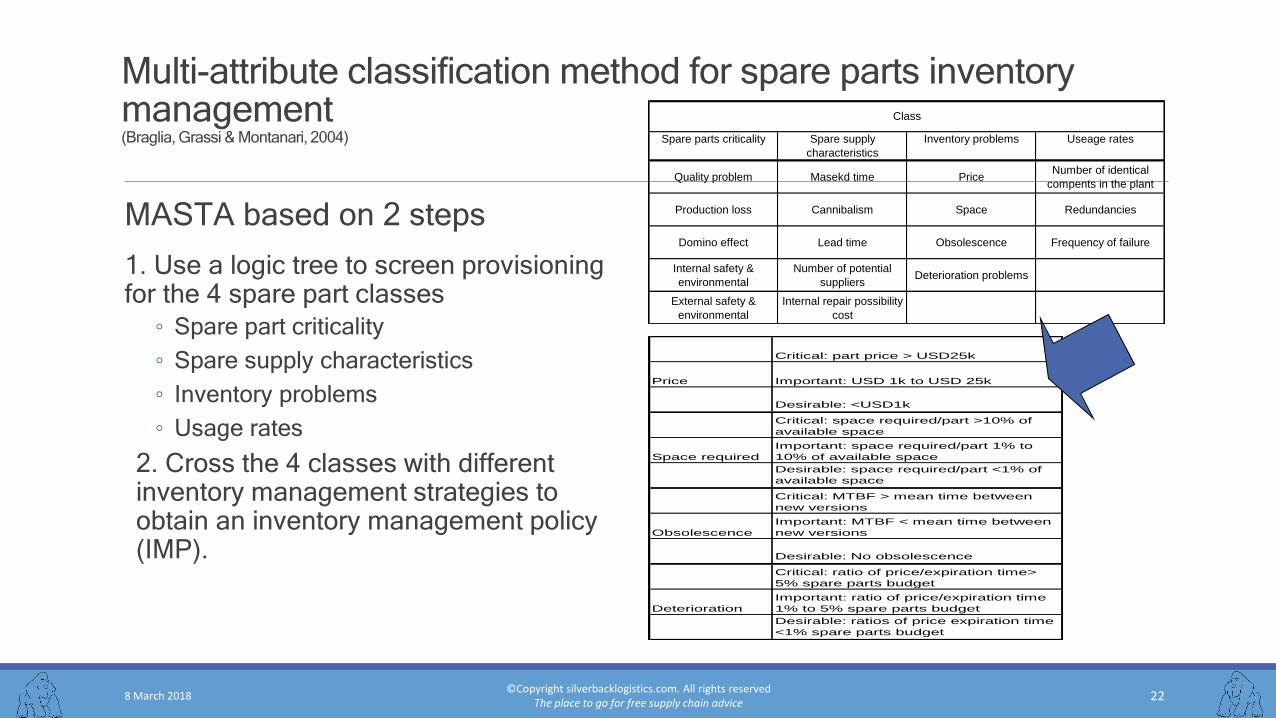
Multi-attribute classification method for spare parts inventory management(Braglia, Grassi & Montanari, 2004)
MASTA based on 2 steps
1. Use a logic tree to screen provisioning for the 4 spare part classes
◦ Spare part criticality
◦ Spare supply characteristics
◦ Inventory problems
◦ Usage rates
2. Cross the 4 classes with different inventory management strategies to obtain an inventory management policy (IMP).
Spare parts criticality Spare supply
characteristics
Inventory problems Useage rates
Quality problem Masekd time PriceNumber of identical
compents in the plant
Production loss Cannibalism Space Redundancies
Domino effect Lead time Obsolescence Frequency of failure
Internal safety &
environmental
Number of potential
suppliersDeterioration problems
External safety &
environmental
Internal repair possibility
cost
Class
Critical: part price > USD25k
Price Important: USD 1k to USD 25k
Desirable: <USD1k
Critical: space required/part >10% of
available space
Space required
Important: space required/part 1% to
10% of available space
Desirable: space required/part <1% of
available space
Critical: MTBF > mean time between
new versions
Obsolescence
Important: MTBF < mean time between
new versions
Desirable: No obsolescence
Critical: ratio of price/expiration time>
5% spare parts budget
Deterioration
Important: ratio of price/expiration time
1% to 5% spare parts budget
Desirable: ratios of price expiration time
<1% spare parts budget
8 March 2018©Copyright silverbacklogistics.com. All rights reserved
The place to go for free supply chain advice23
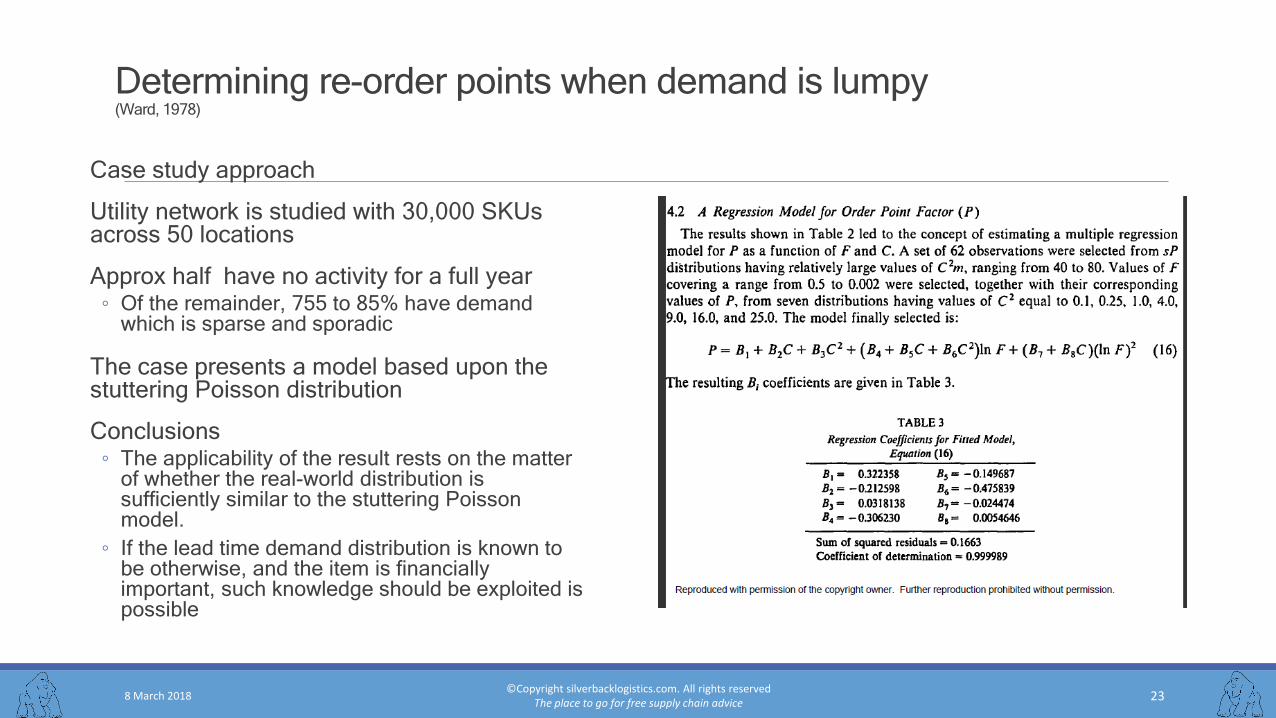
Determining re-order points when demand is lumpy(Ward, 1978)
Case study approach
Utility network is studied with 30,000 SKUs across 50 locations
Approx half have no activity for a full year◦ Of the remainder, 755 to 85% have demand
which is sparse and sporadic
The case presents a model based upon the stuttering Poisson distribution
Conclusions◦ The applicability of the result rests on the matter
of whether the real-world distribution is sufficiently similar to the stuttering Poisson model.
◦ If the lead time demand distribution is known to be otherwise, and the item is financially important, such knowledge should be exploited is possible
8 March 2018©Copyright silverbacklogistics.com. All rights reserved
The place to go for free supply chain advice24
An overview of recent literature on spare parts inventories,(Kennedy, Patterson & Fredendall, 2002)
Policies which govern spare part inventories are different from those which govern WIP and final product inventories
The unique aspects of spare parts inventories:◦ Maintenance policies rather than customer usage dictate the need for spare parts inventories
◦ Reliability information is generally not good enough to predict failure times
◦ Part failures are often dependent
◦ Demands for parts are often met through cannibalism
◦ The cost of being out of a part include quality, lost production and health & safety
◦ Obsolescence may be a problem
◦ Components as opposed to complete units are likely to be stocked
SPARTA approach1. Determine the demand for an item using ‘if then’ conjunction
2. Use heuristic rules to select recommended stock
3. Determine the system consequences for the recommended list of spare parts
25
An overview of recent literature on spare parts inventories,(Kennedy, Patterson & Fredendall, 2002)
Multi-echelon problems◦ Recurrent problem of where to place spare parts in multi-echelon systems
◦ Muckstadt et al (1973) MOD-Metric system minimises the back order cost of the end product rather than the back order costs of all the items
◦ Singh & Vrat (1982) defined a 2 echelon system defined using the sum of shortage, holding and transportation costs
◦ Cohen et al (1992) establish two types of demand, customer (emergency) demand and normal
◦ Shtub & Simon (1994) describe an inventory system where fill rate has to be maximised and there is a priority amongst the facilities served by the warehouse
Obsolescence◦ Walker (1996) suggests obsolescence is only included in those models which consider ‘insurance style’
spares.
◦ Cobbaert & Van Oudheusden (1996) suggest that ignoring an obsolescence risk as small as 20% may result in an average cost increase as large as 15%
Future research◦ Internet communication allows for a link between the spare part and the manufacturer, therefore
suppliers should be able to predict more accurately when new parts are required and reduce the risk of catastrophic breakdown and long delays
26
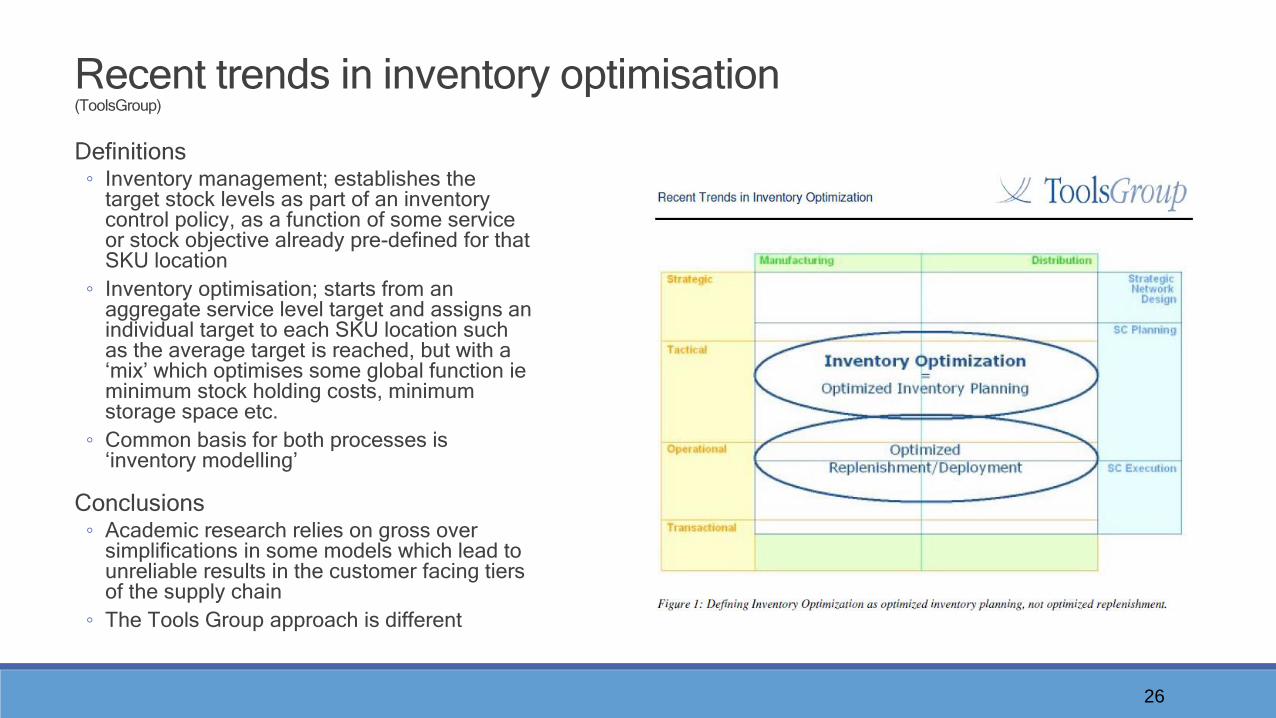
Recent trends in inventory optimisation(ToolsGroup)
Definitions◦ Inventory management; establishes the
target stock levels as part of an inventory control policy, as a function of some service or stock objective already pre-defined for that SKU location
◦ Inventory optimisation; starts from an aggregate service level target and assigns an individual target to each SKU location such as the average target is reached, but with a ‘mix’ which optimises some global function ieminimum stock holding costs, minimum storage space etc.
◦ Common basis for both processes is ‘inventory modelling’
Conclusions◦ Academic research relies on gross over
simplifications in some models which lead to unreliable results in the customer facing tiers of the supply chain
◦ The Tools Group approach is different
27
Mastering lumpy demand(Cornachia & Shamir, Tools Group)
Succeeding in a lumpy demand environment requires◦ Reliable demand modelling technology
◦ Advanced inventory modelling; providing reliable description of statistical inventory behaviour
◦ Logic for demand signal propagation which combines demand and inventory modelling
◦ A solution which assures good adherence between planned and actual thus reducing emergency interventions
Summary◦ Lumpy demand has high variability and probability distributions that are highly
skewed; classical models do not perform well with this data
28
Service optimiser 99+’s Inventory mix optimisation and how it relates to SAP SCM(ToolsGroup)
SAP supply chain management = ‘a complete solution that covers supply chain networking, planning, coordination and execution’
SAP SCM focusses on 4 key areas
◦ Supply chain collaboration (CPFR, VMI etc)
◦ Supply chain coordination (eg inbound logistics)
◦ Supply chain execution
◦ Supply chain planning
A keystone of DDSN is that there are two shock absorbers for demand and supply variability
1. Manufacturing capability
2. Inventory policy; to which SAP SCM approaches in an adhoc way
SAP SCM can conflict with the way organisations operate:
◦ The forecasting does not understand demand variability
◦ SAP SCM cannot determine the best global inventory mix and safety stocks at each item-location
Service Optimizer 99+ employs stochastic techniques to calculate stock mix optimisation and safety stock levels, whilst SAP employs heuristic and linear programming based techniques.
29
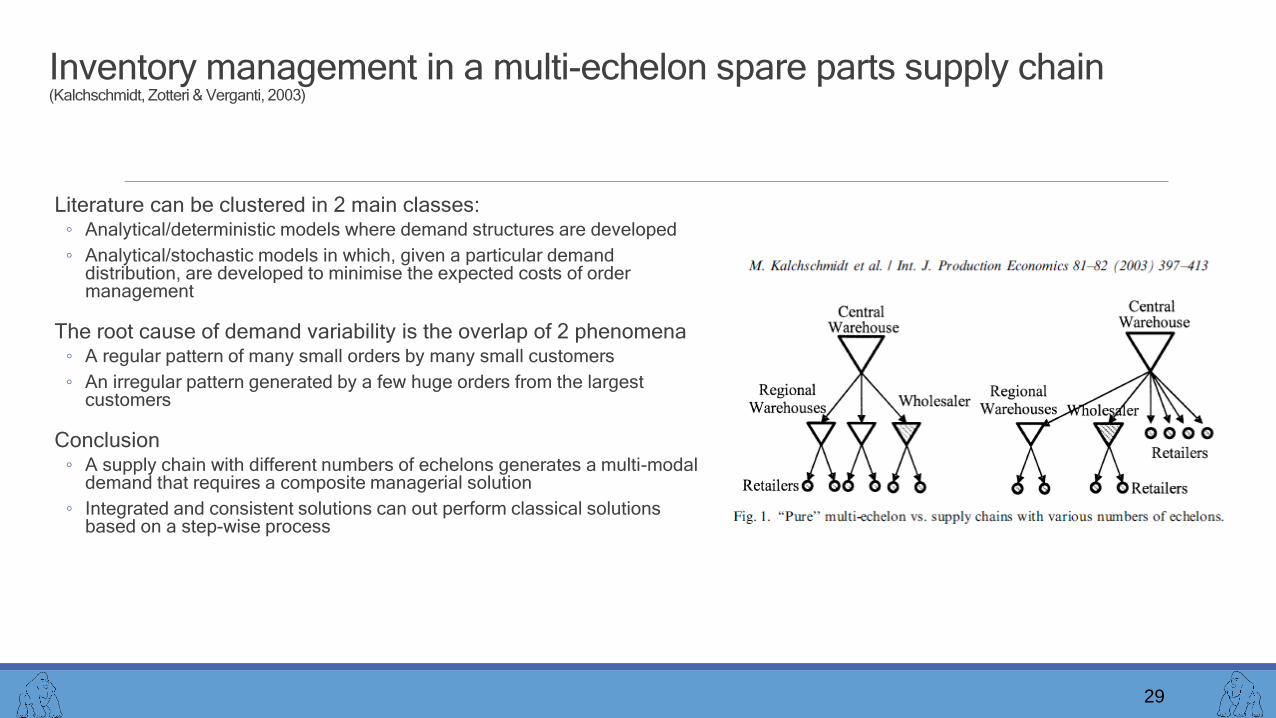
Inventory management in a multi-echelon spare parts supply chain(Kalchschmidt, Zotteri & Verganti, 2003)
Literature can be clustered in 2 main classes:◦ Analytical/deterministic models where demand structures are developed
◦ Analytical/stochastic models in which, given a particular demand distribution, are developed to minimise the expected costs of order management
The root cause of demand variability is the overlap of 2 phenomena◦ A regular pattern of many small orders by many small customers
◦ An irregular pattern generated by a few huge orders from the largest customers
Conclusion◦ A supply chain with different numbers of echelons generates a multi-modal
demand that requires a composite managerial solution
◦ Integrated and consistent solutions can out perform classical solutions based on a step-wise process
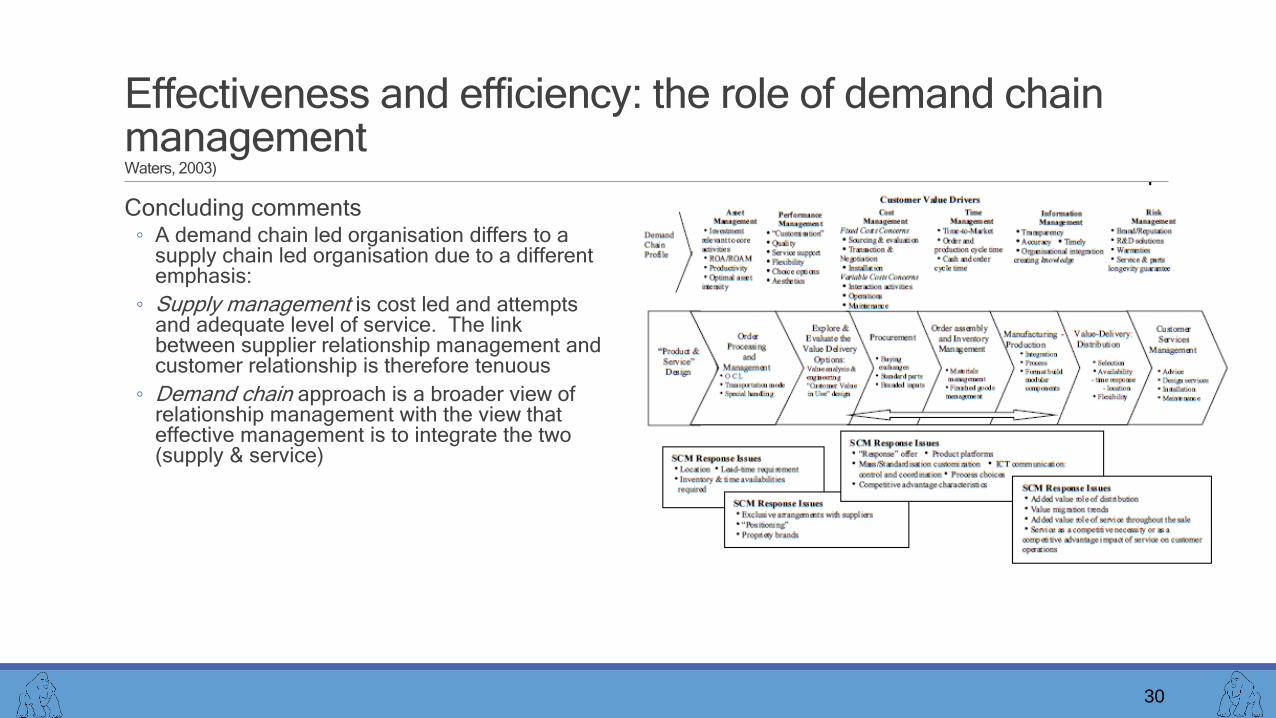
Effectiveness and efficiency: the role of demand chain managementWaters, 2003)
Concluding comments◦ A demand chain led organisation differs to a
supply chain led organisation due to a different emphasis:
◦ Supply management is cost led and attempts and adequate level of service. The link between supplier relationship management and customer relationship is therefore tenuous
◦ Demand chain approach is a broader view of relationship management with the view that effective management is to integrate the two (supply & service)
30
31
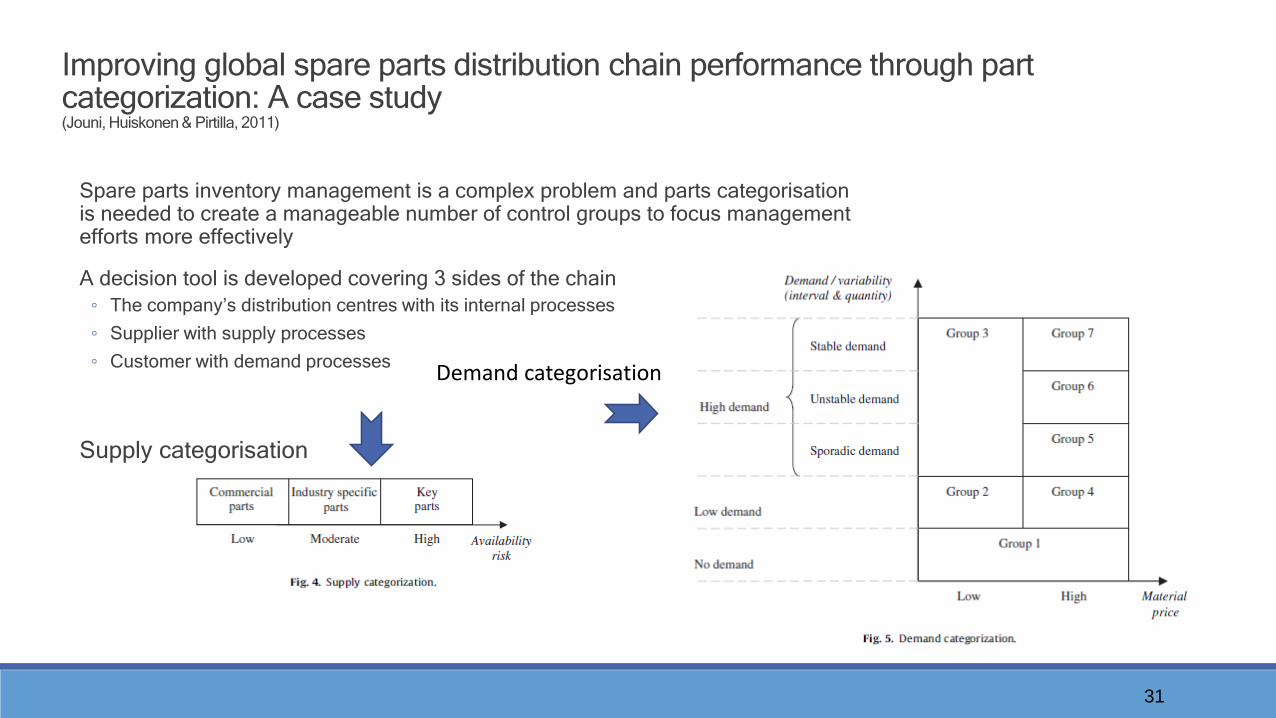
Spare parts inventory management is a complex problem and parts categorisation is needed to create a manageable number of control groups to focus management efforts more effectively
A decision tool is developed covering 3 sides of the chain
◦ The company’s distribution centres with its internal processes
◦ Supplier with supply processes
◦ Customer with demand processes
Supply categorisation
Improving global spare parts distribution chain performance through part categorization: A case study(Jouni, Huiskonen & Pirtilla, 2011)
Demand categorisation
32
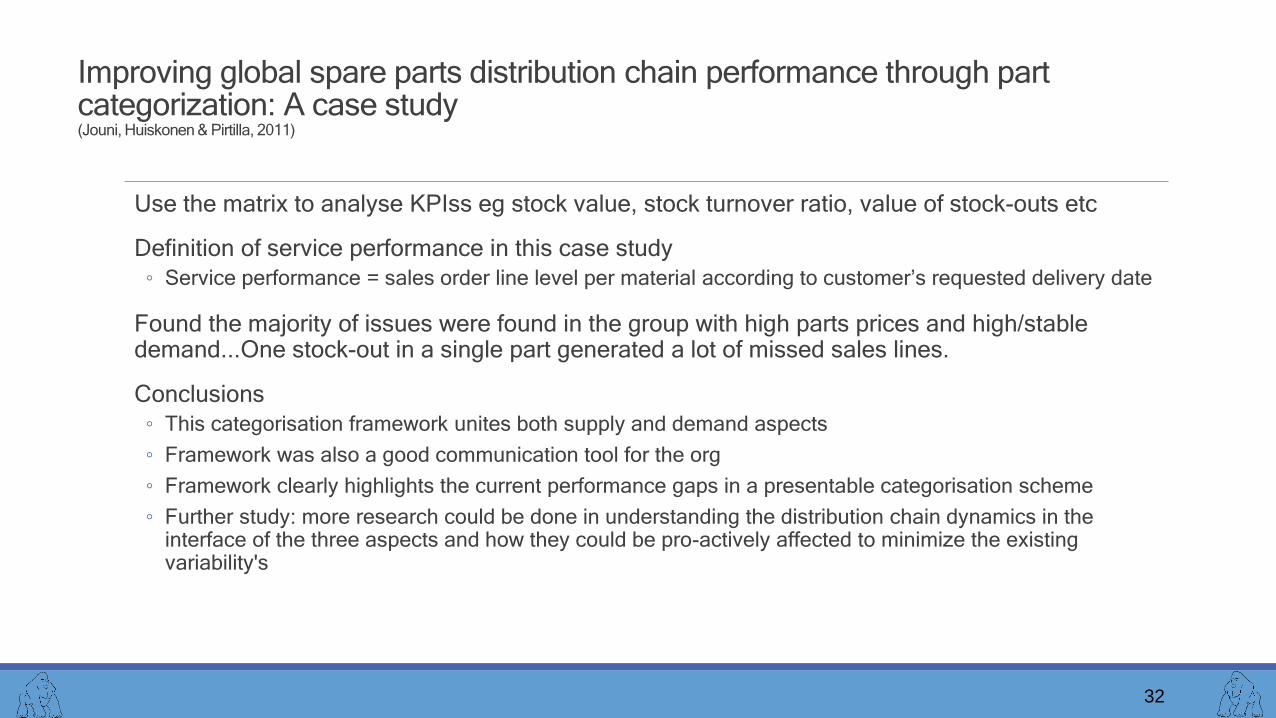
Improving global spare parts distribution chain performance through part categorization: A case study(Jouni, Huiskonen & Pirtilla, 2011)
Use the matrix to analyse KPIss eg stock value, stock turnover ratio, value of stock-outs etc
Definition of service performance in this case study
◦ Service performance = sales order line level per material according to customer’s requested delivery date
Found the majority of issues were found in the group with high parts prices and high/stable demand...One stock-out in a single part generated a lot of missed sales lines.
Conclusions
◦ This categorisation framework unites both supply and demand aspects
◦ Framework was also a good communication tool for the org
◦ Framework clearly highlights the current performance gaps in a presentable categorisation scheme
◦ Further study: more research could be done in understanding the distribution chain dynamics in the interface of the three aspects and how they could be pro-actively affected to minimize the existing variability's
33
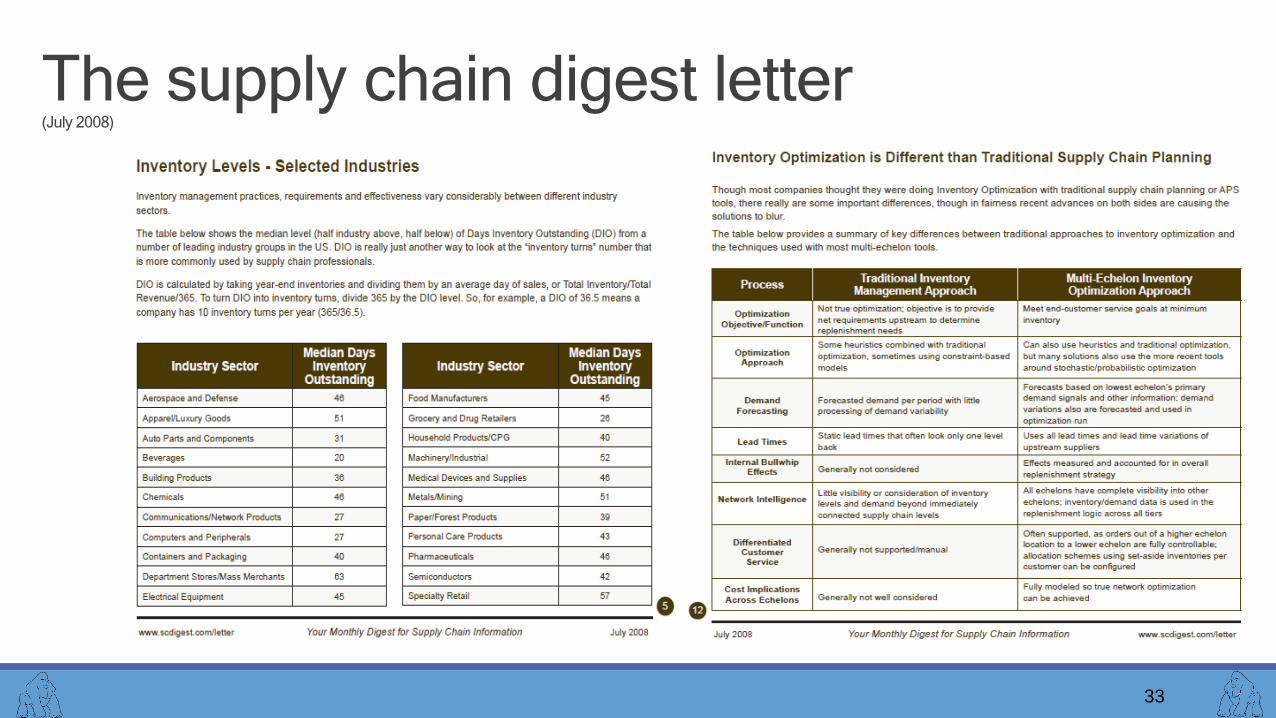
The supply chain digest letter(July 2008)
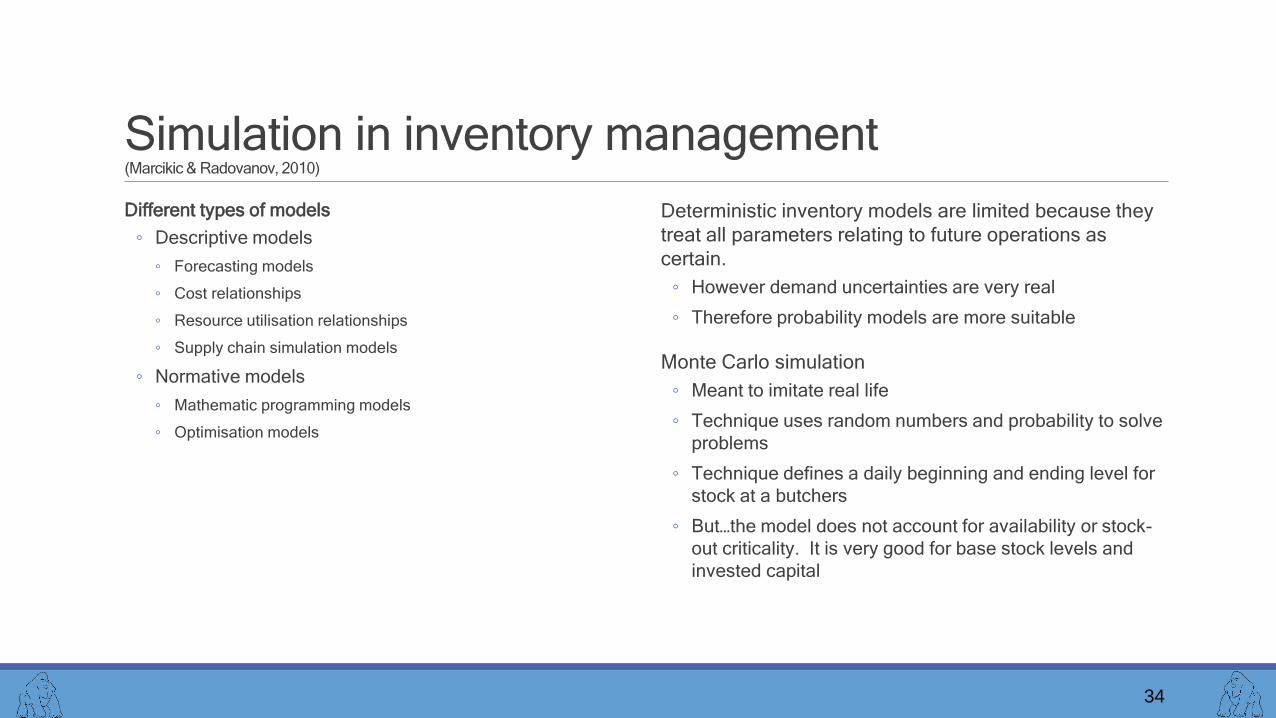
Simulation in inventory management(Marcikic & Radovanov, 2010)
Different types of models
◦ Descriptive models
◦ Forecasting models
◦ Cost relationships
◦ Resource utilisation relationships
◦ Supply chain simulation models
◦ Normative models
◦ Mathematic programming models
◦ Optimisation models
Deterministic inventory models are limited because they
treat all parameters relating to future operations as
certain.
◦ However demand uncertainties are very real
◦ Therefore probability models are more suitable
Monte Carlo simulation
◦ Meant to imitate real life
◦ Technique uses random numbers and probability to solve
problems
◦ Technique defines a daily beginning and ending level for
stock at a butchers
◦ But…the model does not account for availability or stock-
out criticality. It is very good for base stock levels and
invested capital
34
35
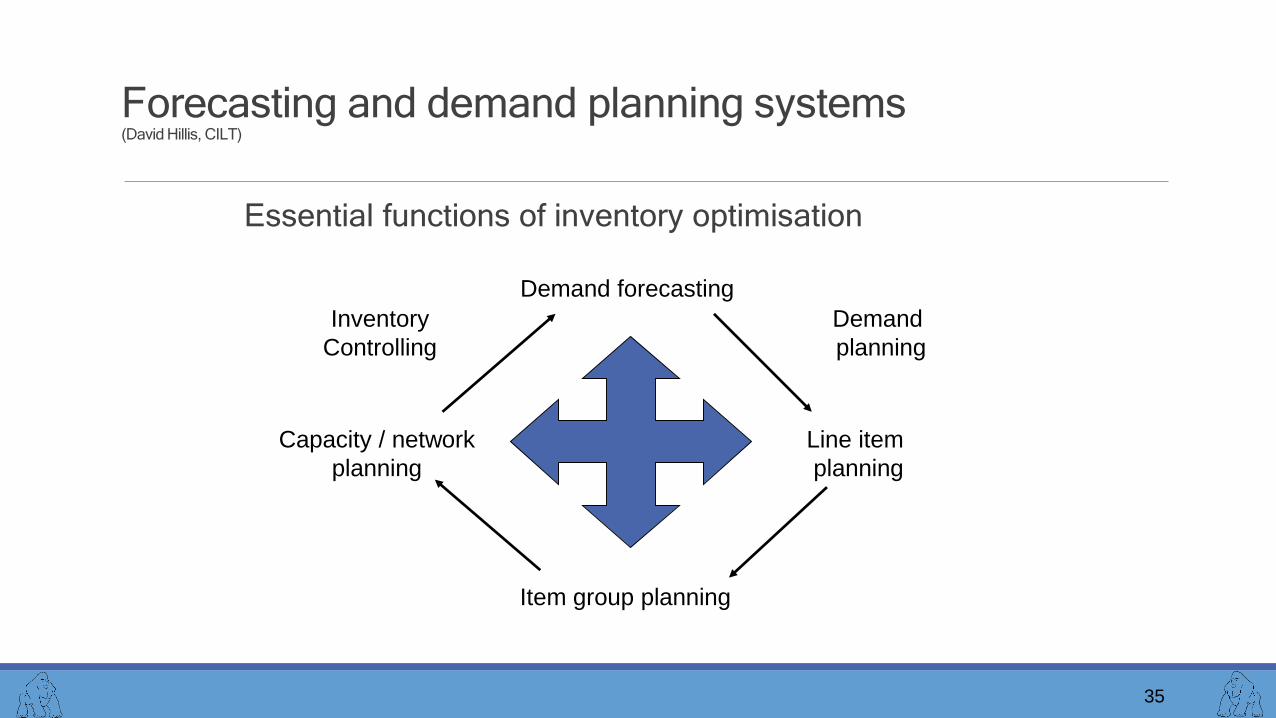
Forecasting and demand planning systems(David Hillis, CILT)
Essential functions of inventory optimisation
Demand forecasting
Item group planning
Capacity / network
planning
Line item
planning
Demand
planning
Inventory
Controlling
36
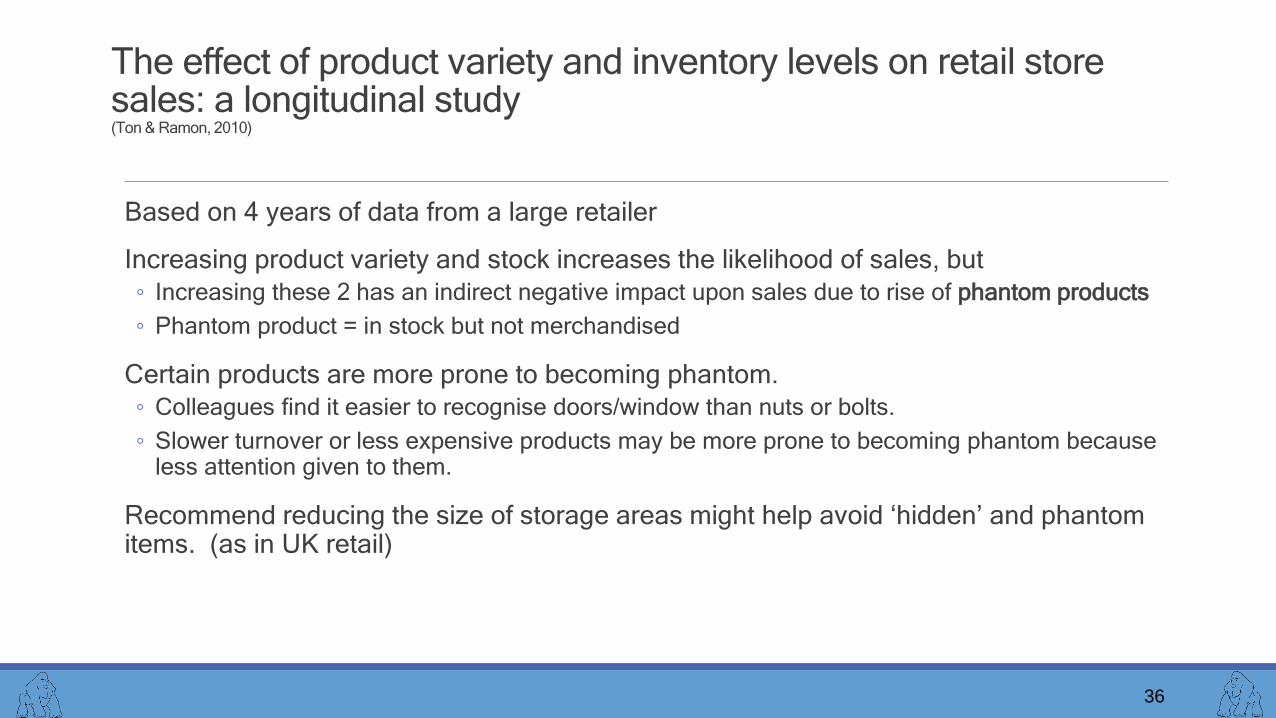
The effect of product variety and inventory levels on retail store sales: a longitudinal study(Ton & Ramon, 2010)
Based on 4 years of data from a large retailer
Increasing product variety and stock increases the likelihood of sales, but
◦ Increasing these 2 has an indirect negative impact upon sales due to rise of phantom products
◦ Phantom product = in stock but not merchandised
Certain products are more prone to becoming phantom.
◦ Colleagues find it easier to recognise doors/window than nuts or bolts.
◦ Slower turnover or less expensive products may be more prone to becoming phantom because less attention given to them.
Recommend reducing the size of storage areas might help avoid ‘hidden’ and phantom items. (as in UK retail)
37
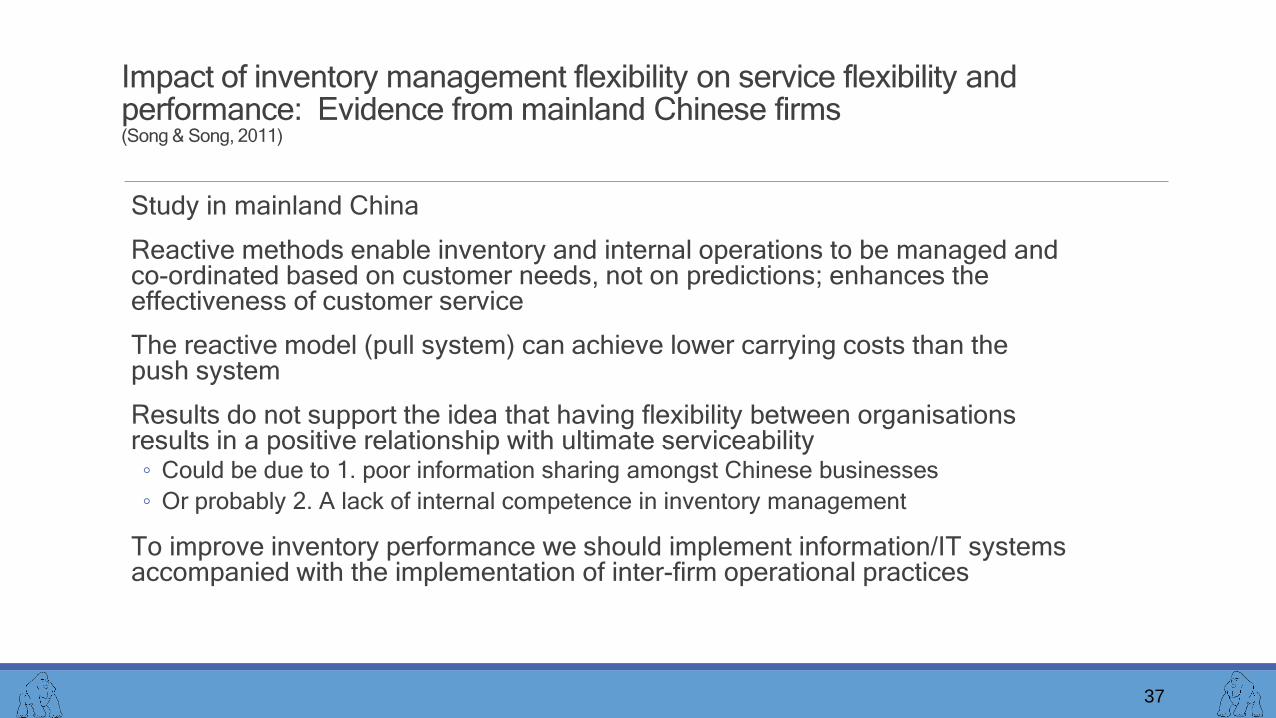
Impact of inventory management flexibility on service flexibility and performance: Evidence from mainland Chinese firms(Song & Song, 2011)
Study in mainland China
Reactive methods enable inventory and internal operations to be managed and co-ordinated based on customer needs, not on predictions; enhances the effectiveness of customer service
The reactive model (pull system) can achieve lower carrying costs than the push system
Results do not support the idea that having flexibility between organisations results in a positive relationship with ultimate serviceability
◦ Could be due to 1. poor information sharing amongst Chinese businesses
◦ Or probably 2. A lack of internal competence in inventory management
To improve inventory performance we should implement information/IT systems accompanied with the implementation of inter-firm operational practices

Smart Inventory SolutionsPhill ip Slater, 2010
38
39
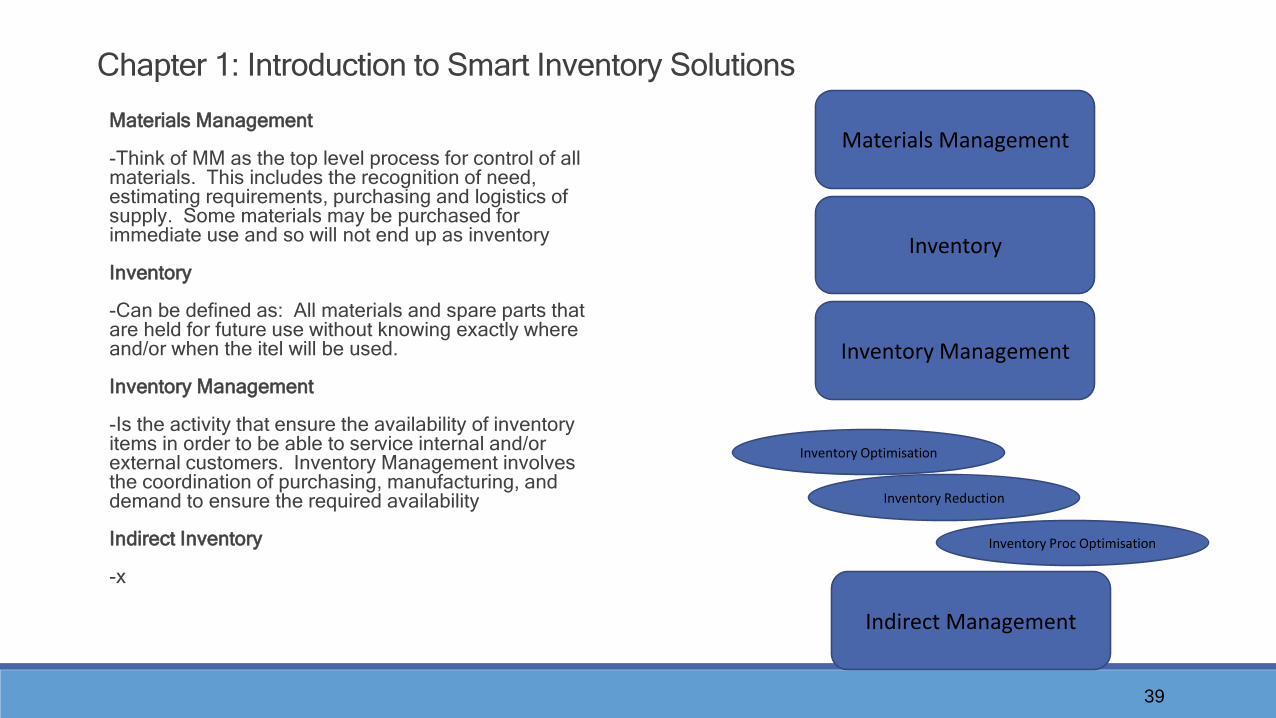
Chapter 1: Introduction to Smart Inventory Solutions
Materials Management
-Think of MM as the top level process for control of all materials. This includes the recognition of need, estimating requirements, purchasing and logistics of supply. Some materials may be purchased for immediate use and so will not end up as inventory
Inventory
-Can be defined as: All materials and spare parts that are held for future use without knowing exactly where and/or when the itel will be used.
Inventory Management
-Is the activity that ensure the availability of inventory items in order to be able to service internal and/or external customers. Inventory Management involves the coordination of purchasing, manufacturing, and demand to ensure the required availability
Indirect Inventory
-x
Materials Management
Inventory
Inventory Management
Indirect Management
Inventory Optimisation
Inventory Reduction
Inventory Proc Optimisation
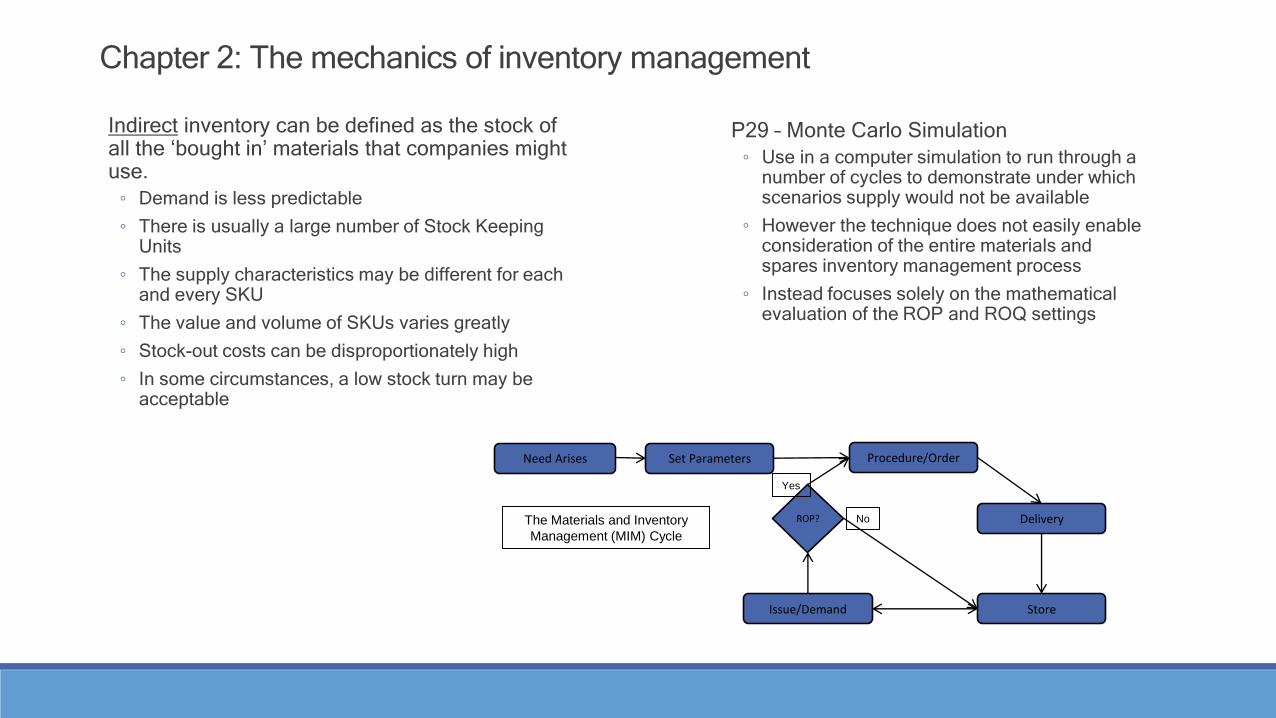
Chapter 2: The mechanics of inventory management
Indirect inventory can be defined as the stock of all the ‘bought in’ materials that companies might use.
◦ Demand is less predictable
◦ There is usually a large number of Stock Keeping Units
◦ The supply characteristics may be different for each and every SKU
◦ The value and volume of SKUs varies greatly
◦ Stock-out costs can be disproportionately high
◦ In some circumstances, a low stock turn may be acceptable
P29 – Monte Carlo Simulation
◦ Use in a computer simulation to run through a number of cycles to demonstrate under which scenarios supply would not be available
◦ However the technique does not easily enable consideration of the entire materials and spares inventory management process
◦ Instead focuses solely on the mathematical evaluation of the ROP and ROQ settings
Need Arises Set Parameters Procedure/Order
Delivery
StoreIssue/Demand
ROP?
Yes
NoThe Materials and Inventory
Management (MIM) Cycle
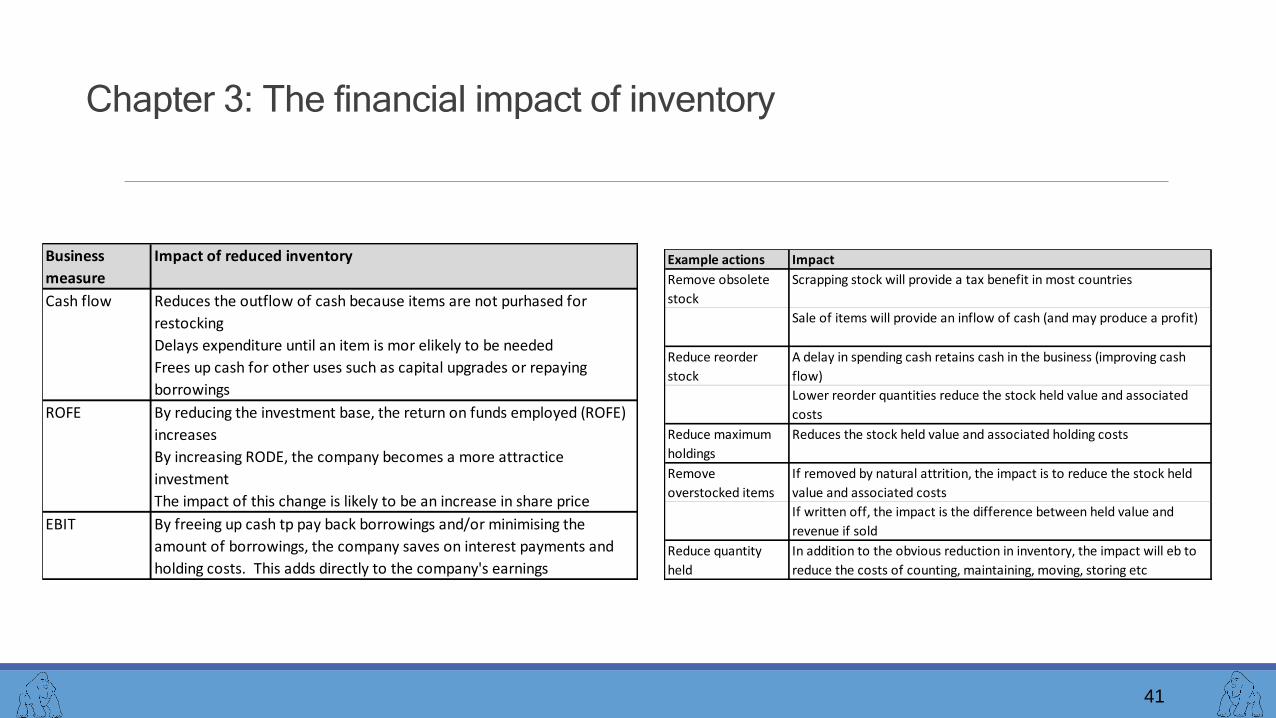
Chapter 3: The financial impact of inventory
41
Business
measure
Impact of reduced inventory
Cash flow Reduces the outflow of cash because items are not purhased for
restocking
Delays expenditure until an item is mor elikely to be needed
Frees up cash for other uses such as capital upgrades or repaying
borrowings
ROFE By reducing the investment base, the return on funds employed (ROFE)
increases
By increasing RODE, the company becomes a more attractice
investment
The impact of this change is likely to be an increase in share price
EBIT By freeing up cash tp pay back borrowings and/or minimising the
amount of borrowings, the company saves on interest payments and
holding costs. This adds directly to the company's earnings
Example actions Impact
Remove obsolete
stock
Scrapping stock will provide a tax benefit in most countries
Sale of items will provide an inflow of cash (and may produce a profit)
Reduce reorder
stock
A delay in spending cash retains cash in the business (improving cash
flow)
Lower reorder quantities reduce the stock held value and associated
costs
Reduce maximum
holdings
Reduces the stock held value and associated holding costs
Remove
overstocked items
If removed by natural attrition, the impact is to reduce the stock held
value and associated costs
If written off, the impact is the difference between held value and
revenue if sold
Reduce quantity
held
In addition to the obvious reduction in inventory, the impact will eb to
reduce the costs of counting, maintaining, moving, storing etc
42
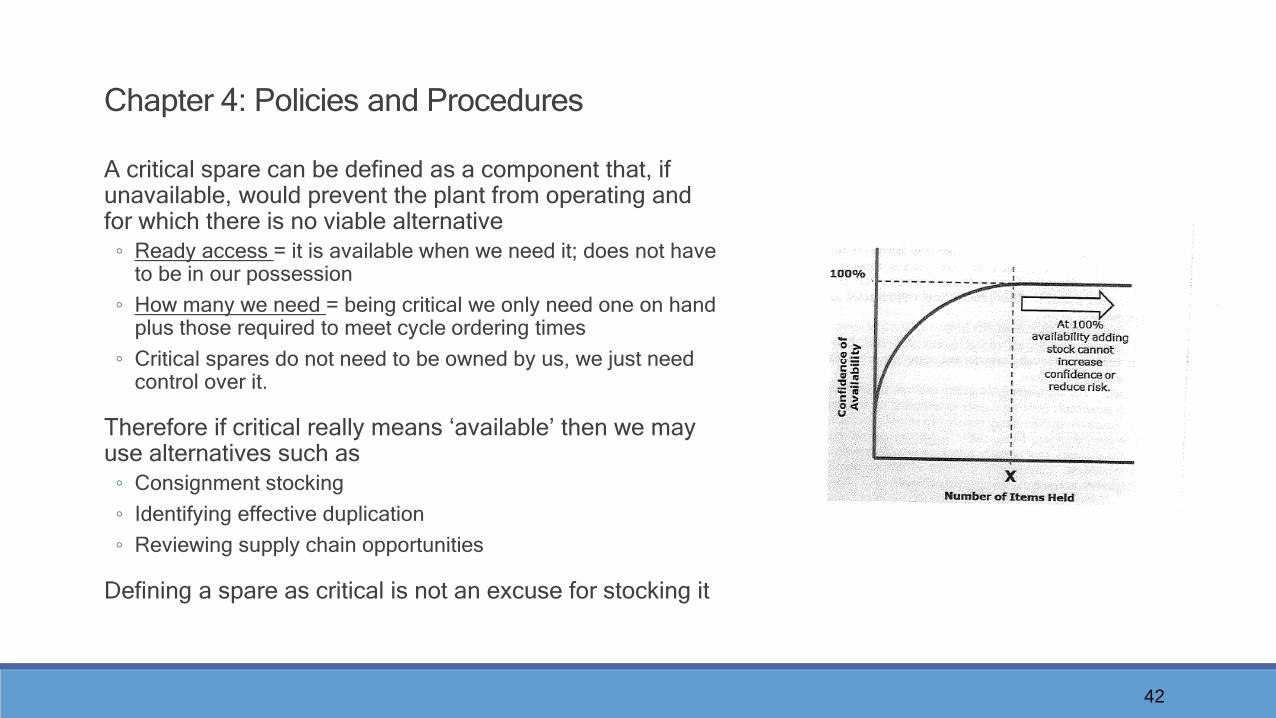
Chapter 4: Policies and Procedures
A critical spare can be defined as a component that, if unavailable, would prevent the plant from operating and for which there is no viable alternative
◦ Ready access = it is available when we need it; does not have to be in our possession
◦ How many we need = being critical we only need one on hand plus those required to meet cycle ordering times
◦ Critical spares do not need to be owned by us, we just need control over it.
Therefore if critical really means ‘available’ then we may use alternatives such as
◦ Consignment stocking
◦ Identifying effective duplication
◦ Reviewing supply chain opportunities
Defining a spare as critical is not an excuse for stocking it
43
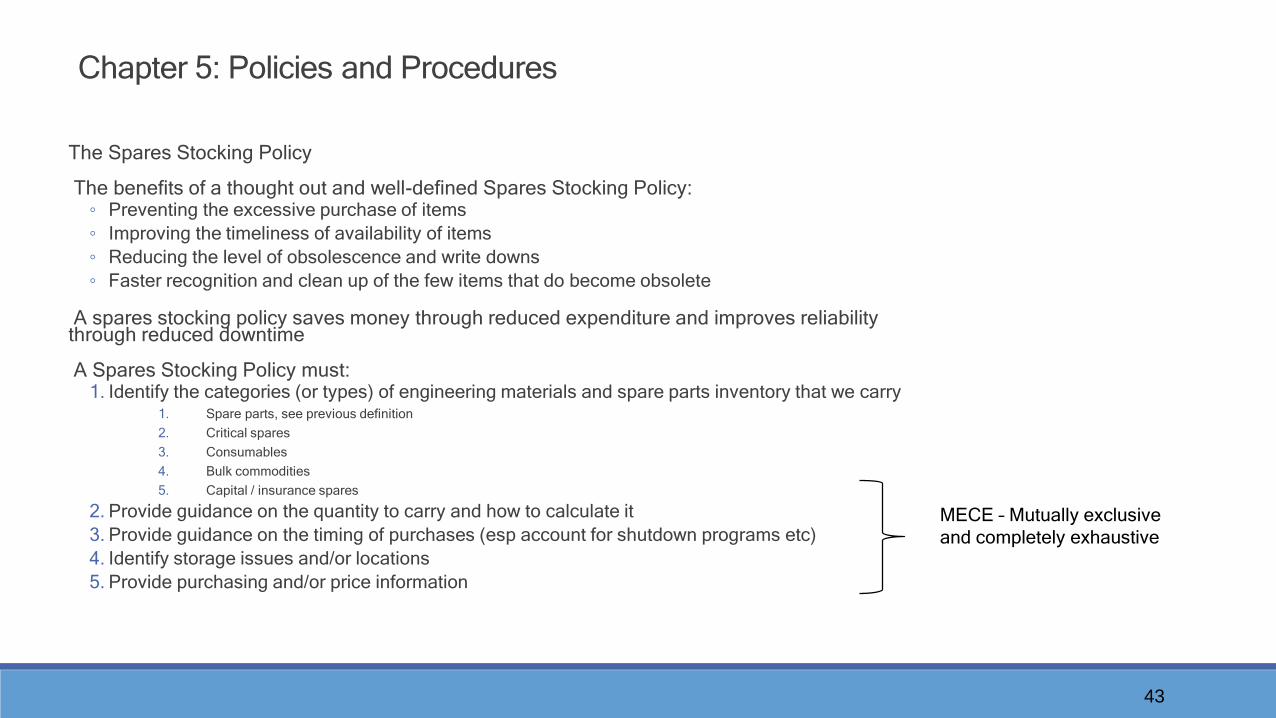
Chapter 5: Policies and Procedures
The Spares Stocking Policy
The benefits of a thought out and well-defined Spares Stocking Policy:◦ Preventing the excessive purchase of items
◦ Improving the timeliness of availability of items
◦ Reducing the level of obsolescence and write downs
◦ Faster recognition and clean up of the few items that do become obsolete
A spares stocking policy saves money through reduced expenditure and improves reliability through reduced downtime
A Spares Stocking Policy must:1. Identify the categories (or types) of engineering materials and spare parts inventory that we carry
1. Spare parts, see previous definition
2. Critical spares
3. Consumables
4. Bulk commodities
5. Capital / insurance spares
2. Provide guidance on the quantity to carry and how to calculate it
3. Provide guidance on the timing of purchases (esp account for shutdown programs etc)
4. Identify storage issues and/or locations
5. Provide purchasing and/or price information
MECE – Mutually exclusive
and completely exhaustive
44
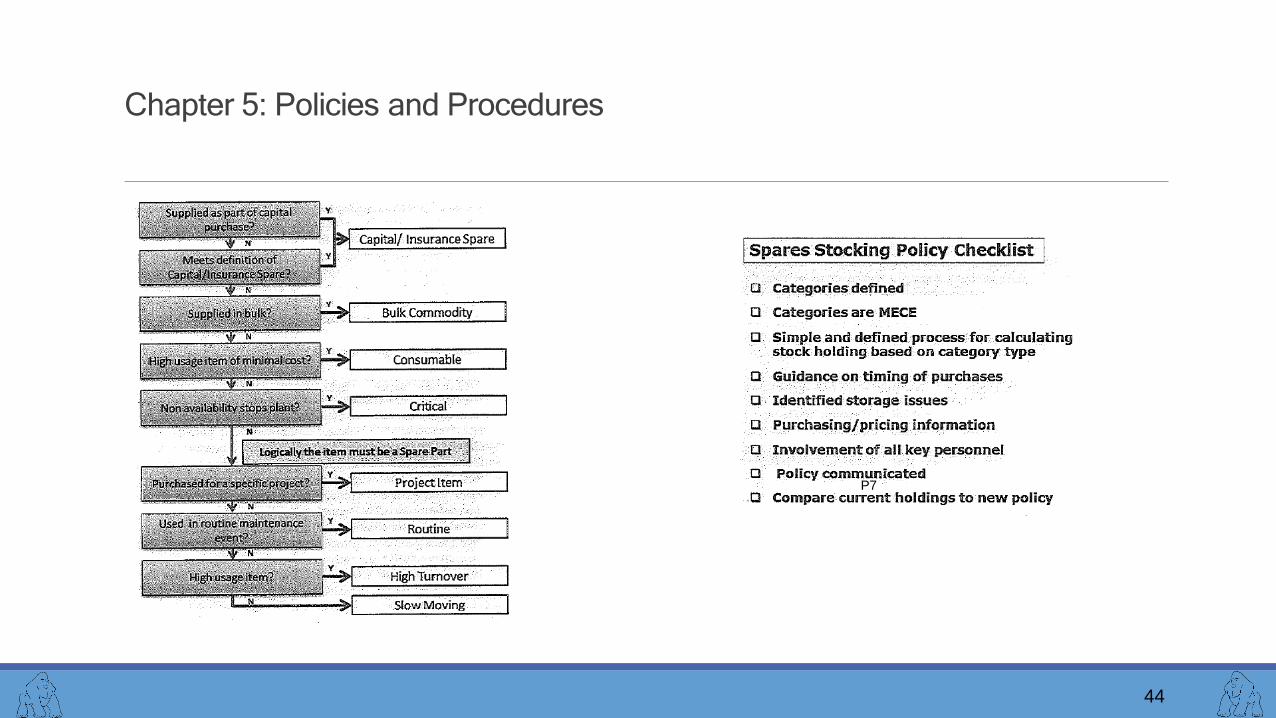
Chapter 5: Policies and Procedures
P7
45
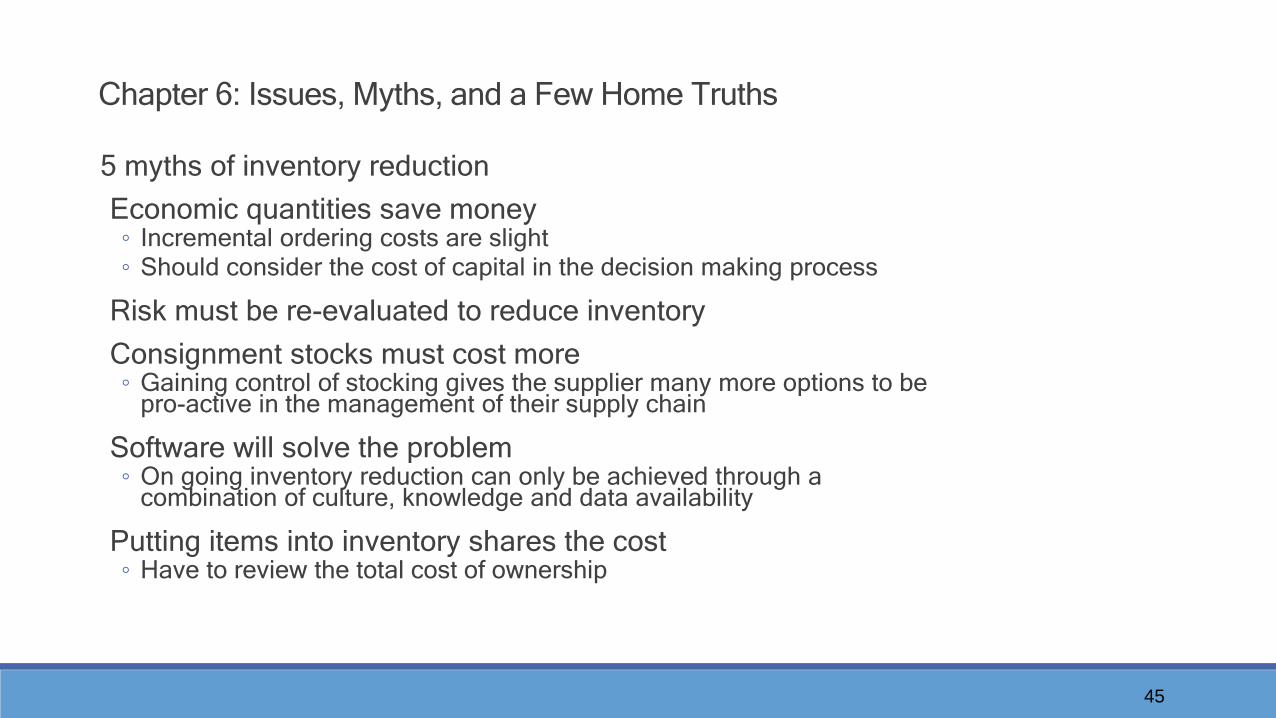
5 myths of inventory reduction
Economic quantities save money◦ Incremental ordering costs are slight◦ Should consider the cost of capital in the decision making process
Risk must be re-evaluated to reduce inventory
Consignment stocks must cost more◦ Gaining control of stocking gives the supplier many more options to be
pro-active in the management of their supply chain
Software will solve the problem◦ On going inventory reduction can only be achieved through a
combination of culture, knowledge and data availability
Putting items into inventory shares the cost◦ Have to review the total cost of ownership
Chapter 6: Issues, Myths, and a Few Home Truths
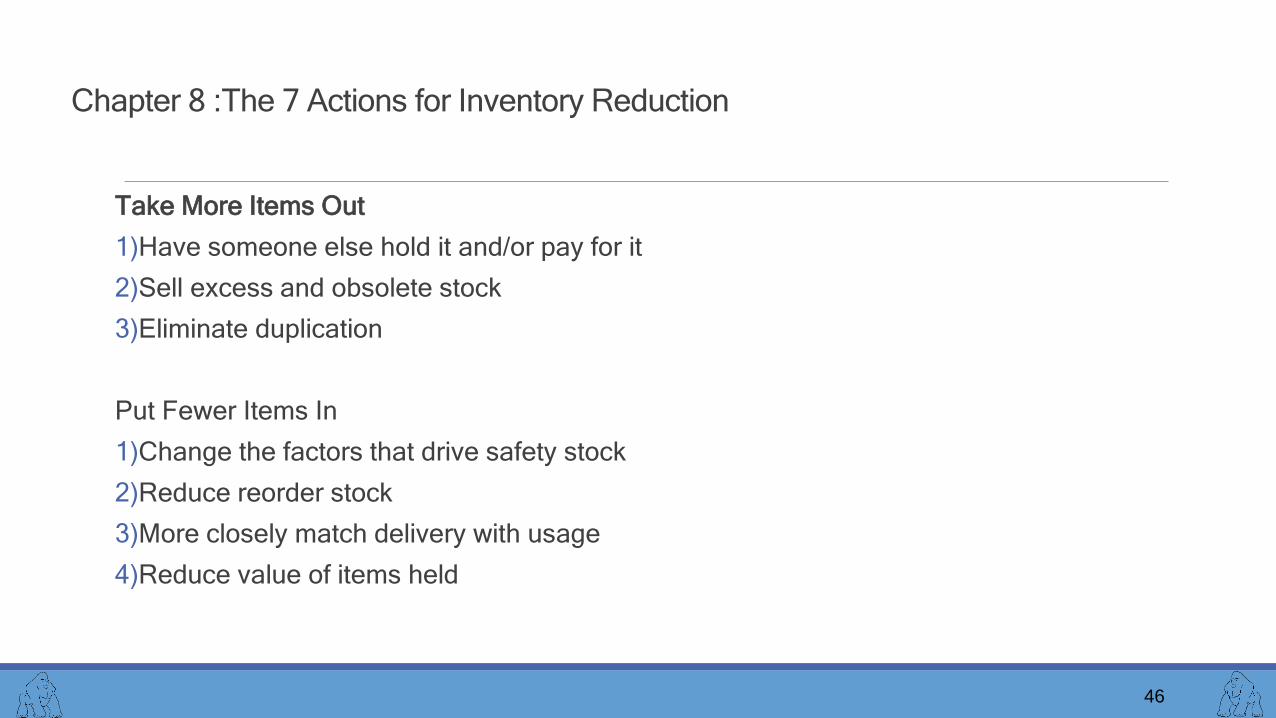
Take More Items Out
1)Have someone else hold it and/or pay for it
2)Sell excess and obsolete stock
3)Eliminate duplication
Put Fewer Items In
1)Change the factors that drive safety stock
2)Reduce reorder stock
3)More closely match delivery with usage
4)Reduce value of items held
46
Chapter 8 :The 7 Actions for Inventory Reduction
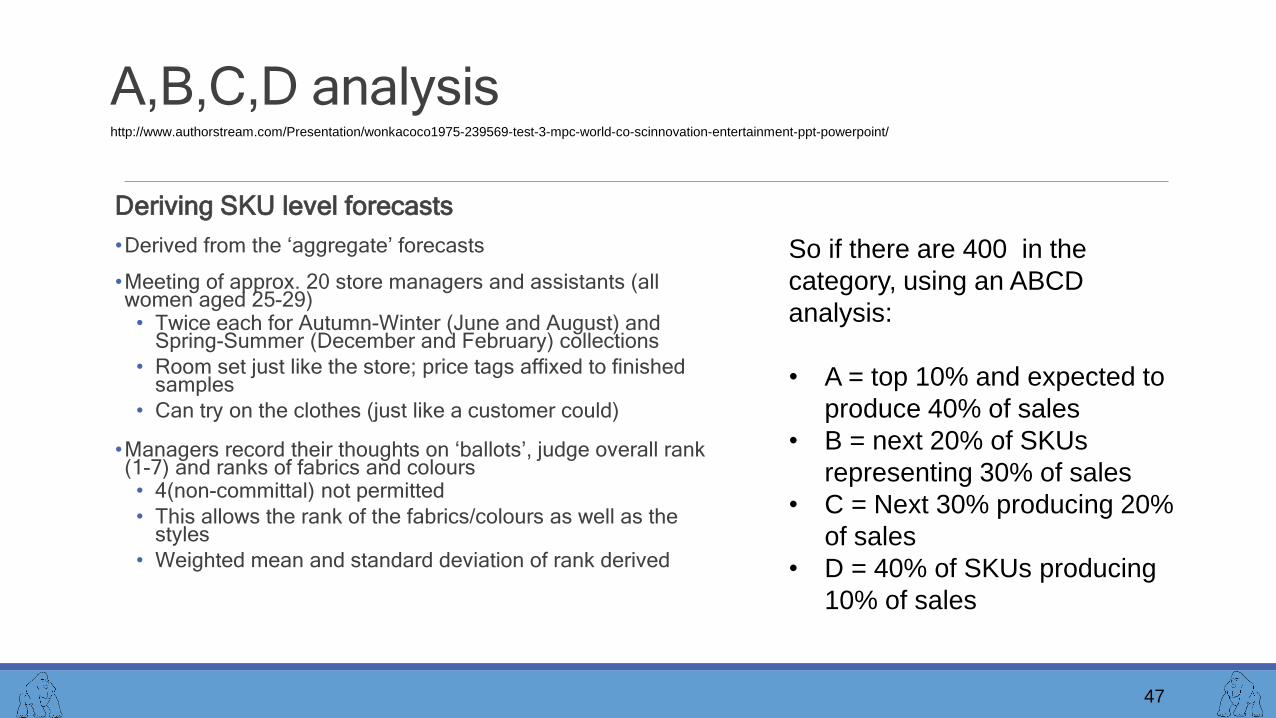
A,B,C,D analysis
Deriving SKU level forecasts
•Derived from the ‘aggregate’ forecasts
•Meeting of approx. 20 store managers and assistants (all women aged 25-29)• Twice each for Autumn-Winter (June and August) and
Spring-Summer (December and February) collections
• Room set just like the store; price tags affixed to finished samples
• Can try on the clothes (just like a customer could)
•Managers record their thoughts on ‘ballots’, judge overall rank (1-7) and ranks of fabrics and colours• 4(non-committal) not permitted
• This allows the rank of the fabrics/colours as well as the styles
• Weighted mean and standard deviation of rank derived
47
http://www.authorstream.com/Presentation/wonkacoco1975-239569-test-3-mpc-world-co-scinnovation-entertainment-ppt-powerpoint/
So if there are 400 in the
category, using an ABCD
analysis:
• A = top 10% and expected to
produce 40% of sales
• B = next 20% of SKUs
representing 30% of sales
• C = Next 30% producing 20%
of sales
• D = 40% of SKUs producing
10% of sales
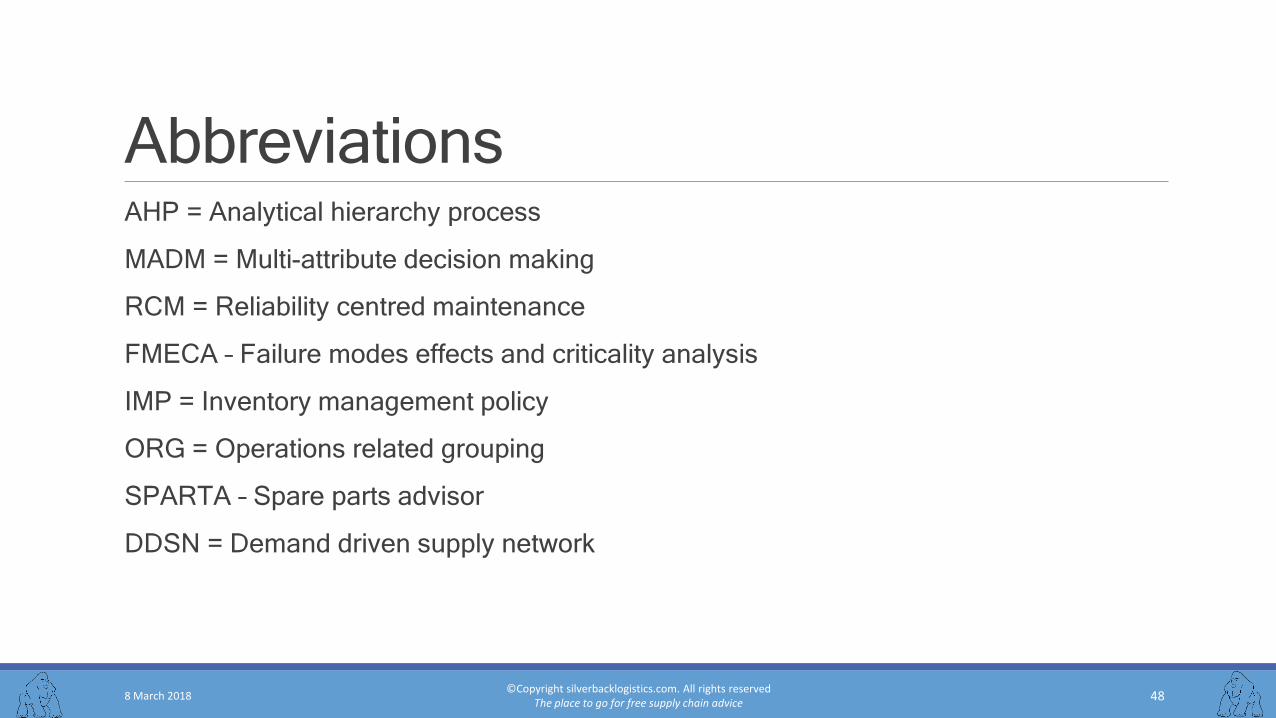
Abbreviations
8 March 2018©Copyright silverbacklogistics.com. All rights reserved
The place to go for free supply chain advice48
AHP = Analytical hierarchy process
MADM = Multi-attribute decision making
RCM = Reliability centred maintenance
FMECA – Failure modes effects and criticality analysis
IMP = Inventory management policy
ORG = Operations related grouping
SPARTA – Spare parts advisor
DDSN = Demand driven supply network

8 March 2018©Copyright silverbacklogistics.com. All rights reserved
The place to go for free supply chain advice 49
For more details on any of these topics, please contact us at: [email protected]