Embed Size (px)
Citation preview

Inventory of Construction Aggregate Sources in Michigan J.C. BREHLER, Engineer of Materials, Michigan State Highway Department
This paper presents the method used by the Michigan State Highway Department in compiling, for ready reference, information pertaining to test data on existing construction aggregate sources. It describes the format and defines, in detail, the meaning intent of the various column headings used in presenting the available data. It also describes briefly the geological origin of the natural gravel deposits found in the State and its resultant effect on the aggregate quality.
•THE Michigan State Highway Department's "Inventory of Construction Aggregate Sources" was initiated primarily in order that information pertaining to existing test data would be readily available to contractors and producers on short notice.
In 1938, Michigan's trunkline system was comprised mainly of gravel su.rfaced roads which required what was considered in those days to be large productions of surfacing gravels for construction and maintenance. As more deposits were opened, the need was recognized for a systematized means of record keeping, other than searching through the individual project files for test data.
The sand and gravel sources in Michigan (1) are the results of the glacial drift depositions formed by the successive advances and recessions of the Wisconsin Glacier, the last of the glaciers which at one time had covered the entire State. In these drift deposits are found areas of unstratified debris as caused by the melting action of the glacier and the amount and character of debris held in the ice. These al'eas vary in thickness from only a few inches in the Alpena area in the northeastern part of the Lower Peninsula to approximately 1, 200 ft in the Cadillac area which is located in the northwestern part of the Lower Peninsula.
The features formed by the drift deposition in the recession of the Wisconsin Ice Sheet vary from flat level lake beds to a very rough terrain of ridges, or moraines. The material from iliese formations varies from clay to gravel and the granular textures may be segregated or mixed heterogeneously with J:>oulder clays.
As would then be expected, the complexity of the gravel features resulting from these glacial drift deposits is such that considerable variations can be expected even within a single deposit. In Michigan it is not uncommon to identify schists, shales, ochres, cherts, iron clay stones, and igneous rocks in a product from a single deposit.
In the original Inventory it is estimated that some 500 sources were listed with pertinent data. In the majority of instances, these were sources from which surfacing aggregates ·had been produced; and, in a few instances, locations where traces of gravel had peen encountered by the soils engineers in the borings of the soil surveys for construction projects.
The original Inventory was introduced primarily for Departmental use and contained the name of the property owner, or the pit name, the county in which it was located, the pit number in the county, the legal description of the property, the driving directions from the nearest town, and test data, in chronological order, pertaining to abrasion r e sults, soft stone, and crushed particle, contents, and the fraction passing the No. 200 sieve which had been obtained from the samples of either bank run or processed gravel,
Paper sponsored by Committee on Surveying, Mapping and Classification of Soils.
3

4
which had been submitted to the Laboratory . Later, county maps were added to the original format, on which the locations of the pits were marked and identified by the pit number.
As expressed earlier, the use of this Inventory was almost exclusively by the Department as a ready reference of current test data, and the pit locations where the aggregate inspectors were to report when assigned. However, as more and more data were accumulated a nd incorporated with the existing il)formation, gravel producers began making inquir 'es regarding potential sour ces in areas in which they were not too familiar and in which they were contemplating the submission of a contract bid on a proposed construction project. As the contractors became more familiar with the.existence of such compiled information, requests were received for copies and Departmental approval was given to make the current issues available to the contractors , gravel producers, other State agencies and those who were connected with the highway construction industry. Gravel producers, par ticular ly, on many occasions have expressed the opinion that much time and many miles of driving can be saved through a r e view of the a vailable info rmation compiled in the Inventory pertaining to areas in which they are interested at a particular time.
This information is also used on occasions when a new deposit is being exploited. In these instances, test results of established deposits in the area are reviewed, and based on this review a conside red opinion is expressed to the producer as to whether material produced from the new deposit could be expected to meet the specification abrasion requirements. Knowing how variable the deposits can be even with a small area this opinion is no more than an educated guess, however, and the producer is advised of this and is aware of the calculated risks involved.
The Inventory also includes information regarding stone quarries, commercial gravel plants, several waste mine rock and stamp sand stockpiles, a blast furnace slag plant, and undeveloped gravel deposits , as well as the gravel pits from which material has been used.
About ten years ago an investigation was started on a limited scale to determine the possibilities of further augmenting the information given in the Inventory by compiling a production history of the individual deposits. Of primary interest were the difficulties encountered by the producer in the production of a specification aggregate, such as excessive sand which required the use of sand ejection equipment, heavy overburden which required more than a normal amount of stripping, etc. These observations were submitted by the inspectors after completion of the production of the contract commitments from a specific pit for a particular project. The results showed that the majority of the deposits were so variable in character that a consistent pattern could not be established. On this basis, it was felt that such information could be misleading or misinterpreted by the producer if incorporated in the inventory and so the investigation was discontinued.
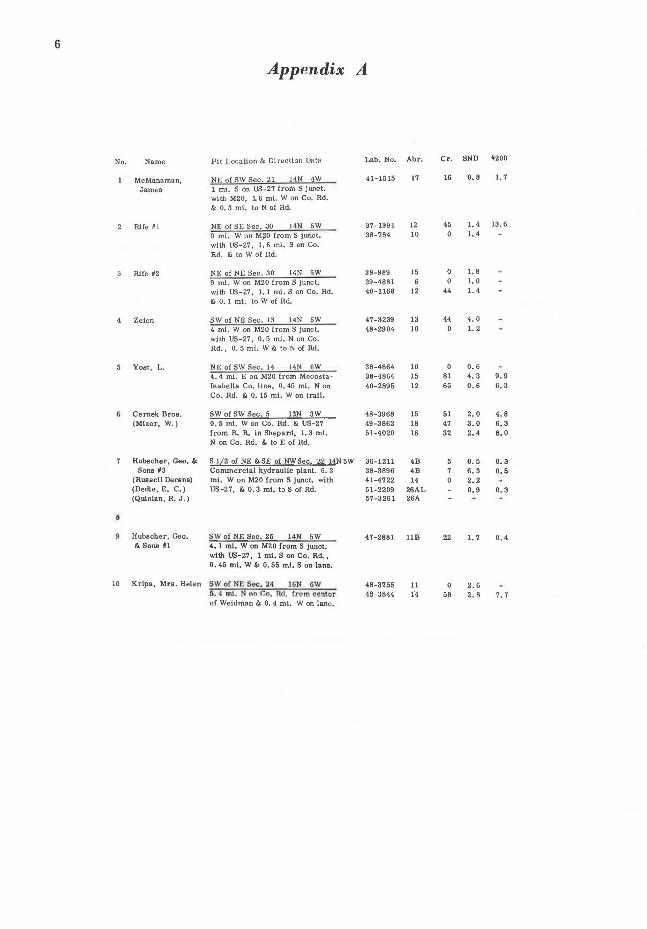
In detail, the pages of the gravel pit data are arranged according to the alphabetical order of the county names, of which there are 83 in Michigan. In each county group, the pits are arranged in numerical order in the first column of each page of inventory data together with the name by which it is identified. A typical gravel pit data sheet is shown as Appendix A. In cases where the ownership of a pit has changed, or where for some reason the name of the pit has been changed from that carried in previous editions, the current name is given first with the previous or alternate name below it. Each pit is located by number on the accompanying map of the county. A typical county map showing pit locations is shown as Appendix B.
Under the heading "Pit Location and Direction Data" is given the legal description of the location of the aggregate source , i.e. , the quarter-quarter-section, section number, townline, and range . The road mileage and direction from some established reference point to the aggregate source are also included under this heading. As relocations of trunklines are completed, the directions referring to those trunklines are revised and corrected in subsequent editions.
Under "Laboratory Test Number" the first two digits indicate the year in which the test was made and are followed by the test number assigned. The values in the column headed by "Abrasion Test Result" represent the percent of wear obtained on the sample

5
by Deval "D" abrasion test, AASHO method: T-4, unless otherwise designated. Deval A, B, C, or E abrasion tests are designated by the addition of the respective letter to the percent of wear figure. The addition of the letters AL, BL, CL, or DL to the percent of wear figure indicates that the material has been tested by the Los Angeles abrasion test method, AASHO method: T-96. In both the Deval and the Los Angeles abrasion test results the letters A, B, C, and D refer to the gradation of the sample tested, which usually depends on the intended use of the aggregate. In the column headed "Crushed" is given the percent of crushed aggregate particles in the Deval abrasion test sample. This is related to the percent of wear value obtained in the Deval abrasion test in that for each ten percent of crushed particles in the aggregate, an additional one percent of wear is allowed above the maximum specification allowance for uncrushed bank-run material. The Los Angeles abrasion test results are interpreted independent of the percentage of crushed particles in the aggregate; therefore, no figures are ordinarily given for crushed material in samples tested by the Los Angeles abrasion test method.
In the column headed "Soft and Non-Durable" the percent of soft and non-durable particles in the test sample is given. Under the heading "#200" is listed the quantity (in percent) of the fraction passing the number 200 mesh sieve in the test sample as determined by the AASHO method: T-27.
Throughout the Inventory a number of abbreviations are used in order to conserve space. To assure a clear interpretation of the data given, a list of all abbreviations used in the book with the translation as intended by the Office of Testing and Research is also made part of the publication.
The latest edition was printed in 1959 and contains information pertaining to more than 2, 500 aggregate sources throughout Michigan. The Departmental office copy of this edition contains up-to-date information regarding the old deposits, and the new deposits which have been opened up since the last printing. All of this will be incorporated in the next edition.
In conclusion, in order than any misunderstanding or misinterpretation of the data contained may be avoided the following statement is emphasized on the first page of each edition:
It must be thoroughly understood, however, that all test results given in this inventory are based on material already removed from the listed sources and do not guarantee in any way that sizeable amounts of the same material remain for future use. Neither should the test data be construed as always representing material remaining in the pit. Due to glacial action over Michigan's entire surface, it is generally found that natural gravel deposits vary considerably within small limits of area. It is imperative, therefore that this inventory be used only as a guide in conjunction with visual inspection of pits and not as a material survey report.
REFERENCE
1. Leverett, F., and Taylor, F., "The Pleistocene of Indiana and Michigan and the History of the Great Lakes." United States Geological Survey (1915).
6
Appendix A
No. Name Pit Locati on & Direction Data Lab. No. Abr. Cr. SND #200
McManaman, NE of SW Sec. 21 14N 4W 41-1515 17 16 o. 8 1. 7
James 1 mi . S on US-27 from S junct. with M20, l 6 mi. Won Co. Rd. & O. 3 mi. to N of Rd.
Ri fe #1 NE of SE Sec. 30 14N SW 37-1991 12 45 1. 4 13 . 6
9 mi . W on MjW from S junct. 38-784 10 0 1.4
with US-27, 1. 6 mi. S on Co. Rd . & to W of Rd.
Rife #2 NE of NE Sec. 30 14N SW 38-989 15 I. 8
9 mJ. W on M20 from S junct. 39-4881 6 I. 0
with US-27, I. I ml. S on Co. Rd. 40-1168 12 44 1.4 & O. 1 mi. lo W of Rd.
Zeten SW of NE Sec. 13 14N 5W 47-3239 13 44 4. 0 4 mi. W on M20 from S junct. 48·2904 10 I. 2 with US-27 1 O. 5 mi. N on Co . Rd. , o. 5 m i. W & to N of Rd.
Yost, L. NE of SW Sec . 14 14N 6W 38-4664 10 0 o. 6 4. 4 mi. E on M20 from Mecosta- 38-4864 15 81 4. 3 9.9 Isabella Co. line, 0. 45 ml. Non 40-2895 12 65 o. 6 6. 3 Co. Rd. & 0. 15 mi. W on trail.
Cernek Bros. SW of SW Sec . 5 13N aw 48-3968 15 51 2. 0 4. 8 (Ml•er, W.) O. 5 ml. W on Co. Rd . & US-27 49-3862 18 47 3. 0 6. 3
from R. R. in Shepard, l . 3 mi. 51-4020 16 32 2.4 8. 0 N on Co. Rd. & to E of Rd.
Hubecher, Geo. & S ll2 of NE & SE of NW Sec. 22 14N5W 36-1211 4B o. 5 0.3 Sons f3 Commercial hydraulic plant. 6. 3 38-3896 4B 6. 3 o. 5
(Russell Derena) ml. W on M20 from S Junct. with 41-4722 14 2. 2 (Dedie, E. C. ) US-27, & 0. 3 mi, to S of Rd. 51-2209 26AL 0.9 0. 3 (Quinlan, R. J . ) 57-3261 26A
Hubscher, Geo. SW of NE Sec. 25 14N 5W 47-2881 UB 22 1. 7 o. 4 & Sons #1 4. 1 mi. W on M20 from S junct.
with US-27, 1 ml, S on Co. Rd., O. 45 ml. W & O. 55 ml. S on lane,
10 Kripa, Mrs . Helen SW of NE Sec. 24 16N GW 48-3755 11 0 2. G 5. 4 ml. N o n C~ . lld. f l'l'rn oootc r 48-3844 f4 58 2 . 8 7. 7 of Weidman & O. 4 ml. W on lane,

7
Appendix B
A. B W. A, ~ W. R~ 4 \N, "· 3 w.
!SABELLA COUNTY