Embed Size (px)
Citation preview
National Park Service U.S. Department of the Interior Natural Resource Stewardship and Science
Inventory of Coastal Engineering Projects within
Assateague Island National Seashore
Natural Resource Report NPS/NRPC/GRD/NRR—2015/914

ON THE COVER
Ocean City Inlet jetty on the north end of Assateague Island, Maryland, on 12 May 2006.
Photograph by: Jane Thomas, IAN Image Library (www.ian.umces.edu/imagelibrary/)
Inventory of Coastal Engineering Projects within
Assateague Island National Seashore
Natural Resource Report NPS/NRPC/GRD/NRR—2015/914
Courtney A. Schupp
Assateague Island National Seashore
7206 National Seashore Lane
Berlin, MD 21811
Andrew Coburn
Program for the Study of Developed Shorelines
294 Belk
Western Carolina University
Cullowhee, NC 28723
February 2015
U.S. Department of the Interior
National Park Service
Natural Resource Stewardship and Science
Fort Collins, Colorado
ii
The National Park Service, Natural Resource Stewardship and Science office in Fort Collins,
Colorado, publishes a range of reports that address natural resource topics. These reports are of
interest and applicability to a broad audience in the National Park Service and others in natural
resource management, including scientists, conservation and environmental constituencies, and
the public.
The Natural Resource Report Series is used to disseminate comprehensive information and
analysis about natural resources and related topics concerning lands managed by the National
Park Service. The series supports the advancement of science, informed decision-making, and
the achievement of the National Park Service mission. The series also provides a forum for
presenting more lengthy results that may not be accepted by publications with page limitations.
All manuscripts in the series receive the appropriate level of peer review to ensure that the
information is scientifically credible, technically accurate, appropriately written for the intended
audience, and designed and published in a professional manner.
This report received informal peer review by subject-matter experts who were not directly
involved in the collection, analysis, or reporting of the data.
Views, statements, findings, conclusions, recommendations, and data in this report do not
necessarily reflect views and policies of the National Park Service, U.S. Department of the
Interior. Mention of trade names or commercial products does not constitute endorsement or
recommendation for use by the U.S. Government.
This report is available digital format from the Geologic Resources Division and the Natural
Resource Publications Management website (http://www.nature.nps.gov/publications/nrpm/).
The report and accompanying Geographic Information System (GIS) project can also be
accessed through the Integrated Resource Management Applications Portal website
(http://irma.nps.gov). To receive this report in a format optimized for screen readers, please
email [email protected].
Please cite this publication as:
Schupp, C., and A. Coburn. 2015. Inventory of coastal engineering projects within Assateague
Island National Seashore. Natural Resource Report NPS/NRPC/GRD/NRR—2015/914.
National Park Service, Fort Collins, Colorado.
NPS 622/127910, February 2015
iii
Contents
Page
Figures............................................................................................................................................. v
Tables ............................................................................................................................................. vi
Appendices ..................................................................................................................................... vi
Abstract ......................................................................................................................................... vii
Acknowledgments........................................................................................................................ viii
Introduction ..................................................................................................................................... 1
Maintenance of Natural Processes ........................................................................................... 2
Restoration of Natural Processes ............................................................................................. 2
Construction of Facilities ......................................................................................................... 2
Replacement of Facilities ........................................................................................................ 2
Cooperative Conservation ....................................................................................................... 3
Methods........................................................................................................................................... 4
Results ............................................................................................................................................. 5
Background ..................................................................................................................................... 7
Setting ...................................................................................................................................... 7
Ocean City Inlet Area ............................................................................................................ 10
North End ............................................................................................................................... 15
North End Restoration Project .......................................................................................... 15
Developed Zone ..................................................................................................................... 17
Estuarine Shoreline Modifications ........................................................................................ 18
Impacts .......................................................................................................................................... 21
Ocean City Inlet Stabilization ................................................................................................ 21
North End Renourishment and Restoration ........................................................................... 24
iv
Contents (continued)
Page
Dredging ................................................................................................................................ 27
Artificial Dunes ..................................................................................................................... 27
Estuarine Shoreline Armoring ............................................................................................... 28
Management Recommendations ................................................................................................... 29
Recommendations for Further Study ............................................................................................ 30
Literature Cited ............................................................................................................................. 31
v
Figures
Page
Figure 1. Percentage of total coastal structure length (by structure type) within
Assateague Island National Seashore ............................................................................................. 6
Figure 2. Map of Assateague Island National Seashore (NPS 2012). ............................................ 9
Figure 3. Locations of dredged areas, sediment bypass placement areas, and filled
(reclaimed) land.. .......................................................................................................................... 12
Figure 4. Locations of coastal engineering structures, beach nourishment events, and
dune construction .......................................................................................................................... 13
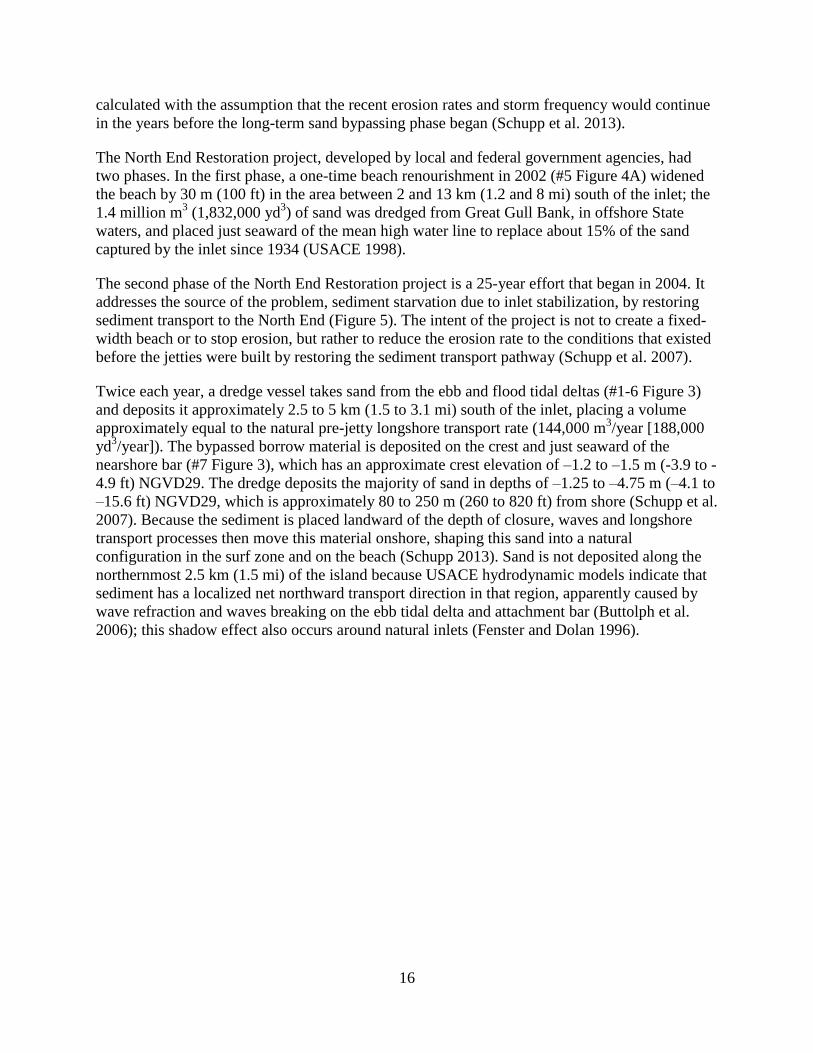
Figure 5. The North End Restoration project removes sediment from the Ocean City
Inlet channel and associated tidal deltas and places it along the barrier island. ........................... 17
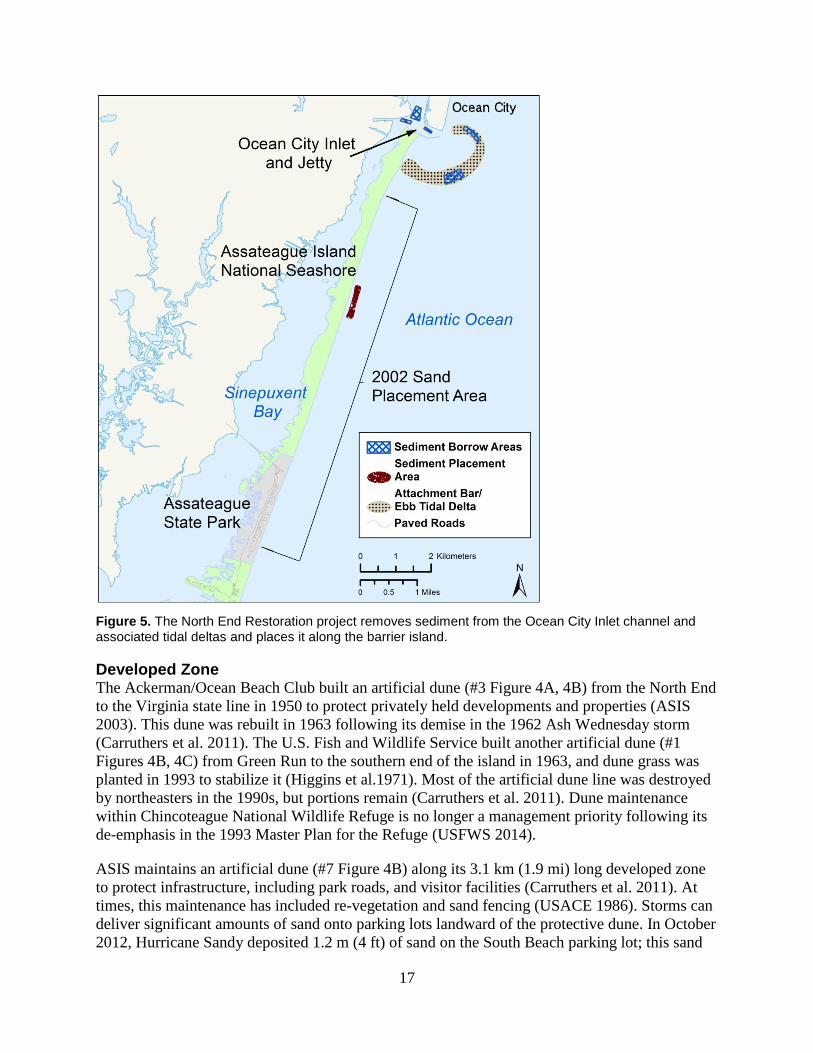
Figure 6. Proposed relocation of the South Beach parking lot in preparation for future
sea-level rise, storm events, and other climate change impacts .................................................... 19
Figure 7. The shoreline along Bayside Peninsula continues to erode........................................... 20
Figure 8. The boathouse and dock of the historic Assateague Coast Guard Station on
Toms Cove Spit, Virginia. Image from Phillips (2007)................................................................ 20
Figure 9. The ebb tidal delta of Ocean City Inlet curves to form an attachment bar that
meets the Assateague Island shoreline; the large bathymetric feature is delineated by
breaking waves.............................................................................................................................. 22
Figure 10. During the 80 years following inlet stabilization, the North End has
migrated westward due to shoreline erosion, overwash, and reduction of sediment
supply ............................................................................................................................................ 23
Figure 11. Two northeaster storms in 1998 caused sustained overwash that created a
large overwash fan and uncovered relict backbarrier peat along the shoreline and
within the island’s interior ............................................................................................................ 24
Figure 12. The constructed foredune was modified to restore overwash processes. .................... 26
Figure 13. Fencing posts and other materials (e.g., fencing wire) are often buried
through wind-transported sand, and later exposed by erosional events along the
beach. ............................................................................................................................................ 28
vi
Tables
Page
Table 1. Coastal structures in and adjacent to Assateague Island National Seashore. ................... 5
Appendices
Page
Appendix A. Glossary ................................................................................................................... 39
Appendix B. Coastal Structure Data ............................................................................................. 41
Appendix C. Beach Nourishment and Dune Construction Data................................................... 42
Appendix D. Dredge, Fill, and Bypassing Summary Data ........................................................... 43
vii
Abstract
This inventory and analysis of coastal engineering projects within or immediately adjacent to
Assateague Island National Seashore (ASIS)is a supplement to a Geographic Information
Systems (GIS) database available online at http://irma.nps.gov. It follows the methodology used
in an inventory of coastal engineering projects at ten national parks (Coburn et al. 2010). This
project was completed by the Program for the Study of Developed Shorelines at Western
Carolina University and Assateague Island National Seashore with funding provided by the
National Park Service Recreation Fee Program and the Geologic Resources Division.
Thirty-three coastal engineering projects, primarily coastal structures, dredge and fill projects,
and beach nourishment and dune construction projects, were identified within and adjacent to
ASIS. Four of the 12 coastal structures identified on the island are associated with the 350 m
(11,148 ft) wide Ocean City Inlet: two breakwaters that line 138 m (453 ft) of the Assateague
Island inlet shoreline, and two jetties that have a combined length of 1,338 m (44,390 ft). Seven
engineering structures are located along the estuarine shoreline of ASIS or within the estuary,
and another is likely buried within the body of the island. Artificial dunes were constructed along
the entire length of the island between 1950 and 1963.
At least 2,563,573 m3 (3,353,027 yd
3) of dredged sediment was brought to the North End
between 1962 and 2002 for beach renourishment and dune construction, and an additional
1,775,535 m3 (2, 322,312 yd
3) of sediment was placed in the shallow nearshore area between
2004 and mid-2013 (Schenck et al. in prep) as part of the ongoing North End Restoration project.
Ocean City Inlet and associated navigation channels are regularly dredged to maintain
navigation.
Coastal engineering projects have greatly altered the physical landscape and ecosystem in and
adjacent to ASIS. The Ocean City Inlet has reduced sediment delivery to the northern 13 km (8
mi) of Assateague Island since its stabilization by jetties in 1934, leading to an increased rate of
island migration, narrowing, and lowering. Artificial dunes have impeded natural barrier island
processes including overwash and inlet formation. Estuarine shoreline hardening has reduced
habitat quality and availability and affected sediment transport processes.
Management recommendations include the following:
Continue to engage in sediment management planning. Do not dredge areas of the ebb
tidal delta that lie south of the inlet, such as the attachment bar in the Assateague Island
nearshore area.
Future foredune modifications may be necessary to maintain or increase overwash
processes and piping plover habitat in the North End project area.
Along the estuarine shoreline, remove existing hard structures where feasible or augment
structures with living shorelines.
Continue to monitor shoreline change, and evaluate changes along the southern shoreline
with respect to the offshore dredging to renourish Wallops Island.
Infrastructure sustainability may be strengthened by relocating vulnerable infrastructure
that is damaged by storms or erosion, or by replacing damaged infrastructure with
moveable structures.
viii
Acknowledgments
Data development for this project was funded by the National Park Service Recreation Fee
Program’s Storm Vulnerability Project (PMIS 107946) via Task Agreement (J2360-06-4078) to
Western Carolina University. Kate Dallas of Oregon State University developed the standard
template and content needs for the NPS Coastal Engineering Inventory (CEI) report series during
her work on CEIs for other NPS units. ASIS employees Andrew Roach, Arty Rodriguez, and
Neil Winn developed and provided GIS data. Mark Borrelli (Center for Coastal Studies) and
Rebecca Beavers (NPS) provided project review and guidance.
Reviews from Tracy Monegan Rice (Terwilliger Consulting, Inc.), Charley Roman (NPS), Rob
Thieler (USGS), Jeff Williams (USGS) and Neil Winn (NPS) improved this report. Stephanie
O’Meara reviewed and improved the GIS datasets. Jason Kenworthy reviewed the report to
ensure compatibility with NRR formatting and 508 accessibility compliance requirements.

1
Introduction
The purpose of this report is to inventory, catalog and map coastal engineering projects and
impacts in and adjacent to Assateague Island National Seashore (ASIS). The Coastal
Engineering Inventory (CEI) project provides a qualitative impact analysis to help better
understand the extent of human-altered coastal areas and describes the impacts of coastal
engineering projects, their influence on natural sediment transport processes, and related
information pertaining to current park management concerns. The primary projects that were
inventoried include coastal structures, dredge and fill projects, and beach nourishment and dune
construction projects.
Coastal engineering projects are generally motivated by a desire to protect the backshore built
environment from erosion or alter the coastal zone for a particular purpose (i.e. maintain a
navigation channel, develop roadways, or restore wetlands). In order to fulfill project objectives,
a suite of engineering solutions are available that are typically categorized into hard and soft
engineering projects. Often both hard and soft engineering projects are used in conjunction with
one another, such as when beach nourishment is applied following breakwater construction.
Hard engineering solutions include the construction of seawalls, revetments, breakwaters, sills,
and bulkheads to protect the backshore from coastal erosion and sometimes flooding (see the
Glossary in Appendix A for definitions). Jetties and groins are also classified as hard engineering
projects and are used to alter the sediment transport regime. Impacts from hard structures are
highly site and time dependent, but may include the loss of sediment supplied to downdrift areas,
localized scour in front of and at the downdrift end of structures, visual impacts, placement
losses, reduction in beach access, and/or the alteration and reduction of habitat.
Soft engineering solutions include non-structural means of stabilizing the backshore or changing
coastal environments through beach nourishment, dune construction, dredging, or filling. These
methods add or redistribute sediment within the system and are used to fortify sediment-starved
beaches, maintain navigable waterways, protect coastal infrastructure, and restore wetlands. As
with hard solutions, impacts vary significantly by project, time scale, and location. Soft
engineering projects may impact hydrodynamic and sediment transport processes, beach
morphology, aquatic ecosystems, and/or beach and dune habitats.
The overall goal of the CEI project is to develop a greater understanding of the coastal
engineering modifications in the National Park System. Along coastlines expected to be
impacted by global climate change, structurally modified shorelines will likely respond
differently than natural coastlines, and may have a more dynamic response to coastal erosion
processes and sea-level rise. An inventory of coastal engineering modifications will provide
information to allow resource managers to make better-informed decisions about how to preserve
NPS resources, establish baselines, develop desired future conditions, and balance the protection
of historic resources and infrastructure with the preservation of natural systems. All of these
actions will improve the ability of the NPS to manage coastal park units in accordance with NPS
policies. The main NPS policies relevant to coastal engineering projects are summarized below;
see NPS Management Policies (NPS 2006) for more detail.
2
Maintenance of Natural Processes Generally, NPS policy requires that natural coastal processes in parks, such as erosion, accretion,
shoreline migration, deposition, overwash, and inlet formation be allowed to continue without
human interference (NPS Management Policies § 4.8.1.1 2006). The NPS may intervene in these
processes only in limited circumstances, such as when there is no other feasible way to protect
natural resources, park facilities, or historic properties, or to mitigate impacts of past human
alterations (NPS Management Policies § 4.8.1 2006).
Restoration of Natural Processes In parks where pre-existing or new activities or structures have altered and/or are currently
altering coastal dynamics, ecosystems, tidal regimes, and sediment transport rates, the NPS
policy is to investigate, in consultation with appropriate state and federal agencies, alternatives
for mitigating the effects of such projects and for restoring natural conditions (NPS Management
Policies § 4.8.1.1 2006). NPS restoration actions in human-disturbed areas seek to return the area
to the natural conditions and processes characteristic of the ecological zone in which the
damaged resources are situated, as called for by park management plans (NPS Management
Policies § 4.1.5 and § 4.4.2.4 2006). An example would be the restoration of alongshore
sediment transport processes.
Park landscapes disturbed by natural events, such as hurricanes, are allowed to recover naturally
unless manipulation is necessary to: 1) mitigate for excessive disturbance caused by past human
effects, 2) preserve cultural and historic resources as appropriate based on park planning
documents, or 3) protect park development or the safety of people. (NPS Management Policies §
4.1.5 and § 4.4.2.4 2006).
Construction of Facilities Generally, the NPS must avoid the construction of buildings, roads, and other development that
will cause unacceptable impacts on park resources and park values (NPS Management Policies §
9.1 2006). Development will not compete with or dominate park features or interfere with natural
processes (NPS Management Policies § 9.1.1.2 2006). In shoreline areas, this means that new
development will not be placed in areas subject to wave erosion or active shoreline processes
unless: 1) the development is required by law or 2) the development is essential to meet the
park’s purposes, as defined by its establishing act or proclamation, and
no practicable alternative locations are available
the development will be reasonably assured of surviving during its planned life span without
the need for shoreline control measures and
steps will be taken to minimize safety hazards and harm to property and natural resources
(NPS Management Policies § 4.8.1.1 2006).
Replacement of Facilities Park development that is damaged or destroyed by a hazardous or catastrophic natural event will
be thoroughly evaluated for relocation or replacement by new construction at a different location.
If a decision is made to relocate or replace a severely damaged or destroyed facility, it will be
placed, if practicable, in an area that is believed to be at low vulnerability to natural hazards
(NPS Management Policies § 9.1.1.5 and § 4.1.5 2006).
3
Cooperative Conservation Under NPS policy, park superintendents are required to monitor state government programs for
managing state-owned submerged lands and resources within NPS units. When there is potential
for such programs to adversely impact park resources or values, superintendents will make their
concerns known to appropriate state government officials and encourage compatible land uses
that avoid or mitigate potential adverse impacts. When federal acquisition of state-owned
submerged lands and resources within NPS units is not feasible, NPS will seek to enter into
cooperative agreements with state governments to ensure the adequate protection of park
resources and park values (NPS Management Policies §3.4 2006).
In addition, the NPS has the authority under 36 C.F.R. §1.2(a)(3) to apply general NPS
regulations, such as special use permit requirements, on or in waters that are subject to the
jurisdiction of the United States, or in areas within their ordinary reach up to the mean or
ordinary high water line, even if the submerged lands are non-federally-owned and regardless of
whether the park has exclusive, concurrent, or proprietary jurisdiction. (Waters subject to the
jurisdiction of the United States refers to three types of waters: (1) navigable (as defined in 33
C.F.R. § 2.36(a), (2) non-navigable but located on lands for which the U.S. has acquired title or
control and has accepted or retained exclusive or concurrent jurisdiction, and (3) waters made
subject to U.S. jurisdiction by certain international agreements and statutes (33 C.F.R. § 2.38).)
4
Methods
Coastal engineering terminology (Appendix A) was adapted from the Coastal Engineering
Manual (USACE 2003) and amended based on the definitions provided by the NPS Coastal
Engineering Inventory pilot project (Coburn et al. 2010), living shorelines descriptions from
Bilcovic and Mitchell (2014), and through discussion with the NPS Geologic Resources
Division. Projects in the inventory include coastal structures, dredging, filling, beach
nourishment, and dune construction.
A digital park jurisdictional boundary shapefile was downloaded from the NPS Integrated
Resources Management Applications Portal (ASIS 2006). Georeferenced digital orthophoto
imagery from 19661, 1986
2, 2003
3, and 2009
4 was added to ArcMap 10.0. A visual inspection of
the orthophoto imagery was completed and locations of all discernible coastal structures were
digitized using ArcMap or obtained from the park’s GIS data. There was no field component to
this project, but ASIS staff confirmed initial findings and identified additional coastal
engineering projects. A comprehensive online and hardcopy literature search was undertaken to
obtain attribute data for each project (year of construction, material, year of maintenance, cost,
lead construction agency, and volume).
A coastal engineering project was considered distinct if there was no discernable, physical
separation between it and an adjacent engineering project. A series of breakwaters, for example,
would be classified as one structure. Some projects, such as dredge projects that place dredge
spoil on the beach, serve multiple purposes (i.e., dredging and beach nourishment). In these
cases, the primary reason for the project was ascertained and the project was classified
accordingly. Projects that occurred repeatedly in one location (e.g. dredging an inlet) were
counted as one project. Structure length and shoreline length were determined using ArcMap.
An ArcGIS 10.0 file geodatabase for ASIS was compiled using ArcMap. The geodatabase
contains a feature dataset that includes a park boundary feature class and identifies coastal
engineering projects separated into three feature classes: 1) coastal structures; 2) dredge, fill, and
bypass projects; and 3) beach nourishment and dune construction projects. The GIS project also
contains an ArcMap 10.0 document for data viewing (.mxd), data layer files (.lyr), FGDC-
compliant metadata (.xml and.txt), FAQ metadata (.html), a table attribute file (.pdf), and a
README file (.pdf). The geodatabase, feature classes, and ArcMap document each include
metadata viewable in ArcCatalog using the ‘Description’ tab. Location information for dredge,
fill, beach nourishment, and dune construction projects was often vague or unpublished.
Therefore, not all of these projects are included in the GIS data, and some of those that are
included have only approximate locations.
1 USACE imagery from September 1966, black and white, at 1:6000 scale, available from ASIS.
2 USACE imagery from 1986.
3 ASIS imagery from October 2003, true color, at 0.25 m resolution, available from ASIS.
https://irma.nps.gov/App/Reference/Profile/1043112 4 NOAA imagery from November 2009, true color, at 0.5 m resolution, obtained from NOAA.
http://ngs.woc.noaa.gov/nov09_ne/
5
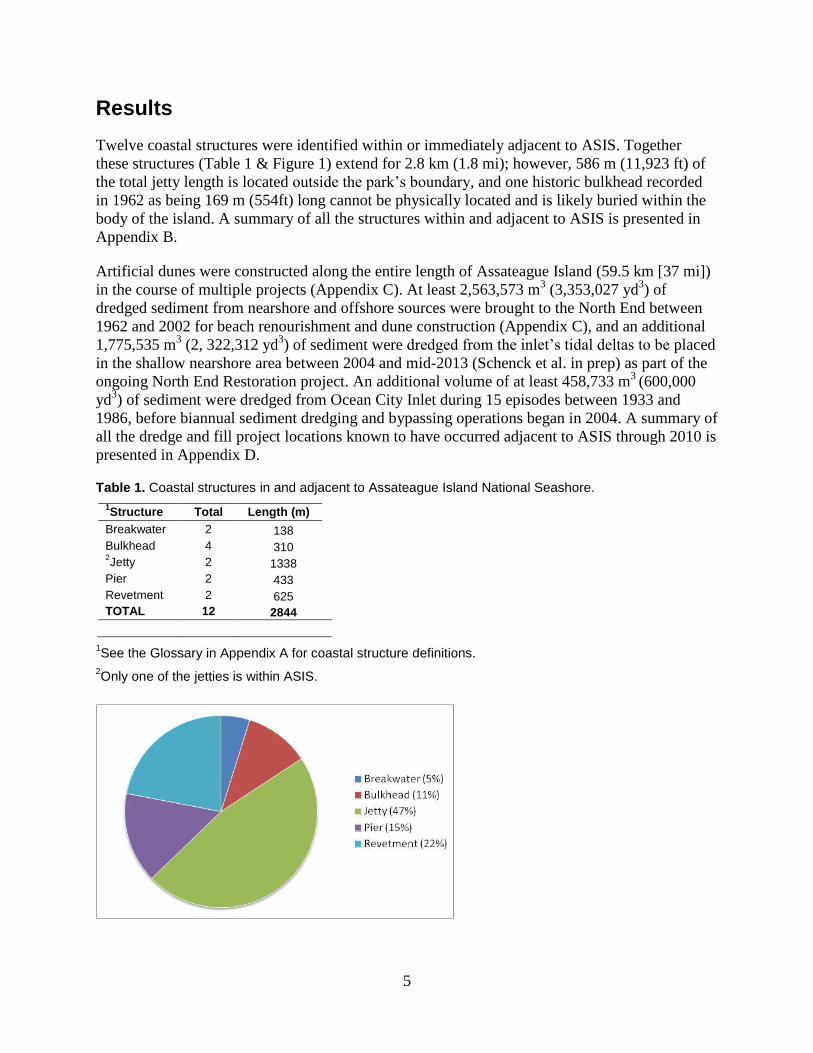
Results
Twelve coastal structures were identified within or immediately adjacent to ASIS. Together
these structures (Table 1 & Figure 1) extend for 2.8 km (1.8 mi); however, 586 m (11,923 ft) of
the total jetty length is located outside the park’s boundary, and one historic bulkhead recorded
in 1962 as being 169 m (554ft) long cannot be physically located and is likely buried within the
body of the island. A summary of all the structures within and adjacent to ASIS is presented in
Appendix B.
Artificial dunes were constructed along the entire length of Assateague Island (59.5 km [37 mi])
in the course of multiple projects (Appendix C). At least 2,563,573 m3 (3,353,027 yd
3) of
dredged sediment from nearshore and offshore sources were brought to the North End between
1962 and 2002 for beach renourishment and dune construction (Appendix C), and an additional
1,775,535 m3 (2, 322,312 yd
3) of sediment were dredged from the inlet’s tidal deltas to be placed
in the shallow nearshore area between 2004 and mid-2013 (Schenck et al. in prep) as part of the
ongoing North End Restoration project. An additional volume of at least 458,733 m3
(600,000
yd3) of sediment were dredged from Ocean City Inlet during 15 episodes between 1933 and
1986, before biannual sediment dredging and bypassing operations began in 2004. A summary of
all the dredge and fill project locations known to have occurred adjacent to ASIS through 2010 is
presented in Appendix D.
Table 1. Coastal structures in and adjacent to Assateague Island National Seashore.
1Structure Total Length (m)
Breakwater 2 138
Bulkhead 4 310 2Jetty 2 1338
Pier 2 433
Revetment 2 625
TOTAL 12 2844
1See the Glossary in Appendix A for coastal structure definitions.
2Only one of the jetties is within ASIS.

6
Figure 1. Percentage of total coastal structure length (by structure type) within Assateague Island National Seashore (ASIS) (includes 586 m [1,923 ft] of the Ocean City Inlet jetty that is outside of ASIS).
7
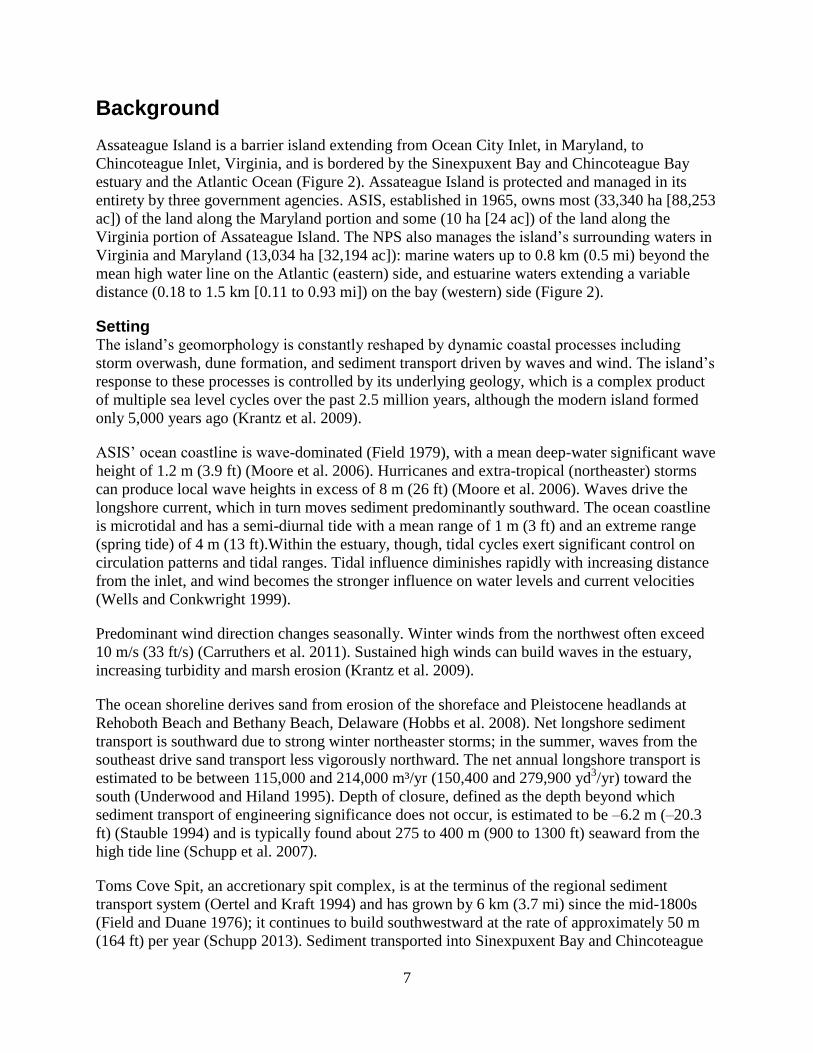
Background
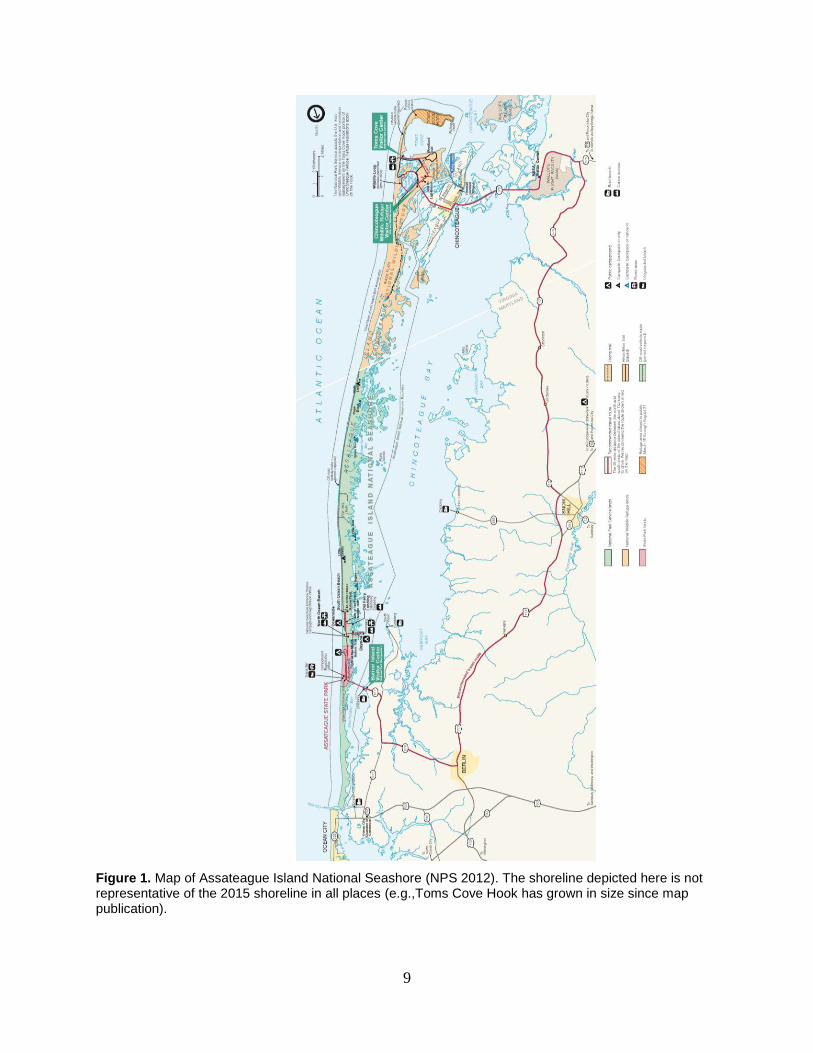
Assateague Island is a barrier island extending from Ocean City Inlet, in Maryland, to
Chincoteague Inlet, Virginia, and is bordered by the Sinexpuxent Bay and Chincoteague Bay
estuary and the Atlantic Ocean (Figure 2). Assateague Island is protected and managed in its
entirety by three government agencies. ASIS, established in 1965, owns most (33,340 ha [88,253
ac]) of the land along the Maryland portion and some (10 ha [24 ac]) of the land along the
Virginia portion of Assateague Island. The NPS also manages the island’s surrounding waters in
Virginia and Maryland (13,034 ha [32,194 ac]): marine waters up to 0.8 km (0.5 mi) beyond the
mean high water line on the Atlantic (eastern) side, and estuarine waters extending a variable
distance (0.18 to 1.5 km [0.11 to 0.93 mi]) on the bay (western) side (Figure 2).
Setting The island’s geomorphology is constantly reshaped by dynamic coastal processes including
storm overwash, dune formation, and sediment transport driven by waves and wind. The island’s
response to these processes is controlled by its underlying geology, which is a complex product
of multiple sea level cycles over the past 2.5 million years, although the modern island formed
only 5,000 years ago (Krantz et al. 2009).
ASIS’ ocean coastline is wave-dominated (Field 1979), with a mean deep-water significant wave
height of 1.2 m (3.9 ft) (Moore et al. 2006). Hurricanes and extra-tropical (northeaster) storms
can produce local wave heights in excess of 8 m (26 ft) (Moore et al. 2006). Waves drive the
longshore current, which in turn moves sediment predominantly southward. The ocean coastline
is microtidal and has a semi-diurnal tide with a mean range of 1 m (3 ft) and an extreme range
(spring tide) of 4 m (13 ft).Within the estuary, though, tidal cycles exert significant control on
circulation patterns and tidal ranges. Tidal influence diminishes rapidly with increasing distance
from the inlet, and wind becomes the stronger influence on water levels and current velocities
(Wells and Conkwright 1999).
Predominant wind direction changes seasonally. Winter winds from the northwest often exceed
10 m/s (33 ft/s) (Carruthers et al. 2011). Sustained high winds can build waves in the estuary,
increasing turbidity and marsh erosion (Krantz et al. 2009).
The ocean shoreline derives sand from erosion of the shoreface and Pleistocene headlands at
Rehoboth Beach and Bethany Beach, Delaware (Hobbs et al. 2008). Net longshore sediment
transport is southward due to strong winter northeaster storms; in the summer, waves from the
southeast drive sand transport less vigorously northward. The net annual longshore transport is
estimated to be between 115,000 and 214,000 m³/yr (150,400 and 279,900 yd3/yr) toward the
south (Underwood and Hiland 1995). Depth of closure, defined as the depth beyond which
sediment transport of engineering significance does not occur, is estimated to be –6.2 m (–20.3
ft) (Stauble 1994) and is typically found about 275 to 400 m (900 to 1300 ft) seaward from the
high tide line (Schupp et al. 2007).
Toms Cove Spit, an accretionary spit complex, is at the terminus of the regional sediment
transport system (Oertel and Kraft 1994) and has grown by 6 km (3.7 mi) since the mid-1800s
(Field and Duane 1976); it continues to build southwestward at the rate of approximately 50 m
(164 ft) per year (Schupp 2013). Sediment transported into Sinexpuxent Bay and Chincoteague
8
Bay comes from several sources: suspended sediments transported by streams, sediment carried
through the inlet, erosion of the mainland shoreline, overwash across the island, and windblown
sand from the island (Krantz et al. 2009).
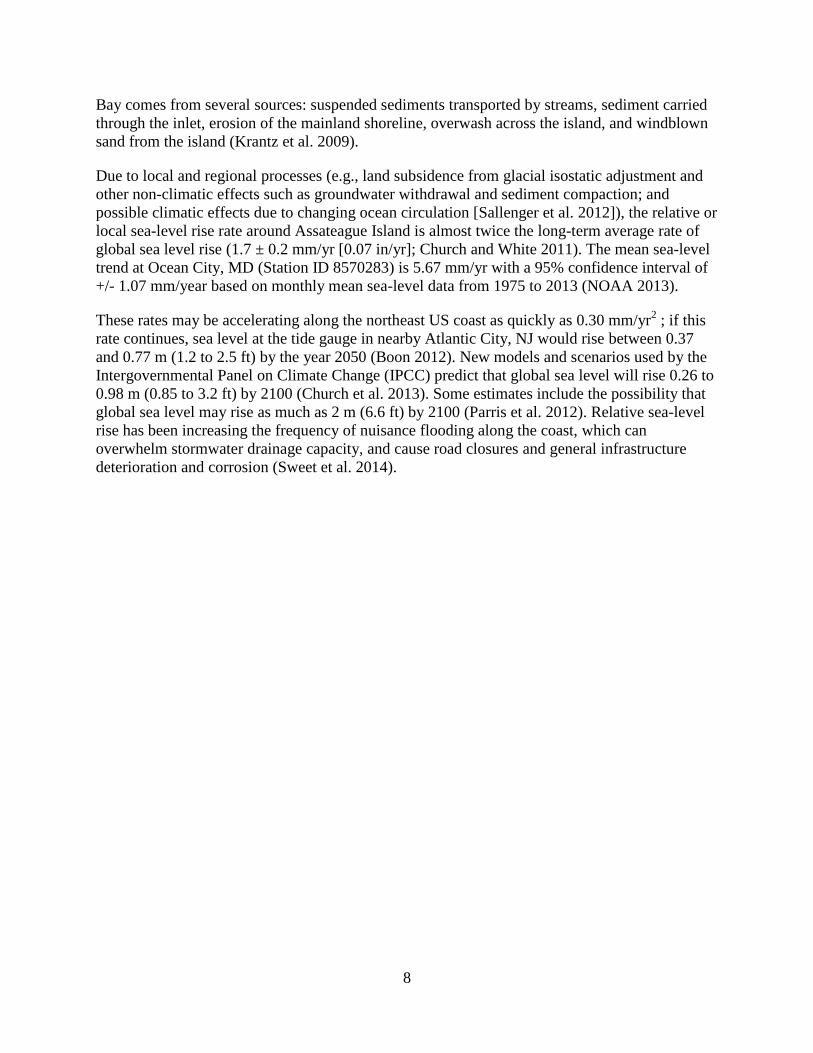
Due to local and regional processes (e.g., land subsidence from glacial isostatic adjustment and
other non-climatic effects such as groundwater withdrawal and sediment compaction; and
possible climatic effects due to changing ocean circulation [Sallenger et al. 2012]), the relative or
local sea-level rise rate around Assateague Island is almost twice the long-term average rate of
global sea level rise (1.7 ± 0.2 mm/yr [0.07 in/yr]; Church and White 2011). The mean sea-level
trend at Ocean City, MD (Station ID 8570283) is 5.67 mm/yr with a 95% confidence interval of
+/- 1.07 mm/year based on monthly mean sea-level data from 1975 to 2013 (NOAA 2013).
These rates may be accelerating along the northeast US coast as quickly as 0.30 mm/yr2 ; if this
rate continues, sea level at the tide gauge in nearby Atlantic City, NJ would rise between 0.37
and 0.77 m (1.2 to 2.5 ft) by the year 2050 (Boon 2012). New models and scenarios used by the
Intergovernmental Panel on Climate Change (IPCC) predict that global sea level will rise 0.26 to
0.98 m (0.85 to 3.2 ft) by 2100 (Church et al. 2013). Some estimates include the possibility that
global sea level may rise as much as 2 m (6.6 ft) by 2100 (Parris et al. 2012). Relative sea-level
rise has been increasing the frequency of nuisance flooding along the coast, which can
overwhelm stormwater drainage capacity, and cause road closures and general infrastructure
deterioration and corrosion (Sweet et al. 2014).
9
Figure 1. Map of Assateague Island National Seashore (NPS 2012). The shoreline depicted here is not representative of the 2015 shoreline in all places (e.g.,Toms Cove Hook has grown in size since map publication).
10
Ocean City Inlet Area The Ocean City Inlet was opened during a hurricane on August 25, 1933. Congress had
previously authorized construction of an inlet approximately 8 km (5 miles) south of this
location; the state had funded this project and was awaiting federal funding when the hurricane
occurred, so stabilization of the new natural inlet was authorized as a substitute (Morgan 2011 as
cited in Rice 2014). An inlet in this location had been long-awaited; an artificial inlet was cut
shortly before World War I near Ocean City, but it did not remain open long (Morgan 2011 as
cited in Rice 2014).
In 1934, the U.S. Army Corps of Engineers built and maintained jetties to stabilize the new
Ocean City Inlet, and continues to maintain channel depth through dredging the inlet, the
associated ebb and flood tidal deltas, and associated channels. These features have also provided
sediment for multiple projects including dune building, beach renourishment, and breach repair
for Assateague Island and Ocean City.
As of 2012, USACE maintains the Ocean City Inlet channel (#9 Figure 3) at 3 m (10 ft) deep and
61 m (200 ft) wide from the Atlantic Ocean through the inlet to the Isle of Wight Bay channel
(#11 Figure 3), which is 1.8 m (6 ft) deep and 38 m (125 ft) wide and extends from the inlet
northward to a point opposite North Eighth Street in Ocean City, then 23 m (75 ft) wide into the
Isle of Wight Bay (USACE 2012). The Sinepuxent Bay channel (#10 Figure 3), which extends
southward from the inlet, is maintained at 1.8 m (6 ft) deep and 46 m (150 ft) wide from the inlet
to Green Point, and from there 30 m (100 ft) wide in Chincoteague Bay (USACE 2012). An
additional channel extends from the inlet to the Ocean City Harbor and is 46 m (150 ft) wide and
3 m (10 ft) deep, with widths of 30 to 46 m (100 to 150 ft) to the head of the harbor with two
turning basins of the same depth (USACE 2012).
The north jetty (#1 Figure 4A), built at the southern end of Fenwick Island (Ocean City), was
constructed in 1934 to an elevation of 0.82 m (2.7 ft) NGVD295, or 1.2 m (4.0 ft) above mean
low water (MLW). After filling with sand within three years, the jetty was soon raised to an
elevation of 3.26 m (10.7 ft) NGVD29 for the landward 30 m (100 ft), 2.3 m (7.7 ft) NGVD29
for the next 77 m (254 ft), and 1.7 m (5.7 ft) NGVD29 for the remainder of the concrete
structure. In 1956, the jetty was rehabilitated and this seaward most portion was raised to 2.3 m
(7.7 ft) NGVD29 (USACE 1986).
The south jetty (#2 Figure 4A), built at the northern end of Assateague Island, was constructed in
1935 to an elevation of 1.4 m (4.7 ft) NGVD29. The landward section paralleled the north jetty
for 229 m (750 ft), and then angled northward, narrowing the inlet from 335 m (1100 ft) to 183
m (600 ft). The third, seaward section was 162 m (530 ft) long and built parallel to the north
jetty; this section was built 1.4 m (4.7 ft) NGVD29 high along the first 52 m (170 ft), then sloped
downward for the next 49 m (160 ft) to meet the lowest section, which rose 1.2 m (4 ft) above
the seafloor and extended the final 61 m (200 ft) into the water (USACE 1986). Minor repairs
5 ASIS currently references NAVD88 as the standard vertical datum while the USACE and historical documents
reference NGVD29. For comparison, the following equivalents are provided. At ASIS locations, adding -0.25 m to
the NGVD29 elevation will provide the NAVD88 elevation (that is, NAVD88 – NGVD29 = -0.25 m). To calculate
the elevation relative to Mean Low Water, add 0.38 m to the NGVD29 elevation (that is, MLW – NGVD29 = 0.38
m).
11
were made in 1937-1938. Major repairs, including the placement of 767 metric tons (845 short
tons) of stone, were necessary in 1956 due to accelerated erosion of Assateague Island that
resulted in a flanking of the inshore end of the jetty. Another flanking had occurred by 1961 due
to continued erosion, and the Ash Wednesday storm in March 1962 necessitated immediate
rehabilitation. In 1963, a 720 m (2362 ft) section was repaired, and the landward section of the
jetty was extended farther landward for an additional 207 m (680 ft) (USACE 1986). As of 2012,
the south jetty had a top elevation of 2.3 m (7.6 ft) NGVD29 and a top crest of 5.1 m (16.7 ft)
NGVD29, and the north jetty had a top elevation of 2.4 m (7.7 ft) NGVD29 and a top crest of 5.7
m (18.7 ft) NGVD29 (USACE 2012).
Ocean City Inlet experienced frequent shoaling between 1933 and 1986, likely due to an area of
northward sediment transport on the northern end of Assateague Island that carried sediment
through and over the low-elevation and highly permeable south jetty. During this time, the inlet
was dredged 15 times (a total of 458,733 m3 [600,000 yd
3]). To reduce the shoaling, a new jetty
section was built 9 m (30 ft) southward of the existing south jetty; the new section had an
elevation of 2.3 m (7.5 ft) NGVD29 and a crest width of 4.9-5.5 m (16-18 ft), and its layers of
stone, capstone, and concrete made its core impermeable to sand transport (USACE 1986).
The jetty rehabilitation reduced southward sediment transport to the north end of Assateague
Island, resulting in accelerated erosion, increased risk of flanking of the landward end of the
south jetty, and continued shoaling in the navigation channel as erosion progressed. To stabilize
the shoreline area, three headland breakwater sections (#4 and #5 Figure 4A) were constructed to
a height of 1.8 m (6.0 ft) NGVD29 and a crest width of 3.7 m (12 ft) (USACE 1986). The
protected sections of shoreline have accreted, and as of January 2015 the area between the
middle breakwater and the island is usually filled with subaerial sand, but the westernmost
(bayside) breakwater is detached from the island (Neil Winn, ASIS GIS Specialist, personal
communication, 22 January 2015). The easternmost breakwater essentially has been incorporated
into the jetty wall and so is not identified as a separate structure in the maps and GIS records.
An additional 1,522,195 m3 (1,990,956 yd
3) of sediment were dredged from the inlet and the
associated tidal deltas to be placed in the shallow nearshore area between 2004 and 2010 as part
of the ongoing North End Restoration project, described in more detail below. Multiple projects,
including filling in low-lying areas on Fenwick Island for development, have also removed
sediment from Isle of Wight Bay and Assawoman Bay, and numerous dredge holes are still
visible (Wells and Conkwright 1999). Larger sand needs, such as large-scale Ocean City beach
replenishment and the artificial foredune construction, have usually been met by dredging shoals
that are farther offshore but within the state’s 3-mile (4.8 km) limit (e.g., Great Gull Banks), not
in federal waters (Schupp 2013).
12
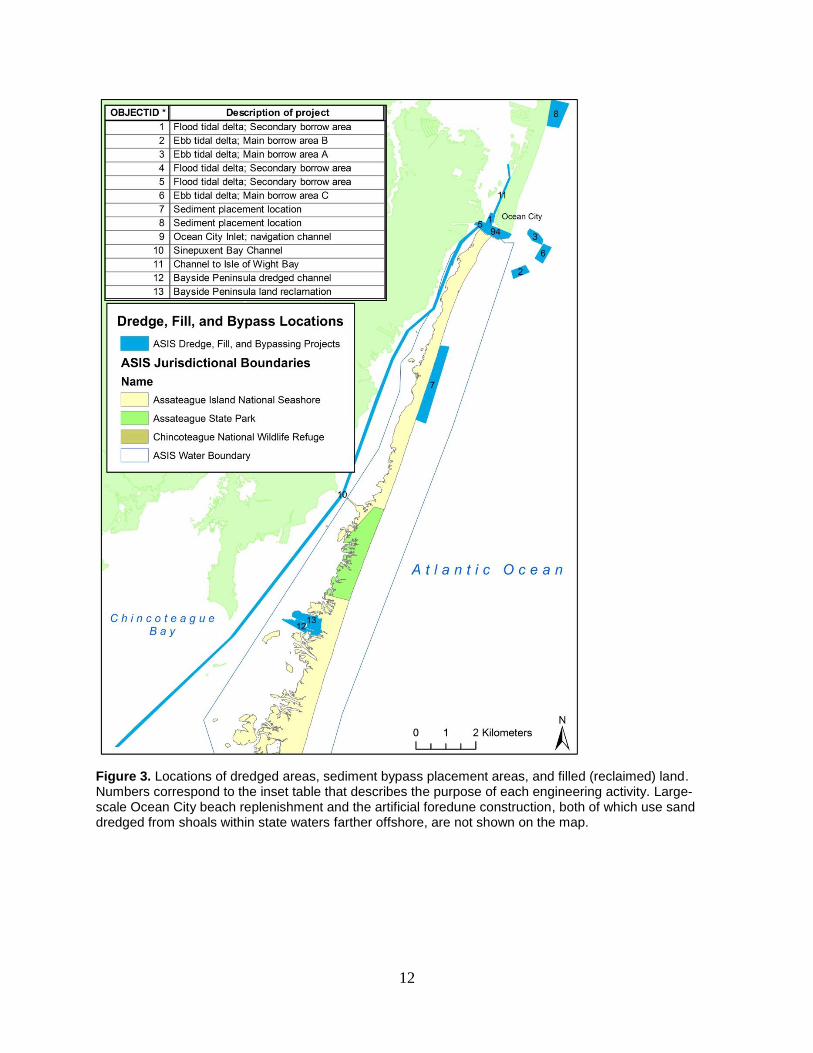
Figure 3. Locations of dredged areas, sediment bypass placement areas, and filled (reclaimed) land. Numbers correspond to the inset table that describes the purpose of each engineering activity. Large-scale Ocean City beach replenishment and the artificial foredune construction, both of which use sand dredged from shoals within state waters farther offshore, are not shown on the map.
13
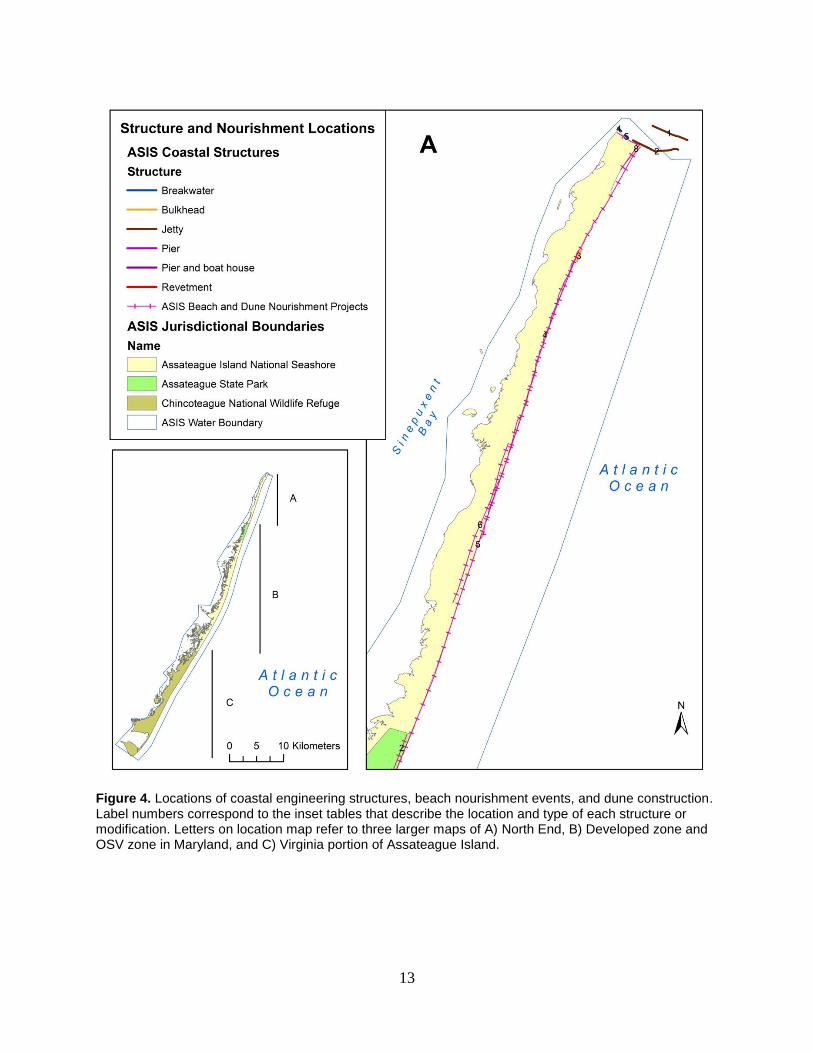
Figure 4. Locations of coastal engineering structures, beach nourishment events, and dune construction. Label numbers correspond to the inset tables that describe the location and type of each structure or modification. Letters on location map refer to three larger maps of A) North End, B) Developed zone and OSV zone in Maryland, and C) Virginia portion of Assateague Island.
14
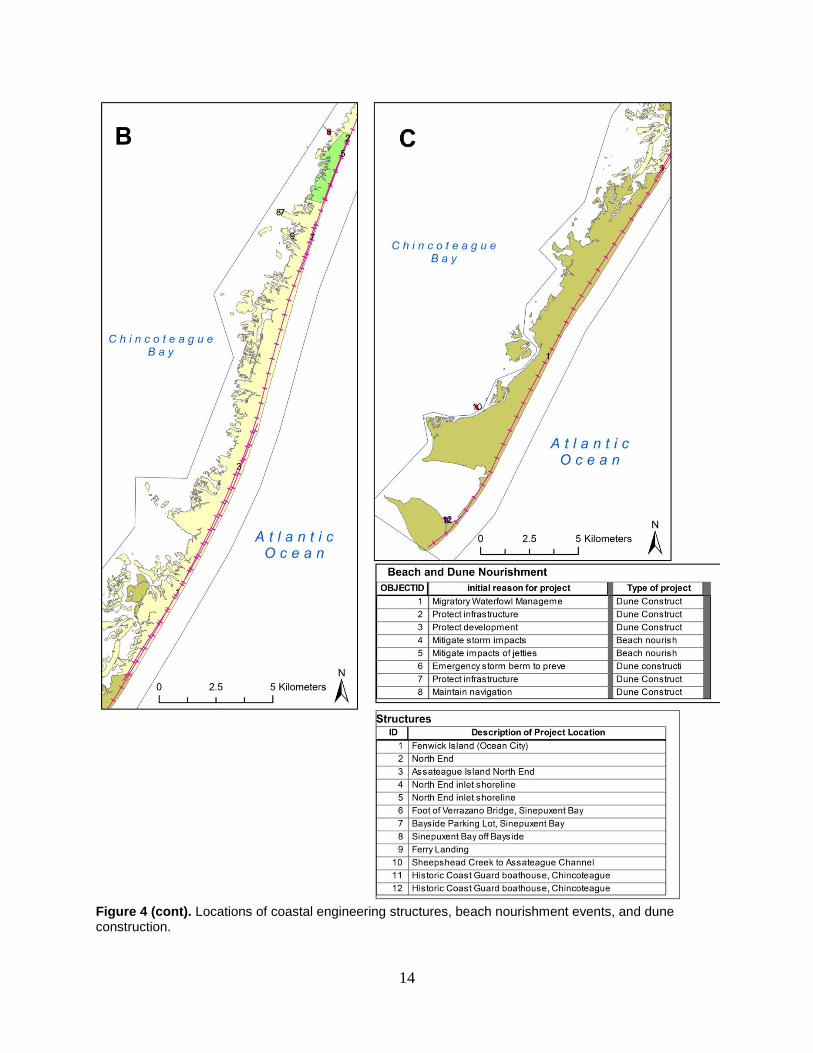
Figure 4 (cont). Locations of coastal engineering structures, beach nourishment events, and dune construction.
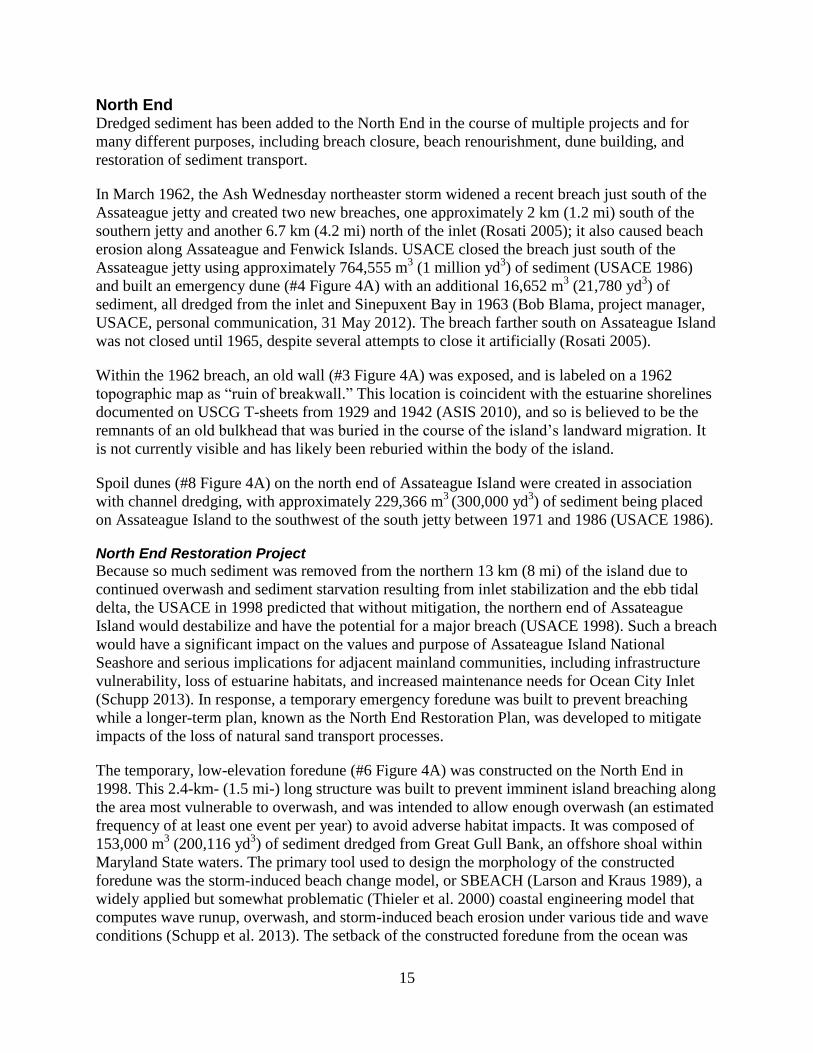
15
North End Dredged sediment has been added to the North End in the course of multiple projects and for
many different purposes, including breach closure, beach renourishment, dune building, and
restoration of sediment transport.
In March 1962, the Ash Wednesday northeaster storm widened a recent breach just south of the
Assateague jetty and created two new breaches, one approximately 2 km (1.2 mi) south of the
southern jetty and another 6.7 km (4.2 mi) north of the inlet (Rosati 2005); it also caused beach
erosion along Assateague and Fenwick Islands. USACE closed the breach just south of the
Assateague jetty using approximately 764,555 m3 (1 million yd
3) of sediment (USACE 1986)
and built an emergency dune (#4 Figure 4A) with an additional 16,652 m3 (21,780 yd
3) of
sediment, all dredged from the inlet and Sinepuxent Bay in 1963 (Bob Blama, project manager,
USACE, personal communication, 31 May 2012). The breach farther south on Assateague Island
was not closed until 1965, despite several attempts to close it artificially (Rosati 2005).
Within the 1962 breach, an old wall (#3 Figure 4A) was exposed, and is labeled on a 1962
topographic map as “ruin of breakwall.” This location is coincident with the estuarine shorelines
documented on USCG T-sheets from 1929 and 1942 (ASIS 2010), and so is believed to be the
remnants of an old bulkhead that was buried in the course of the island’s landward migration. It
is not currently visible and has likely been reburied within the body of the island.
Spoil dunes (#8 Figure 4A) on the north end of Assateague Island were created in association
with channel dredging, with approximately 229,366 m3
(300,000 yd3) of sediment being placed
on Assateague Island to the southwest of the south jetty between 1971 and 1986 (USACE 1986).
North End Restoration Project
Because so much sediment was removed from the northern 13 km (8 mi) of the island due to
continued overwash and sediment starvation resulting from inlet stabilization and the ebb tidal
delta, the USACE in 1998 predicted that without mitigation, the northern end of Assateague
Island would destabilize and have the potential for a major breach (USACE 1998). Such a breach
would have a significant impact on the values and purpose of Assateague Island National
Seashore and serious implications for adjacent mainland communities, including infrastructure
vulnerability, loss of estuarine habitats, and increased maintenance needs for Ocean City Inlet
(Schupp 2013). In response, a temporary emergency foredune was built to prevent breaching
while a longer-term plan, known as the North End Restoration Plan, was developed to mitigate
impacts of the loss of natural sand transport processes.
The temporary, low-elevation foredune (#6 Figure 4A) was constructed on the North End in
1998. This 2.4-km- (1.5 mi-) long structure was built to prevent imminent island breaching along
the area most vulnerable to overwash, and was intended to allow enough overwash (an estimated
frequency of at least one event per year) to avoid adverse habitat impacts. It was composed of
153,000 m3 (200,116 yd
3) of sediment dredged from Great Gull Bank, an offshore shoal within
Maryland State waters. The primary tool used to design the morphology of the constructed
foredune was the storm-induced beach change model, or SBEACH (Larson and Kraus 1989), a
widely applied but somewhat problematic (Thieler et al. 2000) coastal engineering model that
computes wave runup, overwash, and storm-induced beach erosion under various tide and wave
conditions (Schupp et al. 2013). The setback of the constructed foredune from the ocean was
16
calculated with the assumption that the recent erosion rates and storm frequency would continue
in the years before the long-term sand bypassing phase began (Schupp et al. 2013).
The North End Restoration project, developed by local and federal government agencies, had
two phases. In the first phase, a one-time beach renourishment in 2002 (#5 Figure 4A) widened
the beach by 30 m (100 ft) in the area between 2 and 13 km (1.2 and 8 mi) south of the inlet; the
1.4 million m3 (1,832,000 yd
3) of sand was dredged from Great Gull Bank, in offshore State
waters, and placed just seaward of the mean high water line to replace about 15% of the sand
captured by the inlet since 1934 (USACE 1998).
The second phase of the North End Restoration project is a 25-year effort that began in 2004. It
addresses the source of the problem, sediment starvation due to inlet stabilization, by restoring
sediment transport to the North End (Figure 5). The intent of the project is not to create a fixed-
width beach or to stop erosion, but rather to reduce the erosion rate to the conditions that existed
before the jetties were built by restoring the sediment transport pathway (Schupp et al. 2007).
Twice each year, a dredge vessel takes sand from the ebb and flood tidal deltas (#1-6 Figure 3)
and deposits it approximately 2.5 to 5 km (1.5 to 3.1 mi) south of the inlet, placing a volume
approximately equal to the natural pre-jetty longshore transport rate (144,000 m3/year [188,000
yd3/year]). The bypassed borrow material is deposited on the crest and just seaward of the
nearshore bar (#7 Figure 3), which has an approximate crest elevation of –1.2 to –1.5 m (-3.9 to -
4.9 ft) NGVD29. The dredge deposits the majority of sand in depths of –1.25 to –4.75 m (–4.1 to
–15.6 ft) NGVD29, which is approximately 80 to 250 m (260 to 820 ft) from shore (Schupp et al.
2007). Because the sediment is placed landward of the depth of closure, waves and longshore
transport processes then move this material onshore, shaping this sand into a natural
configuration in the surf zone and on the beach (Schupp 2013). Sand is not deposited along the
northernmost 2.5 km (1.5 mi) of the island because USACE hydrodynamic models indicate that
sediment has a localized net northward transport direction in that region, apparently caused by
wave refraction and waves breaking on the ebb tidal delta and attachment bar (Buttolph et al.
2006); this shadow effect also occurs around natural inlets (Fenster and Dolan 1996).
17
Figure 5. The North End Restoration project removes sediment from the Ocean City Inlet channel and associated tidal deltas and places it along the barrier island.
Developed Zone The Ackerman/Ocean Beach Club built an artificial dune (#3 Figure 4A, 4B) from the North End
to the Virginia state line in 1950 to protect privately held developments and properties (ASIS
2003). This dune was rebuilt in 1963 following its demise in the 1962 Ash Wednesday storm
(Carruthers et al. 2011). The U.S. Fish and Wildlife Service built another artificial dune (#1
Figures 4B, 4C) from Green Run to the southern end of the island in 1963, and dune grass was
planted in 1993 to stabilize it (Higgins et al.1971). Most of the artificial dune line was destroyed
by northeasters in the 1990s, but portions remain (Carruthers et al. 2011). Dune maintenance
within Chincoteague National Wildlife Refuge is no longer a management priority following its
de-emphasis in the 1993 Master Plan for the Refuge (USFWS 2014).
ASIS maintains an artificial dune (#7 Figure 4B) along its 3.1 km (1.9 mi) long developed zone
to protect infrastructure, including park roads, and visitor facilities (Carruthers et al. 2011). At
times, this maintenance has included re-vegetation and sand fencing (USACE 1986). Storms can
deliver significant amounts of sand onto parking lots landward of the protective dune. In October
2012, Hurricane Sandy deposited 1.2 m (4 ft) of sand on the South Beach parking lot; this sand
18
was moved to the Bayside peninsula shoreline to fill a depression in the OSV zone entrance that
often pools water. In recognition of the continuing challenges that ocean processes present to
shoreline infrastructure, the South Beach parking lot will be moved landward (Figure 6) and the
asphalt surface will be replaced by a clamshell surface with clay base that has proven successful
in the Toms Cove, Virginia, parking lot (Bill Hulslander, ASIS Resources Management Chief,
personal communication 3 June 2013).
Assateague State Park also maintains dunes (#2 Figure 4B) along the entire length of the 3.2 km
(2 mi) long park, including installing sand fencing, planting dune grasses, capping dune
crossover paths with clay, replenishing dunes using sand from off-island sources, and using
bulldozers to push sand from the beach towards the dunes as needed (often post-storm) to
maintain the dune line and protect infrastructure including roads, buildings, and campgrounds.
These repairs typically follow storms; for example, between April 4 and July 30, 2004,
Assateague State Park hauled 11,470 m3 (15,100 yd
3) of sand to the island in order to restore 366
m (1,200 ft) of the maintained dune (Schupp 2007). Due to Hurricane Sandy in October 2012,
Assateague State Park is planning to move the southern portion of its dune 35 m (115 ft) west
(landward), with an intended construction date after October 2015 (MDNR 2014).
Estuarine Shoreline Modifications The Verrazano Bridge crosses Sinepuxent Bay (Figure 2). It was built in 1964 to connect the
Maryland end of Assateague Island with mainland Delmarva. At the foot of the bridge on
Assateague Island the estuarine shoreline has been lined with a revetment (rock riprap) (#6
Figure 4B) to protect against shoreline erosion and retreat.
Along the southern side of the Bayside peninsula, the evidence of past dredging and land
reclamation (#12 and #13 Figure 3) are evident in the deep channels and angular changes in
shoreline alignment, but volumes and dates for these events are unknown.
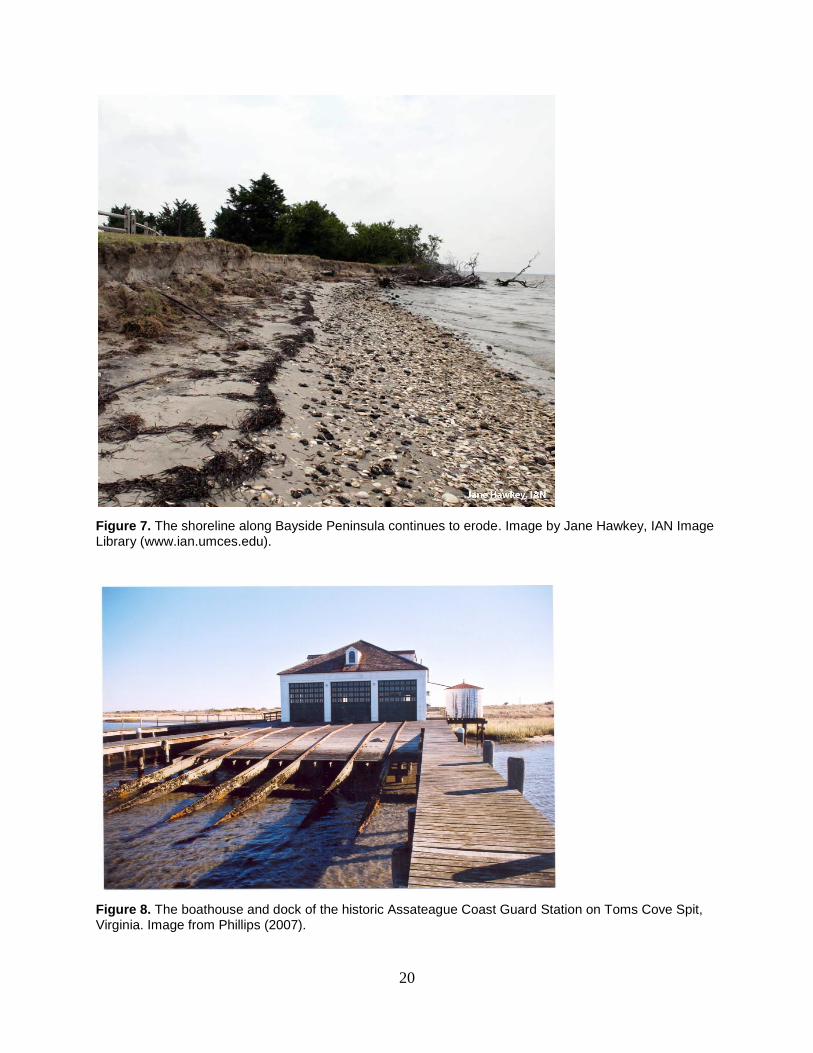
In Sinepuxent Bay, just offshore of the Bayside parking lot, there is a submerged bulkhead (#8
Figure 4B) that is exposed at low tide. This structure was built to protect the peninsula, which at
that time extended out to the bulkhead location (B. Hulslander, email 19 March 2013). The
shoreline in this area continues to erode (Figure 7). Sand removed from the South Beach parking
lot following Hurricane Sandy in October 2012 was placed on this shoreline among other areas,
but had washed away by June 2013 (B. Hulslander, pers. comm. 3 June 2013). A forthcoming
Environmental Assessment, expected to be released in June 2015 (B. Hulslander, pers. comm. 22
January 2015), will identify alternative locations for a parking lot, so that after the next storm
event, there is a plan in place to move it. In the meantime, the bayside parking lot will be
resurfaced with clay and clamshell rather than with asphalt (B. Hulslander, email 30 October
2014).
Ferry Landing, extending from Assateague Island into Sinepuxent Bay, is reclaimed land built to
receive a ferry from the mainland before the Verrazano Bridge connected the island to the
mainland (Schupp 2013). The construction date of Ferry Landing is uncertain, but the deep
channel dug through the marsh to reach it was used heavily in the 1950s, before the park was
established, when developers brought prospective land buyers to the island (Schupp 2013). There
is a functioning bulkhead (#9 Figure 4B) between the Ferry Landing parking lot and the
19
Sinepuxent Bay shoreline. It was built at least 30 years ago to protect the parking lot (B.
Hulslander, email 19 March, 2013).
In Virginia, NPS is responsible for maintaining the Sheepshead Creek Bridge and Assateague
Channel Bridge, and the land connecting the two. Rock riprap (a revetment) (#10 Figure 4C)
protects the shoreline along this land, which experienced erosion following Hurricane Sandy in
2012. In August 2014, gabion baskets filled with rock were installed along the northern shoreline
of this connecting land (B. Hulslander, email 23 January 2015).
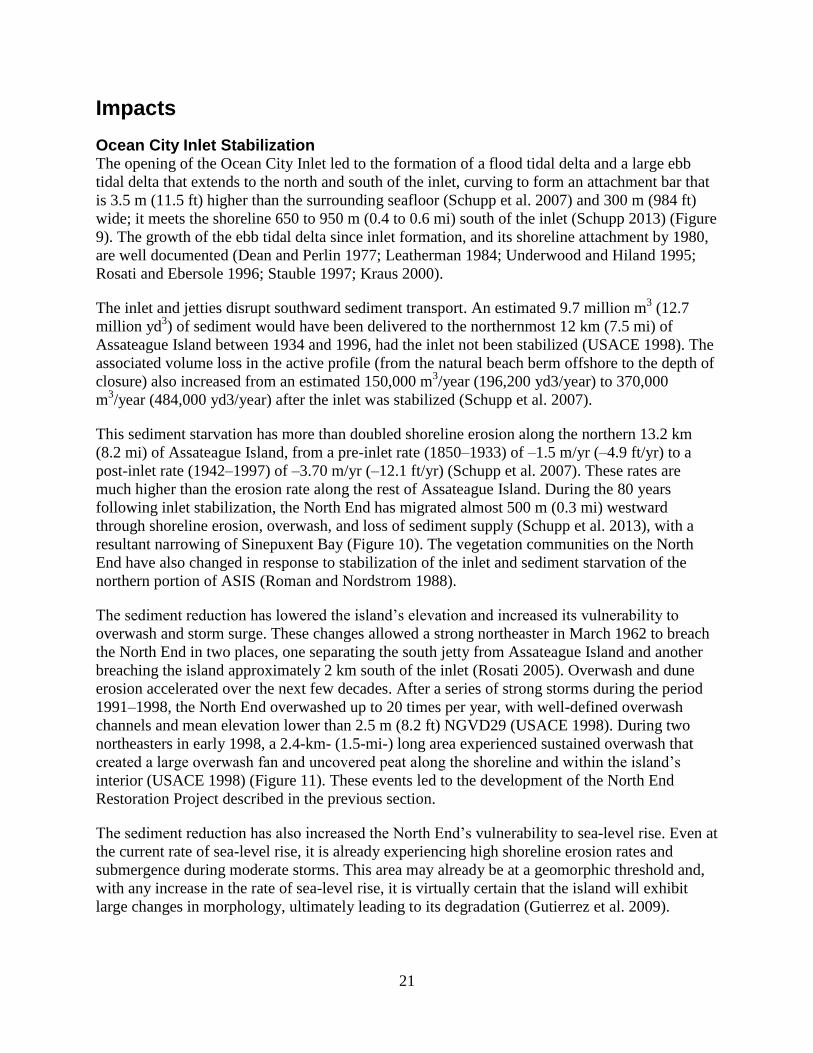
The historic Assateague Coast Guard Station on Toms Cove Spit in Virginia was established in
1922 and decommissioned in 1967 (Phillips 2007). The complex includes a boathouse (Figure 8)
that was built in 1938-1939 north (bayward) of the station house. The boathouse (#11and #12
Figure 4C) was built on wooden pilings and had an attached wooden pier dock and a launchway
with steel tracks sloping from the boat doors into the water. The understructure of the boathouse
and the pier were repaired in 1993 (Phillips 2007). The pilings rise 1.5 to 2.1 m (5 to 7 ft) above
the sand and are exposed at low tide (Phillips 2007).
Figure 6. Proposed relocation of the South Beach parking lot in preparation for future sea-level rise, storm events, and other climate change impacts. Figure from ASIS (2013).
20
Figure 7. The shoreline along Bayside Peninsula continues to erode. Image by Jane Hawkey, IAN Image Library (www.ian.umces.edu).
Figure 8. The boathouse and dock of the historic Assateague Coast Guard Station on Toms Cove Spit, Virginia. Image from Phillips (2007).
21
Impacts
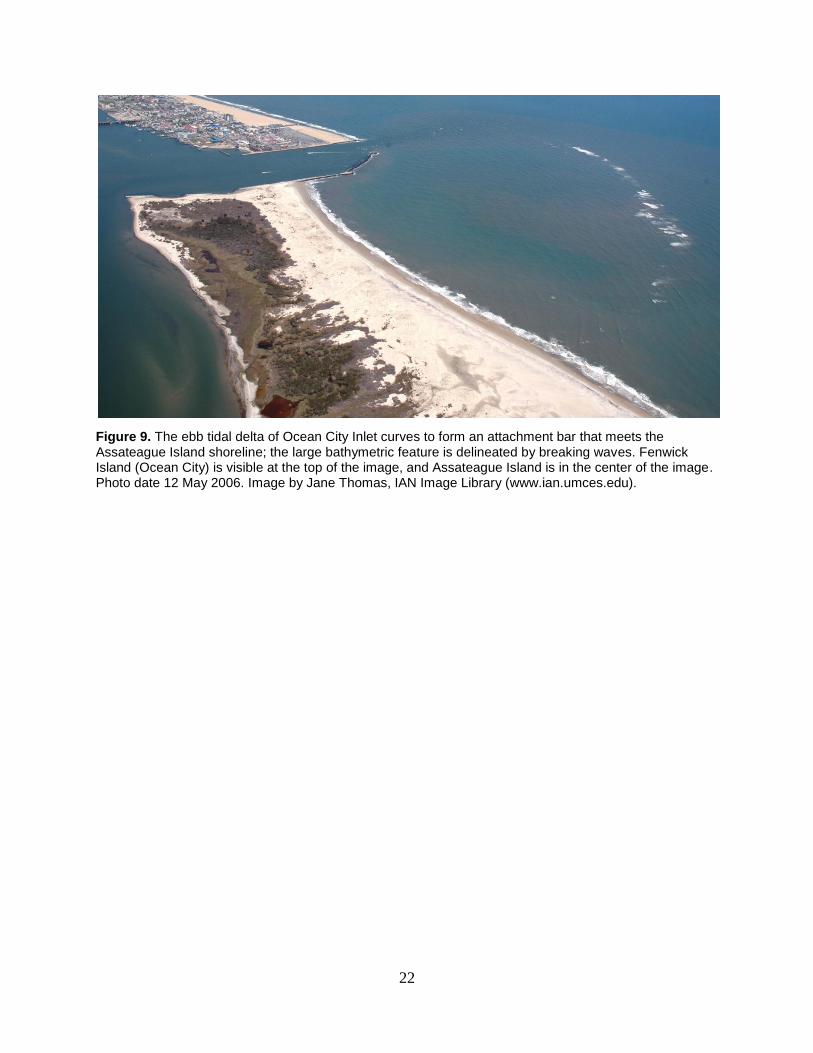
Ocean City Inlet Stabilization The opening of the Ocean City Inlet led to the formation of a flood tidal delta and a large ebb
tidal delta that extends to the north and south of the inlet, curving to form an attachment bar that
is 3.5 m (11.5 ft) higher than the surrounding seafloor (Schupp et al. 2007) and 300 m (984 ft)
wide; it meets the shoreline 650 to 950 m (0.4 to 0.6 mi) south of the inlet (Schupp 2013) (Figure
9). The growth of the ebb tidal delta since inlet formation, and its shoreline attachment by 1980,
are well documented (Dean and Perlin 1977; Leatherman 1984; Underwood and Hiland 1995;
Rosati and Ebersole 1996; Stauble 1997; Kraus 2000).
The inlet and jetties disrupt southward sediment transport. An estimated 9.7 million m3 (12.7
million yd3) of sediment would have been delivered to the northernmost 12 km (7.5 mi) of
Assateague Island between 1934 and 1996, had the inlet not been stabilized (USACE 1998). The
associated volume loss in the active profile (from the natural beach berm offshore to the depth of
closure) also increased from an estimated 150,000 m3/year (196,200 yd3/year) to 370,000
m3/year (484,000 yd3/year) after the inlet was stabilized (Schupp et al. 2007).
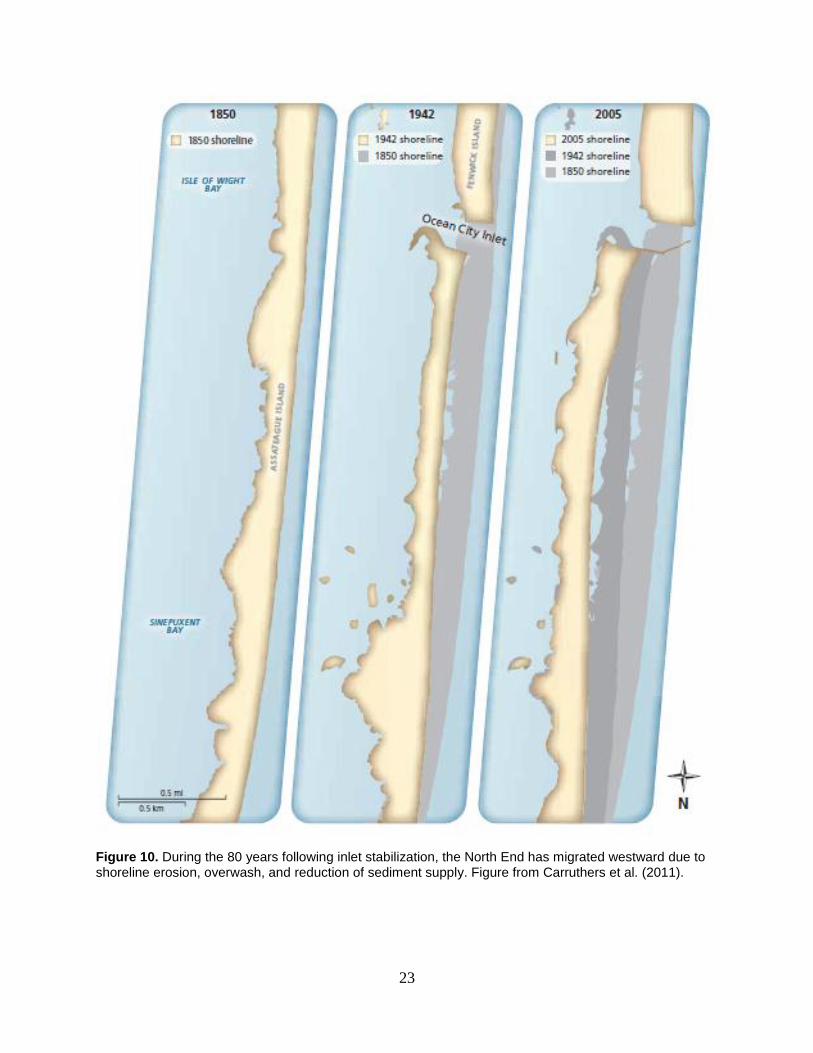
This sediment starvation has more than doubled shoreline erosion along the northern 13.2 km
(8.2 mi) of Assateague Island, from a pre-inlet rate (1850–1933) of –1.5 m/yr (–4.9 ft/yr) to a
post-inlet rate (1942–1997) of –3.70 m/yr (–12.1 ft/yr) (Schupp et al. 2007). These rates are
much higher than the erosion rate along the rest of Assateague Island. During the 80 years
following inlet stabilization, the North End has migrated almost 500 m (0.3 mi) westward
through shoreline erosion, overwash, and loss of sediment supply (Schupp et al. 2013), with a
resultant narrowing of Sinepuxent Bay (Figure 10). The vegetation communities on the North
End have also changed in response to stabilization of the inlet and sediment starvation of the
northern portion of ASIS (Roman and Nordstrom 1988).
The sediment reduction has lowered the island’s elevation and increased its vulnerability to
overwash and storm surge. These changes allowed a strong northeaster in March 1962 to breach
the North End in two places, one separating the south jetty from Assateague Island and another
breaching the island approximately 2 km south of the inlet (Rosati 2005). Overwash and dune
erosion accelerated over the next few decades. After a series of strong storms during the period
1991–1998, the North End overwashed up to 20 times per year, with well-defined overwash
channels and mean elevation lower than 2.5 m (8.2 ft) NGVD29 (USACE 1998). During two
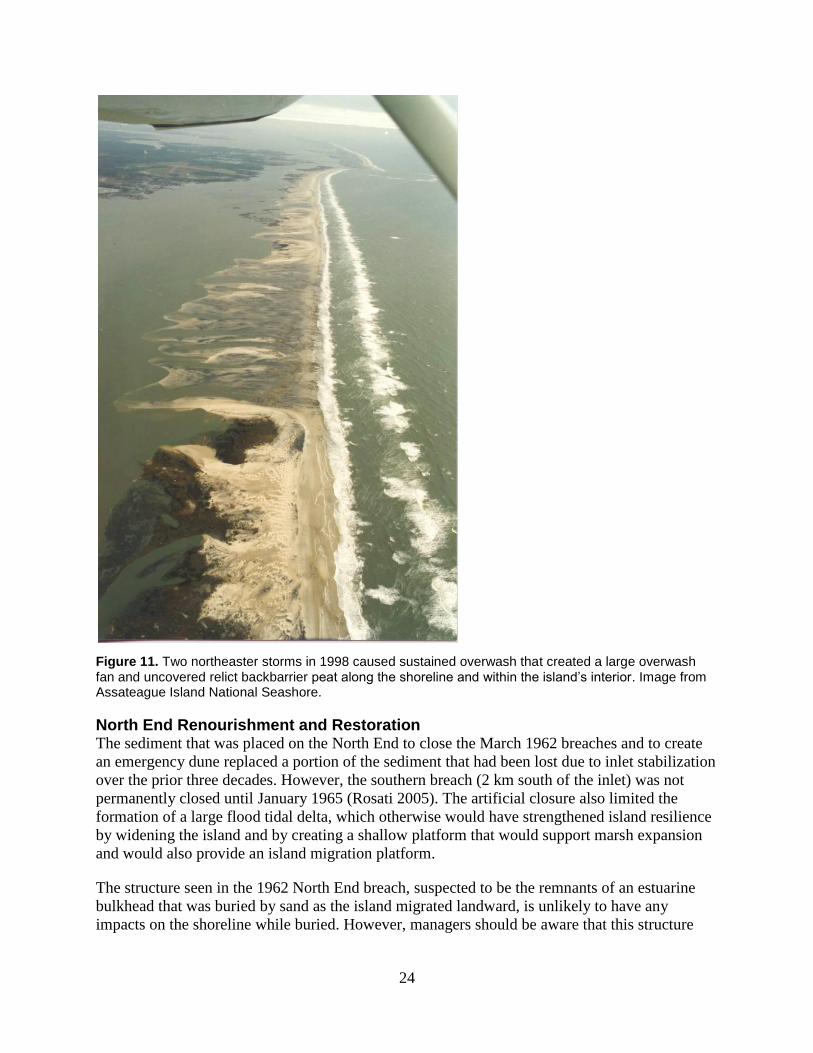
northeasters in early 1998, a 2.4-km- (1.5-mi-) long area experienced sustained overwash that
created a large overwash fan and uncovered peat along the shoreline and within the island’s
interior (USACE 1998) (Figure 11). These events led to the development of the North End
Restoration Project described in the previous section.
The sediment reduction has also increased the North End’s vulnerability to sea-level rise. Even at
the current rate of sea-level rise, it is already experiencing high shoreline erosion rates and
submergence during moderate storms. This area may already be at a geomorphic threshold and,
with any increase in the rate of sea-level rise, it is virtually certain that the island will exhibit
large changes in morphology, ultimately leading to its degradation (Gutierrez et al. 2009).
22
Figure 9. The ebb tidal delta of Ocean City Inlet curves to form an attachment bar that meets the Assateague Island shoreline; the large bathymetric feature is delineated by breaking waves. Fenwick Island (Ocean City) is visible at the top of the image, and Assateague Island is in the center of the image. Photo date 12 May 2006. Image by Jane Thomas, IAN Image Library (www.ian.umces.edu).
23
Figure 10. During the 80 years following inlet stabilization, the North End has migrated westward due to shoreline erosion, overwash, and reduction of sediment supply. Figure from Carruthers et al. (2011).
24
Figure 11. Two northeaster storms in 1998 caused sustained overwash that created a large overwash fan and uncovered relict backbarrier peat along the shoreline and within the island’s interior. Image from Assateague Island National Seashore.
North End Renourishment and Restoration The sediment that was placed on the North End to close the March 1962 breaches and to create
an emergency dune replaced a portion of the sediment that had been lost due to inlet stabilization
over the prior three decades. However, the southern breach (2 km south of the inlet) was not
permanently closed until January 1965 (Rosati 2005). The artificial closure also limited the
formation of a large flood tidal delta, which otherwise would have strengthened island resilience
by widening the island and by creating a shallow platform that would support marsh expansion
and would also provide an island migration platform.
The structure seen in the 1962 North End breach, suspected to be the remnants of an estuarine
bulkhead that was buried by sand as the island migrated landward, is unlikely to have any
impacts on the shoreline while buried. However, managers should be aware that this structure
25
exists, because as the island continues to migrate, the structure will be exposed along the ocean
shoreline and may affect sediment transport in addition to being a recreational safety hazard.
The spoil dunes placed near the jetty between 1971 and 1986 are some of the highest dunes on
the island, in some parts over 8 m (26 ft) NGVD29, which is higher even than the artificial dunes
that are maintained along the developed zone (Schupp 2013). The spoil dunes have the same
vegetation communities as those found on the island’s natural dunes, and also support a state-
listed insect (tiger beetle, Cicindela lepida) (Carruthers et al. 2013).
The constructed foredune that was built in 1998 to prevent breaching, and fortified in 2002 as
part of the short-term North End Restoration project, did not behave according to modeled
predictions due in large part to three unexpected conditions:
1. The dredged sediment used in construction had a larger proportion of coarse-grained
materials, including gravel, than did the native sediments. Through wind winnowing, this
coarse fraction blankets most of the foredune surface, limiting the ability of the
underlying sediments to be mobilized during wind and storm events.
2. Post-construction meteorological conditions were much calmer than the modeled storm
conditions; a multi-year period of calm weather followed the 2002 sediment placement.
As a result, shoreline erosion was also unexpectedly low, so the sediment protected the
constructed foredune for longer than anticipated.
3. The long-term restoration effort, involving mechanical sand bypassing to the nearshore,
began earlier than expected so the shoreline had not eroded as far westward as expected
before the longshore sediment transport volume increased (Schupp et al. 2013).
As a result, by 2006, the constructed foredune had gained significant volume, had never
overwashed, and sheltered the island interior from wind and waves, thereby accelerating the
progression of vegetation communities and reducing habitat available for piping plover
(Charadrius melodus), a federally-listed threatened species (Schupp et al. 2013).
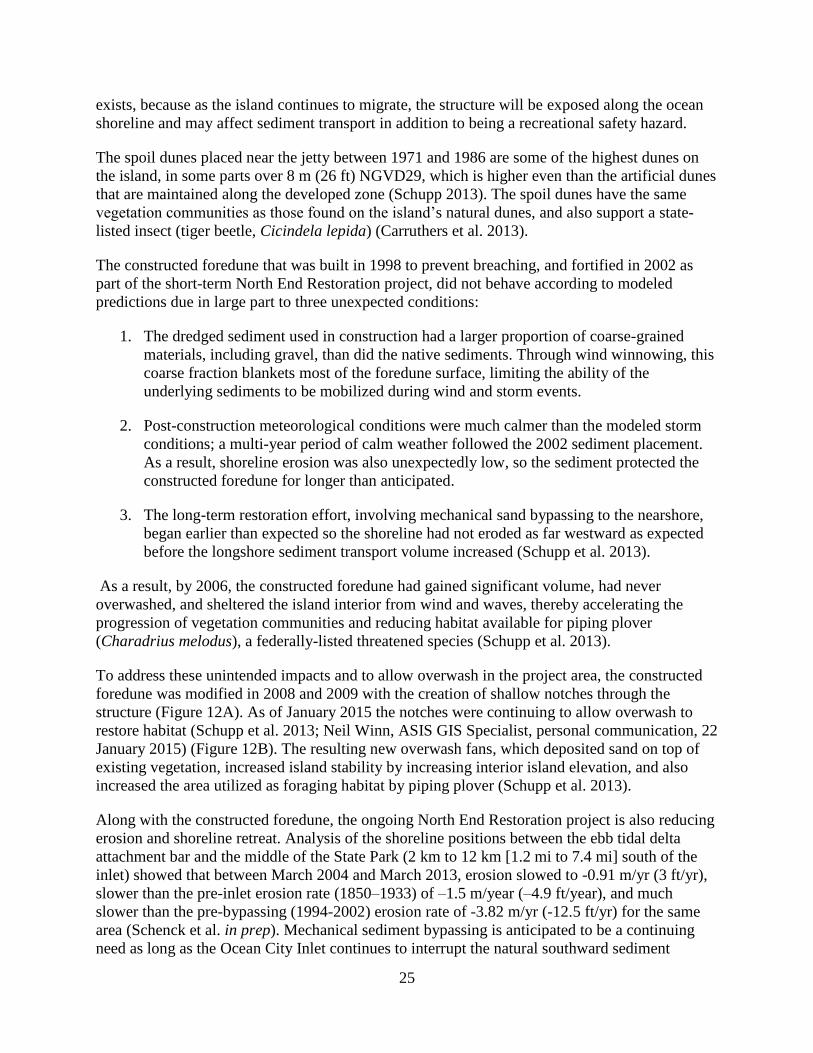
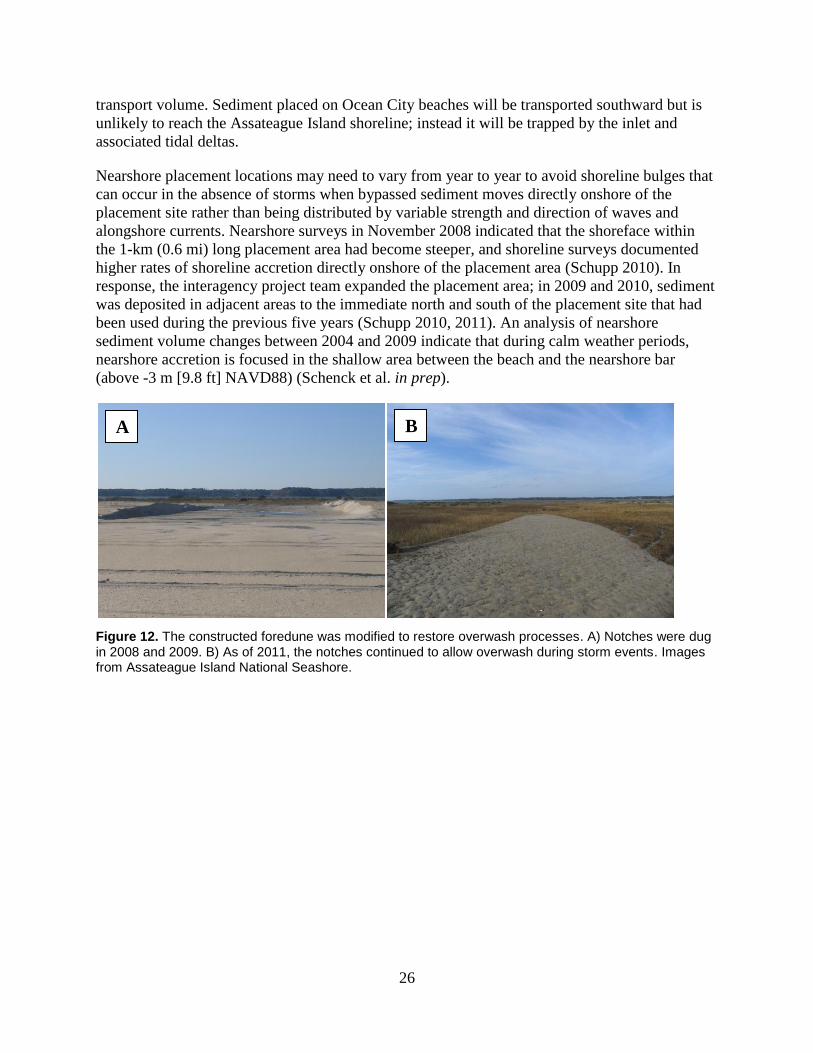
To address these unintended impacts and to allow overwash in the project area, the constructed
foredune was modified in 2008 and 2009 with the creation of shallow notches through the
structure (Figure 12A). As of January 2015 the notches were continuing to allow overwash to
restore habitat (Schupp et al. 2013; Neil Winn, ASIS GIS Specialist, personal communication, 22
January 2015) (Figure 12B). The resulting new overwash fans, which deposited sand on top of
existing vegetation, increased island stability by increasing interior island elevation, and also
increased the area utilized as foraging habitat by piping plover (Schupp et al. 2013).
Along with the constructed foredune, the ongoing North End Restoration project is also reducing
erosion and shoreline retreat. Analysis of the shoreline positions between the ebb tidal delta
attachment bar and the middle of the State Park (2 km to 12 km [1.2 mi to 7.4 mi] south of the
inlet) showed that between March 2004 and March 2013, erosion slowed to -0.91 m/yr (3 ft/yr),
slower than the pre-inlet erosion rate (1850–1933) of –1.5 m/year (–4.9 ft/year), and much
slower than the pre-bypassing (1994-2002) erosion rate of -3.82 m/yr (-12.5 ft/yr) for the same
area (Schenck et al. in prep). Mechanical sediment bypassing is anticipated to be a continuing
need as long as the Ocean City Inlet continues to interrupt the natural southward sediment
26
transport volume. Sediment placed on Ocean City beaches will be transported southward but is
unlikely to reach the Assateague Island shoreline; instead it will be trapped by the inlet and
associated tidal deltas.
Nearshore placement locations may need to vary from year to year to avoid shoreline bulges that
can occur in the absence of storms when bypassed sediment moves directly onshore of the
placement site rather than being distributed by variable strength and direction of waves and
alongshore currents. Nearshore surveys in November 2008 indicated that the shoreface within
the 1-km (0.6 mi) long placement area had become steeper, and shoreline surveys documented
higher rates of shoreline accretion directly onshore of the placement area (Schupp 2010). In
response, the interagency project team expanded the placement area; in 2009 and 2010, sediment
was deposited in adjacent areas to the immediate north and south of the placement site that had
been used during the previous five years (Schupp 2010, 2011). An analysis of nearshore
sediment volume changes between 2004 and 2009 indicate that during calm weather periods,
nearshore accretion is focused in the shallow area between the beach and the nearshore bar
(above -3 m [9.8 ft] NAVD88) (Schenck et al. in prep).
Figure 12. The constructed foredune was modified to restore overwash processes. A) Notches were dug in 2008 and 2009. B) As of 2011, the notches continued to allow overwash during storm events. Images from Assateague Island National Seashore.
A B
27
Dredging The North End Restoration project removes sediment from the Ocean City Inlet channel and
associated tidal deltas (Figure 5). The amounts of sediment being removed for this project from
the inlet and from the portion of the ebb tidal delta that lies north of the inlet (a portion of the
144,000 m3/year [188,000 yd
3/year] dredged from all areas including the flood tidal deltas and
inlet) appear to be balanced with the natural recharge rate, or the rate at which alongshore
sediment transport refills the dredged sites. Following the first four years of dredging the ebb
tidal delta for the North End Restoration project, bathymetric surveys from January 2004 through
March 2008 were evaluated to estimate the recharge rate. The portions of the ebb tidal delta
lying north of the inlet were heavily dredged and were found to recharge at a rate of 34,000 –
38,000 m3/yr (45,000-50,000 yd
3/yr) during a time period that included bypassing to Ocean City
beaches north of the dredge site (#8 Figure 3). In comparison, one dredge target site along the
attachment bar on the south side of the inlet was lightly dredged in 2004 and was found to have a
recharge rate of only 1,500 – 2,300 m3/yr (2,000 to 3,000 yd
3/yr) (Bass 2008).
Specific impacts of the historic dredging of Sinepuxent and Isle of Wight Channels, and around
the Ferry Landing and Bayside Peninsulas, have not been published in known documents.
However, impacts of estuarine dredging (Johnston 1981) can provide insight into the bays’
history. Changes in estuarine bathymetry are likely to change hydrodynamics, or water
circulation patterns, of the estuary. Manipulation of the bay bottom may disturb or destroy
submerged aquatic vegetation, shellfish beds, fish spawning or nursery areas, and productive
macro-invertebrate communities. Dredging near the shoreline, or depositing dredged sediment
onto the estuarine shoreline, may disrupt wetland habitat and function. Dredging may also
increase sediment in the water column, and increased turbidity can smother shellfish larvae or
spat and can reduce light available to submerged aquatic vegetation. Some of the small marsh
islands and tidal mudflats in the Coastal Bays were created from dredged material, including
sediment dredged from Sinepuxent Channel in 1948-1950 (Dawson and Cofield 1980); these
islands now provide habitat for colonial nesting birds and shorebirds.
Artificial Dunes The high, continuous man-made dune that fronts the developed zones of the national seashore
and Assateague State Park prevents active overwash and subsequent infiltration of seawater in
the geomorphic setting that otherwise would receive intermittent overwash during moderate
storms. This has a profound effect on the hydrology of the area immediately behind the
maintained dune; groundwater in the seaward section of the island is fresh or only slightly
brackish, rather than brackish to saline (Krantz 2010).
Efforts to stabilize or fortify the artificial dune have included importing sediment, building sand
fencing, grass planting, and fencing to protect the dunes from foot traffic and horses. Imported
sediment may introduce exotic species and sediment that is incompatible with the beach
environment. Both recent and buried fencing is sometimes uncovered and uprooted during
erosive storms, leaving debris on the beaches that may include recreational hazards such as wire
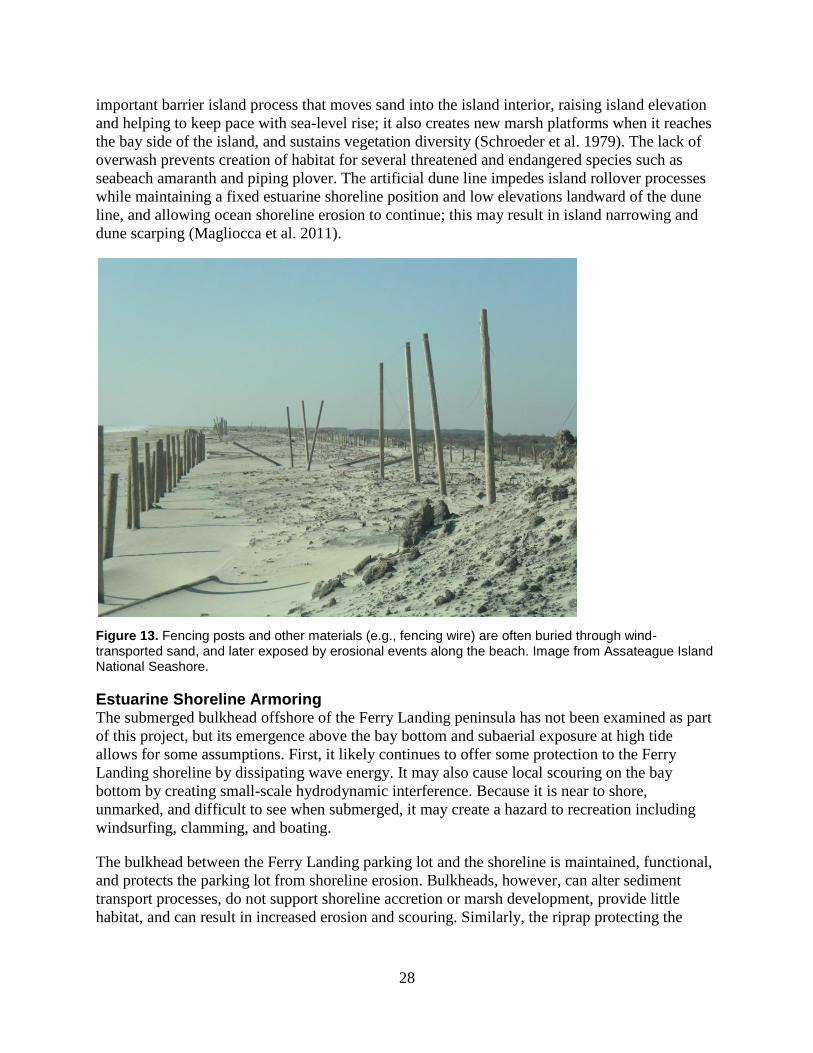
and nails (Figure 13).
Although the historic artificial dune is no longer maintained outside of the developed zone, its
remnants continue to prevent the natural process of overwash in some portions of Assateague
Island, particularly near the Maryland-Virginia state line (Carruthers et al. 2011). Overwash is an
28
important barrier island process that moves sand into the island interior, raising island elevation
and helping to keep pace with sea-level rise; it also creates new marsh platforms when it reaches
the bay side of the island, and sustains vegetation diversity (Schroeder et al. 1979). The lack of
overwash prevents creation of habitat for several threatened and endangered species such as
seabeach amaranth and piping plover. The artificial dune line impedes island rollover processes
while maintaining a fixed estuarine shoreline position and low elevations landward of the dune
line, and allowing ocean shoreline erosion to continue; this may result in island narrowing and
dune scarping (Magliocca et al. 2011).
Figure 13. Fencing posts and other materials (e.g., fencing wire) are often buried through wind-transported sand, and later exposed by erosional events along the beach. Image from Assateague Island National Seashore.
Estuarine Shoreline Armoring The submerged bulkhead offshore of the Ferry Landing peninsula has not been examined as part
of this project, but its emergence above the bay bottom and subaerial exposure at high tide
allows for some assumptions. First, it likely continues to offer some protection to the Ferry
Landing shoreline by dissipating wave energy. It may also cause local scouring on the bay
bottom by creating small-scale hydrodynamic interference. Because it is near to shore,
unmarked, and difficult to see when submerged, it may create a hazard to recreation including
windsurfing, clamming, and boating.
The bulkhead between the Ferry Landing parking lot and the shoreline is maintained, functional,
and protects the parking lot from shoreline erosion. Bulkheads, however, can alter sediment
transport processes, do not support shoreline accretion or marsh development, provide little
habitat, and can result in increased erosion and scouring. Similarly, the riprap protecting the
29
shoreline at the foot of the Verrazano Bridge in Maryland and the riprap protecting the bridge in
Virginia do not support ecosystem services.
The pilings supporting the Coast Guard Boathouse and associated piers likely cause some
interference with local hydrodynamics, including dissipating wave energy. Piers in excess of 30
m (100 ft) can have a number of impacts on wetlands and the habitats they support including
shading of wetland vegetation and submerged aquatic vegetation that lies beneath the structures;
barriers for trash and debris during large storm events; potential for the structures to break up and
become debris during large storm events; and changes to the composition of marsh-dependent
birds that use the area for feeding and other habitat (Cain et al. 2009).
Management Recommendations
Continued sediment management planning, such as that done through the North End Restoration
Project, and protection of tidal wetlands will help to maintain the barrier island, marsh, and
ecosystem services (Burkett and Davidson 2012).
The North End Restoration project plan designates several dredging target areas, including a
portion of the ebb tidal delta south of the inlet that curves to form an attached bar that connects
to Assateague Island (USACE 1998). The sediment in this attached bar likely contributes to the
volume of sediment that is naturally moving southward to nourish Assateague Island. Sediment
sources for future dredging should be outside of the Assateague Island nearshore area. The
portions of the ebb tidal delta south of the inlet, including the attachment bar in the Assateague
Island nearshore, should not be dredged.
An additional recommendation related to the North End Restoration project addresses the
constructed foredune. The project design intent is for overwash restoration to sustain the
availability of foraging habitat, but future foredune modifications may be necessary to maintain
or increase overwash processes and piping plover habitat in the project area (Schupp et al. 2013).
It is also recommended to remove existing hardened estuarine shorelines, such as bulkheads and
riprap, and to allow reversion of the estuarine shoreline to a functioning natural habitat with
natural sediment transport processes (Nordstrom and Jackson 2013). Where this is not possible,
hardened structures should be augmented with living shorelines components where feasible.
Living shorelines can protect vulnerable shorelines while also providing or enhancing coastal
ecosystem services, water quality, and habitat (Cain et al. 2009). Living shorelines incorporate
natural elements and may be non-structural, such as vegetation; along low-energy estuarine
shorelines, native plants can provide a wave buffer to upland areas while their roots hold soil in
place to reduce erosion. Living shorelines may also serve as one component of hybrid
techniques, which incorporate both non-structural components and traditional approaches (e.g.,
breakwater), and are placed in a manner that does not sever the physical connection to the
riparian, intertidal and subaqueous areas. In general, non-structural approaches are better suited
to low wave energy environs, while hybrid techniques are typically applied in areas of medium
to high wave energy (Bilcovic and Mitchell 2014).
Several recommendations that focus on increasing the sustainability of infrastructure in the face
of global climate change impacts (e.g., sea-level rise, more intense storms) and ongoing storm
30
impacts are captured by alternatives in the park’s draft General Management Plan, which is due
to be released for public review in Summer 2015 (B. Hulslander, pers. comm.. 22 January 2015).
First, it is recommended that infrastructure damaged by storms or erosion be relocated inland or
off-island. Where infrastructure relocation is not feasible, it is recommended that the park
replace the damaged infrastructure with structures that can be temporarily moved (for example,
structures that can be stored inland when a storm approaches) or are created from native
materials (for example, resurfacing asphalt parking lots with clay and clamshell). Both of these
strategies have proven successful in the park’s Toms Cove Virginia district.
Recommendations for Further Study
Recently, the Bureau of Ocean Energy Management (BOEM) approved a major sand mining
project that may impact the shoreline along the southern end of Assateague Island (BOEM
2011). This project targets the removal of sediment from submerged sand shoals that lie 8 to 16
km (5 to 10 mi) off the southern end of Assateague Island in order to nourish Wallops Island,
which lies on the southern boundary of Chincoteague Inlet, approximately once every 5 years
(BOEM 2011). The cost of this two-phase project was $43 million. The southward extension of
the rock seawall by 432 m (1,419 ft) was completed in 2011; the initial round of dredging and
beachfill of 2.3 million m3 (3 million yd
3) to build a beach of 40 m (130 ft) wide and 5,913 m
(19,400 ft) long was completed in August 2012 (USACE 2014). BOEM approved an additional
dredging operation for $11.3 million (USACE 2014) in November 2013 to address Hurricane
Sandy impacts on a 3.2 km (2 mi) stretch of shoreline in front of the NASA runway (BOEM
2014), just over one year after the initial beach nourishment.
Because alongshore sediment transport continues in a southward direction, sediment brought to
the Wallops Island shoreline will not benefit the Assateague Island shoreline. Assateague Island
National Seashore’s official response to the project’s proposed environmental impact statement
(NASA 2010) expressed concern that the project would adversely impact the seashore in several
ways:
Reduction in the shoals’ ability to shelter the seashore’s eroding shoreline from wave
energy, particularly waves from the southeast and east;
Impacts on the regional sediment budget and cross-shore sediment transport pathways
from the shoal and nearshore areas to the island (Thieler et al. 1995; Schwab et al. 2000a,
2000b; Hayes and Nairn 2004); and
Degradation of habitat for pelagic fish and birds, and the benthic communities that
support them (Diaz et al. 2004; Vasslides and Able 2008).
In light of these potential impacts and the shortened recovery time between dredging cycles,
shoreline position should continue to be monitored in accordance with the standard operating
protocol in place at ASIS, and shoreline change should be examined following storm events with
significant wave heights. Future studies of regional sediment budgets and benthic communities
along southern Assateague Island could help to identify any sand mining impacts that occur.
31
Literature Cited
Assateague Island National Seashore (ASIS). 2003. Historic Context Study, Waterfowl Hunting
Camps for Hunting Lodges Retention Properties, Determination of Eligibility Study.
Interview Log of interview of Dennard Conwell “Connie” Purnell by Pat Russell. ID no:
NPS. DCP.7-31-03.02.
ASIS. 2006. Assateague Island National Seashore Jurisdictional Boundary 2003-2005.
Assateague Island National Seashore, Berlin, MD. Online dataset.
https://irma.nps.gov/App/Reference/Profile/1043111 (accessed 26 January 2015).
ASIS. 2013. “Assateague Island National Seashore Begins Planning Process for Environmental
Assessment to Relocate Parking Areas.” Press release, 8 July 2013.
Bass, G.P., E.T. Fulford, S.G. Underwood, and L.E. Parson. 1994. Rehabilitation of the South
Jetty, Ocean City, Maryland. Technical Report CERC-94-6. U.S. Army Corps of Engineers
Waterways Experiment Station.
Bass, G.P. 2008. Assateague Island/Ocean City Inlet, MD Bypassing/Backpassing Project
Briefing. Presentation to the North End Restoration team biannual meeting on 6 November
2008. U.S. Army Corps of Engineers Baltimore District, Baltimore, MD, USA.
Bilcovic, D.M. and M. Mitchell. 2011. Ecological and Erosion Protection Functions of
Chesapeake Bay Living Shorelines. Final Report to Chesapeake Bay Trust, National Oceanic
and Atmospheric Administration (NOAA) Restoration Center, and the Maryland Department
of the Environment, December 2011. Virginia Institute of Marine Science at the College of
William & Mary, Gloucester Point, VA.
Boon, J.D. 2012. Evidence of Sea Level Acceleration at U.S. and Canadian Tide Stations,
Atlantic Coast, North America. Journal of Coastal Research 28(6): 1437 – 1445. doi:
http://dx.doi.org/10.2112/JCOASTRES-D-12-00102.1 (accessed 15 January 2015).
Bureau of Ocean Energy Management, Regulation and Enforcement (BOEM). 2011. Use of
OCS sand resources in NASA’s Wallops Flight Facility shoreline restoration and
infrastructure program. Record of Decision. Herndon, Virginia, USA.
http://www.boem.gov/uploadedFiles/BOEMRE_Record_of_Decision_Wallops_SRIPP_02M
ar2011.pdf (accessed 26 January 2015).
BOEM. 2014. NASA Wallops Island Coastal Reconstruction Project to Begin Soon with OCS
Sand. Press release. 10 July 2014. BOEM, Washington, DC.
http://www.boem.gov/note07102014/ (accessed 21 January 2015).
Burkett, V.R. and Davidson, M.A. [Eds.]. 2012. Physical Climate Forces, Coastal Impacts,
Adaptation and Vulnerability: A Technical Input to the 2013 National Climate Assessment.
150 p. http://www.cakex.org/sites/default/files/documents/Coastal-NCA-1.13-
web.form__0.pdf (accessed 15 January 2015).
Buttolph, A.M., W. G. Grosskopf, G. P. Bass, and N. C. Kraus. 2006. Natural Sand Bypassing
32
and Response of Ebb Shoal to Jetty Rehabilitation, Ocean City Inlet, MD, USA. Pages 3344-
3356 in Proceedings 30th
Coastal Engineering Conference. American Society of Civil
Engineers, Reston, Virginia, USA.
Cain, C.J., D.M. Boward, R.J. Chalmers, J.W. Charland, D.H. Clearwater, J.W. George, J.W.
Grace, A.B. Hairston-strang, R.V. Jesien, Z.P. Johnson, L. Lawrence, A.E. Luscher, K.G.
Munson, H.M. Sachs, R.J. Shedlock, J. Sherwell, K. Silaphone, C.C. Spaur, J.E. Thomas, and
D.E. Wilson. 2009. Management of the Coastal Bays and Watershed. Pages 21–76 in W. C.
Dennison, J. E. Thomas, C. J. Cain, T. J. B. Carruthers, M. R. Hall, R. V. Jesien, C. E.
Wazniak, and D. E. Wilson, editors. Shifting sands: environmental and cultural change in
Maryland’s Coastal Bays. IAN Press, University of Maryland Center for Environmental
Science, Cambridge, Maryland, USA.
Carruthers, T., K. Beckert, B. Dennison, J. Thomas, T. Saxby, M. Williams, T. Fisher, J. Kumer,
C. Schupp, B. Sturgis, and C. Zimmerman. 2011. Assateague Island National Seashore
natural resource condition assessment: Maryland, Virginia. Natural resource report
NPS/ASIS/NRR—2011/405. National Park Service, Fort Collins, Colorado, USA.
http://nature.nps.gov/water/nrca/assets/docs/ASIS_NRCA.pdf (accessed 10 July 2012).
Carruthers, T. J., K. Beckert, W. C. Dennison, J. P. Kumer, T. Saxby, C. A. Schupp, B. Sturgis,
J. Thomas, M. Williams, T. Fisher, and C. S. Zimmerman. 2013. Improving management of a
mid-Atlantic coastal barrier island through assessment of habitat condition. Estuarine,
Coastal, and Shelf Science 116:74-86. Available online:
http://www.sciencedirect.com/science/article/pii/S0272771412003204 (accessed 1 October
2012).
Church, J., and N. White. 2011. Sea-Level Rise from the Late 19th to the Early 21st Century.
Surveys in Geophysics 32(4-5): 585-602. doi:10.1007/s10712-011-9119-1 (accessed 16
January 2015).
Church, J. A., P. U. Clark, A. Cazenave, J. M. Gregory, S. Jevrejeva, A. Levermann, M. A.
Merrifield, G. A. Milne, R. S. Nerem, P. D. Nunn, A. J. Payne, W. T. Pfeffer, D. Stammer,
and A. S. Unnikrishnan. 2013. Sea level change. In T. F. Stocker, D. Qin, G.-K. Plattner, M.
Tignor, S. K. Allen, J. Boschung, A. Nauels, Y. Xia, V. Bex, and P. M. Midgley, editors.
Climate change 2013: the physical science basis. Contribution of Working Group I to the
Fifth Assessment Report of the Intergovernmental Panel on Climate Change. Cambridge
University Press, Cambridge, United Kingdom, and New York, New York, USA.
http://www.climatechange2013.org/images/report/WG1AR5_Chapter13_FINAL.pdf
(accessed 10 February 2014).
Coburn, A. S., A. D. Griffith, and R. S. Young. 2010. Inventory of Coastal Engineering Projects
in Coastal National Parks. Natural Resource Technical Report NPS/NRPC/GRD/NRTR—
2010/373. National Park Service, Fort Collins, Colorado.
Dawson, S. and Cofield, T. 1980. The Islands of Sinepuxent Bay. EPA Journal 6.
http://heinonline.org/HOL/LandingPage?handle=hein.journals/epajrnl6&div=121&id=&page
= (accessed 26 November 2013).
33
Dean, R. G., and M. Perlin. 1977. Coastal engineering study of Ocean City Inlet, Maryland.
Pages 520–540 in American Society of Civil Engineers, editor. Proceedings of Coastal
Sediments ’77. American Society of Civil Engineers, Reston, Virginia, USA.
Diaz, R. J., G. R. Cutter, Jr., and C. H. Hobbs III. 2004. Potential impacts of sand mining
offshore of Maryland and Delaware: part 2—biological considerations. Journal of Coastal
Research 20(1):61–69.
Fenster, M., and R. Dolan. 1996. Assessing the Impact of Tidal Inlets on Adjacent Barrier Island
Shorelines. Journal of Coastal Research 12(1): 294-310.
Field, M. E., and D. B. Duane. 1976. Post-Pleistocene history of the United States inner
continental shelf: significance to origin of barrier Islands. Geological Society of America
Bulletin 87:691–702.
Field, M. E. 1979. Sediments, shallow subbottom structure, and sand resources of the inner
continental shelf, central Delmarva Peninsula. CERC-TP-79-2. U.S. Army Engineer
Waterways Experiment Station, Vicksburg, Mississippi, USA.
Gutierrez, B. T., S. J. Williams, and E. R. Thieler. 2009. Ocean coasts. Pages 141–188 in J. G.
Titus (Coordinating Lead Author), K. E. Anderson, D. R. Cahoon, D. B. Gesch, S. K. Gill, B.
T. Gutierrez, E.R.Thieler, and S. J. Williams (Lead Authors), Coastal sensitivity to sea level
rise: a focus on the mid-Atlantic region. Synthesis and assessment product 4.1. U.S.
Environmental Protection Agency, Washington, DC, USA.
http://library.globalchange.gov/sap-4-1-coastalsensitivity-to-sea-level-rise-a-focus-on-the-
midatlantic-region (accessed 10 July 2012).
Hayes, M. O., and R. B. Nairn. 2004. Natural Maintenance of sand ridges and linear shoals on
the U.S. Gulf and Atlantic continental shelves and the potential impacts of dredging. Journal
of Coastal Research 20(1):138–148.
Higgins, E.A., R.D. Rappleye, and R.G. Brown. 1971. The flora and ecology of Assateague
Island. Bulletin A, 172. University of Maryland Agricultural Experiment Station, College
Park, MD, USA.
Hobbs, C. H., D. E. Krantz, and G. L. Wikel. 2008. Coastal processes and offshore geology. In
C. Bailey, editor. The geology of Viginia. The College of William and Mary, Williamsburg,
Virginia, USA. Available online:
http://www.eeescience.utoledo.edu/Faculty/Krantz/download_files/Virginia_Coast.Hobbs_K
rantz_&_Wikel.2008.pdf (accessed 9 July 2012).
Johnston Jr., S.A. 1981. Estuarine dredge and fill activities: A review of impacts. Environmental
Management 5(5): 427-440.
Krantz, D. K., C. A. Schupp, C. C. Spaur, J. E. Thomas, and D. V. Wells. 2009. Dynamic
systems at the land-sea interface. Pages 211–248 in W. C. Dennison, J. E. Thomas, C. J.
Cain, T. J. B. Carruthers, M. R. Hall, R. V. Jesien, C. E. Wazniak, and D. E. Wilson, editors.
Shifting sands: environmental and cultural change in Maryland’s Coastal Bays. IAN Press,
34
University of Maryland Center for Environmental Science, Cambridge, Maryland, USA.
Krantz, D. 2010. A hydrogeomorphic map of Assateague Island National Seashore, Maryland
and Virginia. Natural resource report NPS/NRPC/GRD/NRR-2010/215. National Park
Service, Fort Collins, Colorado, USA.
http://nature.nps.gov/geology/inventory/gre_publications.cfm (accessed 10 July 2012).
Kraus, N. C. 2000. Reservoir model of ebb-tidal shoal evolution and sand bypassing. Journal of
Waterway, Port, Coastal, and Ocean Engineering 126(6):305–313.
Larson, M., and N.C. Kraus. 1989. SBEACH: Numerical Model for Simulating Storm-Induced
Beach Change. Report DRP-92-5. U.S. Army Corps of Engineers CERC, Vicksburg, MS,
256 pp.
Leatherman, S.P. 1984. Shoreline evolution of North Assateague Island, Maryland. Shore and
Beach 52(3):3–10.
Mackintosh, B. 1982. Assateague Island National Seashore An Administrative History. National
Park Service History Division, Washington, DC.
Magliocca, N.R., D.E. McNamara, and A.B. Murray. 2011. Long-term, large-scale
morphodynamic effects of artificial dune construction along a barrier island coastline.
Journal of Coastal Research 27(5):918–930. West Palm Beach (Florida), ISSN 0749-0208.
http://www.jcronline.org/doi/abs/10.2112/JCOASTRES-D-10-00088.1 (accessed 15 January
2015).
Maryland Department of Natural Resources (MDNR). 2014. Assateague State Park. Available at
http://dnr2.maryland.gov/publiclands/Pages/eastern/assateague.aspx (accessed 17 September
2014).
Maryland State Roads Commission. 1962. Topographic Maps of Assateague Island, May 1962.
Project 62-2. Map series at scale of 1":100'.
Moore, L. J., P. Ruggiero, and J. H. List. 2006. Comparing mean high water and high water line
shorelines: should proxy-datum offsets be incorporated into shoreline change analysis?
Journal of Coastal Research 22(4):894–905.
Morgan, M. 2011. Ocean City: Going Down the Ocean. The History Press, Charleston, SC. 157
p.
Morton, R.A., Bracone, J.E., and Cooke, B. 2008. Geomorphology and depositional sub-
environments of Assateague Island, Maryland-Virginia. Scale 1:21,552. Open-file report OF-
2007-1388. U.S. Geological Survey, Reston, Virginia, USA. (GRI Source Map ID 75016).
National Aeronautics and Space Administration (NASA). 2010. Wallops Flight Facility shoreline
restoration and infrastructure protection program. Draft programmatic environmental impact
statement. Wallops Island, Virginia, USA.
35
National Oceanic and Atmospheric Administration (NOAA). 1991. Fenwick Island to
Chincoteague Inlet 12211 [map]. 1:80,000 with 1:20,000 inset. U.S. Department of
Commerce, National Oceanic and Atmospheric Administration National Ocean Service
Coast Survey.Washington, DC, USA.
NOAA. 2013. Sea Level Trends. Online database.
http://tidesandcurrents.noaa.gov/sltrends/sltrends.html (accessed 16 January 2015).
National Park Service (NPS). 2006. Management Policies 2006. National Park Service,
Washington, DC. http://www.nps.gov/policy/mp2006.pdf (accessed 2 February 2015).
NPS. 2012. Map of Assateague Island National Seashore. National Park Service, Harpers Ferry,
WV. http://www.nps.gov/asis/planyourvisit/upload/parkmap.pdf (accessed 2 February 2015).
Nordstrom, K. and N.L. Jackson. 2013. Removing shore protection structures to facilitate
migration of landforms and habitats on the bayside of a barrier spit. Geomorphology 199:
179-191. http://www.sciencedirect.com/science/article/pii/S0169555X12005314 (accessed
15 January 2015).
Oertel, G. F., and J. C. Kraft. 1994. New Jersey and Delmarva barrier islands. Pages 207–232 in
R. A. Davis, editor. Geology of Holocene barrier island systems. Springer-Verlag, Berlin,
Germany.
Parris, A., P. Bromirski, V. Burkett, D. Cayan, M. Culver, J. Hall, R. Horton, K. Knuuti, J. O. R.
Moss, A. Sallenger, and J. Weiss. 2012. Global Sea Level Rise Scenarios for the United
States National Climate Assessment. NOAA Technical Report OAR CPO-1. NOAA Climate
Office, Silver Spring, MD. 37 p.
http://scenarios.globalchange.gov/sites/default/files/NOAA_SLR_r3_0.pdf (accessed 15
January 2015).
Phillips, M. K. 2007. Assateague Beach Coast Guard Station Historic Structure Report. National
Park Service Northeast Region Historic Architecture Program, Lowell, MA, USA. Available
online: www.nps.gov/history/history/online_books/asis/coast_guard.pdf (accessed 23 March
2013).
Rice, T.M. 2014. Inventory of Habitat Modifications to Tidal Inlets in the U.S. Atlantic Coast
Breeding Range of the Piping Plover (Charadrius melodus) prior to Hurricane Sandy: South
Shore of Long Island to Virginia. Report prepared for U.S. Fish and Wildlife Service.
Terwilliger Consulting, Inc., Locustville, Virginia. 25 p.
Roman, C.T., and K.F. Nordstrom. 1988. The effect of erosion rate on vegetation patterns of an
east coast barrier island. Estuarine, Coastal and Shelf Science 26: 233-242.
Rosati, J.D. 2005. Concepts in sediment budgets. Journal of Coastal Research 21(2): 307–322.
Rosati, J. D., and B. A. Ebersole. 1996. Littoral impact of Ocean City Inlet, Maryland, USA.
Pages 2779–2792 in B. L. Edge, editor. Coastal engineering 1996: proceedings of the 25th
International Conference. American Society of Civil Engineers, Reston, Virginia, USA.
36
Sallenger, A. H., K. S. Doran, and P. A. Howd. 2012. Hotspot of accelerated sea-level rise on the
Atlantic coast of North America, Nature Clim. Change 2(12): 884-888.
doi:10.1038/nclimate1597.
http://www.nature.com/nclimate/journal/v2/n12/abs/nclimate1597.html (accessed 15 January
2015).
Schenck, T. W., B. Hulslander, J. Reed and N. T. Winn. In prep. Evaluation of Assateague
Island Restoration Project Sediment Bypassing. Natural Resource Technical Report
NPS/ASIS/NRTR—2015/XXX. National Park Service, Fort Collins, Colorado.
Schroeder, P. M., B. Hayden, and R. Dolan. 1979. Vegetation changes along the United States
east coast following the great storm of March 1962. Environmental Management 3(4):331–
338.
Schupp, C. 2007. North End Restoration Project Annual Report: 2004. Internal report.
Assateague Island National Seashore, Berlin, Maryland, USA.
Schupp, C. A., G. P. Bass, and W. G. Grosskopf. 2007. Sand bypassing restores natural
processes to Assateague Island National Seashore. Pages 1340–1353 in N. C. Kraus and J. D.
Rosati, editors. Proceedings of Coastal Sediments ’07. American Society of Civil Engineers,
Reston, Virginia, USA.
Schupp, C. 2010. North End Restoration Project Annual Report: 2009. Internal report.
Assateague Island National Seashore, Berlin, Maryland, USA.
Schupp, C. 2011. North End Restoration Project Annual Report: 2010. Internal report.
Assateague Island National Seashore, Berlin, Maryland, USA.
Schupp, C. 2013. Assateague Island National Seashore: geologic resources inventory report.
Natural resource report NPS/NRSS/GRD/NRR—2013/708. National Park Service, Fort
Collins, Colorado, USA.
http://www.nature.nps.gov/geology/inventory/publications/reports/asis_gri_rpt_view.pdf
(accessed 27 November 2013).
Schupp, C. A., N. T. Winn, T. L. Pearl, J. P. Kumer, T. J. B. Carruthers, and C. S. Zimmerman.
2013. Restoration of overwash processes creates piping plover (Charadrius melodus) habitat
on a barrier island (Assateague Island, Maryland). Estuarine, Coastal, and Shelf Science
116:11-20. http://www.sciencedirect.com/science/article/pii/S0272771412002648 (accessed
1 October 2012).
Schwab, W. C., E. R. Thieler, J. F. Denny, and W. W. Danforth. 2000a. Seafloor sediment
distribution off southern Long Island, New York. Open-file report 00-243. U.S. Geological
Survey, Woods Hole, Massachusetts, USA.
Schwab, W. C., E. R. Thieler, J. R. Allen, D. S. Foster, B.A. Swift, and J. F. Denny. 2000b.
Influence of inner continental shelf geologic framework on the evolution and behavior of the
barrier-island system between Fire Island Inlet and Shinnecock Inlet, Long Island, New
York. Journal of Coastal Research 16(2):408–422.
37
Stauble, D. K. 1994. A physical monitoring plan for northern Assateague Island, Maryland. U.S.
Army Engineer Waterways Experiment Station, Coastal Engineering Research Center,
Vicksburg, Mississippi, USA.
Stauble, D. K. 1997. Appendix A: ebb and flood shoal evolution. Ocean City, Maryland, and
vicinity water resources study, draft integrated feasibility report and environmental impact
statement. U.S. Army Corps of Engineers Baltimore District, Baltimore, Maryland, USA.
Sweet, W., J. Park, J. Marra, C. Zervas, and S. Gill. 2014. Sea Level Rise and Nuisance Flood
Frequency Changes around the United States. NOAA Technical Report NOS CO-OPS 073.
NOAA, Silver Spring, MD.
Thieler, E. R., A. L. Brill, W. J. Cleary, C. H. Hobbs III, and R. A. Gammisch. 1995. Geology of
the Wrightsville Beach, North Carolina shoreface: implications for the concept of shoreface
profile of equilibrium. Marine Geology 126:271–287.
Thieler, E.R., Pilkey, O.H., Young, R.S., Bush, D.M., Chai, F., 2000. The use of mathematical
models to predict beach behavior for coast engineering: a critical review. Journal of Coastal
Research 16, 48-70.
Underwood, S. G., and M. W. Hiland. 1995. Historical development of Ocean City Inlet ebb
shoal and its effect on northern Assateague Island. U.S. Army Engineer Waterways
Experiment Station, Coastal Engineering Research Center, Vicksburg, Mississippi, USA.
U.S. Army Corps of Engineers (USACE). 1986. History of coastal engineering projects at Ocean
City and Assateague Island, Maryland. Baltimore District Corps of Engineers, Department of
the Army, Baltimore, Maryland, USA.
USACE. 1998. Appendix D: restoration of Assateague Island. Ocean City, Maryland, and
vicinity water resources study final integrated feasibility report and environmental impact
statement. U.S. Army Corps of Engineers Baltimore District, Baltimore, Maryland, USA.
USACE. 2003. Appendix A, Glossary, in Coastal Engineering Manual. Engineer Manual. EM
1110-2-1100 (Change 1). USACE, Washington, DC.
http://www.publications.usace.army.mil/Portals/76/Publications/EngineerManuals/EM_1110
-2-1100_App_A.pdf (accessed 21 January 2015).
USACE. 2012. Ocean City Harbor & Inlet & Sinepuxent Bay, MD. Fact Sheet. U.S. Army Corps
of Engineers Baltimore District. Baltimore, Maryland, USA.
http://www.nab.usace.army.mil/Media/FactSheets/FactSheetArticleView/tabid/10470/Article
/9066/ocean-city-harbor-inlet-sinepuxent-bay-md.aspx (accessed 21 March 2013).
USACE. 2014. NASA Wallops Island Shoreline Stabilization Project. USACE, Norfolk, VA.
http://www.nao.usace.army.mil/About/Projects/NASAWallopsShoreline.aspx (accessed 21
January 2015).
U.S. Fish & Wildlife Service (USFWS). 2014. Appendix A The Proposed Assateague
Wilderness: Building Blocks for the Wilderness Character Monitoring Report. In:
38
Chincoteague and Wallops Island National Wildlife Refuges Draft Comprehensive
Conservation Plan and Draft Environmental Impact Statement. Chincoteague, VA.
http://www.fws.gov/uploadedFiles/Chincoteague%20and%20Wallops%20Island%20NWRs
%20Draft%20CCPEIS.pdf (accessed 20 January 2015).
Vasslides, J. M., and K. W. Able. 2008. Importance of shoreface sand ridges as habitat for fishes
off the northeast coast of the United States. Fishery Bulletin 106(1):93–107.
Wells, D. V., and R. Conkwright. 1999. The Maryland Coastal Bays sediment mapping project -
physical and chemical characteristics of the shallow sediments: synthesis report and atlas.
File report 99-5, HTML-format on CD-ROM. Maryland Department of Natural Resources,
Maryland Geological Survey, Coastal & Estuarine Geology Program, Baltimore, Maryland,
USA. http://www.mgs.md.gov/coastal/vmap/czmatlas/index.html (accessed 10 July 2012).
Williams, S. J. 2013. Sea-Level Rise Implications for Coastal Regions. Journal of Coastal
Research 63: Special Issue 63 - Understanding and Predicting Change in the Coastal
Ecosystems of the Northern Gulf of Mexico: 184 – 196. http://dx.doi.org/10.2112/SI63-015.1
(accessed 27 November 2013).
Zervas, C. 2001. Sea level variations of the United States 1854-1999. Technical report NOS CO-
OPS 36. National Oceanic and Atmospheric Administration, Silver Spring, Maryland, USA.
http://www.co-ops.nos.noaa.gov/publications/techrpt36doc.pdf (accessed 25 January 2012).
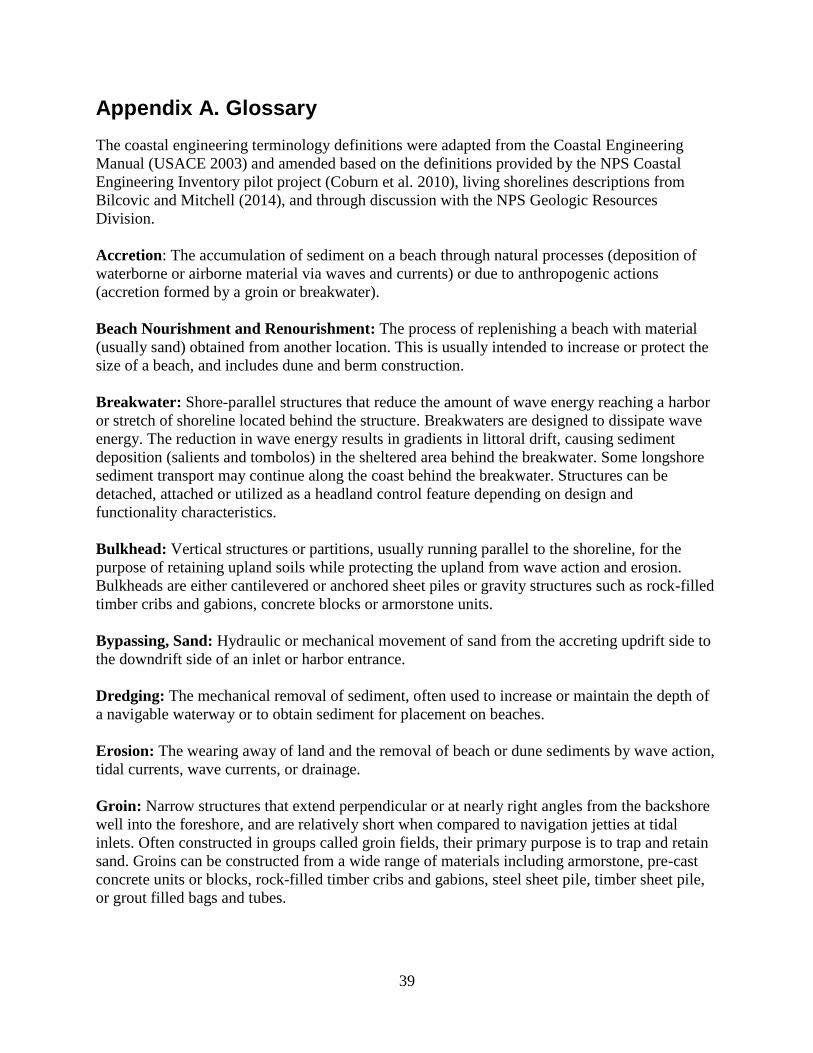
39
Appendix A. Glossary
The coastal engineering terminology definitions were adapted from the Coastal Engineering
Manual (USACE 2003) and amended based on the definitions provided by the NPS Coastal
Engineering Inventory pilot project (Coburn et al. 2010), living shorelines descriptions from
Bilcovic and Mitchell (2014), and through discussion with the NPS Geologic Resources
Division.
Accretion: The accumulation of sediment on a beach through natural processes (deposition of
waterborne or airborne material via waves and currents) or due to anthropogenic actions
(accretion formed by a groin or breakwater).
Beach Nourishment and Renourishment: The process of replenishing a beach with material
(usually sand) obtained from another location. This is usually intended to increase or protect the
size of a beach, and includes dune and berm construction.
Breakwater: Shore-parallel structures that reduce the amount of wave energy reaching a harbor
or stretch of shoreline located behind the structure. Breakwaters are designed to dissipate wave
energy. The reduction in wave energy results in gradients in littoral drift, causing sediment
deposition (salients and tombolos) in the sheltered area behind the breakwater. Some longshore
sediment transport may continue along the coast behind the breakwater. Structures can be
detached, attached or utilized as a headland control feature depending on design and
functionality characteristics.
Bulkhead: Vertical structures or partitions, usually running parallel to the shoreline, for the
purpose of retaining upland soils while protecting the upland from wave action and erosion.
Bulkheads are either cantilevered or anchored sheet piles or gravity structures such as rock-filled
timber cribs and gabions, concrete blocks or armorstone units.
Bypassing, Sand: Hydraulic or mechanical movement of sand from the accreting updrift side to
the downdrift side of an inlet or harbor entrance.
Dredging: The mechanical removal of sediment, often used to increase or maintain the depth of
a navigable waterway or to obtain sediment for placement on beaches.
Erosion: The wearing away of land and the removal of beach or dune sediments by wave action,
tidal currents, wave currents, or drainage.
Groin: Narrow structures that extend perpendicular or at nearly right angles from the backshore
well into the foreshore, and are relatively short when compared to navigation jetties at tidal
inlets. Often constructed in groups called groin fields, their primary purpose is to trap and retain
sand. Groins can be constructed from a wide range of materials including armorstone, pre-cast
concrete units or blocks, rock-filled timber cribs and gabions, steel sheet pile, timber sheet pile,
or grout filled bags and tubes.
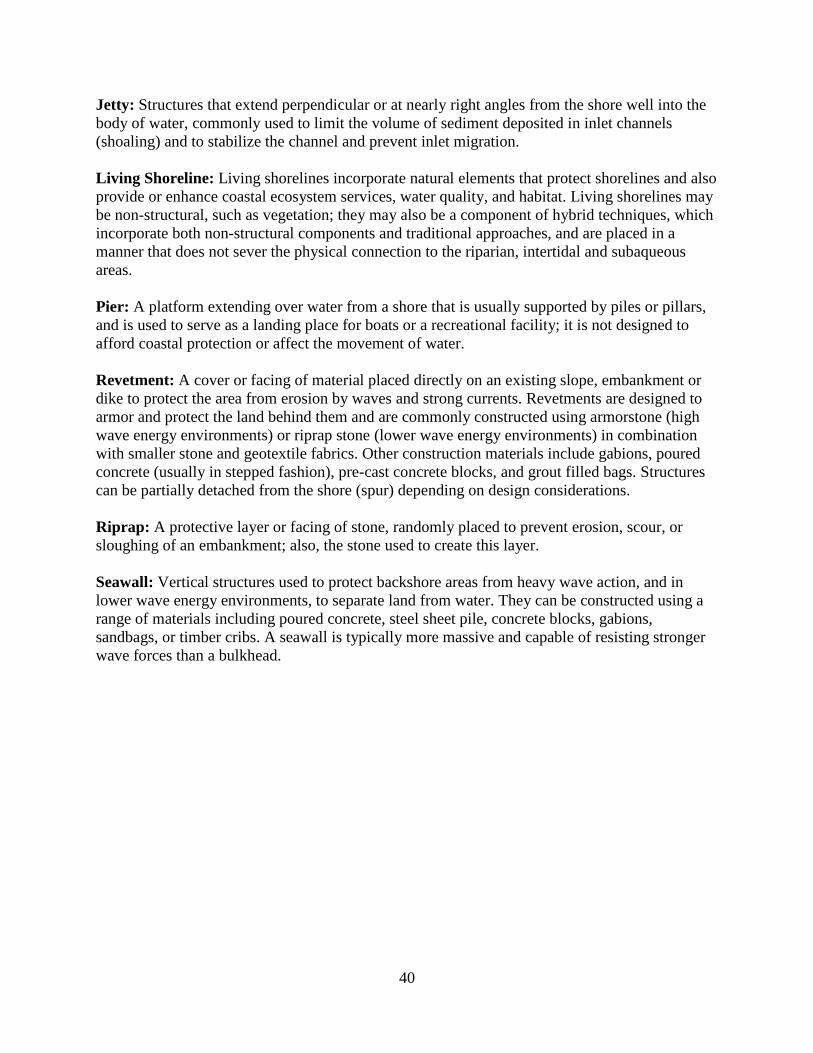
40
Jetty: Structures that extend perpendicular or at nearly right angles from the shore well into the
body of water, commonly used to limit the volume of sediment deposited in inlet channels
(shoaling) and to stabilize the channel and prevent inlet migration.
Living Shoreline: Living shorelines incorporate natural elements that protect shorelines and also
provide or enhance coastal ecosystem services, water quality, and habitat. Living shorelines may
be non-structural, such as vegetation; they may also be a component of hybrid techniques, which
incorporate both non-structural components and traditional approaches, and are placed in a
manner that does not sever the physical connection to the riparian, intertidal and subaqueous
areas.
Pier: A platform extending over water from a shore that is usually supported by piles or pillars,
and is used to serve as a landing place for boats or a recreational facility; it is not designed to
afford coastal protection or affect the movement of water.
Revetment: A cover or facing of material placed directly on an existing slope, embankment or
dike to protect the area from erosion by waves and strong currents. Revetments are designed to
armor and protect the land behind them and are commonly constructed using armorstone (high
wave energy environments) or riprap stone (lower wave energy environments) in combination
with smaller stone and geotextile fabrics. Other construction materials include gabions, poured
concrete (usually in stepped fashion), pre-cast concrete blocks, and grout filled bags. Structures
can be partially detached from the shore (spur) depending on design considerations.
Riprap: A protective layer or facing of stone, randomly placed to prevent erosion, scour, or
sloughing of an embankment; also, the stone used to create this layer.
Seawall: Vertical structures used to protect backshore areas from heavy wave action, and in
lower wave energy environments, to separate land from water. They can be constructed using a
range of materials including poured concrete, steel sheet pile, concrete blocks, gabions,
sandbags, or timber cribs. A seawall is typically more massive and capable of resisting stronger
wave forces than a bulkhead.
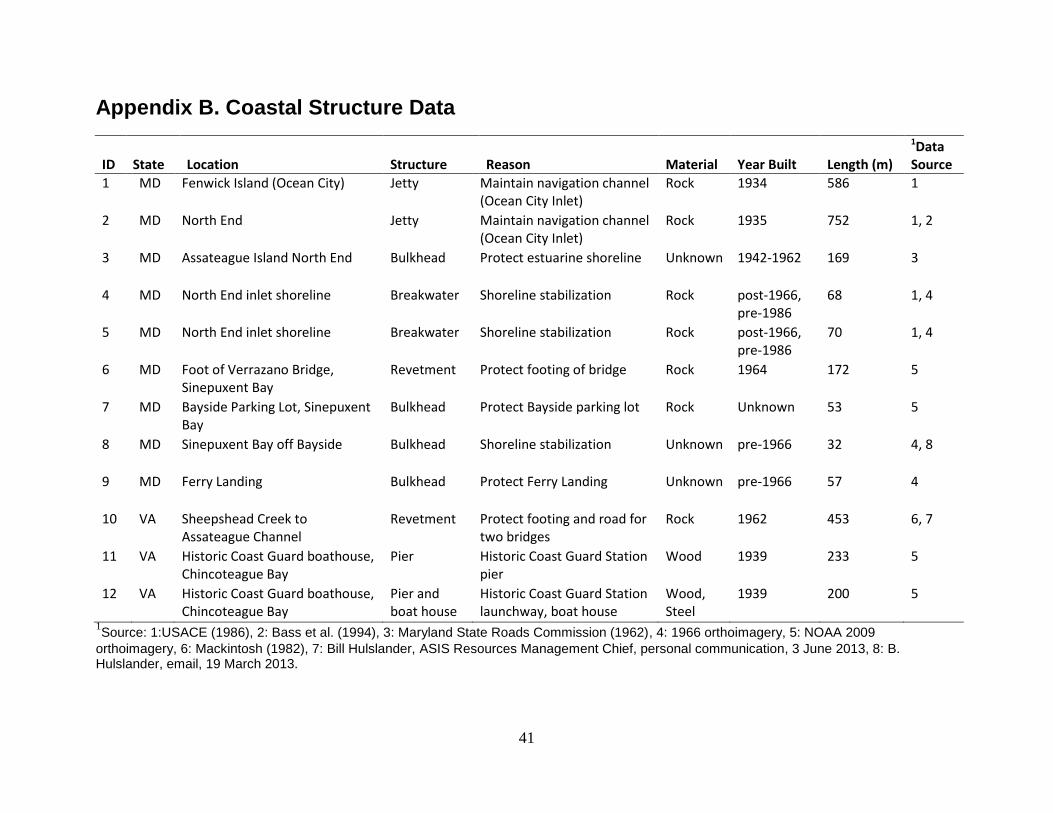
41
Appendix B. Coastal Structure Data
ID State Location Structure Reason Material Year Built Length (m)
1Data Source
1 MD Fenwick Island (Ocean City) Jetty Maintain navigation channel (Ocean City Inlet)
Rock 1934 586 1
2 MD North End Jetty Maintain navigation channel (Ocean City Inlet)
Rock 1935 752 1, 2
3 MD Assateague Island North End Bulkhead Protect estuarine shoreline Unknown 1942-1962 169 3
4 MD North End inlet shoreline Breakwater Shoreline stabilization Rock post-1966, pre-1986
68 1, 4
5 MD North End inlet shoreline Breakwater Shoreline stabilization Rock post-1966, pre-1986
70 1, 4
6 MD Foot of Verrazano Bridge, Sinepuxent Bay
Revetment Protect footing of bridge Rock 1964 172 5
7 MD Bayside Parking Lot, Sinepuxent Bay
Bulkhead Protect Bayside parking lot Rock Unknown 53 5
8 MD Sinepuxent Bay off Bayside Bulkhead Shoreline stabilization Unknown pre-1966 32 4, 8
9 MD Ferry Landing Bulkhead Protect Ferry Landing Unknown pre-1966 57 4
10 VA Sheepshead Creek to Assateague Channel
Revetment Protect footing and road for two bridges
Rock 1962 453 6, 7
11 VA Historic Coast Guard boathouse, Chincoteague Bay
Pier Historic Coast Guard Station pier
Wood 1939 233 5
12 VA Historic Coast Guard boathouse, Chincoteague Bay
Pier and boat house
Historic Coast Guard Station launchway, boat house
Wood, Steel
1939 200 5
1Source: 1:USACE (1986), 2: Bass et al. (1994), 3: Maryland State Roads Commission (1962), 4: 1966 orthoimagery, 5: NOAA 2009
orthoimagery, 6: Mackintosh (1982), 7: Bill Hulslander, ASIS Resources Management Chief, personal communication, 3 June 2013, 8: B. Hulslander, email, 19 March 2013.
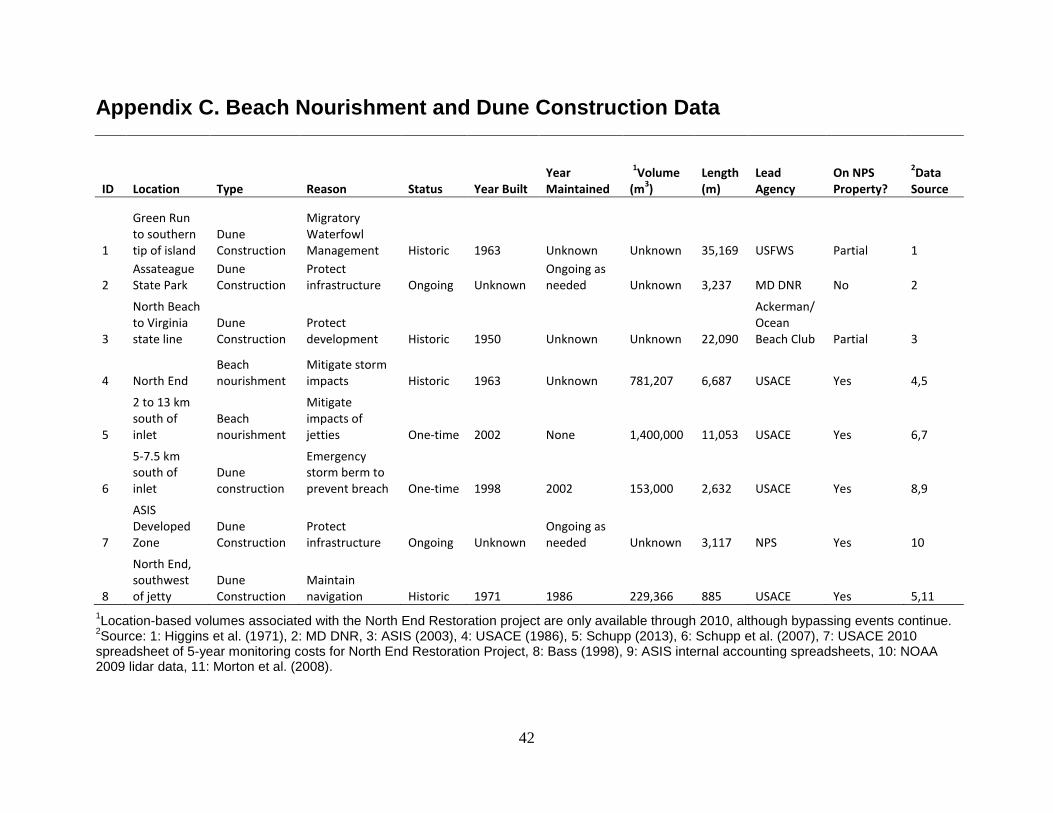
42
Appendix C. Beach Nourishment and Dune Construction Data
ID Location Type Reason Status Year Built Year Maintained
1Volume
(m3)
Length (m)
Lead Agency
On NPS Property?
2Data
Source
1
Green Run to southern tip of island
Dune Construction
Migratory Waterfowl Management Historic 1963 Unknown Unknown 35,169 USFWS Partial 1
2 Assateague State Park
Dune Construction
Protect infrastructure Ongoing Unknown
Ongoing as needed Unknown 3,237 MD DNR No 2
3
North Beach to Virginia state line
Dune Construction
Protect development Historic 1950 Unknown Unknown 22,090
Ackerman/Ocean Beach Club Partial 3
4 North End Beach nourishment
Mitigate storm impacts Historic 1963 Unknown 781,207 6,687 USACE Yes 4,5
5
2 to 13 km south of inlet
Beach nourishment
Mitigate impacts of jetties One-time 2002 None 1,400,000 11,053 USACE Yes 6,7
6
5-7.5 km south of inlet
Dune construction
Emergency storm berm to prevent breach One-time 1998 2002 153,000 2,632 USACE Yes 8,9
7
ASIS Developed Zone
Dune Construction
Protect infrastructure Ongoing Unknown
Ongoing as needed Unknown 3,117 NPS Yes 10
8
North End, southwest of jetty
Dune Construction
Maintain navigation Historic 1971 1986 229,366 885 USACE Yes 5,11
1Location-based volumes associated with the North End Restoration project are only available through 2010, although bypassing events continue.
2Source: 1: Higgins et al. (1971), 2: MD DNR, 3: ASIS (2003), 4: USACE (1986), 5: Schupp (2013), 6: Schupp et al. (2007), 7: USACE 2010
spreadsheet of 5-year monitoring costs for North End Restoration Project, 8: Bass (1998), 9: ASIS internal accounting spreadsheets, 10: NOAA 2009 lidar data, 11: Morton et al. (2008).
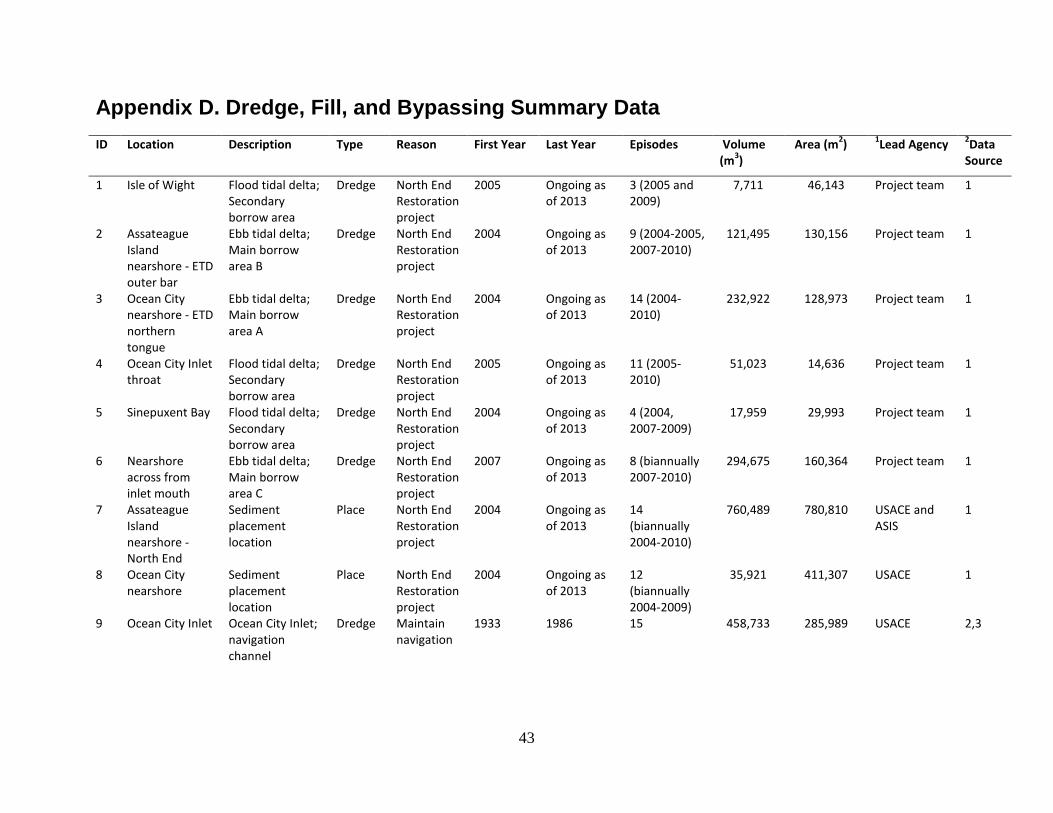
43
Appendix D. Dredge, Fill, and Bypassing Summary Data
ID Location Description Type Reason First Year Last Year Episodes Volume (m
3)
Area (m2)
1Lead Agency
2Data
Source
1 Isle of Wight Flood tidal delta; Secondary borrow area
Dredge North End Restoration project
2005 Ongoing as of 2013
3 (2005 and 2009)
7,711 46,143 Project team 1
2 Assateague Island nearshore - ETD outer bar
Ebb tidal delta; Main borrow area B
Dredge North End Restoration project
2004 Ongoing as of 2013
9 (2004-2005, 2007-2010)
121,495 130,156 Project team 1
3 Ocean City nearshore - ETD northern tongue
Ebb tidal delta; Main borrow area A
Dredge North End Restoration project
2004 Ongoing as of 2013
14 (2004-2010)
232,922 128,973 Project team 1
4 Ocean City Inlet throat
Flood tidal delta; Secondary borrow area
Dredge North End Restoration project
2005 Ongoing as of 2013
11 (2005-2010)
51,023 14,636 Project team 1
5 Sinepuxent Bay Flood tidal delta; Secondary borrow area
Dredge North End Restoration project
2004 Ongoing as of 2013
4 (2004, 2007-2009)
17,959 29,993 Project team 1
6 Nearshore across from inlet mouth
Ebb tidal delta; Main borrow area C
Dredge North End Restoration project
2007 Ongoing as of 2013
8 (biannually 2007-2010)
294,675 160,364 Project team 1
7 Assateague Island nearshore - North End
Sediment placement location
Place North End Restoration project
2004 Ongoing as of 2013
14 (biannually 2004-2010)
760,489 780,810 USACE and ASIS
1
8 Ocean City nearshore
Sediment placement location
Place North End Restoration project
2004 Ongoing as of 2013
12 (biannually 2004-2009)
35,921 411,307 USACE 1
9 Ocean City Inlet Ocean City Inlet; navigation channel
Dredge Maintain navigation
1933 1986 15 458,733 285,989 USACE 2,3
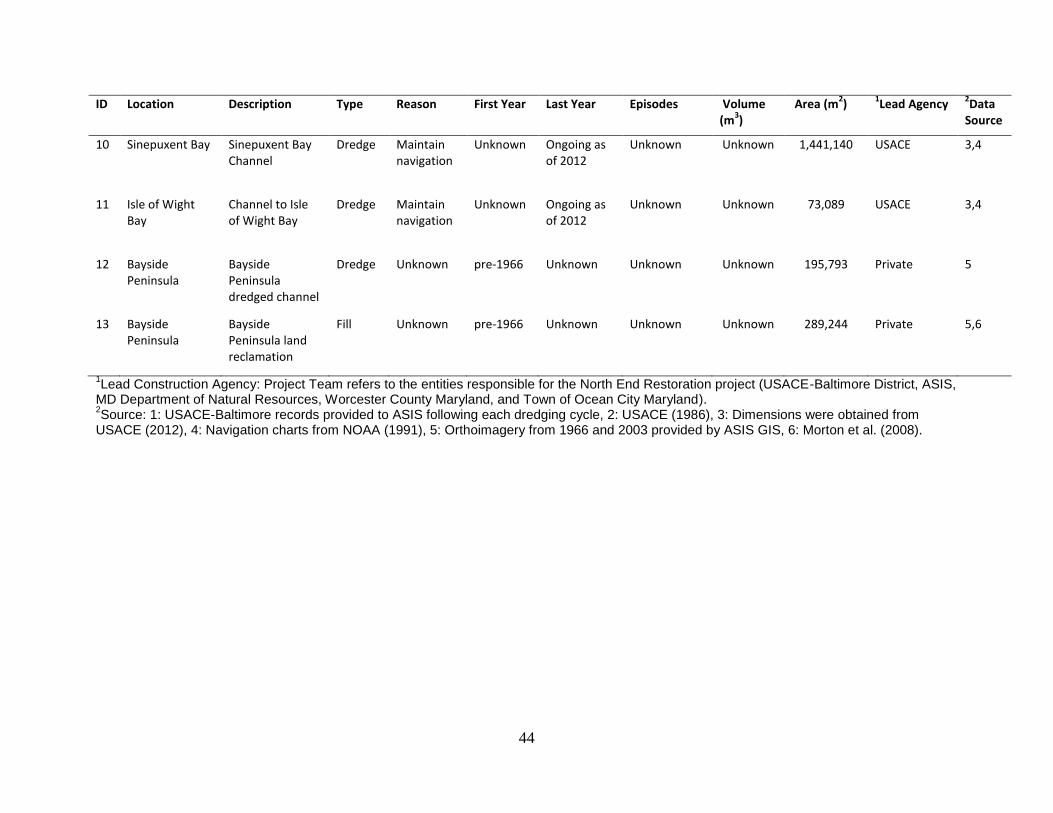
44
ID Location Description Type Reason First Year Last Year Episodes Volume (m
3)
Area (m2)
1Lead Agency
2Data
Source
10 Sinepuxent Bay Sinepuxent Bay Channel
Dredge Maintain navigation
Unknown Ongoing as of 2012
Unknown Unknown 1,441,140 USACE 3,4
11 Isle of Wight Bay
Channel to Isle of Wight Bay
Dredge Maintain navigation
Unknown Ongoing as of 2012
Unknown Unknown 73,089 USACE 3,4
12 Bayside Peninsula
Bayside Peninsula dredged channel
Dredge Unknown pre-1966 Unknown Unknown Unknown 195,793 Private 5
13 Bayside Peninsula
Bayside Peninsula land reclamation
Fill Unknown pre-1966 Unknown Unknown Unknown 289,244 Private 5,6
1Lead Construction Agency: Project Team refers to the entities responsible for the North End Restoration project (USACE-Baltimore District, ASIS,
MD Department of Natural Resources, Worcester County Maryland, and Town of Ocean City Maryland). 2Source: 1: USACE-Baltimore records provided to ASIS following each dredging cycle, 2: USACE (1986), 3: Dimensions were obtained from
USACE (2012), 4: Navigation charts from NOAA (1991), 5: Orthoimagery from 1966 and 2003 provided by ASIS GIS, 6: Morton et al. (2008).

The Department of the Interior protects and manages the nation’s natural resources and cultural heritage; provides scientific and
other information about those resources; and honors its special responsibilities to American Indians, Alaska Natives, and affiliated
Island Communities.
NPS XXXXXX, January 2013
The Department of the Interior protects and manages the nation’s natural resources and cultural heritage; provides scientific and
other information about those resources; and honors its special responsibilities to American Indians, Alaska Natives, and affiliated
Island Communities.
NPS 622/127910, February 2015
National Park Service U.S. Department of the Interior
Natural Resource Stewardship and Science
1201 Oakridge Drive, Suite 150 Fort Collins, CO 80525 www.nature.nps.gov
EXPERIENCE YOUR AMERICA TM
EXPERIENCE YOUR AMERICA TM