Embed Size (px)
Citation preview

INVENTORY MANAGEMENT OF MANUFACTURING INDUSTRIES
IN NEPAL: WITH REFERENCE TO HIM SHREE FOODS INDUSTRIES
PVT. LTD.
By
PARAG MUNAKARMI
PRITHVI NARAYAN CAMPUS
T.U. Regd. No. 7-1-297-0140-96
Campus Roll No: 63/061
A Thesis Submitted to:
Department of Management Research
Faculty of Management
Prithvi Narayan Campus
Tribhuvan University
In partial fulfillment of the requirement for the Degree of Master of Business Studies (M.B.S)
Pokhara, Nepal
July, 2011

2
RECOMMENDATION
This is to certify that the Thesis
Submitted by:
PARAG MUNAKARMI
Entitled:
INVENTORY MANAGEMENT OF MANUFACTURING INDUSTRIES IN NEPAL:
WITH REFERENCE TO HIM SHREE FOODS INDUSTRIES PVT. LTD.
has been prepared as approved by this Department in the prescribed format of the
Faculty of Management. This thesis is forwarded for examination.
………………………
Dr. Puspa Raj Sharma
Head of Research Department
………………………… .……….….…….………
Mr. Bir Bahadur Karki Gehendrashwor Koirala
(Thesis Supervisor) (Campus Chief)

3
VIVA-VOCE SHEET
We have conducted the viva –voce examination of the thesis presented
By
PARAG MUNAKARMI
Entitled:
INVENTORY MANAGEMENT OF MANUFACTURING INDUSTRIES IN NEPAL:
WITH REFERENCE TO HIM SHREE FOODS INDUSTRIES PVT. LTD.
And found the thesis to be the original work of the student and written
according to the prescribed format. We recommend the thesis to
be accepted as partial fulfillment of the requirement for
Master Degree of Business Studies (M.B.S.)
Viva-Voce Committee
Head, Research Department …………………….………
Member (Thesis Supervisor) …..………………………..
Member (External Expert) …..………………………..…
Member ……………………………

4
ACKNOWLEDGEMENT
This thesis entitled “Inventory Management of Manufacturing Industries in
Nepal: With Reference to Him Shree Foods Industries Pvt. Ltd.” has been prepared
for the partial fulfillment of the requirement of Masters Degree of Business Studies
(M.B.S.) under Faculty of Management, Tribhuvan University.
I would like to extent my heartily and propounded gratitude of my respected
supervisor Mr. Bir Bahadur Karki, Lecturer, Prithivi Narayan Campus, Pokhara for his
incessant inspiration, guidance and support without which this thesis would not have
been completed. Likewise, my sincere gratitude goes to my respected teachers of PNC
for their assistance in the preparation of thesis proposal and collection of various
materials and references required for the completion of this thesis.
My special thanks to all the members of Regional library of PNC and other
faculty members of management in PNC for their support. I would also like to give
special thanks to staff of Him Shree Foods for support and providing required
information during the preparation of this thesis. I express my thanks to all of my friends
for supporting me during of thesis writing.
I am much thankful to all personalities whose work and ideas have been directly
or indirectly utilize in this thesis.
PARAG MUNAKARMI

5
TABLE OF CONTENTS
Page
Acknowledgment List of Table List of Figure Abbreviations CHAPTER I. INTRODUCTION
1.1 Background 1 1.2 Focus of the Study 4 1.3 Statement of Problem of the Study 4 1.4 Objectives of the Study 5 1.5 Significance of the Study 5 1.6 Limitations of the Study 6
1.7 Organization of the Study 7 CHAPTER II. REVIEW OF LITERATURE 2.1 Conceptual and Theoretical Review 8 2.2. Review of Related Studies 36 2.3 Research Gap 37
CHAPTER III. RESEARCH METHODOLOGY
3.1 Introduction 39 3.2 Research Design 39 3.3 Population and Sample Size 39 3.4 Source of Data 39 3.5 Data Collection Techniques 40 3.6 Methods of Data Analysis 40 3.7 Limitation of Methodology 41 CHAPTER IV. PRESENTATION AND ANALYSIS OF DATA 4.1 Presentation and Analysis of Data 43 4.2 Major Findings 60 CHAPTER V. SUMMARY, CONCLUSSIONS AND RECOMMENDATIONS
5.1 Summary 62 5.2 Conclusion 63 5.3 Recommendation 64

6
BIBLIOGRAPHY APPENDIX

7
LIST OF TABLES
Table No. Title Page
4.1 Proportion of Raw Materials on Total Inventory 44
4.2 Proportion of Finished Goods on Total Inventory 45
4.3 Calculation on Inventory Turnover Ratio 47
4.4 Calculation of Inventory Conversion Period 48
4.5 Annual demand of Maida 49
4.6 Trial and Error Method 51
4.7 Annual Demand of Palm Oil 52
4.8 Calculation of EOQ of Pal oil under Trial and Error Method
for the year 2064/065 54
4.9 Annual Demand of Gluten 54
4.10 Calculation of EOQ of Gluten under Trial and Error Method 56
4.11 Categorization of raw materials inventory according to
ABC analysis 57

8
LIST OF FIGURES
Figure No. Title Page
2.1 Graphical Approach of EOQ 24
2.2 Graphical Presentation of ABC Analysis 29
4.1 Level of Raw Materials on Total Inventory 44
4.2 Level of Finished Goods on Total Inventory 46
4.3 Annual Demand of Maida for last five years period 50
4.4 Annual Demand of Palm Oil for Last Five Years Period 52
4.5 Annual Demand of Gluten for the Last Five Years Period 55

9
ABBREVIATION
ABC : Always Better Control
AI : Average Inventory
EOQ : Economic Order Quantity
FIFO : First in First Out
HSF : Him Shree Foods
ICP : Inventory Conversion Period
ITR : Inventory Turnover Ratio
JIT : Just in Time
LIFO : Last in First Out
Ltd. : Limited
Pvt. : Private
ROL : Re-order Level
TC : Total Cost
TCC : Total Carrying Cost
TOC : Total Ordering Cost
10
CHAPTER 1
INTRODUCTION
1.1 Background
Nepal is a landlocked and one of the least developing country in the world, which
is still in its crawling stage of industrial development. Industrialization is one of the
major activities, which can play an important role in economic development of a country.
More than 80% of Nepalese peoples are dependent on agriculture. Therefore it is easy to
say that there is very weak participate in investment as a result, industrial activities as
well as trade of business are very limited in Nepal.
For the rapid development of developing countries like Nepal, development in
agriculture sector is not sufficient. It is essential to develop industrial sector too.
Industries have important role to play in accelerating rate of economic development. At
certain stage of country‟s development, the highest return may come from production of
particulars types of manufactures, agriculture products and services. How to use
resources at any time depends on market prospects and cost. So the interesting question is
not how fast the country can be industrialized, but how incentive policies rules and
regulation are designed so that new industries make the maximum contribution to the
country‟s development. The foundation stone of modern factory system was laid only in
1992 B.S. Under the company act 1993 B.S. marked the beginning of organized industry
in the country. Nepal Bank Limited was established in 1994 B.S. It is the first bank in
Nepal. Under the company Act 1993 few other industries were established. Industries like
Jute mills, cotton mills, match factory, sugar mills, textile, furniture, plywood factory etc
were established in different sector.
As the study concentrates over inventory management study followed in Him
Shree Foods Pvt. Ltd, it is necessary to know what is inventory, what types of inventory
management tools are used in the company and what is the role of inventory for the
smooth operation of the company and its influence on profit.
As industries are growing in number, the number of manufacturing organization is
also increasing. Domestic industries are not able to meet the local demand due to
11
insufficient production. Hence the established company has its own production and
market plan schedule. The purpose of manufacturing company is to change and to
process materials which serves in different way to satisfy various requirement of human
being converting the commodities into a more useful form.
The different type of materials or goods held by the company for the future
use/sales is known as inventory. Inventory form a link between production and sales of
product. These raw materials have been purchased and store for the future producing,
work in progress refers semi-manufactured products or the stocks which are not yet
completely manufacture products which are ready for sale and supplies include office and
plant cleaning materials. Stock of raw materials and work in progress facilitate
production, while stock of finished goods is requirement for smooth marketing operation.
Thus, inventories serve as a link between the production and consumption.
Inventory constitutes the most significant part of current assets of large majority
of companies. Because of large size of inventory maintained by firms, a considerable
amount of fund is required to be committed to them. It is therefore, absolutely imperative
to manage inventories efficiently and effectively in order to avoid unnecessary
investment. A firm neglecting the management of inventories will be losing its long run
profitability and may fail ultimately. Hence an optimum level of inventory should be
determined in the basis of trade off between the cost benefits associated with the level of
inventory. In this competitive world profit can be determined by only reducing costs. So,
the cost should be minimized and production should be maximized. For strengthening the
economy of the country, both the private and the public sectors should play a great role.
This is realized in our context too, most of the manufacturing industries hold the large
size inventory. It is possible for a company to reduce its level of inventories to a
considerable degree with-out any adverse effect in production and sale by using simple
inventory planning techniques.
Inventory management is a topic of considerable and wide spread interest. There
are various scientific techniques to the solution of variety of inventory management.
Broadly speaking the inventory management problem is one of the main concerns for a
given financial investment. It is primarily concerned with minimizing the investment in

12
inventory. Maintaining a desired level of inventory and financial dimension, inventory
should be effectively managed. The real task of top management lies in formulation
policies that will lead to optimal investment for attainment of desired objectives.
Food is the essential element for human. In Nepal, no many food industries have
been established since 1993-2065 starting from simple rice mills. Now a days it has
developed into noodles industries. So many noodles industries are established in Nepal,
one of them is „Gandaki Noodles Industries‟.
Indian fast food products had taken market before the establishment of Gandaki
Noodles Pvt. Ltd. in Pokhara as well as Nepal. The idea about the instant noodles brought
by Pharindra Man Shrestha for the first time in Nepal was implemented by Gandaki
Noodles Pvt. Ltd. established in Magh 2039 B.S. with the initial capital of Rs. 70
millions. This was the first company to introduce tasty and easy to eat instant noodles
with „RARA‟ brand name.
In the year 1994 A.D., the founder of Gandaki Noodles has an interest to
established seasoned noodles industry to meet the Nepalese taste. They are established
another noodles manufacturing company namely Everest Noodles Pvt. Ltd. Everest
noodles was well equipped and fully automatic machinery, which was able to produce
seasoned noodles. The company was established with the technical know how of world
famous machine manufacturing company “Suzuki Menko Company”, Japan with bigger
production capacity. In the beginning, it started production of seasoned noodles namely
„Aaha‟ and marketed successfully all over Nepal, Bhutan, North Bengal, Assam and
other parts of Africa.
In the year 1999 A.D. a world famous noodles manufacturing machine was
imported from Fuji manufacturing company limited, Japan with giant capacity of 150,000
packets per shift of eight hours under the name of Him Shree Foods Pvt. Ltd. This
production house was established in order to meet the huge market demand of noodles
with various tastes.
In the year 2002 A.D., both the previous noodles producing house Gandaki
Noodles Pvt. Ltd. and Everest Noodles Pvt. Ltd. were merged, with the initial capacity of
150 millions rupees which named Him Shree Foods Pvt. Ltd. While merging the two

13
companies, the management also changed the founding member and formed a new board
of directors.
1.2 Focus of the Study
There are many factors for success of any business. One of the important factor is
the inventory management. Inventory occupies substantial capital of the company and
hence effective inventory management is important for the success of the business.
Inventory Management is important in manufacturing industries as these industries needs
to keep inventories for smooth running of the business. To be more specify this study
focus has been taken on the inventory management of Him Shree Foods Industries Pvt.
Ltd.
1.3 Statement of Problem of the Study
Unscientific inventory management is one of the most important cause to effect
adversely on profit. Most of the Nepalese organizations, either private or public are
victim of that. Effective and efficient inventory management system can only yield
expected profit of the organization. It should be balanced; both excessive and inadequate
inventories are not desirable. Inventory should be in optimum level.
Especially after the restore of democracy many manufacturing industries were
established under the Company Act but due to the many reasons they went into
liquidation or stopped production. One of the most important reason is lack of study on
effective and efficient inventory management tools and techniques for inventory control.
Due to the lack of study of inventory management, huge amount of money invested in
inventory. How much money should the company invested in the inventory, how much
inventory to be stocked, how can minimized the inventory cost, how much is to be EOQ,
how many times the order be placed are the some questions that evoke the management
always.
Nepal is a landlocked country. It has to depend upon India and China for each and
every thing. Industrialization in Nepal is not satisfactory as it needs to be. Manufacturing

14
companies facing many types of problems such as well management techniques, skilled
manpower, well quality control, raw materials scarcity and out dated technology. For the
noodles manufacturing industry, raw materials like palm oil, chicken soup and wrapper
etc. have to be imported from India and China. Due to this it is more difficult to manage
the inventories of the noodles manufacturing industry than other product manufacturing
industries.
In Nepal, so many studies have been done regarding inventory management of
trading organization but finger countable studies have been done about the inventory
management of noodles industries. It is very important because the success of the noodles
industry depends upon the well management of the inventory.
Management of every organization is working against risk and uncertainty. So,
they should play vital role in deciding various decision including inventory. Over
stocking of inventory increases the carrying cost and decrease the opportunity. The over
stocking and under stocking of inventory can be solved with well inventory management.
For long term goodwill of the company, the present research will be focused on
answering the following research question.
1. Who are the authorized persons for the inventory management?
2. What is the present position of inventory?
3. How does the company maintain its stocks?
4. What types of inventory management techniques are used?
1.4 Objectives of the Study
The basic objective of this study is to analyze and examine the present position of
inventory management of Him Shree Foods Pvt. Ltd. The specific objectives are as
follows:
1. To analyze the present position of inventory management of the company.
2. To analyze the materials procurement techniques.
3. To find out and analyze the techniques of inventory management used by the
company.

15
1.5 Significance of the Study
Managing of the inventory is challenging task for any noodles manufacturing
industry. Inventory management is topic of considered and wide spread interest.
Inventory management has been facing problem of effective handling of inventory.
Inventory management is one of the important functions of any organization.
Without an effective and efficient inventory management system no one manufacturing
company achieve goal. Proper inventory management helps to maximize the profit of the
firm. A slight change on the cost of materials will bring about a great change in the
company‟s profit. Each and every manufacturing organization has to closely watch the
inventory activities because it is important element of the company. If the company
ignores the inventory management or does not observe the inventory regularly then the
company will be suffering in major trouble in production process. The importance of
inventory management can be better realized by understanding the cost prize increased in
purchasing, shipping, handling and storing the materials and controlling the inventories.
Purchase of quality materials at economic rate and maintain adequate quantity in the
stock is the prime goal of inventory management. Inventory management focused to
reduce loss from misusages.
Him Shree Foods Pvt. Ltd. is one of the largest noodles manufacturing industries
in Nepal, it has been producing various types of noodles in various taste according to the
consumer‟s demand. To produce various brand and taste of noodles the industry has to
face several challenges for inventory management, which is directly affected the
production process. So many brand and taste has needed several types of raw materials
have to be imported, stored and utilized. To handle several types of raw materials the
company has to face more challenges for inventory management. So, to overcome the
problems, this study is focused in analyzing the inventory management of the Him Shree
Foods Pvt. Ltd. Not only Him Shree Foods Pvt. Ltd. this study will be helpful to other
noodles manufacturing industries and research students.
1.6 Limitations of the Study

16
As every research has its own limitation, this study is not biased. The following
consideration has been excluded from the study to bond the scope of the study to a certain
level which is necessary.
1. This Study has been carried out for Partial fulfillment of Master‟s Degree,
Faculty of Management; T.U. So, the time efforts and resources are major
limitation of the study.
2. This study basically mentioned in the points and deal with the inventory
management of Him Shree Foods Pvt. Ltd.
3. This study covers the five (5) years periodic data which includes Fiscal
years 2060/061 to 2064/065.
4. The study is more specific in inventory management.
5. This study is only a case study hence the conclusion drawn from the study
may not ensure wide applicability in all types of noodles industries running
in different sector and situation.
6. Major portion of the analysis and interpretation have been done on the basis
of available secondary data and information.
1.7 Organization of the Study
This study is organized into five (5) chapters. Each chapter has its importance and
deals with important aspect of the study.
1. Introduction
The first chapter deals with introduction. This chapter includes introduction,
statement of the problems, objective of the study, significance of the study, limitation of
study.
2. Review of the Literature
Review of the literature means reviewing research studies or the pertinent
preposition in the related area of the study so that all the past studies, their conclusion and
deficiencies may be known and further research can be conducted.
17
3. Research Methodology
This part deals with introduction, research design, nature and sources of data, data
collection techniques and method of data analysis.
4. Analysis and Presentation of Data
This part deals with presentation and analysis of data by using inventory model like
EOQ, ABC Analysis, ROL and statistical tools.
5. Summary, Conclusion and Recommendation
This chapter deals about summary and findings based in the facts and analysis
presented in the fourth chapter. On the basis of this study; various recommendation and
suggestion also have been presented for consideration.
CHAPTER II
REVIEW OF LITERATURE
2.1 Conceptual and Theoretical Review
2.1.1 Background
The business world today is entirely different from the one in the past. Every
business organization today operates in a competitive environment. In a competitive
business world, firms must utilize resource in the most productive ways so that they can
survive and live up to the exception of consumers, societies, employees and the
government. (Pradhan, 2004 P. 362) To use the available resources in a proper way, an
organization has to plan and manage it‟s various organizational activities. Inventory is
one of the most important item of current assets remain with any business firm which
plays significant role on efficient management of the organization. Inventories form a
link between production and sales of a product. A noodles manufacturing company must
maintain a certain amount of inventory during producing, supply and distribution.

18
2.1.2 Meaning of Inventory
The stock of different types of consumable goods held by an organization is
called inventory. Inventory is one of the most important assets to many organizations.
Large percentage of total capital is invested in inventory. So, the inventory is vital
element in the effort of the firm to achieve desired of sales.
The stock of the items of goods kept in reserve for certain period or time is called
inventory. Inventory is the materials kept on hand either to make refers to the goods and
or materials used by a firm for the purpose of production and sale. It is also includes the
items which are used as supportive materials to facilitate production. (Weston and
Copeland, 1992 P. 84)
The literacy meaning of the word inventory is stock of goods. All movable items
in store either ready for sale or for consumption in the course of production with a view
to convert then into finished stocks for sale. Thus, inventory includes stock of raw
materials, work in progress and finished good. (Pradhan, 2004, P. 362)
The dictionary meaning of inventory is stock of goods or list of goods. Various
authors understand the word inventory differently. In accounting language, it may mean
stock of finished goods only. In a manufacturing concern, it may include raw materials,
work in progress and store etc. To understand the exact meaning of the word inventory,
we may study it from the usage side or from the side of point of entry in the operations.
(Sharma and Gupta, 1984 P. 22.22)
Inventory refers to the physical stock of goods which though remain idle in a store
but is essential for smooth sailing of the company and hence has economic value.
(Kothari, 1996 P. 372)
According to Encyclopedia of management, “inventory is a quantity or store of
goods which is held for some purpose or use inventory may be kept „in house‟, meaning
on the premises or nearby for immediate use; or in may be held in a distant warehouse or
distribution center for future use. More often than not, the term inventory implies a stored
quantity of goods, which exceeds that needed for the firm to function at the current time.”
Inventory is storage of goods and stocks. Items in inventories are stock keeping
items held at stock point. In manufacturing company, inventory refers raw materials,

19
components, supplies, work in progress and finished goods. In service organization, it
includes the tangible items to be sold and used for day to day operations. (Regmi, Joshi,
Chaudhary and Fago 2003, P. 84)
Inventory in wider sense is defined as any idle resources of an enterprise. It is
commonly used to indicate materials raw, in process and finished packaging spares and
other stocked in order to meet an expected demand of distribution in the future. Even
though, inventory of materials is an idle resources in sense it is not meant for immediate
use, it is almost necessary to maintain some inventories for smooth function of the
organizations. Inventory is made of all those items ready for sale or of items, which keeps
the process running.
In fact, inventory refers to the stock of all those current assets, which are
involving in production and supply of physical goods. Without adequate stock of raw
materials it is impossible to maintain sufficient work in progress goods, it is impossible to
maintain stock of finished goods, which are needed in future course of business.
Inventories also consist of stock of spares, parts and furls etc. that will be needed in
smooth operation of plants and machineries. Inventories are idle but valuable to meet
future supply and demand.
Every organization, either it is service or manufacturing should maintain optimum
size of inventories for the smooth operation and to meet the consumer demand. Under
stock or over stock of inventories may cause increase of opportunity costs. Therefore, an
organization has to implement scientific and convenient inventory control system to
avoid the problems of stock out and over stock of inventories
2.1.3 Types of Inventory
Inventory is defined as a stock or store of goods. These goods are maintained on
hand at or near a business‟s location so that the firms may meet demand and fulfill its
reason for existence. If the firm is a retail establishment, a consumer may look elsewhere
to have his or her needs satisfied, if the firm does not have the required item in stock
when the customer arrives. If the firms are a manufacturer, it must maintain some

20
inventory of raw materials and work in progress in order to keep the factory running and
it must maintain some supply of finished goods in order to meet demand.
The level of three kinds of inventories for a firm depends on the nature of its
business. A manufacturing firm will have substantially high level of all three kinds of
inventories, while a retail or wholesale firm will have a very high level of finished goods
inventories and no raw materials and work in progress inventories. Within manufacturing
firm there will be difference. Large heavy engineering companies produce long
production cycle products. Therefore, they carry large inventories. On the other hand
inventories of consumer product company will not be large because of short production
cycle and fast turnover. (Pandey 1994, P. 884)
2.1.3.1 Raw Materials
Raw materials are those basic inputs, which are generally purchased from outside
and are converted into finished goods through the production process.
Raw Materials are inventory items, which are used to in the manufacturer‟s
conversion process to produce components, subassemblies or extracted materials that the
firm or its subsidiary has produced or extracted himself. They may also be objects or
elements that the firm has purchased from outside the organization. Even if the item is
partially assembled or is considered a finished goods to the supplier, the purchaser may
classify it as a raw material if his/her firm had no input its production. Typically we
regard raw materials as being things such as commodities like ore, grain, minerals,
petroleum, chemicals, papers, woods, paints, steels and food items. However, such items
as nuts and bolts, ball bearings, key stock, casters, seats, wheels and even engines may be
regarded as raw materials if purchased from outside the firm.
2.1.3.2 Work in Process
Work in process is made up of all the materials, parts (components), assemblies
and subassemblies that are being processed or are waiting to the processed within the
system. This generally includes all materials from raw materials that has been related for
21
final processing up to material that has been released for initial processed and is awaiting
final inspection and acceptance before it can be included in finished goods.
Work in process refers to the inventories that have been committed to the
production process but still have not been converted into finished goods. Work in process
are regarded as the semi finished goods, which are still in various stage of production,
where as other may be in the nearer stage of completion. Inventory that is in process at
different stages of completion are also consideration to be necessary for smooth flow of
regular production. (Weston and Copland 1992, P. 416)
The nature of work in process depends upon the nature of production. For
example, in the Iron industries, melted iron to make different form of iron is the work in
process. In the noodles manufacturing industry, there is not work in process.
2.1.3.3 Finished Goods
A finished good is a completed part that is now ready for customer order.
Finished goods inventory, then it is the stock of completed products. These goods have
been inspected and have passed final inspection requirements so that they can be
transferred out of work in process and into finished goods inventory. From these points,
finished goods can be sold directly to their user, sold to retailers, sold to wholesalers, sent
to distribution centers or held on anticipant of a customer order.
Finished goods refer to inventory, which are completely passed through
production process and ready for sale. Firm should hold finished goods inventories to
timely satisfy the demand from customer. In the lack of sufficient finished goods, firm
could not satisfy the demand when they are arise and as result of this the firm losses its
customer. (Weston and Copland 1992, P 415)
Firm Carry finished goods to ensure that order can be filled when they are
received. If a firm does not have finished goods inventory it would have to wait for the
completion of the production process before inventory could be sold. Thus, demand could
not be satisfied when it arrives. When demand arrives and there is no inventory to satisfy
that demand a stock out situation exists. In such situation the firm will be in danger
position of loosing the customer to competitors permanently. (Pandey 1996, P. 884)

22
2.1.3.4 Spare Parts and Supplies
A fourth kind of inventory spare parts and supplies is also maintained by forms.
Supplies include office and plant cleaning materials like soap, brooms, oil, fuel, light,
bulbs etc. These materials do not directly relate to the production but are necessary for
production process.
2.1.4 Need to Hold Inventory
The basic reason to hold inventories is to keep up the production activities
unhampered. It is neither physically possible nor economically justifiable to wait for the
stock to arrive at the time when they are actually required. Production and delivery of
goods are not instantaneous, so there is need to hold inventories so that customer may be
delivered goods or services immediately. Therefore, keeping of inventories is a must for
the efficient working of an industrial unit.
The question of managing inventories arises only when the company holds
inventories. Maintaining inventory involves trying up of the company‟s fund and
incurrence of storage and handling costs. If it is expensive to maintain inventories, why
do companies hold inventories? These are three general motives for holding inventories.
1. Transaction Motive: Transaction Motive emphasizes the need to maintain
inventories to facilitate smooth production and sales operations.
2. Precautionary Motive: It means which necessitates holding of inventories to
guard against the risk of unpredictable change in demand and supply forces and
other factors.
3. Speculative Motive: Which influences the decision to increase or reduce
inventory levels to take advantages of price fluctuations. (Starr, Daved and
Miller 1962, P. 235)
There are many benefits of holding inventory. A firm has to keep enough
inventories not least. Inventories are used to provide cushions so that the purchasing,

23
production and sales function can proceed at their own optimum paces. In achieving the
separations of these functions the firm realizes a number of specific benefits.
Avoiding loses of sales
Gaining quantity discount
Reducing ordering cost
Achieving efficient production runs. (Mohan and Goyal 1997, P. 669)
A company should maintain adequate stock of materials so that it is possible for a
company to procure raw materials whenever it is needed sometimes, there exist
uncertainly in procuring raw materials may be delayed because of strike transport,
distribution or short supply. Therefore, the firm should maintain sufficient stock of raw
materials at a given to continuous productions.
2.1.5 Inventory Management
Inventory Management is one of the aspects of production management.
Production management is developed and handled by production engineer. Its specialist
handles procurement. Therefore, later inventory management becomes a separate and
significant management there is not only essential production approach but also need
marketing management but actually inventory management is purely subject of
production management. (Chary 1994, P. 387)
The inventory management is assumed to be required to maintain an adequate
supply of correct materials at the lowest total cost. The responsibility of determining the
material requirement implied by the marketing forecast and liaising with the purchasing
department for their acquisition, receiving and storing the materials safely and in good
condition for its subsequent issue and identifying surplus stock and taking action to
reduce it. (Muhlemann, Dakland, Lockyer 1996, P. 384)
Inventory management provides a cushion for future price fluctuation. About 90
percent part of working capital is invested in inventories and it is necessary for every
management to give proper attention to inventory management. A proper planning of
purchasing, handling, storing and accounting form a part of inventory management. An

24
efficient system of inventory management will determine. (Sharma and Gupta 1984, P.
22.23)
What to purchase?
How much to purchase?
Where to purchase?
Where to store?
From the above definitions, we can conclude that the inventory management
involves planning of the optimal level of materials i.e. raw materials, work in process
goods, finished goods and supplies and spares parts etc. It includes control of relevant
costs and convenient timetable for procurement with economic order size, warehousing,
shipping and supply. It is staffed by trained and efficient employees and must be directed
by the top level management. It involves both financial and physical dimension and these
dimensions are interrelated and can be looked in isolation.
2.1.6 Objectives of Inventory Management
Inventory management is a pivotal part of profit planning for manufacturing and
merchandising companies. Materials costs often account for more than 50% of the total
costs in manufacturing companies and over 70% of total costs in retail companies.
(Hongren 2002, P. 712)
Inventory is the most important factor to all manufacturing organization in
today‟s world. So it is necessary to manage it properly because both situation of
inventories i.e. either excessive or inadequate are not desirable to the industry. There are
two danger points within which the firm should operate. The objectives of inventory
management should be determined and maintained at an optimum level of inventory
investment. The aim of inventory management is to avoid excessive and inadequate level
of inventories of maintain sufficient inventory and efficient customer service and to
centralize in investment in inventories. (Pandey 1994, P. 886)
The major danger points of excessive inventories are as follows:

25
The unnecessary tie up of the firm‟s funds and loss of profit.
Excessive carrying cost.
The risk of liquidity.
The major danger points of inadequate level of inventories are as follows:
Production hold up.
Failure to meet delivery commitment.
The aim of inventory management thus should be to avoid excessive and
inadequate level of inventories and to maintain sufficient inventory for the smooth
production and sales operations. Efforts should be made to place an order at the right time
with the right source to acquire the right quantity at the right price and quality. An
effective inventory management should:
Ensure a continuous supply of materials to facilitate uninterrupted production.
Maintain sufficient stocks of raw materials in period of short supply and
anticipate price change.
Maintain sufficient finished goods inventory for smooth sales operation and
efficient customer service.
Minimize the carrying cost and time.
Contact investment in inventories and keep it at on optimum level.
After considering all the objective of inventory management maintained above,
we can say that inventory management is the life blood of an organization. So without
well of inventory organization cannot flourish. (Pandey 1986, P. 904)
2.1.7 Cost Concept of Inventory
After the great depression of 1930s and before 2nd
World War American company
as well as world economy played by capacity utilization, material shortage, inflation and
high interest rate. So, cost and balancing of cost lie heart of all production and inventory
control problems.
26
Cost is certainly a considerable factor in purchasing, producing and maintaining
inventory. Minimization of cost with the optimum uses of available resources is the basic
objective of inventory management. Various factor should be composed and are applied
in order to get optimum and ideal inventory to bring the least cost consequence in the
company. Lack of adequate knowledge regarding inventory policies to production
manager derives critical situation for economic purchase.
The goal of inventory management is to provide the inventories for sustaining
operating at the lowest possible cost. The first step in inventory management is to
identify all the cost. Purchasing and maintaining inventories typical cost associated with
the inventories are described below:
2.1.7.1 Purchasing Cost
Purchasing costs are the costs of goods acquired from outside suppliers including
incoming freight or transportation costs. These costs usually make up the largest single
cost category of goods for sale. Discounts for different purchase order size and supplies
creditors affects purchasing costs.
2.1.7.2 Ordering Cost
Ordering cost known as purchase cost or set up cost or procurement cost. This is
the sum of fixed cost that are incurred each time an item is ordered. These cost are not
associated with the quantity ordered but primarily with physical activities required to
process the order. For purchase items, these would include the cost to enter the purchase
order and or requisition any approval steps, the cost to process the receipt, incoming
inspection, invoice processing and vendor payment, and in some cases a portion of the
inbound freight.
Ordering cost increases with the number of orders, thus more frequency in
inventory acquired, higher the firm‟s ordering cost. On the other hand if the firm maintain
large inventories level there will be a few orders placed and ordering cost will be a few
small. Thus, ordering cost decrease with the processing sixe of inventory.

27
Ordering cost are the costs of placing an order if the items are purchased from
others or production set up costs if produced within the firm. Ordering cost include the
costs of running a purchasing department, personal and telephone or letter writing
expenses associated with placing orders and the costs of preparing specifications.
Ordering cost would also include the related costs of receiving and inspecting the
materials and the cost of paying invoices. Another type of ordering cost is represented by
quantity discounts (negative cost), which may be available if the size of the purchase
order is large enough. (Weston and Copland 1992, P. 816)
Ordering cost are normally assumed as fixed cost and stated as rupees per order.
Ordering cost for the specified period is called total ordering cost. Hence, the total
ordering cost for the period can be calculated as:
Total Ordering Cost (TOC) = Number of Orders x Ordering Cost per order
Hence, TOC = A
Q x O
Where,
TOC = Total Ordering Cost
Q = Ordering Quantity
A = Annual Requirement
O = Ordering Cost per order
2.1.7.3 Carrying Cost
Carrying cost also called holding cost. Carrying cost is the cost associated with
having inventory on hand. It is primarily made up of the cost associated with the
inventory investment and storage cost.
The cost which are incurred for holding a given level of inventory are called
carrying cost. They include opportunity cost of funds invested in inventory, insurance,

28
taxes, storage cost and cost of determination and obsolescence. It is a common practice to
calculate opportunity cost of fund invested in inventories, not the interest on borrowings.
Opportunity cost is the earnings foregone on the best available investment opportunities.
The storage cost will comprise the cost of storage space in term of rest and depreciation
on building, store handling expenses and clerical and staff service cost incurred in
recording and providing special facilities such as fencing, lines, racks etc.
Carrying/ Holding Costs are incurred for keeping stock in the store. It includes
rent, insurance, security, heat, light, power, taxes, theft, leakages, spoilage, maintenance
and running, material-holding cost etc. “Total carrying cost generally increase in direct
proportions to the average amount of inventory carried. Inventory carried in term depends
upon the frequency with which orders are placed. (Weston and Brigham 2004, P. 103)
Total Carrying Cost = Average inventory x Carrying Cost per unit
TCC = AI x C
Or, TCC = Q
2 x C
Where,
TCC = Total Carrying Cost
AI = Average Inventory
C = Carrying Cost per unit
Q = Quantity order
From the above definition, we can conclude that the inventory carrying costs are
associated with maintaining or holding inventories. An organization has to bear various
types of cost to maintain inventories; however the following description gives more clear
view on inventory carrying costs.
i) Capital Opportunity Cost

29
Funds associated with inventories are not available for the other users. Therefore, the
opportunity cost is determined by the alternative uses for the capital that would return
10% then the capital cost of the inventory is 10%.
Capital opportunity cost consist of expense of rising funds (invested of capital) to
finance the acquisition of the inventory. If funds were not locked up in inventory, it
would have earned return from any other business. This is the opportunity cost of fund or
financial cost component of the cost. (Khan and Jain 1992, P. 128)
ii) Handling and Storage Cost
The facilities required to store an inventory produces costs such as rent, heat and
light. Often storage facilities are available and have no alternative use; in that case the
cost of storage are fixed and do not vary inventory; however these costs will begin to
increase as more items are put in stock. At the point when storage cost begin to rise, they
begin to influence decision on the optimum inventory level. The same considerations
apply to handling costs. Normally, these are fixed. On occasion however, special cases
arises in which the per unit handling costs fluctuate with the size of inventory. This may
occur because of overcrowding, which restricts mobility, because of inefficient stocking
or because less desirable warehouse space is used. (Garret and Silver 1968 P. 418)
iii) Insurance and Taxes
Since insurance costs and taxes are directly related to the total value of the inventory.
So, it is also included as a part of carrying cost. Most of the goods in inventory require
insurance. The cost of the insurance and taxes vary according to the size and value of
inventory, because inventories often represent a significant investment of a firm‟s capital,
conservative management practice calls for insurance protection. Naturally, the cost of
insurance will vary according to the size and the value of inventory. The same is true of
taxes. Some states levy inventory taxes, for example an various dates, throughout the
year, the more inventory a firm has on hand on those dates the higher their tax bill will be
where such taxes are in effect. Prudent inventory management may dictate periodic
reduction in inventory to coincide with the dates on which the assessment are made.
(Garret and Silver 1968 P. 419)
iv) Spoilage and Shortage Cost
30
This is another type of inventory carrying cost. When goods are kept in ware house or
in storage they can be spoiled or deteriorated. Deterioration rate vary from product to
product as per the nature. Whatever may be the reason of their deterioration it can be said
that assets of the company will be reduced and can be termed as cost of holding
inventories.
v) System Cost
Another type of inventory carrying cost which is associated with the administration
of the inventory system is known as system cost. These costs are incurred for gathering
information cost, supervision cost, physical stock checking cost and record keeping
equipment costs. It is difficult to determine whether these examples will be high or low
expect by making a comparison among actual inventory system.
2.1.7.4 Stock Out Cost
Stock out cost is associated with demand. The depletion in stock results in loss of
sales or back order costs. When the sales are lost due to stock out, the firm losses both
profit margin on unmade sale and firm‟s goodwill. If the customer uses business
elsewhere, future profit margin may also be lost and back order cost is needed to
convince customer to use again after inventories have been replenished. Back order cost
includes loss of goodwill, money paid to re-order goods and notification to customers
when goods arrive. (Adam and Ebert 2000, P. 462)
If the stock of goods goes out of stock before the demand for the product is terminated is
called stock-out situation. There are two types of stock out. The first occurs if an item is
not available for sale or to meet the production schedule but can be obtained through an
emergency procedure. The second occurs, if the goods cannot be obtained even by
emergency procedure. In this case, firms can loss profit from revenue, goodwill from the
customers and even more than that.
Ordering costs, carrying cost and the stock out cost are three vital cost of maintaining
inventory. Stock out cost is maintained under uncertainty as a safety stock, whereas
ordering cost and carrying costs are computed under both certain and uncertain situation.
Hence, the total cost of maintaining inventory under certainty is computed as:

31
Total Cost = Total ordering cost + Total carrying cost
TC = TOC + TCC
Hence,
TC = A
Q x O +
Q
2 xC
2.1.8 Inventory Management Technique
An efficient inventory management system facilitates smooth production
activities and provides safe delivery system to customers. On other hand, excessive
inventory is in idle resources for the organization and can provide costly whereas little
inventory burdens production and supply problems in the organization. The quantitative
approach of inventory management furnishes the basic information to control over the
burden of excessive and deficit inventories. It provides both numerical and logical
information to the organization to maintain optimum level of stock so as to minimize the
inventory costs.
To manage its inventories effectively, a firm should use a system approach to
inventory management. A system approach considers all the factors in a single model that
effect the inventory. A system for effective inventory management involves sub system
(Hampton 1986 P. 233)
2.1.8.1 Economic Order Quantity (EOQ)
This technique makes a balance between demand and supply of inventory. Due to
the balance between demand and supply no more carrying cost will occur. Most
economic point is determined by this technique.
The Economic Order Quantity is an important concept in the purchase of raw
materials as well as in the storage of finished goods and in transit inventories. This
technique is widely used these days in many countries irrespective of under developed or
developing in nature. This technique (model) determines the optimal order quantity of an
individual item of inventory, given its forecast usage, ordering level and carrying cost.
Economic Order Quantity is that level of inventory order which minimize the total cost

32
associated with the inventory management. The cost consists of (i) Ordering Cost, (ii)
Carrying Cost (Khan and Jain 1993, P. 72)
The optimum order size is the order quantity that will results in the total amount
of the ordering and the holding costs being minimized. This optimum size is known as
the Economic Order Quantity (EOQ).
Economic Order Quantity technique is the most important inventory control. EOQ
attempts to establish the most economic balance between carrying cost and ordering cost
determining the quantities to be ordered. The economic order quantity is that inventory
level which minimize the total ordering cost and carrying cost. The relationship between
the ordering cost is called cost factor. To determine the optimal order quantity (EOQ) we
need to know the per unit of carrying cost for one year (C), the cost of ordering (O), and
the yearly demand for the product (A).
From the above definitions, we can say that EOQ as the optimum order size that will
result in the lowest total cost for an item of inventory. EOQ seeks that how much
inventory should be purchased in order to minimize the total costs.
Assumption of EOQ
The EOQ model, as the techniques to determine the economic order quantity,
explained by us, is based on these restrictive assumptions:
1. Demand for the items is constant and uniform throughout the period.
2. The item cost doesn‟t vary with the order size (that is no quantity discounts).
3. Lead time (time from ordering to receipt) is constant.
4. Ordering as well as carrying at the same time (that is no order condition)
Determination of Economic Order Quantity
Economic order quantity can be calculated by using different methods. These are:
a) Mathematical/Short-cut/Formula Method
33
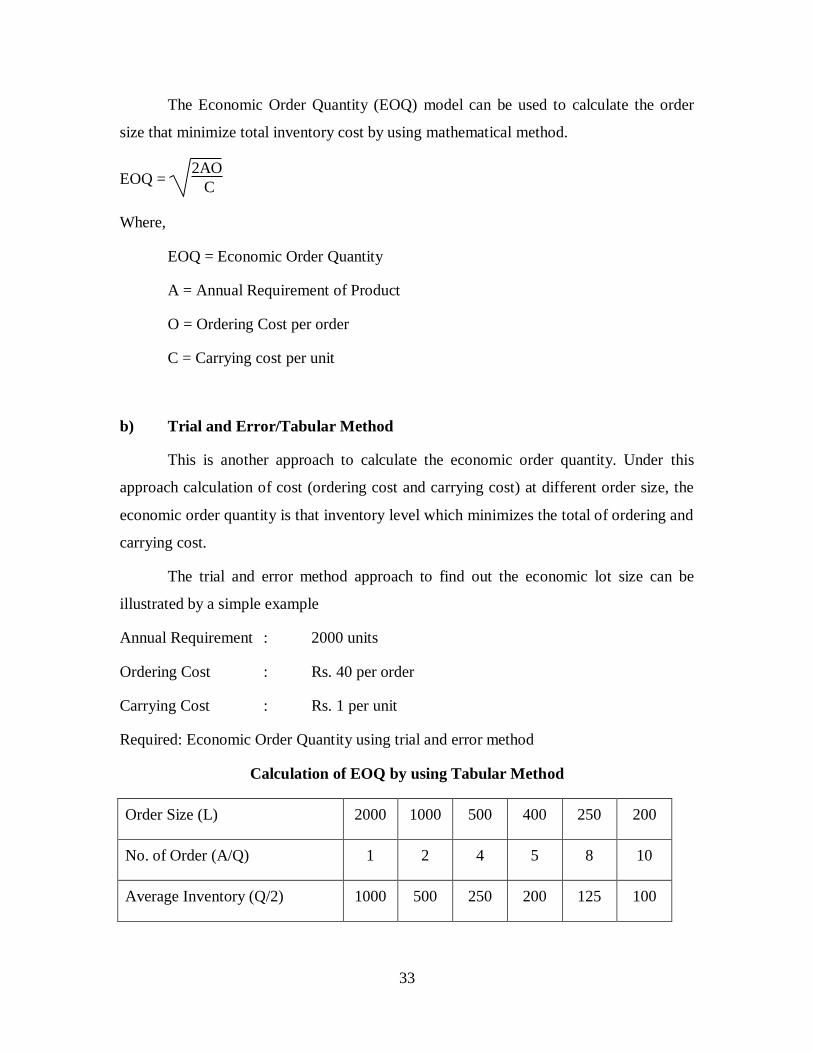
The Economic Order Quantity (EOQ) model can be used to calculate the order
size that minimize total inventory cost by using mathematical method.
EOQ = 2AO
C
Where,
EOQ = Economic Order Quantity
A = Annual Requirement of Product
O = Ordering Cost per order
C = Carrying cost per unit
b) Trial and Error/Tabular Method
This is another approach to calculate the economic order quantity. Under this
approach calculation of cost (ordering cost and carrying cost) at different order size, the
economic order quantity is that inventory level which minimizes the total of ordering and
carrying cost.
The trial and error method approach to find out the economic lot size can be
illustrated by a simple example
Annual Requirement : 2000 units
Ordering Cost : Rs. 40 per order
Carrying Cost : Rs. 1 per unit
Required: Economic Order Quantity using trial and error method
Calculation of EOQ by using Tabular Method
Order Size (L) 2000 1000 500 400 250 200
No. of Order (A/Q) 1 2 4 5 8 10
Average Inventory (Q/2) 1000 500 250 200 125 100

34
Total Carrying Cost (Q/2 x C) 1000 500 250 200 125 100
Total Ordering Cost (A/Q x O) 40 80 160 200 320 400
Total Cost (IV + V) 1040 580 410 400 445 500
The EOQ is 400 units because the total cost is minimum where carrying cost is
equal to ordering cost.
c) The Graphical Approach of EOQ
The economic order quantity can also be found graphically. The following figure
illustrated the EOQ functions.
Figure 2.1
Graphical Approach of EOQ
In figure 2.1, vertices axis represents, carrying, ordering and total cost and
horizontal axis represents the average quantity or order sizes. Total carrying cost increase
as the order size increase. Because on an average a large inventory level will be
maintained and ordering cost decline with increase in order size. The behavior of total
cost line is noticeable science it is a sum of two types of costs that behave differently
with order size. The total cost line represents the summation of both the carrying and
ordering cost. Note that the total cost line as at a minimum for and average quantity of

35
200 units and occurs at the point where the ordering cost and point where the holding cost
equal ordering cost.
2.1.8.2 Re-Order Level (ROL)
Re-order level is the point at which the storekeeper should initiate purchase
requisition for fresh supply. Whenever an item of stock touches the re-order level, the
purchase procedure is automatically activated so that fresh stock can be procured in time.
Re-order level depends upon the lead time, rate of consumption and economic order
quantity. (Munakarmi, Shiva 1999, P. 384)
The re-order point is the level of inventory at which the firm places an order in the
amount of the economic order quantity. If the firm places the order when the inventory
reached the re-order point, the new goods will arrive before the firm run out of goods to
sell. Before computation of re-order point, some factors that are vital in calculation of re-
order point should be considered.
i) Lead Time
The term lead time refers to the time normally taken in receiving the delivery of
inventory after placing orders with the suppliers. Lead time may also be called as the
delivery or procurement time of inventory. There is a direct relationship between lead
time and inventory. As lead time increases, inventory increases correspondingly. Thus
lead time is defined as the duration of the lapses between the recognition of the need for
an item and its fulfillment. The lead time is obviously more in case or procedure oriented
organizations, specially manufactured items, imported materials and when hand-to-mouth
buying is practiced. Inventory is more if the lead time is more. Hence, it is necessary for
the material manager to reduce lead time.
ROL = Lead Time x Usage rate
ii) Goods in Transit

36
If a new order must be placed before the previous order is received, a goods in transit
inventory will build up. Goods in transit are those goods that have been ordered but have
not been received. (Brigham and Basely 2004, P. 434)
There will be goods in transit at the time of re-order, if the lead time is longer than the
order period or ordering frequency. Goos in transit can be determined as follows:
If the lead time is two times greater than order frequency, there will be one goods
in transit.
If the lead time is three times greater than order frequency, there will be two
goods in transit and so forth.
ROL = (Lead time x Usage rate) – Goods in Transit
iii) Safety Stock
In a normal condition re-order point was computed under the assumption of certainty.
It is difficult to predict usage and the lead time accurately. The demand for material may
fluctuate from day to day as from week to week. Similarly, the actual delivery time may
be different from the normal lead time. If the actual usage increases or the delivery of
inventory is delayed, the firm can face a problem of stock out which can prove to be
costly for the firm. Therefore, in order to guard against the stock out, the firm may
maintain safety stock – some minimum or buffer inventory as cushion against expected
increased usage and delay in deliver time. (Pandey 1994, P. 895)
2.1.8.3 Minimum Stock Level
This is the lower limit below which the stock of any items should not normally be
allowed to fall. Carrying of minimum stock avoids situation of stock out resulting in the
stoppage of production. This stock is a buffer stock or safety stock to be used only under
abnormal condition or in emergency. In the determination of minimum stock level,
following points are taken into consideration.
Re-order Level
Average rate of consumption

37
Average lead time-the period of time between ordering and replenishment (Re-
order level)
Minimum Stock Level is determined by following formula.
Minimum Stock Level = Re-order Level – (Normal Consumption x Normal Lead
Time) (Munakarmi 1999, P. 386)
2.1.8.4 Maximum Stock Level
This is the stock level about which stock should not be allowed to rise. It is an
upper limit beyond which the quantity of any item is not normally allowed to rise. The
maximum level is fixed by considering the following points.
Re-order Level
Minimum Consumption rate during lead time
Minimum lead time or re-order period
Re-order quantity
Maximum Stock level is determined by following formula
Maximum Stock Level = Re-order level + Re-order quantity – (Minimum
consumption x Minimum re-order period)
2.1.8.5 Danger Stock level
It is the level beyond which materials should not fall in any case. If the danger
level arises then immediate steps should be taken to replenish the stocks even if the most
cost is incurred in arranging the materials. If materials are not arranged immediately there
is possibility of stoppage of worker. Danger level of stock is determined by the following
formula.
38
Danger Level = Average consumption x maximum emergency period
2.1.9 Perpetual Inventory System
The perpetual inventory system is the way of maintaining the record of inventory
items in such a ways that the stores indicate stock on hand for any time. Maintenance of
regular stock records is commonly known as perpetual inventory. In fact, perpetual
inventory implies a complete and updated account of each item of stores both on records
and physical goods. If point out continuous day to day checking of stocks and
maintenance of up to date record of stocks.
Perpetual inventory means maintenance of such records (stock control cards, bin
cards and storage ledger) as will reflect the receipt, issue and balance of all items in stock
at all times. The perpetual inventory system is generally supplemented by a program of
continuous stock taking which ensures that physical stocks are book figures. The object
of perpetual inventory record is to ensure that production is not interrupted due to want of
materials to facilitate regular checking to avoid closing down for stock taking, and to
provide basis for verification of physical quantity in stock. (Sharma 1984, P. 93-94)
2.1.10 Always Better Control (ABC) Analysis
Usually a firm has to maintain several types of inventories. It is impractical and
impossible to control all these inventories with equal attention. The firm should therefore,
classify inventories to identify which items should receive the most effort of the firm in
controlling. Thus the firm should be selective in its approach to control investment in
various types of inventory. This analytical approach is called the ABC approach and
tends to measure the cost significance of each item of inventories. The high value items
are classified as "A items" and would be under highest control. "C Items" represent
relatively least value and would be under simple control. "B Items" fall in between these
two categories and require reasonable attention of management. The ABC plan
concentrates on importance of the relative value. This approach is also known as
proportional value analysis.

39
The following steps are involved in implementing the ABC plan.
Classify the items of inventories, determining the expected use in units and the
price per unit for each item.
Determine the total cost of each item by multiplying the expected units by its unit
price.
Rank the items in accordance with the total cost, giving first rank to the item with
highest total cost and so on.
Complete the ratios (percentages) of number of unit of each item to total units of
all items and the ratio of total cost of each item to total cost of all items.
Combine items on the basis of their relative value to from three categories A, B
and C (Pandey 1979, P. 350)
A common break down of inventories according to ABC groups is given in below.
Group Percentage of Items Percentage of Total Annual
Value of Inventories
A 10-20 70-85
B 20-30 10-25
C 60-70 5-15
Fig. 2.2
Graphical Presentation of ABC Analysis

40
Under the ABC classification of inventory, a firm needs to classify its inventory
items on the basis of their numeric and usage value. It may be easy for small firm to
classify its inventories into ABC, but it is quite complex task for the firm that holds large
number of items of different usage value and different quantity.
The following points should be kept in mind for ABC analysis for better control over
inventories:
When items can be substitute for each other, they should preferably treat as one
item.
More emphasis should be given to the value of consumption and not to price per
unit of item.
All the items consumed by an organization should be considered together for
classifying as A, B and C instead of taking them as spares, raw materials, semi
finished and finished items and then classify as A, B and C.
There can be more than three classes and the period of consumption need not
necessarily be one year.
2.1.11 Just-in-Time Management
Just in time inventory system is one of the recently developed inventory
management concept, which assume the purchase of inventory just in time of use. JIT
refers to acquiring materials (inventory) as needed time only. JIT is more efficient by
purchasing and storing fewer inventories. The objectives of JIT is maintain inventory as
low as possible. Sometimes it may also be at zero level. Thus, JIT means that inventories
are received in time or inventories are purchased in time of use. It is only possible when

41
suppliers are reliable and there is confident for making delivery of goods on time. Since
in JIT goods just ordered when required, there is no time to check the quality and other.
So, there should be guarantee for supplying quality goods at time. Generally developed
countries where communication and transportation system are developed used JIT.
Advantages of Just-in-Time management:
Just in time inventory system reduces the amount of money tied up in inventory of
raw material and finished goods.
This system creates saving of area (space)
It does not require maintaining large inventory storage facilities.
Just in time inventory system minimizes wastage.
It helps to improve the labor efficiency.
2.1.12 Pricing and Issuing
The primary basis of accounting for inventory is cost, which has been defined
generally as the price and to consideration given to acquire assets. As applies to
inventories cost means principle the sum of applicable expenditure and charges directly
or indirectly in bringing an article to its existing condition and location.
Pricing the inventory is one of the most interesting and widely used subject matter
in accounting process. Many organizations are interested in the various methods of
pricing inventory because it has a direct effect on the net income. Inventory valuation
approach is important in the aspect of income tax. One method of inventory valuation
may lead lower tax liability than other inventory valuation method. There are a number of
methods, which may be employed for the inventory valuation but most significant
method is cost and other method is lower of cost or market. Both methods give different
results.
Theoretically the value includes all expenses up to the point of placing materials
at the processing plant. Therefore, the value includes the invoice price less trade discount,
the freight, cartage and insurance on incoming materials and expenses of purchase,

42
receiving, storing and record keeping and carriage from the stores up to the process plant.
Hence, in order to work out correct costs of job or work order, all these types of expenses
should be included in the value of materials issued. However, in practice, it is a difficult
task because the clerical work involved in making minute calculation for the inclusion of
these expenses will be much more than the benefit derived. (Jain and Narayan 1991, P.
261)
There are a number of generally accepted methods of determining the cost of
inventories at the close of the accounting period. These methods are to identify a suitable
method as a basic of inventory valuation. The selection of a suitable method assumes
significance in view of the fact that it has a direct bearing on the cost of goods sold and
consequently on profit. Therefore, the method can be selected in the light of the probable
effect on profit over a period of years. Keeping this view in mind the following methods
to value inventory mentioned.
2.1.12.1 First in First out (FIFO) Method
In this method is commonly known as FIFO. The principle is that issues are
priced in chronological order of the purchase and at their cost price. The materials
received first are to be issued as soon as the material requisition is received. (Sharma
1984, P. 75)
This method is used under the assumption that the materials which are received
first are issued first. Hence, the price of the first batch or lot purchased is charged for all
issues until the stock of that batch or lot is exhausted. In other words, the issues are
priced in the chronological order of receipt. In this case, issued to
production/maintenance are valued at historical price and stock is valued at the latest
purchase price.
FIFO is the most commonly used method for valuing inventory. It is simple to use
and appear to coincide with established merchandising principle of selling the oldest
items first.

43
2.1.12.2 Last in First out (LIFO) Method
As the name LIFO, the use of inventory is valued on the basis of the inverse
sequence of receipts. The LIFO method of costing is based on the principle that materials
entering production are the part of the most recently purchased. It is assumed that the
most recent cost, normally replacement cost id the most significant in matching cost with
revenue in the income determination. Under this, the cost of the last lot of materials
received is used to price material issued until the lot is finished, then the next lot pricing
is used, and so on through coming lot. This method has become popular since the
procedure became acceptable method for use in determining the income taxes. Unlike
weighted average in the inventory is less than the beginning inventory. In such a case, the
firm must be able to identify the oldest remaining items for inventory purpose.
2.1.12.3 Standard Price Method
In this method of pricing issues is based upon a standard price for a standard price
for a specific period. The standard price is a pre-determined price or national price and is
not based on actual purchase price. While determining the standard price various
influencing factors like quantity of purchase, quantity discount, anticipated price
fluctuation and transportation cost are taken into consideration. This method is specially
designed where standard costing is in vogue. The standard price for all issues is predicted
at the commencement of the accounting per difference between the standard and actual
price of purchase is known as material price variance and is transferred to various
accounts.
2.1.12.4 Market Price Method
Under this method, materials are issued at the price at which they can be replaced,
that is at the market price prevailing on the date of issue. This method could be applied
principally to materials purchased in advance for use in large quantities, in anticipation of
economic/ profitable use and in such items of stores, which are either absolute or lying
unused for a long time in store. It reflects current cost of production and may be useful in
such cases where quotations used on competition market price of materials are sent.

44
However, it may be difficult to ascertain current price of each item of material at the time
of issue. It is also not based on actual incurred and therefore, may add confusion and
complication in cost accounting.
2.1.13 Purchase Management
Purchasing means procurement of goods and services from some external
agencies. In other words, purchasing means procurement of materials, parts and
components to procedure desired goods and services in organization. The main objective
of purchasing is to purchase or procure correct equipment, materials, parts, components
and supplies in the right quantity of right quality from right origin at right time and cost.
Purchasing to a manufacturing concern is of extreme important because it has its
bearing on every vital factor concerning the manufacture, i.e. quality, quantity,
efficiency, economy delivery, volume of production etc. It is the scientific purchasing
that can save much money, time and efforts of the management.
In a large manufacturing concern, a separate purchase department is set up with
the object of regularizing all purchases. The top management lay down the purchase
policy and accordingly necessary materials are purchased by the purchase department. It
is the function of the purchase department to decide, what to purchase, when to purchase,
from where to purchase, how to purchase and finally at what price the material should be
purchased. (Sharma 1984, P. 47)
From the above definitions, we understand that purchasing management is
relating with the overall organizational activities and it is influenced by various factors.
Purchasing department has to tackle with all these purchasing factors to strengthen the
organization‟s purchasing efficiency.
2.1.13.1 Objectives of Purchasing
The responsibility of the purchasing department is to buy materials of the right
quality in the right quality in the right quantity at the right price from the right sources

45
and delivery at the right place. This is the way of starting the objective of sound
purchasing management. (Gupta, P. 27)
The major objectives of scientific purchasing may be state as follows:
To support company operation with an uninterrupted flow of materials and
service.
To develop reliable alternate sources of supply.
To develop good vendor relationship and good continuing supplier relationship.
To buy competitively and wisely.
To keep inventory investment losses (due to deterioration, obsolescence and theft)
at a practical minimum.
To achieve maximum integration with the other department of the firms
To train and develop highly competent personal who are motivated to make the
firm as well as their department succeed.
To develop policies and procedures, which permit accomplishment of the
proceeding several objectives at the lowest reasonable operating cost.
2.1.13.2 Purchasing Procedure
Materials may be purchased through a centralized organization for all
manufacturing centers or different producing centers may be allowed to make necessary
purchase locally. However, the purchase department has to follow a set procedure for the
purchase of materials. Through the form and routine may differ in some concerns
depending upon the nature and requirements of the concern. (Sharma 1989, P. 47)
The purchase department follows the following procedure for purchasing necessary
materials:
Purchase requisition
Decision for purchase
Study of market condition and source of supply

46
Selection of vendor
Purchase order
Follow up of order
Receiving of materials
2.1.14 Storage
Proper storage of goods is very essential for effective production planning.
Materials when received are to be properly examined, tested and kept in a proper place
known as "store room". Store keeping thus may be described as physical storage of
materials carried into the store room in a scientific and systematic manner with a view to
(i) saving them from all kinds of damage and loss, (ii) exercising over all control over
their movement. Proper storage of materials helps in minimizing production cost and
providing efficient service. Proper storing of materials needs suitable classification and
codification. In a large enterprise, a separate storage department is set up for efficient
storing and handling of all materials received. This department is entrusted with the
physical possession of materials in the organization. (Sharma 1984, P. 55)
2.1.14.1 Function of Stores Department
The store department pays very important functions in an organization. It is
therefore, essential that the overall responsibility of organization and functioning of this
department should be entrusted to a capable and qualified person. The following are some
important functions of properly organized store department.
Receiving of good into store
Acts as a storage and depot for different types of goods
Protection and preservation of materials and goods
Proper classification and codification of materials
Issue of materials

47
Checking the invoice with materials received note and purchase order in respect
of quality and quantity of materials received
Maintains stock of materials
Maintain proper records
2.2 Review of Related Thesis and Articles
Public and Private Manufacturing companies in Nepal deserve a crucial role for
the socio economic development of our country. It enjoys a strategic and crucial position
in our mixed economy. They have been established in many sectors overall development
of the country with different goals and objectives. But now a day the question mark has
been raised about their success. Many Public Companies convert into Private Companies
and few companies were already closed.
Inventory management is a wide subject but no one pay attention in this field.
Many modern techniques to control inventory management have been realized. In Nepal,
many public and private enterprises have been established as well as analysis has been
made nut only the aspect of financial performance. The researchers made in this area are
taken into consideration for the sake of review to examine how inventory management
system is practiced in Him Shree Foods Industry Pvt. Ltd. An attempt is made to review
some of the researchers, which have been submitted in inventory management in the
context of Nepal.
Mr. Deepak Raj Tiwari (2061) carried out a study on the topic "A Study on
Inventory Management of Salt Trading Corporation Limited". The objectives of the study
were to analyze the performance of corporation on the basis of selling and cost price of
inventory, to analyze inventory turnover ratio, to identify the present practice of
procurements of various inventories, to reveal the goods purchasing policy, to compare
between profit and purchasing cost of various inventories and analyze the present
inventory position of the corporation. During the study, he has found that the selling price
and the cost price of the products are in increasing trend. Due to the traditional
marketing, corporation can not earn target profit, EOQ Model is not followed while

48
purchasing, the margin of safety stock, maximum stock and minimum stock level is only
in paper not in practice, investment on inventory stock is in large quantity due to
defective purchasing policy. The inventory turnover ratio is satisfactory.
He has recommended to the corporation, EOQ model should be applied while
purchasing, should extent its hand to rural areas, should have prepare purchase plan and
sales playing strategies.
Saru, Ram Kumari (2064) carried out the study on the topic "Planning and
Controlling of Inventory of Manufacturing Industries (Gosheli House)". The basic
objective of study were to identify the authorize person for inventory planning and
controlling, to analyze the tools used in planning and controlling of inventories, to
analyze the materials purchasing techniques, to analyze the inventory turnover ratio of
Gosheli Packaging House. During the study she found that the top level management has
not paying more attention to make inventory planning and controlling. No separate
section of purchasing, production and sales department, no preparation of complete
inventory planning, diversified purchasing methods are used to procure materials, the
company has not determine EOQ, ROL, maximum and minimum stock level while
purchasing and sale, FIFO method have applied for the inventory issued and use,
perpetual inventory system is adopted, inventory turnover ratio is not satisfactory.
She has recommended to the company's top level management should paying
more attention to prepare the planning and controlling of inventories policies, should
have .prepare purchase budget, should have follow the scientific tools and techniques for
inventory planning, inventory should be classified according to ABC system.
2.3 Research Gap
The purpose of this research is to develop some expertise in one's area, to see
what new contribution can be made and to receive some ideas, knowledge and
suggestions in relation to inventory management of Him Shree Foods Industries Pvt. Ltd.
Here, it is clear that the new research cannot be found on that exact topic, i.e. Inventory
Management of Manufacturing Industries in Nepal: With Reference to Him Shree Foods

49
Industries Pvt. Ltd. Therefore, to fulfill this gap, this research is selected. To complete
this research work: many books, journals, articles and various published and unpublished
dissertations are followed as guideline to make the research easier and smooth. Previous
researchers could not cover all the aspects of inventory management of Him Shree Foods
Industries Pvt. Ltd. The previous studies can't be ignored because they provide the
foundation to the present study. In other words, there has to be continuity in research.
This continuity in research is ensured by linking the present study with the past research
studies.
50
CHAPTER III
RESEARCH METHODOLOGY
3.1 Introduction
Research methodology is a systematic means of solving the research problems. It
is the process of arriving at the problem through the planned and systematic dealing with
collection, analysis and interpretation of facts and figures. Science the basic objective of
this study is the inventory management system of Him Shree Foods Pvt. Ltd. in Pokhara.
So, suitable research methodology as demanded by the study is followed.
3.2 Research Design
This study is based on a case study research design. Case Study research design
describes in general pattern about the choosen field and five years data of Him Shree
Foods Pvt. Ltd. are collected and analyzed using various management and accounting
tools and presented on the table and charts.
3.3 Population and Sample Size
This study is a case study. Therefore, total population and sample size is not taken
mention, however convenience sample method is used for selection of a study unit.
3.4 Source of Data
For the reliability and effectiveness of research work, true and fact information
are necessary because information are the life blood for any research. In this study both
the primary and secondary data has been used. The primary data are collected from
questionnaire, personal interviews as well as unstructured dialogues and discussions with
staff of Him Shree Foods Pvt. Ltd. The secondary data are collected from the office
records, previous studies and reports, office records, published and unpublished
brochures, smarika and annual reports etc.

51
3.5 Data Collection Techniques
The most important part of the research is data gathering procedure. It consists of
obtaining information from somebody's hands. So, it is therefore very difficult activity of
the whole research process. Researcher has to make frequent visits to company in order
to collect the required data.
The required data are collected in a period of about two months through the
various techniques. Primary data are collected from observation, informal interaction and
dialogues and structured questionnaire with the selected respondents. Secondary data are
collected from the office records, previous studies and reports, office articles, published
and unpublished brochures, smarika and annual reports etc
3.6 Methods of Data Analysis
The data are collected from various sources. The data are managed, analyzed and
presented in the proper tabular, percentage and bar diagram formats. To achieve the
objectives of the study various tools and techniques like EOQ, ABC analysis, ITR and
ICP are applied.
Economic Order Quantity (EOQ) is that level of inventory order which minimize
the total cost associated with the inventory management. EOQ can be determined by the
following methods:
a. Mathematical/Short-cut/Formula Method: EOQ can be calculated by
below formula:
EOQ = 2AO
C
Where, EOQ = Economic Order Quantity
A = Annual Requirement of Product
O = Ordering Cost per order
C = Carrying Cost per unit

52
b. Trial and Error/Tabular Method: Under this approach calculation of
cost (ordering cost and carrying cost) at different order size, the economic
order quantity is that inventory level which minimizes the total of carrying
cost.
c. The Graphical Approach of EOQ
ABC Analysis classifies inventories to identify which items should receive the
most effort of the firm controlling. The high value items are classified as “A items” and
would be under highest control. “C items” represent relatively least value and would be
under simple control. “B items” fall in between these two categories and require
reasonable attention of management.
Inventory Turnover Ratio (ITR) shows the relationship between the cost of goods
sold and average inventory or net sales and closing inventory. ITR shows how quickly
inventory can be sold.
Inventory Turnover Ratio= Cost of Good Sold
Average Inventory
Or
Sales
Closing Inventroy
Cost of Goods Sold = Purchase + Opening Stock + Direct Expenditure- Closing Stock.
Average Inventory = Opening Inventory + Closing Inventory
2
Inventory Conversion Period (ICP) indicates the number of days to complete raw
materials into finished goods.
Inventory Conversion Period = Days in a year X Inventory Turnover Ratio
3.7 Limitation of Methodology
This research is done for the fulfillment of the requirement for the degree of
Master of Business Studies (M.B.S). There is limitation of resources and time. This study

53
has to be completed in framed limited time. This study is based on the available
information and used the methods that have been formulated for inventory management.
This study is focused on the basic purpose of the study which is inventory
management in Him Shree Foods Industries Pvt. Ltd. Formulas formulated and tested
have been used in the assumption that it is idle for the condition of Him Shree Foods
Industries Pvt. Ltd. Information has been tried to gather being more focus on the
formulae to be used for the presentation and analysis of the study. Major finding are
based on the use of accounting tools and techniques i.e. EOQ, ABC Analysis, Inventory
Turnover Ratio (ITR) and Inventory Conversion Period (ICP).

54
CHAPTER IV
PRESENTATION AND ANALYSIS OF DATA
Background
The main objective of this study is to examine the existing position of inventory
Management. Mainly this chapter contains two major sections. Data presentation and
Analysis which are collected from primary source i.e. questionnaire, informal interview
and secondary source i.e. annual report, published and unpublished brochures, office
records etc. Graphical presentation such as bar diagram, tabular forms etc. are presented
wherever appropriate in the first part. In the second part major findings are present, which
are from the first part.
The firm should maintain a sound inventory position to run its business operation
in this competitive world. Both excessive as well as inadequate inventory positions are
dangerous from the firm's point of view. So, management should maintain appropriate
inventory position to meet its objectives.
The basic objectives of this study are to analyze the present position of
inventory of Him Shree Foods Pvt. Ltd. In order to achieve this objective collected data
are represented and analyze in this section.
4.1 Presentation and Analysis of Data
4.1.1 Present Inventory Position of Him Shree Foods
The present inventory position of Him Shree Foods Pvt. Ltd. can be analyzed as
follows:

55
4.1.1.1 Proportion of Raw Materials on Total Inventory
Raw Materials is major factor in any manufacturing company. It takes major
portion of inventory. The major raw materials used by the Him Shree Foods Pvt. Ltd. are
maida, Palm oil, Palmolien, Noodles Wrapper, soup wrapper, Bulletin, Soup powder etc.
The value of raw materials is in monetary form to analyze. Last five-years raw materials
position of Him Shree Foods Pvt. Ltd. presented as follows:
Table 4.1
Proportion of Raw Materials on Total Inventory
Fiscal Year Raw Materials
(Rs.)
Total Inventory
(Rs.)
% of Finished Goods on
total Inventory
2060/061 83,551,175 226,142,361 36.95
2061/062 88,126,268 237,475,929 37.15
2062/063 72,175,710 183,245,225 38.89
2063/064 61,189,008 166,874,860 36.66
2064/065 77,250,389 194,239,452 39.77
Total 381,392,550 1,007,977,827 -
Average 76,278,510 201,535,565 37.88
Source: Office Records of HSF
Figure 4.1
Level of Raw Materials on Total Inventory

56
From study of figure 4.1, the value of raw materials, from the fiscal year
2060/061 to 2064/065 are Rs. 83,551,175, Rs. 88,126,268, Rs. 72,175,710, Rs.
61,189,008 and Rs. 77,250,389 respectively. So, on total value of inventory from the
fiscal year 2060/061 to 2064/065 are Rs. 226,142,361, Rs. 237,175,929, Rs. 183,245,225,
Rs. 166,874,860 and Rs. 194,239,452 respectively.
The maximum use of raw materials in the fiscal year 2061/062 is Rs.
88,126,268 which covers the 37.15% of total inventory and the minimum use of raw
materials in the fiscal year 2063/064 is Rs. 61,189,008 which covers the 36.66% of total
inventory. The average use of raw materials and total inventory is Rs. 76,278,510 and Rs.
201,535,565 respectively which is 37.88% of total raw material on total inventory uses.
From the above figure 4.1 the proportion of raw materials in total inventory is
increasing in 2061/062, 2062/063 comparatively but decreasing in the fiscal year
2063/064 and increasing in the fiscal year 2064/065.
4.1.1.2 Proportion of Finished Goods on Total Inventory
Finished goods inventory is valuable assets of every industries. It is required for
the smooth operation of marketing. The packed noodles are the finished product of Him
Shree Foods Pvt. Ltd. which named RARA, Aaha, Fewa. The value of finished goods are
presented below from the fiscal year 2060/061 to 2064/065.

57
Table 4.2
Proportion of Finished Goods on Total Inventory
Fiscal Year Finished Goods
Materials (Rs.)
Total Inventory
(Rs.)
% of Finished Goods on
total Inventory
2060/061 125,501,274 226,142,361 55.49
2061/062 129,732,459 237,175,929 54.69
2062/063 96,088,982 83,245,225 52.44
2063/064 83,885,447 166,874,860 52.96
2064/065 102,752,863 194,239,452 52.90
Total 537,961,025 1,007,677,827 -
Average 108,492,205 201,535,565 53.83
Source: Office Records of HSF
Figure 4.2
Level of Finished Goods on Total Inventory
From study of figure 4.2, the value of finished goods inventory from the fiscal
year 2060/061 to 2064/065 are Rs. 122,501,274, Rs. 129,732,459, Rs. 96,088,982, Rs.
88,385,447 and Rs. 10,272,863 respectively. So on the total value of inventory from the

58
fiscal year 2060/061 to 2064/065 are Rs. 226,142,361, Rs. 237,175,929, Rs. 183,245,225,
Rs. 166,874,860 and Rs. 194,239,452 respectively.
The maximum value of finished goods inventory is Rs. 129,732,459 in the fiscal
year 2061/062 which covers the 54.69 percent of total inventory and the minimum value
of finished goods inventory in the fiscal year 2063/064 is Rs. 88,385,447, which covers
the 52.96 percent of total inventory. The average value of finished goods for five years is
Rs. 108,492,205, which covers the 53.83 percent of total average inventory.
From figure 4.2, the proportion of finished goods on total inventory is decreasing
the fiscal year 2062/063 but slightly increasing in year 2063/064 and again decreasing in
the following year.
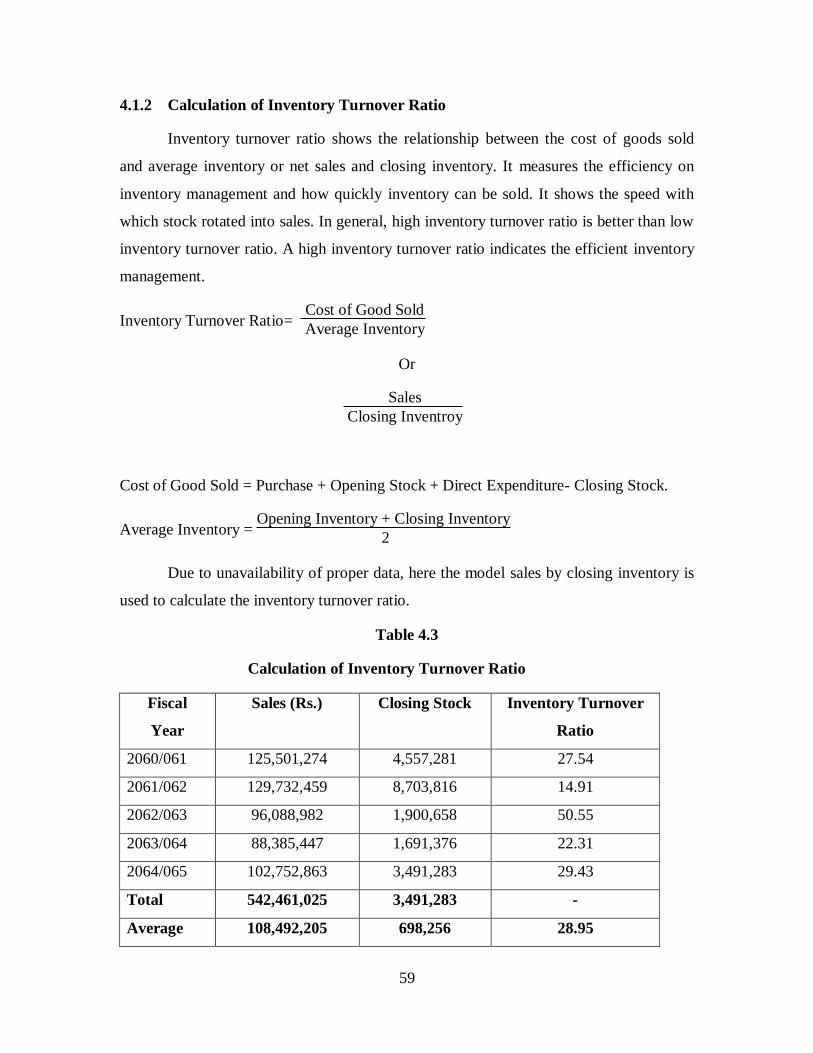
59
4.1.2 Calculation of Inventory Turnover Ratio
Inventory turnover ratio shows the relationship between the cost of goods sold
and average inventory or net sales and closing inventory. It measures the efficiency on
inventory management and how quickly inventory can be sold. It shows the speed with
which stock rotated into sales. In general, high inventory turnover ratio is better than low
inventory turnover ratio. A high inventory turnover ratio indicates the efficient inventory
management.
Inventory Turnover Ratio= Cost of Good Sold
Average Inventory
Or
Sales
Closing Inventroy
Cost of Good Sold = Purchase + Opening Stock + Direct Expenditure- Closing Stock.
Average Inventory = Opening Inventory + Closing Inventory
2
Due to unavailability of proper data, here the model sales by closing inventory is
used to calculate the inventory turnover ratio.
Table 4.3
Calculation of Inventory Turnover Ratio
Fiscal
Year
Sales (Rs.) Closing Stock Inventory Turnover
Ratio
2060/061 125,501,274 4,557,281 27.54
2061/062 129,732,459 8,703,816 14.91
2062/063 96,088,982 1,900,658 50.55
2063/064 88,385,447 1,691,376 22.31
2064/065 102,752,863 3,491,283 29.43
Total 542,461,025 3,491,283 -
Average 108,492,205 698,256 28.95

60
Source: Office Records of HSF
As indicated in table 4.3, the inventory turnover ratios from the fiscal year
2061/062 to 2064/065 are 27.54, 14.91, 50.55, 22.31 and 29.43 times respectively. On the
study of above table the inventory turnover ratios were fluctuate in five years period. The
highest inventory turnover ratio is 50.55 times in the year 2062/063 and lowest inventory
turnover ratio is 14.91 times in the year 2061/062. The average sales of the Him Shree
Food Pvt. Ltd. was Rs. 186,185,188 for last five years and average inventory turnover
ratio is 28.21 times which is satisfactory.
4.1.3 Inventory Conversion Period
Inventory Conversion Period indicates the number of days to complete the raw
materials into finished goods. The least inventory conversion period, the more efficient
the firms inventory management and the longer inventory conversion period, the less
efficient the firms inventory management. To assess the inventory efficiency the study
evaluate the inventory conversion period as follows:
Table 4.4
Calculation of Inventory Conversion Period
Fiscal
Year
Days in a year
(No. of working days)
Inventory
Turnover Ratio
Inventory Conversion
Period (days)
2060/061 300 27.54 10.89
2061/062 300 14.91 20.12
2062/063 300 50.55 5.93
2063/064 300 22.31 13.44
2064/065 300 29.43 10.19
Total 1500 60.57
Average 300 28.95 10.36
Source: Office Records of HSF
61
As indicated in table 4.4, the inventory conversion periods from the year
2060/061 to 2064/065 were 10.89 days, 20.12 days, 5.93 days, 13.44 days and 10.36 days
respectively.

62
The highest inventory conversion period was in the year 2061/062 which is
20.12 days and lowest inventory conversion period was in the year 2062/063 which is
5.93 days. It shows that inventory conversion periods were fluctuating in last five years
period. The average working days of HSF were 300 days and 10.36 days was the
inventory conversion period for the last five years.
4.1.4 Determination of Economic Order Quantity
To calculate EOQ, only raw materials are considered. Him Shree Foods Pvt. Ltd.
has used various types of raw materials, which includes maida, palm oil, palmolien,
Gluten, Soup powder, MSG, Guargamn etc. To calculate the EOQ for each and every
item is difficult and lengthy process. Therefore EOQ of major raw materials like Maida,
Palm Oil, Gluten have been shown as follows:
4.1.4.1 Annual Demand of Maida
Annual demand of maida for last five years period has been given below.
Table 4.5
Annual demand of Maida
Fiscal Year Quantity (Kg.)
2060/061 483,215
2061/062 491,523
2062/063 410,256
2063/064 395,935
2064/065 401,256
Total 2,182,185
Average 436,437
Source: Office Records of HSF

63
0
100000
200000
300000
400000
500000
600000
2060/061 2061/062 2062/063 2063/064 2064/065
Fiscal Year
Qu
an
tity
in
Kg
.
Quantity (Kg.)
Figure 4.3
Annual demand of Maida for last five years period
As per figure 4.3, the annual demand of maida from the fiscal year
2060/061 to 2064/065 was 483215Kg, 491,523Kg, 395,935Kg, 401,256Kg
respectively.
The maximum usage of maida in the year 2061/062 was 491,523Kg and
minimum usage of maida was in the year 2063/064 i.e. 395,953 Kg. The average usage of
maida for the five years period was 436,437Kg. It shows that the annual usage of maida
is fluctuate in last five years period.
4.1.4.2 Economic Order Quantity for the year 2064/065 of maida
a) Mathematical / Formula Method
Annual Demand (A) = 401,256Kg
Carrying Cost (C)= Rs. 2.56
Ordering Cost (O)= Rs. 15,468 per order
EOQ = 2AO
C

64
= 2x401256x15468
2.56
= 69634.24 kg
Calculation of No. of order
No. of order = Annual Demand
EOQ
= 401256
69634
= 5.76
= 6 times (Approx)
b) Trial and Error Method
Table 4.6
Trial and Error Method
No. of
order
Order Size
(Kg.)
Average
Inventory
Carrying
Cost
Ordering
Cost
Total Cost
1. 401,256 200,628 513,607 15,468 509,075
2. 200,628 100,314 256,804 30,936 287,740
3. 100,314 50,157 128,402 61,872 190,274
4. 80,251 40,125 102,720 77,340 180,060
5. 66,876 33,438 85,601 92,808 178,409
6. 57,322 28,661 73,372 108,276 181,648
7. 50,157 25,078 64,199 123,744 187,943
Source: Office Records of HSF
On the basis of table 4.6, the highest cost Rs. 529,075 at a single order of
401,256Kg and the lowest cost Rs. 178,409 at the 6th Order size is 66,876Kg. Therefore,
the company should place the 6th time Order a with the 99,876Kg order size to maintain
the lowest total cost.

65
4.1.4.3 Annual Demand of the Palm Oil
Annual demand of palm oil for last five years period has been given below.

66
0
50000
100000
150000
200000
250000
300000
350000
400000
450000
500000
2060/061 2061/062 2062/063 2063/064 2064/065
Fiscal Year
Qu
an
tity
in
Kg
.
Quantity (Kg.)
Table 4.7
Annual Demand of Palm Oil
Fiscal Year Quantity (Kg.)
2060/061 421,054
2061/062 442,313
2062/063 339,477
2063/064 329,908
2064/065 384,652
Total 1,917,404
Average 383,480.8
Source: Office Records of HSF
Figure 4.4
Annual Demand of Palm Oil for Last Five Years Period
On the study figure 4.4, the annual demand of palm oil from the year 2060/061 to
2064/065 was 421,054Kg, 442,313Kg, 339,477Kg, 329,908Kg and 384,652Kg
respectively.
The maximum usage of palm oil in the year 2061/062 i.e. 442,312 Kg and
minimum usage of palm oil in the year 2063/064 i.e. 329,908Kg. The average usage of

67
palm oil for the five years period was 383,480Kg. It shows that the annual usage of palm
oil is fluctuate in the last five year period.
4.1.4.4 Economic Order Quantity for the year 2064/065 of Palm oil
a) Mathematical/Formula Method
Annual demand (A)=421,054Kg.
Ordering Cost (O)= Rs. 384,226
Carrying Cost (C) = Rs. 33.88
(Source: Unpublished record of HSF)
Now,
EOQ = 2AO
C
= 2x421054x384226
33.88
= 97,724.975
= 97,725 Kg.
b) Calculation of No. of order
No. of order = Annual Demand
EOQ
= 421054
97725
= 4.30 times
c) Trial and Error Method

68
Table 4.8
Calculation of EOQ of Palm oil under Trial and Error Method for the year
2064/065
No. of
order
Order Size
(Kg.)
Average
Inventory (Kg.)
Carrying
Cost (Rs.)
Ordering
Cost (Rs.)
Total Cost
(Rs.)
1. 421,054 210,527 7,132,654 384,226 7,136,497
2. 210,527 105,263 3,566,310 768,452 4,334,762
3. 140,351 70,715 2,377,529 1,152,678 3,530,207
4. 105,263 52,631 1,783,138 1,536,904 3,320,042*
5. 84,210 42,105 1,426,517 1,921,130 3,347,647
6. 70,175 35,087 1,188,747 2,305,356 3,494,103
7. 60,150 30,075 1,018,941 1,689,582 3,708,523
Source: Office Records of HSF
On the study table 4.8, the highest total cost Rs. 7,136,497 at a single order i.e.
421,054Kg. and the lowest cost Rs. 3,320,042 at 4 order size i.e. 105,263Kg. Therefore,
the company should place the 4 times order a year with the 105,253Kg order size to
maintain the lowest total cost.
4.1.4.5 Annual Demand of Gluten
Annual demand of Gluten for the last five years period has been given below.
Table 4.9
Annual Demand of Gluten
Fiscal Year Annual Demand (Kg.)
2060/061 36,550
2061/062 32,628
2062/063 25,269
2063/064 26,606
2064/065 27,068
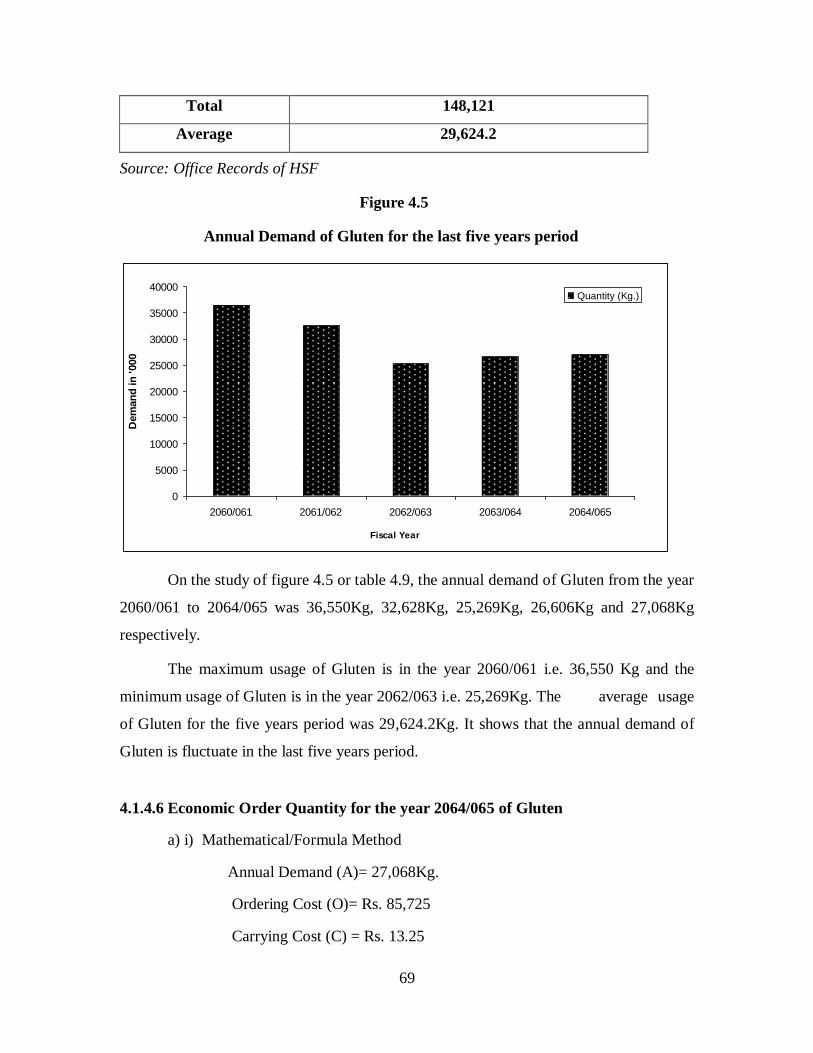
69
Total 148,121
Average 29,624.2
Source: Office Records of HSF
Figure 4.5
Annual Demand of Gluten for the last five years period
0
5000
10000
15000
20000
25000
30000
35000
40000
2060/061 2061/062 2062/063 2063/064 2064/065
Fiscal Year
Dem
an
d in
'000
Quantity (Kg.)
On the study of figure 4.5 or table 4.9, the annual demand of Gluten from the year
2060/061 to 2064/065 was 36,550Kg, 32,628Kg, 25,269Kg, 26,606Kg and 27,068Kg
respectively.
The maximum usage of Gluten is in the year 2060/061 i.e. 36,550 Kg and the
minimum usage of Gluten is in the year 2062/063 i.e. 25,269Kg. The average usage
of Gluten for the five years period was 29,624.2Kg. It shows that the annual demand of
Gluten is fluctuate in the last five years period.
4.1.4.6 Economic Order Quantity for the year 2064/065 of Gluten
a) i) Mathematical/Formula Method
Annual Demand (A)= 27,068Kg.
Ordering Cost (O)= Rs. 85,725
Carrying Cost (C) = Rs. 13.25

70
Now,
EOQ = 2AO
C
= 2x27068x85725
13.25
= 18715 kg.
ii) Calculation of No. of Order
No. of order = Annual Demand
EOQ
= 27068
18715
= 1.45 times
2 times
b) Trial and Error Method
Table 4.10
Calculation of EOQ of Gluten under Trial and Error Method
No. of
order
Order Size
(Kg.)
Average
Inventory
Carrying
Cost
Ordering
Cost
Total Cost
1. 27,068 13,534 139,325 85,725 265,050
2. 13,534 6,767 89,663 171,450 261,113
3. 9,022 4,511 59,711 257,175 316,950
4. 6,717 3,358 44,494 342,900 387,394
5. 5,412 2,706 35,855 438,625 464,480
Source: Office Records of HSF
On the study of table 4.10, the highest total cost Rs. 464,480 at the 5th order i.e.
5,413Kg order size and the lowest cost Rs. 261,113 at the 2nd order i.e. 13,534kg order
size. Therefore the company should place the two times order size a year with the
13,534Kg order size to maintain the lowest total cost.

71
4.1.5 ABC Analysis
According to the concept of ABC analysis the term of inventory with regard to
raw materials of Him Shree Foods Pvt. Ltd. are categorized as A, B and C on the basis of
their values as shown in the table below.

72
Categorization of raw materials according to ABC Analysis
Category of Item Inventory of Raw Materials Items
A Gluten, Food Colour, Flavor inhancer, MSG, Soup Powder,
Ajitide, Leak Flake
B Palm Oil, Palmolien, Chilly Powder, Dry garlic, packaging
materials
C Maida, Salt, Saya Sauce, Cartoons
Source: Office Records of HSF
Table 4.11
Categorization of Raw Materials inventory according to ABC analysis
with their volume and value.
Category Items (Kg) % of Items Value (Rs.) % of Value
A 112,536 8.75 30,251,328 49.77
B 359,860 28 19,362,291 31.86
C 813,325 63.25 11,165,205 18.37
Total 1,285,721 100 60,778,824 100
Source: Office Records of HSF
On the study of table 4.11, the table shows that the item 'A' covers the minimum
proportion of Raw Materials i.e. 9% on total units of Raw Materials but highest
proportion of value i.e. 49.77%. The item 'B' covers the 28% of Raw Materials on total
units and covers the 31.86% value of R.M. On the other hand, item 'C' covers the highest
proportion of raw materials i.e. 63.25% but covers the lowest proportion of value i.e.
18.3% of total inventory.
4.1.6 Purchasing procedure practice in Him Shree Foods Pvt. Ltd.
Purchasing is the most important function of inventory management. Him Shree
Foods Pvt. Ltd. has purchased different types of raw materials. Such as Maida, Palm Oil,

73
Palmolien, Gluten, Soup powder etc. for the production of Noodles. The company
purchased different types of raw materials by using following purchasing procedure.
4.1.6.1 Collection of Requisition
The purchase manager collects the requisitions from the store department to take
decision for purchase.
4.1.6.2 Decision for purchase
After receiving the purchase requisition from the store the purchase manager
decides what, when and how much to buy.
4.1.6.3 Selection of Purchase
All the required raw materials for the company are not available in local market.
So, the company has to import from third country like India, Thailand and Singapore. For
the selection of supplier company should invite bids or tender from listed suppliers and
on the studying the terms of supply, quality, quantity and price of goods the suppliers
should be selected out of biders or tenderizers. But sometime company has imported
required materials directly from the registered supplier without inviting bids or tender by
opening L.C. and sometimes company has imported required materials other than listed
suppliers without taking consent of board.
4.1.6.4 Purchase Order
After selecting the best supplier, purchase order is prepared by the purchase
department and sent to the vender authorizing him to supply to specified quantity and
quality of materials at the stipulated terms, at the time and place mentioned in it.
4.1.6.5 Storage
Proper and effective storage helps to minimize production cost and provide
efficient service. In Him Shree Foods Pvt. Ltd. the materials are storing in such a way
74
that allows free flow of materials with minimum cost and does not hinder the production,
operation and delivery of goods.
4.1.6.6 Codification of Materials
Codification helps in proper maintenance of stores and facilitates in mechanized
accounting. Among various method of codification, Him Shree Foods Pvt. Ltd. practices
alphabetical method. In this method, the materials are coded using the first alphabetical
of the name of the materials as the starting point of codification and sub-alphabet is used
wherever necessary.
For example,
Maida - Md
Palm Oil - Po
Palmolien - Pm
Soup Wraper - Spw
Chicken Soup - SPCK
The finished products of Him Shree Foods Pvt. Ltd. are noodles like RARA,
Aaha, A-One, Mazako, Aaha-50, RARA Junior, Fewa Chicken, Fewa Mutton, Few
Vegetable etc. All these noodles are coded on the basis of their weight and flavour. For
example,
RARA. - RR75
Aaha - AA70
Fewa Chicken - FWCK65
Fewa Mutton - FWMth65
Mazako - MZKO 35

75
4.1.7 Stock Maintenance
Every manufacturing company has to maintain its stock in systematic manner so
that the company has not faced any problem with regarding the stock. In Him Shree foods
Pvt. Ltd. the physical stock available in the store. They are counted, weighted, measured,
listed and then properly recorded in Bin Card in volume as well as in store ledger in
volume and its value.
Him Shree Foods Pvt. Ltd. practices physical checking method also. In this
method raw materials and finished goods are counted and checked on weekly and
monthly basis and report is submitted to the store manager.
4.2 Major Findings
By analyzing the data, the most remarkable findings related to this study have
been presented as follows:
1. The main raw materials of Him Shree Foods Pvt. Ltd. are maida, palm oil,
Palmolien, Gluten, food color, soup powder, wrapper, soup wrapper etc. and
finished products are RARA, Aaha, Aaha-50, Mazako and Fewa etc.
2. The Him Shree Foods ·Pvt Ltd. purchase raw materials through local market,
India and third countries as far as the availability and necessity.
3. The company just started paper work of EOQ model but not follows exactly EOQ
model, ROL model for the management of inventory. Basically their focus on
demand and supply.
4. The percentage of raw materials on total inventory from the fiscal year 2060/061
to 2064/065 is 36.95%, 37.15%, 38.89%, 36.66%, 39.77% respectively and the
average is 37.88% during the study period.
5. The trend of purchasing materials of Him Shree Foods Pvt. Ltd. is
fluctuating in every year.
6. The percentage of finished goods to total inventory from the fiscal year 2060/061
to 2064/065 is 55.49%, 54.69%, 52.44%, 52.90% respectively and the average is
53.83% during the study period.

76
7. Inventory turnover ratio is an indicator of the efficiency of management. The ITR
of Him Shree Foods Pvt. Ltd. is fluctuating during the study period. In the fiscal
year 2060/061 the ITR of the company is 27.54 times but it is decreases in year
2060/061 to 14.91times. In the year 2062/063 it increased drastically to 50.55
times and again decrease in the next year 2063/064 to 22.31 times. In the year
2064/065 it increase to 29.43 times. The average inventory turnover ratio during
the study period was 28.95 times.
8. Inventory conversion period shows the number of days to complete the raw
materials into finished goods. The lowest inventory conversion period shows
more efficient than the longer conversion period. The lowest conversion period
was 5.93 days in the year 2062/063 and the longest conversion period was 20.12
days in the year 2061/062. The average conversion period of Him Shree Foods
Pvt. Ltd. during the study period was 10.36 days.
9. The Him Shree Foods Pvt. Ltd. has applied the ABC analysis. According to ABC
analysis, Him Shree Foods Pvt. Ltd. categorized Gluten, Food colour, Flavor,
inhancer, MSG, soup Powder, ajitide, Leak Flake in item 'A', Palm Oil,
Palmolien, Chilly Powder, dry garlic, packaging materials in item 'B' and maida,
salt, soya sauce,
10. Cartoons are in item 'C'. In order to minimize inventory cost the company paid
more attention to handled item 'A' than item 'B' and 'C'.
11. The informal interview with the purchasing manager of Him Shree Foods reveled
that the company adopted the centralized purchasing system of raw materials.
While selecting the suppliers the websites of potential suppliers are browsed and
the preferable one is selected and corresponding for the required materials with
quality, quantity and terms and conditions.
12. Regarding the questionnaire the Him Shree Food Industry Pvt. Ltd. has applied
cash and credit basis for the purchasing materials and adopted FIFO method for
issue of inventory.

77
13. Regarding the questionnaire the company used to prepare the inventory planning.
Sometime the middle level management and the purchasing manager has made
and handled the inventory.
14. Finished goods and raw materials are coded alphabetically on the basis of brand,
weight and flavor.
15. The stock of raw materials and finished goods are checked at the end of the week
and month regularly and as per the need of the company.
16. The stock of raw materials and finished goods are recorded in Bin Card and store
ledger that both the quantity and value can be verified as per the need of the
company.
CHAPTER V
SUMMARY, CONCLUSIONS AND RECOMMENDATION
5.1 Summary
Government of Nepal has facilitated or helped to establish different types of
manufacturing industries during the different plan, periods with different objectives, i.e.
provision of private utilities, acceleration the rate of economic growth, establishment of
welfare oriented society, create opportunities for employees and to contribute
significantly in the national development as well as to assist in the economic
development of the country.
The establishment of import substituting industries like noodles has great
importance. It is also one of the means among others to achieve the goal of economic
development in our country. In agriculture based country agro-based industry like
noodles producing industries minimize the import of noodles on one hand and employee
the local resources such as labour and materials with in the country on the other hand.
Him Shree Foods previously known as Gandaki Noodles Pvt. Ltd. was established in
2039 B.S. in Pokhara Industrial states as an agro-based import substituting industry with
an objective to help the countries economic growth.
78
Inventory management is one of the most important function in any organization.
A firm can not achieve its goal unless inventories are controlled effectively and capitals is
allocated efficiently. Inventory functions are associated with production, marketing,
finance and administration etc. Inventory constitutes the most significant part of the
current assets. It should therefore be managed efficiently to avoid unnecessary
investment. Timely and modernized inventory management results in the better service to
custom by reducing total cost of production. Therefore this study deals with the inventory
management of Him Shree Food Industries Private Limited.
The main objective of this study is to analyze and examine the present position of
inventory management system of Him Shree Food Pvt. Ltd.
For this study, case study research design has been used to tabulate, analyze and
interpret the primary and secondary data collected from informal interviews and office
records. The collected date are interpreted by using tabulation, bar diagram, EOQ and
other statistical tools i.e. average, percentage, ratios etc.
The analysis of this study includes of inventory management of Him Shree Foods
Pvt. Ltd. and analysis of its effect on present position of inventory management through
tabulation, bar diagram, EQQ, Ratio Analysis. For this purpose the data covering from
the five fiscal year i.e. 2060/2061 to 2064/065.
During the study it has been found that the main raw materials used in Him Shree
Foods Pvt. Ltd. were maida, palm oil, plamolien, gluten, soup powder, MSG etc. Some of
them were bought from local market and some of them imported from India, Thailand
and Singapore. Proper scientific tools and techniques like EOQ, ROL were not applied
for purchase of material but to handle and store the material ABC analysis was used. For
the collection of requisition, selection of supplier and to take purchase decision
appropriate methods was used. Regarding the stock maintenance the company used Bin
Card, Store Ledger and Physical Checking.
5.2 Conclusion
All the data of the study and observation of the researcher are taken from the
interview of the purchase or store officers and the record of the company. It seems that

79
the company is not following scientific method to control or manage the inventory
systematically. It is very necessary to apply theoretical and practical method in ordering
and carrying necessary to apply theoretical and practical method in ordering and carrying
the inventory. This study is just a small parts to fulfill the partial requirement of MBS. So
it helps to improve and requires attention to bring some improvement in inventory
management of Him Shree Foods Pvt. Ltd.
The conclusion of this study as revealed from the analysis can be stated as follows:
1. The company purchased raw materials through local market as far as possible and
purchased from India, China or other third countries.
2. The company just started paper work about EOQ model but not follows the EOQ
model, Re-order level for purchasing decision as well as inventory management.
Normally, the decision is made on the basis of demand and supply. As a result the
leading noodles manufacturing company of Nepal is not able to follow the
scientific techniques of inventory management.
3. The percentage of raw materials and. finished goods inventory on total inventory
was not so fluctuate. It is slightly less or more than the average during the study
period.
4. The inventory turnover ratio and inventory conversion period was found
fluctuated during the study period. It is found that the highest inventory turnover
ratio and the lowest inventory conversion period was in the year 2062/063. It
shows that the production and sales was very effective and efficient in that year.
5. The company has been practiced centralized purchasing. The company is
following the modern technology i.e. e-mail, internet, while selecting the
suppliers.
6. The classification and codification of raw materials and finished goods inventory
is done by alphabetical method which prevents the reputations of goods and helps
to standardize the inventory. It is applied, because easy to understand and operate
frequently.

80
7. The stock of the materials and finished goods are recorded in Bin Card and store
ledger to get the information about the value and volume. Stock of materials are
checked in every week as well as every month. It is traditional method but in
practice because it is very popular and established method.
5.3 Recommendation
The management of inventory in Him Shree Foods Pvt. Ltd is not only
necessary but also compulsion for the better performance. If the company initiates
step of the appropriate management of inventory, certainly it will cope its set
objectives successfully. This study is just a small part of fulfill the partial
requirements of MBS. From the studies, some findings are extracted.
Concerning these findings, it may be appropriate to make some suggestions and
recommendations. Although these suggestions may not enough as well as could
very easily giving negative reflection, but certainly suggest the areas that can be
improved and require attention to bring some improvement in inventory
management of Him Shree Foods Industry Pvt. Ltd.
1. The objective of inventory management is to control the inventory and reliable
investment of working capital for materials. For these purpose Him Shree Food
Industry Pvt. Ltd. should use scientific tools and techniques for inventory
management.
2. It is found that Him Shree Foods Industries Pvt. Ltd. has not used EOQ model for
optimum level of inventory management system. However if possible maximum
stock level, minimum stock level, re-order level as well as economic lot size
should be fixed. This helps the management to strike balance of working capital.
3. The inventory turnover ratio and inventory conversion period of five fiscal years
are found to be fluctuating which is considered to be adverse for the organization.
Therefore the management of the company is suggested to be careful in ordering,
purchasing, stocking and consumption of materials in the future which is maintain
uniformity of inventory turnover ratio and inventory conversion period.
81
4. The company highly depending upon India and other countries for raw materials.
It is recommended that to develop our national economy the company should give
more priority to the domestic suppliers for these raw materials which are available
in the country.
5. Full authority and responsibility should be given to the concern department.
Proper co-ordination should be maintained with the department.

82
BIBLIOGRAPHY
Adam, Evertte E. and Ebert, Jr. Ronald Jenbert (2000), Production and Operation
Management, New Delhi, India: Prentice Hall of India Pvt. Ltd.
Chary, S.N. (1994), Production and Operation Managemen, New Delhi: Tata Mc Graw
Hill Publishing Co. Ltd.
Garret, L and Silver, M (1968), Production Management Analysis, New York: Harcourt
Brance Javanovic Inc.
Hampton, J. John (1986), Financial Decision Making, New Delhi: Prentice Hall of India
Pvt. Ltd.
Ilongren, F.D. (2002), Cost Accounting, New Delhi: Prentice Hall of India Pvt. Ltd.
Jain, S.P. and Narayan K.L. (1991), Cost of Accounting, New Delhi: Kalyani Publishers.
Khan, M.Y. and Jain P.K. (1992), Financial Management, New Delhi: Tata Mc Graw
Hill Publising
Khanal, Peshal (2062), Educational Research Methodology, Kathmandu: Sunlight
Publication.
Kothari, C.R. (1996), Quantitative Techniques, New Delhi: Vikash Publishing House.
Manandhar, K.D. and Shrestha, K.N. (2054), Production and Operation
Management, Kathmandu: Valley Publishers.
Mohan, M. and Goyal, S.N. (1997), Principles of Management Accounting, Agra: Sahitya
Bhawan Publication.
Muhlemann, A. Oakland, J. and Lockyerk (1996), Production Management, New Delhi:
Mc Graw Hill India Pvt. Ltd.
83
Munankarmi, S.P. (1999), Cost and Management Accounting, Kathmandu: Educational
Publishing House.
Pandey, I.M. (1993), Financial Management, New Delhi: Vikas Publishing House Pvt.
Ltd.
Pradhan, Radheshyam (2004), Financial Management, Kathmandu: Buddha Academic
Publisher and Distributors Pvt. Ltd.
Regmi, L.K., Joshi P.R., Chaudhary, A.K. and Fago, G. (2003), Production and
Management, Kathmandu: Buddha Academic Publisher and Distributors Pvt. Ltd.
Sharma, Puspa Raj (2064), Research Methodology with SPSS, Kirtipur: Publishers Durga
Sharma.
Starr, M.K. and David, W.M. (1962), Inventory Control Theory and Practice, New Delhi,
Englewood Chiffs: N.J. Prentice Hall Pvt. Ltd.
Welsch, G.A., Hiton, R.W. and Gordon, P.N. (2001), Budgeting Profit Planning and
Control, New Delhi: Prentice Hall of India Pvt. Ltd.
Weston, J.F and Copeland, T.E. (1992), Managerial Finance, New Work: The Dryden
Press.
Weston, J.F. and Brigham (2004), Essential of Managerial Finance, New York:
Hartcourt Brance College Publishers.
Saru, Ram Kumari (2064), Planning and Controlling of Inventory of Manufacturing
Industries, A Study of Gosheli Packaging House, unpublished Master Degree Diss.
Submitted to P.N.C., Pokhara.
Tiwari, P.R. (2061), A Study on Inventory Management of Staff Trading Corporation
Ltd., unpublished Master Degree Diss. submitted to P.N.C., Pokhara, (T.U.)

84

85
Appendix - 1
Questionnaire
Information Page
Sir/Madam/Miss
I request to you fill up the following questionnaire. Your valuable opinion will
guide to me to prepare master digger's these. I insure that your opinion will not be
disclosed for other purposes.
i) Name of Researcher : Parag Munakarmi
ii) Name of Campus : Prithivi Narayan Campus
iii) Research Title : Inventory Management of Manufacturing
Industries in Nepal with reference to Him
Shree Foods Industries Pvt. Ltd.
iv) Research Submitted to : Office of Dean, Faculty of Management
of Tribhuvan University in partial
fulfillment of MBS programme
Please, tick as (%) on the one or more boxes and fill in the blanks as per required.
Name of Respondent :
Name of Firm :
Address of the Firm :
1. Types of Industry:
a) Partnership [ ] b) Private Ltd. Co. [ ]
c) Corporation [ ] d) Others if any [ ]
2. Objectives of the Company
a) Profit maximization [ ]
b) Wealth maximization [ ]

86
c) Sales maximization [ ]
d) Others if any [ ]
3. What types of purchasing procedure are adopted by H.S.F.?
a) Centralized Purchasing [ ]
b) Decentralized Purchasing [ ]
4. Who controlled the inventory?
a) Manager [ ] b) Store keeper [ ]
c) Accountant [ ] d) Supervisor [ ]
5. What are main products produced by the company?
_____________________________________________________________
6. What are the major types of inventories hold by the company?
_____________________________________________________________
7. From where the company purchase the materials?
a) National Market [ ] b) International Market [ ]
c) Local Market [ ] d) All of above [ ]
8. What are the method used by Him Shree Foods Pvt. Ltd. for holding
inventories?
a) LIFO [ ] b) FIFO [ ]
c) Average cost method [ ]
d) Weighted aviate cost method [ ]
9. Which systems are followed to the purchase?
a) cash [ ] b) Credit [ ]
c) Installment [ ] d) Other if any [ ]
10. Who collected the purchase requisition slip in HSF?
a) Purchase Manager b) Purchase Assistant Manager
c) Store Keeper d) If other please specific _________

87
11. Who makes the purchase decision of HSF?
a) Purchase Manager b) Purchase Assistant Manager
c) General Manager d) If other please specific _________
12. Which department prepares the purchase requisition form in HSF?
a) Purchase Department b) Account Department
c) Central Department d) If other please specific _________
13. What type of systems are followed to the purchase marketing?
a) Tender b) Hand to mouth
c) Blanked Order d) If any places specific _________
14. How many quantities are ordered at a time?
________________________________________________________
15. How many orders are placed at a month?
_________________________________________________________
16. What is the lead time to receive the materials?
_________________________________________________________
17. Who received and checked the materials arrived in HSF?
a) Purchase Manager b) Assistant Purchase Manager
c) Received Clerk d) Others
18. How is the stock maintained in HSF?
__________________________________________________________
19. Does the company prepare the inventory planning?
a) Yes [ ] b) No [ ]
20. If yes, who is the authorized person for inventory planning?
a) Top level Management
b) Middle Level Management
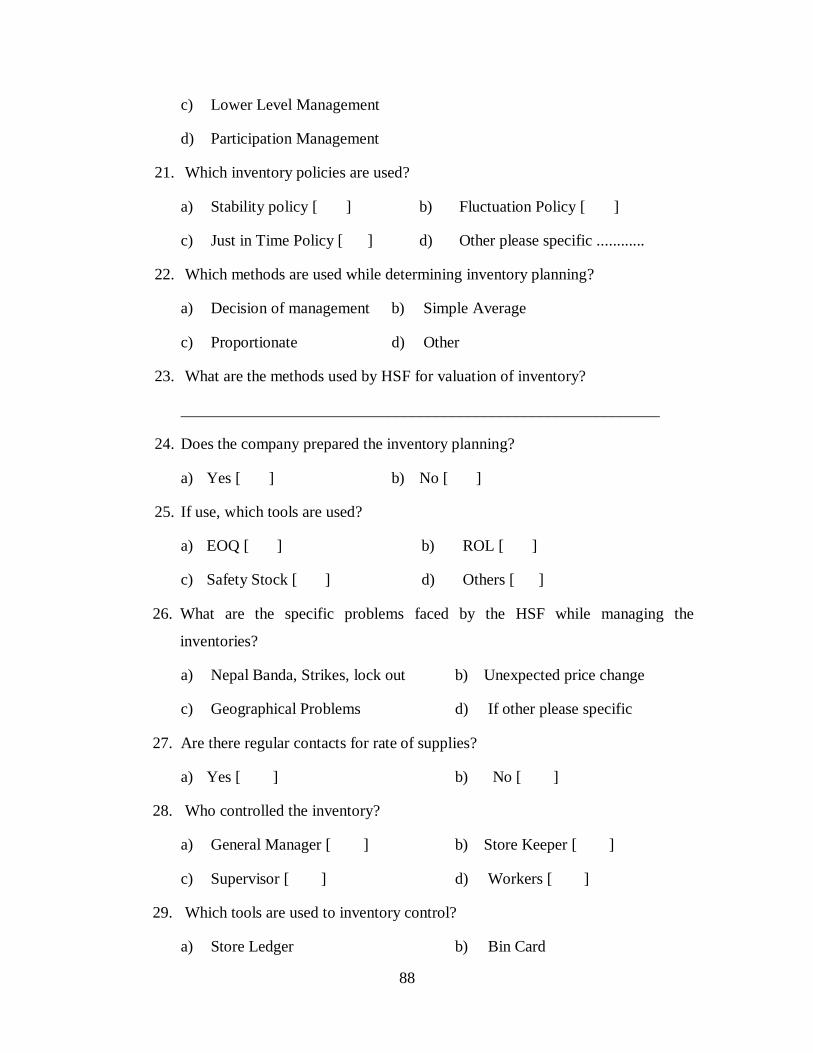
88
c) Lower Level Management
d) Participation Management
21. Which inventory policies are used?
a) Stability policy [ ] b) Fluctuation Policy [ ]
c) Just in Time Policy [ ] d) Other please specific ............
22. Which methods are used while determining inventory planning?
a) Decision of management b) Simple Average
c) Proportionate d) Other
23. What are the methods used by HSF for valuation of inventory?
____________________________________________________________
24. Does the company prepared the inventory planning?
a) Yes [ ] b) No [ ]
25. If use, which tools are used?
a) EOQ [ ] b) ROL [ ]
c) Safety Stock [ ] d) Others [ ]
26. What are the specific problems faced by the HSF while managing the
inventories?
a) Nepal Banda, Strikes, lock out b) Unexpected price change
c) Geographical Problems d) If other please specific
27. Are there regular contacts for rate of supplies?
a) Yes [ ] b) No [ ]
28. Who controlled the inventory?
a) General Manager [ ] b) Store Keeper [ ]
c) Supervisor [ ] d) Workers [ ]
29. Which tools are used to inventory control?
a) Store Ledger b) Bin Card

89
c) Observation d) Others please specific
30. Which method is used for inventory valuation?
a) Cost method b) Average cost method
c) Market value method d) Other if any
31. What are the suggestions for company for correction the inventory
management?
Please Mention ………………………………….…………………………..
"Thank for your kindly co-operation"

90
BIBLIOGRAPHY
Adam, Evertte E. and Ebert, Jr. Ronald Jenbert (2000), Production and Operation
Management, New Delhi, India: Prentice Hall of India Pvt. Ltd.
Chary, S.N. (1994), Production and Operation Managemen, New Delhi: Tata Mc Graw
Hill Publishing Co. Ltd.
Garret, L and Silver, M (1968), Production Management Analysis, New York: Harcourt
Brance Javanovic Inc.
Hampton, J. John (1986), Financial Decision Making, New Delhi: Prentice Hall of India
Pvt. Ltd.
Ilongren, F.D. (2002), Cost Accounting, New Delhi: Prentice Hall of India Pvt. Ltd.
Jain, S.P. and Narayan K.L. (1991), Cost of Accounting, New Delhi: Kalyani Publishers.
Khan, M.Y. and Jain P.K. (1992), Financial Management, New Delhi: Tata Mc Graw
Hill Publising
Khanal, Peshal (2062), Educational Research Methodology, Kathmandu: Sunlight
Publication.
Kothari, C.R. (1996), Quantitative Techniques, New Delhi: Vikash Publishing House.
Manandhar, K.D. and Shrestha, K.N. (2054), Production and Operation
Management, Kathmandu: Valley Publishers.
Mohan, M. and Goyal, S.N. (1997), Principles of Management Accounting, Agra: Sahitya
Bhawan Publication.
Muhlemann, A. Oakland, J. and Lockyerk (1996), Production Management, New Delhi:
Mc Graw Hill India Pvt. Ltd.

91
Munankarmi, S.P. (1999), Cost and Management Accounting, Kathmandu: Educational
Publishing House.
Pandey, I.M. (1993), Financial Management, New Delhi: Vikas Publishing House Pvt.
Ltd.
Pradhan, Radheshyam (2004), Financial Management, Kathmandu: Buddha Academic
Publisher and Distributors Pvt. Ltd.
Regmi, L.K., Joshi P.R., Chaudhary, A.K. and Fago, G. (2003), Production and
Management, Kathmandu: Buddha Academic Publisher and Distributors Pvt. Ltd.
Sharma, Puspa Raj (2064), Research Methodology with SPSS, Kirtipur: Publishers Durga
Sharma.
Starr, M.K. and David, W.M. (1962), Inventory Control Theory and Practice, New Delhi,
Englewood Chiffs: N.J. Prentice Hall Pvt. Ltd.
Welsch, G.A., Hiton, R.W. and Gordon, P.N. (2001), Budgeting Profit Planning and
Control, New Delhi: Prentice Hall of India Pvt. Ltd.
Weston, J.F and Copeland, T.E. (1992), Managerial Finance, New Work: The Dryden
Press.
Weston, J.F. and Brigham (2004), Essential of Managerial Finance, New York:
Hartcourt Brance College Publishers.
Saru, Ram Kumari (2064), Planning and Controlling of Inventory of Manufacturing
Industries, A Study of Gosheli Packaging House, unpublished Master Degree Diss.
Submitted to P.N.C., Pokhara.
Tiwari, P.R. (2061), A Study on Inventory Management of Staff Trading Corporation
Ltd., unpublished Master Degree Diss. submitted to P.N.C., Pokhara, (T.U.)

92
Appendix - 1
Questionnaire
Information Page
Sir/Madam/Miss
I request to you fill up the following questionnaire. Your valuable opinion will
guide to me to prepare master digger's these. I insure that your opinion will not be
disclosed for other purposes.
i) Name of Researcher : Parag Munakarmi
ii) Name of Campus : Prithivi Narayan Campus
iii) Research Title : Inventory Management of Manufacturing
Industries in Nepal with reference to Him
Shree Foods Industries Pvt. Ltd.
iv) Research Submitted to : Office of Dean, Faculty of Management
of Tribhuvan University in partial
fulfillment of MBS programme
Please, tick as (%) on the one or more boxes and fill in the blanks as per required.
Name of Respondent :
Name of Firm :
Address of the Firm :
1. Types of Industry:
a) Partnership [ ] b) Private Ltd. Co. [ ]
c) Corporation [ ] d) Others if any [ ]
2. Objectives of the Company

93
a) Profit maximization [ ]
b) Wealth maximization [ ]
c) Sales maximization [ ]
d) Others if any [ ]
3. What types of purchasing procedure are adopted by H.S.F.?
a) Centralized Purchasing [ ]
b) Decentralized Purchasing [ ]
4. Who controlled the inventory?
a) Manager [ ] b) Store keeper [ ]
c) Accountant [ ] d) Supervisor [ ]
5. What are main products produced by the company?
_____________________________________________________________
6. What are the major types of inventories hold by the company?
_____________________________________________________________
7. From where the company purchase the materials?
a) National Market [ ] b) International Market [ ]
c) Local Market [ ] d) All of above [ ]
8. What are the method used by Him Shree Foods Pvt. Ltd. for holding
inventories?
a) LIFO [ ] b) FIFO [ ]
c) Average cost method [ ]
d) Weighted aviate cost method [ ]
9. Which systems are followed to the purchase?
a) cash [ ] b) Credit [ ]
c) Installment [ ] d) Other if any [ ]
10. Who collected the purchase requisition slip in HSF?

94
a) Purchase Manager b) Purchase Assistant Manager
c) Store Keeper d) If other please specific _________
11. Who makes the purchase decision of HSF?
a) Purchase Manager b) Purchase Assistant Manager
c) General Manager d) If other please specific _________
12. Which department prepares the purchase requisition form in HSF?
a) Purchase Department b) Account Department
c) Central Department d) If other please specific _________
13. What type of systems are followed to the purchase marketing?
a) Tender b) Hand to mouth
c) Blanked Order d) If any places specific _________
14. How many quantities are ordered at a time?
________________________________________________________
15. How many orders are placed at a month?
_________________________________________________________
16. What is the lead time to receive the materials?
_________________________________________________________
17. Who received and checked the materials arrived in HSF?
a) Purchase Manager b) Assistant Purchase Manager
c) Received Clerk d) Others
18. How is the stock maintained in HSF?
__________________________________________________________
19. Does the company prepare the inventory planning?
a) Yes [ ] b) No [ ]
20. If yes, who is the authorized person for inventory planning?

95
a) Top level Management
b) Middle Level Management
c) Lower Level Management
d) Participation Management
21. Which inventory policies are used?
a) Stability policy [ ] b) Fluctuation Policy [ ]
c) Just in Time Policy [ ] d) Other please specific ............
22. Which methods are used while determining inventory planning?
a) Decision of management b) Simple Average
c) Proportionate d) Other
23. What are the methods used by HSF for valuation of inventory?
____________________________________________________________
24. Does the company prepared the inventory planning?
a) Yes [ ] b) No [ ]
25. If use, which tools are used?
a) EOQ [ ] b) ROL [ ]
c) Safety Stock [ ] d) Others [ ]
26. What are the specific problems faced by the HSF while managing the
inventories?
a) Nepal Banda, Strikes, lock out b) Unexpected price change
c) Geographical Problems d) If other please specific
27. Are there regular contacts for rate of supplies?
a) Yes [ ] b) No [ ]
28. Who controlled the inventory?
a) General Manager [ ] b) Store Keeper [ ]
c) Supervisor [ ] d) Workers [ ]

96
29. Which tools are used to inventory control?
a) Store Ledger b) Bin Card
c) Observation d) Others please specific
30. Which method is used for inventory valuation?
a) Cost method b) Average cost method
c) Market value method d) Other if any
31. What are the suggestions for company for correction the inventory
management?
Please Mention ………………………………….…………………………..
"Thank for your kindly co-operation"