Embed Size (px)
Citation preview

CHAPTER – 1
1

INTRODUCTION
2
INTRODUCTION OF INVENTORY MANAGEMENT:
Inventories are the stock of products sold by a firm and the components that make
up the product while the trading firms buy finished products on wholesale and sell them
for profit, the manufacturing firms buy raw materials, process them, convert them into
finished goods and sell yourself them.
The firm should maintain sufficient stock of finished goods to see that sales are
made as and when demanded. Similarly stock of material should be maintained to have
uninterrupted production activities. Inventories form a link between purchase and sales of
a firm. As they represent assets, they require investment and thus involve commitment of
firm’s financial resources.
Definition of Inventory Management:
Inventory control may be defined as the “systematic control over the procurement,
storage & usage of materials so as to maintain an even flow of materials and avoiding at
the same time excessive investment in inventories”.
Material control covers 3 stages namely
1. Purchase of materials.
2. Storing of materials &
3. Issue of materials.
Inventory Management is the active control program which allows the
management of sales, purchases and payments.
Inventory management is a very high complexed process that involves many
variables such as purchase of raw materials, goods in process and storage of finished
goods.
3
Nature of Inventory:
Manufacturing firms have 3 types of Inventories. They are:
1. Raw Material.
2. Work in Progress &
3. Finished Goods.
Manufacturing firms should always maintain stock of raw materials because they
should be continuously supplied to production departments. If for any reason, there is
shortage of materials, the production activity has to be stopped.
As production is a continuous process, there will be work-in-progress i.e.,
materials which are in process not yet completely converted into finished goods. This
represents work-in-progress inventory. Similarly the firm should maintain stock of
finished goods to sell them whenever they are demanded. I case of trading concerns,
inventory comprises mostly finished goods.
Need For Holding Inventories:
The purpose of maintaining inventories is to uncouple various operations of the
firm i.e., each function should be made independent. If finished goods stock are
maintained, even if there is a delay in production activity, will go on; If work-in-progress
and raw materials stocks are maintained, the production activity will go on even if there
is delay in procuring raw materials.
A manufacturing firm requires supply of raw materials to enable uninterrupted
production. As there is a time gap between placing order for materials and actually
acquiring them, it is always necessary to maintain some quantity in stock.
4
If goods are not supplied when demanded, the firm may lose customers. But huge
inventories involve large financial resources not only to buy them, but even to maintain
them. Because of financial constraints, the should restrict the investment in inventories.
The question of managing materials arises only when the company holds
materials. Maintaining materials involves trying up of the company’s funds and
incurrence of storage and handling costs. If it is expensive to maintain materials, why do
companies hold material? There are 3 general motives for holding materials.
1. Transactions Motive.
2. Precautionary Motive &
3. Speculative Motive.
5
OBJECTIVES OF THE STUDY
The Present Study is based on Following Objectives:
1. To study the raw material being used.
2. To study the inventory management process.
3. To calculate Economic Order Quantity and Lead Time Consumption.
4. To calculate Reorder Level & Maximum Stock.
5. Activity Based Costing of Inventory.
6
SCOPE OF THE STUDY
The Scope and Period of Study is Restricted to the Followings:
1. The Scope is limited to the operations of “HETERO DRUGS LIMITED”.
2. The Information obtained from the Primary & Secondary Data was limited to
“HETERO DRUGS LIMITED”.
3. The key Information Performance Indicates was taken from 2009-13.
4. The Profit & Loss, the Balance Sheet was as on last 5 years.
5. Comparison Analysis was done in Comparison of Sister Units.
7
IMPORTANCE OF THE STUDY
1. Inventory Management helpful to study various factors.
2. It’s helpful to hold safety stock.
3. It’s helpful to purchase raw materials in reasonable prices.
4. It’s helpful to reduce wastage of raw materials.
5. It’s helpful to effective resource utilization.
6. Inventory Management helpful to measure standardization of stock.
7. Inventory Management helpful to issue of products effectively.
Sample Size:
The sample for the study was chosen by means of simple random sampling technique.
The sample covers all categories of employees from several departments of the company.
As the study was intended to measure the effectiveness of Inventory Management. It was
decided not to restrict the study to particular department (or) section. Hence the sample
covers the stock from various departments. The size of sample was fixed to 5 years.
8
LIMITATIONS OF THE STUDY:
The following are the various limitations faced during the entire study.
1. The study is confined to a period of last 5 years. As most of the data is from
secondary sources.
2. The Accuracy is limited. Any changes occurring in year are not annualized.
3. Non-Uniformity of data.
4. Data insufficiency.
5. Hypothetical Analysis.
9
RESEARCH METHODOLOGY
1. The material management mechanism is studied in details.
2. The various factors of inventory management are studied in details.
3. The technical analysis is respect to Economic Order Quantity; Activity Based
Costing techniques have been studied.
The data is collected from the “HETERO DRUGS LIMITED”, Bonthay pally Unit with the help of Primary & Secondary Data.
PRIMARY DATA:
1. Interaction with the Planning and Development department.
2. Interaction with the Finance department.
3. By approaching the experts of the concerned field.
SECONDARY DATA:
1. Material Management Manual of “HETERO DRUGS LIMITED”.
2. Accounting Manuals of “HETERO DRUGS LIMITED”.
3. Browsing various websites through internet.
4. Referring various journals & books.
10
CHAPTER -2
REVIEW OF LITERATURE
11
INTRODUCTION TO ACCOUNTING:
According to Smith & Ashburn, “Accounting is the science of recording and
classifying transactions and events, primarily of financial character and the art of making
significant summaries, analysis and interpretations of that transaction and events and
communicating the results to persons who must make decisions or form judgments”.
Accounting information is used by different people for different purposes.
Financial Accounting deals with preparation of Profit & Loss A/c and Balance Sheet,
catering to the requirement of owners, prospective investors, creditors and serves as a
basis for providing information to other udders.
Cost Accounting deals with classification, computation and analysis of costs on
different basis, providing useful information to managers, employees, government and
other users. Management Accounting, deals with processing of data generated.
1. Financial Accounting:
“Financial Accounting consists of classification, recording and analysis of
transactions in a subjective manner according to the nature of expenditure so as to enable
the presentation at periodic intervals of statement of profit or loss of the business and, on
a specified date, of its financial state of affairs”.
The day-to-day transactions are journalized, posted in the ledger and a Balance
Sheet is prepared. Without Financial Accounting it would have been difficult for any
enterprise to know the profit or loss made by it and its position as on a particular date.
12
2. Cost Accounting:
The ICMA (London) in its publication ‘Terminology of Cost Accounting’
defines Cost as “the amount of expenditure, actual or national, incurred on or attributable
to a given thing”. Costing as “the technique and process of ascertaining costs”. Cost
Accounting as “the process of accounting for cost from the point at which expenditure is
incurred or committed to the establishment of its ultimate relationship with cost centers
and cost units”.
3. Management Accounting:
Management Accounting is that branch of accounting that provides information to
management according to its needs. Management is definitely interested in the usual
figures of Profit/Loss, positions of assets and liabilities etc. However, it is more
concerned with information that helps it in its basic functions of planning, organizing and
control. Management has to set goals for the organization, evaluate various means by
which they can be achieved and select the best alter.
INTRODUCTION OF INVENTORY MANAGEMENT:
Inventories are the stock of products sold by a firm and the components that make
up the product while the trading firms buy finished products on wholesale and sell them
for profit, the manufacturing firms buy raw materials, process them, convert them into
finished goods and sell yourself them.
The firm should maintain sufficient stock of finished goods to see that sales are
made as and when demanded. Similarly stock of material should be maintained to have
uninterrupted production activities. Inventories form a link between purchase and sales of
a firm. As they represent assets, they require investment and thus involve commitment of
firm’s financial resources. Excessive inventories disrupt the production/sales activity.
Thus efficient and effective inventory management aims at maintaining just adequate
stocks which are neither excessive nor inadequate.
13

Definition of Inventory Management:
Inventory control may be defined as the “systematic control over the procurement,
storage & usage of materials so as to maintain an even flow of materials and avoiding at
the same time excessive investment in inventories”.
Material control covers 3 stages namely
1. Purchase of materials.
2. Storing of materials &
3. Issue of materials.
Inventory Management is the active control program which allows the
management of sales, purchases and payments.
Inventory management is a very high complexed process that involves many
variables such as purchase of raw materials, goods in process and storage of finished
goods.
Nature of Inventory:
Manufacturing firms have 3 types of Inventories. They are:
1. Raw Material.
2. Work in Progress &
3. Finished Goods.
Manufacturing firms should always maintain stock of raw materials because they
should be continuously supplied to production departments. If for any reason, there is
shortage of materials, the production activity has to be stopped.
14
As production is a continuous process, there will be work-in-progress i.e.,
materials which are in process not yet completely converted into finished goods. This
represents work-in-progress inventory. Similarly the firm should maintain stock of
finished goods to sell them whenever they are demanded. I case of trading concerns,
inventory comprises mostly finished goods.
Because of large size of inventories required to be maintained, considerable funds
are to be invested in them. As maintaining inventories have financial implications, their
efficient management becomes an essential part of financial management of a firm. The
decision regarding the levels of inventories to be maintained are not taken only by the
financial manager, but various others also are involved in it.
For example, sales manager desires to have huge stock of finished goods in order
to meet customers’ demands instantaneously. Production Manager wants to have
continuous supply of raw materials to see that production process runs smoothly without
any interruption; purchase manager wants to maintain sufficient stock of raw materials to
see that production department’s demands are met on time. Though inventory is more
directly related to production sales departments, financial manager has an active role to
play in efficient management of inventories because of financial implication.
1. Raw Materials:
Raw materials are those basic inputs are converted into finished products through
the manufacturing process. Raw materials are those units which have been purchased and
stored for future production. They are required to carry out production activities
uninterruptedly. The quantity of raw materials required will be determined by the rate of
the consumption and the time required for replacing the supplies. The factors like the
availability of raw materials and govt. regulations etc, too affect the stock of raw
materials. Raw material turn over ratio indicates the number of time material is replaced
during the year. To judge whether the ratio if a firm is satisfactory or not, it should be
compared over a period of the basis or trend analysis.
15
In general, a high material turnover is better than a low ration. Yet a very high
ratio is calls for a careful analysis. It is indicate of under investment in very low level of
inventory has serious implications. It is also likely that the firm may be following a
policy of replenishing it stock in too many small sizes. Similarly, very low inventory
turnover ratio is dangerous. It signified excessive material or ever investment. Carrying
excessive material involves the cost in terms of interest on funds of rental space and so
on. Similarly, a very low material turn over ratio is dangerous. It signified excessive
material or over investment. Carrying excessive inventory involves the cost in terms of
interest of funds of rental space and so on. Thus, a firm should have neither too low
material turnover. To avoid “stock out list” associated with a high ratio and the cost of
carrying the excessive material; there should be reasonable level for miss ratio. The firm
would be well advised to maintain a close watch on the trend of the ratio.
Raw Material Turnover Ratio can be calculated as follows:
Cost of raw material used
Raw Material Turnover Ratio = --------------------------------------------
Average Inventory
2. Work-in-Process:
Work-in-process is also called as stock in process. It refers to goods in the
intermediate stages of production. These are semi manufactured products. They represent
products that need more work before they become finished product for sale. The work in
process is that stage of stocks which are in between new materials and finished goods.
The raw materials enter the process of manufacturing but they are yet to attain the final
shape of finished goods. The quantum of work in process depends upon the time taken in
manufacturing process. The greater the time taken in manufacturing, the more will be the
amount of work-in-process.
16
3. Finished Goods:
The finished goods materials are those completely manufactured products which
are ready for sale. Stocks of raw materials and work-in-process facilitate production,
while stock of finished goods is required for smooth marketing operations. These are
goods, which are ready for consumers. The stock of finished goods provides a buffer
between production and market.
The purpose of maintaining material is to ensure proper supply of goods to the
customer. In some concerns the production is under taken on order basis. In these
concerns there will not be a need for finished goods inventory. The need for finished
goods stocks will be more when production is undertaken in general with out waiting for
specific orders. Thus, inventory serves as the link between the production and
consumption of goods.
The levels of 3 kinds of inventories for a firm depend on the nature of its
business. A manufacturing firm will have substantially high levels of 3 kinds of
materials, while a retail or wholesale firms will have a very high level of finished goods
in material and no raw material and work in process stock.
Within manufacturing firms there will be difference. Large heavy engineering
companies produce long production cycle products; therefore, they carry large materials.
On the other hand, materials of Consumer Product Company will not be large because of
short production cycle and fast turnover. A fourth kind of material, supplies is also
maintained by firms these materials do not directly enter production, but are necessary for
production process.
Usually, these supplies are small part of total material and do not involve
significant investment. Therefore, a sophisticated system of inventory control may not be
maintained for them.
17
Need For Holding Inventories:
The purpose of maintaining inventories is to uncouple various operations of the
firm i.e., each function should be made independent. If finished goods stock are
maintained, even if there is a delay in production activity, will go on; If work-in-progress
and raw materials stocks are maintained, the production activity will go on even if there
is delay in procuring raw materials. A manufacturing firm requires supply of raw
materials to enable uninterrupted production. As there is a time gap between placing
order for materials and actually acquiring them, it is always necessary to maintain some
quantity in stock.
If goods are not supplied when demanded, the firm may lose customers. But huge
inventories involve large financial resources not only to buy them, but even to maintain
them. Because of financial constraints, should restrict the investment in inventories. The
question of managing materials arises only when the company holds materials.
Maintaining materials involves trying up of the company’s funds and incurrence of
storage and handling costs. If it is expensive to maintain materials, why do companies
hold material? There are 3 general motives for holding materials.
1. Transaction Motive:
Emphasizes the need to maintain materials to facilitate smooth production and
sales operations.
2. Precautionary Motive:
Necessities holding of materials to guard the risk of unpredictable changes in
demand and supply forces and other factors.
3. Speculative Motive:
Influences the decision to increase or reduce material levels to take advantage of
price fluctuation.
18
Objectives of Inventory Management:
Large size inventories are require to ensure continuous and uninterrupted
production and efficient sales activity; but at the same time maintaining huge inventories
also reduce the profitability of the firm because they involve some costs. One cost
involved is the carrying cost. The stock purchased should be stored. The large the goods
purchased bigger should be the store were house bigger the size, the higher the cost-rent,
insurance, store keeper’s salary etc.
Another cost is financing cost. Maintaining huge stocks require amounts to be
invested in them. These funds are to be maintained to be financed at a cost. Thus efficient
management involves meeting 2 conflicting needs:
1. Maintaining large stocks of inventories to achieve efficient and smooth
production and effective sales.
2. To ensure regular and uninterrupted supply of materials i.e., to make materials
available as and when they are needed.
3. To keep investments in stock at a reasonable level, so that there is no loss of
interest on capital.
4. To purchase the materials at a reasonable price without sacrificing the quantity of
such materials.
5. To avoid abnormal wastage by exercising direct control.
6. To avoids the risk of spoilage obsolescence of the materials by fixing the
maximum stock level; and
7. Restricting the inventories to the minimum to maximize the profitability.
Thus, inventory management decisions involve a trade off between profitability
and risk. The level of inventories maintained should neither be excessive nor inadequate.
19
Scope of Inventory Management:
Inventory management is a very simple concept - don't have too much stock
and don't have too little. Since there can be substantial costs involved in straying
above and below the optimal range, careful inventory management can make a
huge difference in the profitability of a business. Although the concept is simple,
the process of getting the right balance can be quite a complex and time
consuming task without the right technology. There are two fundamental questions
that must be answered, in order to manage the inventory of any physical item -
when to order and how much to order.
LSS will provide technical and economical expertise, at no charge, to assist
in determining probable valves to include in an inventory management program.
Methods to be used will include repair cost economics and the frequency of use
criteria of certain valve sizes, pressure, and type.
1. Usage of surplus inventory is cost effective.
2. Offers better control on deliveries.
3. Utilizes company assets.
4. Adds $ to the bottom line.
5. Avenue to sell un-needed equipment
6. No Cost until repair is performed.
7. Saves Valuable time and effort for the customer.
8. Ease accounting functions through reporting.
9. Vast types of equipment serviced.
10. Centralizing inventory for easier accessibility will lead to more complete
Surplus inventory utilization.
20
Functions of Inventory Management:
Inventory management is a highly complex process that involves many
variables. A business must coordinate receiving and stowing with outbound
shipments, always ensuring there is ample space for new stock and that all items
are accounted for. The flow of goods in and out of a business must be monitored
closely to identify market trends and to create strategic plans for the enterprise’s
future.
1. Flow of Goods:-
Not only must a business keep track of the goods coming in and going out,
it must also track the costs to procure, store, sell and ship these goods. The
company must also account for damage, loss, and labor costs associated with
handling the merchandise. Inventory management software allows an enterprise to
track all of these things, while detailing the precise location of goods to allow for
fast and efficient order picking.
2. Replenishment:-
Inventory Management Software The business can determine the
appropriate ordering times for inventory replenishment with inventory
management software. Software allows for controls to be set that determine stock
levels for reorder, ensuring the business always have enough products to meet
demand. The software even helps determine what an item’s reorder point should
be by taking in factors like lead time, seasonal changes and the time between
receiving and stowing. These settings can easily be altered when needed.
21
3. Additional Functionality:-
Some software packages carry other functions that allow the company to
extend operations beyond brick and mortar, addition E-commerce capabilities.
Further enhancements allow the business to consolidate shipments, and process
back orders, returns and substitutions.
4. Choosing the Right Software:-
Selecting the right software will depend on the scrutiny the company places
on core business functions. It is easy to become distracted by the bonus features
some software offers. A business must determine the core functions needed and
focus on acquiring software that fills those needs most efficiently. It is not safe to
assume a given software package has the basic functionality all businesses should
have. Always scrutinize the list of functions the software vendor provides and ask
questions to fully understand the depth of capability for each function.
5. Tailoring to Business Needs:-
Not all software is created alike and most packages were designed with
specific businesses in mind and then later marketed to a wider audience. For this
reason, it is vital that a company seek software that fits the core business model.
Manufacturers will seek to find software design specifically for that type of
business.
6. Customer Service:-
No company should purchase a software package without first speaking to
other clients who use the software. While contacts can be made through the
salesman, it is obvious that the salesman will only point to positive reviews. A
business can research forums online to connect with other users of a software and
collect user experiences before making a purchase decision. The research should
focus on customer satisfaction, responsiveness of the help desk and ease of use.
22
Advantage of Inventory Management:
Advantage of Inventory reconciliation Management for Accounting
Software. Inventory Reconciliation Management is indispensable for the
successful, efficient inventory reconciliation auditing of any organization.
Inventory Reconciliation is the ideal solutions to validate the data your business
depends upon.
Advantages of high level of stocks are many like it provides a buffer to the
companies against the high demands. If the prices of the products are expected to
increase in future then a high level of inventory
Can also give a capital gain to the companies. High level of stocks can also
eliminate the risk of fall of supply in the future. Shortages of goods in the market
in future can be handled by keeping high levels of inventory.
Disadvantage of Inventory Management:
On the other hand, the main disadvantage of keeping high levels of finished
products will increase the costs of the warehouse management. Secondly, if the
prices of the finished goods are expected to fall then the company can get the
capital loss. Poor inventory management can result in the loss of inventory like
obsolete inventory problems.
23
Factors Determining the Level of Inventories:
The level of inventory depends upon a number of factors:
1. Usage during the Period
2. Lead Time
3. Trade Discount
4. Production Cycle Period
5. Demand for the Product.
1. Usage during the Period:
The level of raw material inventory depends upon the quantity of raw materials
used daily. The more the usage, the more will be the stock required. Similarly the stock
of finished goods depends upon the anticipated daily sales of the firm.
2. Lead Time:
Lead time is the time period between placing an order for materials and actually
receiving delivery of these goods in case of raw materials. In case actually receiving
delivery of these goods in case of raw materials. In case of finished goods it refers to
production cycle period i.e., the time taken to convert raw materials and work-in-progress
into finished goods. If materials are to be purchased from a distant place, some times it
may take even a few months to get delivery of these goods after placing an order. In such
cases, huge stocks should be maintained to see that production activity is not stopped for
shortage of materials. Some times unforeseen factors like strikes, bands etc., may cause
further un-anticipated delay in procuring materials. Some safety stock should additionally
be maintained over and above the minimum level to meet such contingencies.
24
3. Trade Discount:
Another reason for acquiring huge raw materials is attractive bulk discounts the
firm can avail on bulk purchases and the expected savings in other costs. For example, if
the materials cost Rs.100/- per unit and if 5% discount is offered on purchase of 300 units
or more, by purchasing 300 units, the price will be reduced to Rs.95/- per unit. Similarly
if the transport costs are Rs.2000/- per truck, a truck load of materials may be purchased
and kept in stock.
4. Production Cycle Period:
Work-in-progress inventory depends upon the length of production process. The
longer the process, the higher would be the inventory. Most of the firms try to reduce the
production cycle period by improving the production techniques. Otherwise huge funds
blocked up in work-in-progress.
5. Demand for the Product:
Stocks of finished goods are determined to sell them on demand. If goods cannot
be supplied when they are on demand, the firm may lose the customer. Frequent delays in
supply of goods results in losing not only the existing customer but even the prospective
customers.
25
Purchase of Materials:
The work of purchasing materials should be handled, of the size of the concern
permits, by a separate purchasing department. Purchasing should be centralized i.e., all
purchases should done by purchasing department except for small purchases which may
be made departmental managers.
The most important function of the purchases department is “to buy and supply
the materials and stores required for various departments of right quality, in right
quantity, and at right time and at right price”. Whenever there is a need for stores a
Purchase Requisition Note is prepared by the storekeeper. It contains particulars
regarding quantity, the quality or material specifications and the by which the materials
are required.
A purchase order prepared by the purchase department and sent to the suppliers,
the purchase order is generally prepared in triplicate. The original copy is sent to the
vendor, the duplicate is sent to the accounting department. The fourth and fifth copies, if
made, are sent to the shopkeeper and the receiving department, respectively.
Inventory Management Techniques:
Efficient inventory management needs a systematic approach. We are using on
the following techniques:
1. Economic Order Quantity.
2. Safety Stock.
3. Re-order Point.
4. Maximum Stock Level.
26
5. ABC Analysis (or) Selective Inventory Control, and
1. Economic Order Quantity:
Economic Order Quantity is a very important dimension if inventory
management. It is that level of quantity which minimizes the total cost of inventory
including ordering costs and carrying costs. This model is based on the following
assumptions.
Usage of particular item of inventory over a period is with certainty and the usage
is even throughout the period.
The cost per is constant and the carrying cost per unit also constant.
There are only 2 costs associated with inventories the carrying costs and the
ordering costs.
There are 2 basic questions relating to inventory management:
What should be the size of the order?
At what level should the order be placed?
To answers the first question the economic order quantity model is helpful. If the
firm is buying raw materials, it has to be purchased on replenishment. This problem is
called order quantity problem and the task of the firm is to determine the optimum or
EOQ.
The determination of the appropriate quantity to be purchased in each lot to
replenish stock as a solution to the order quantity problem necessitate resolution of
conflicting goals buying in large quantities implies a higher inventory level which will
assure.
1. Smooth production / sales operations.
2. Lower ordering or set-up costs.
27
But it involves higher carrying costs. On the other hand small orders wick reduce
the carrying costs of inventory by reducing the average material level but the ordering
costs would increase as there is a likelihood of interruption the operations due to stock-
outs.
A firm should place neither too lame nor too small orders on the basis of trade off
between the benefits from the availability of inventory and the cost of carrying.
To take enough to avail the concessions in purchasing materials.
Ensuring that the materials of requisite specifications and quality have been
received in good condition.
Determining an optimum material level involves 2 types of costs:
A. Ordering Costs:
The term ordering cost is used in case of raw material and includes the entire
costs of acquiring raw materials. They include costs incurred in following activities;
purchase ordering, transporting, receiving and inspecting. Ordering costs increase the
number of orders; thus more frequently the material is acquired the firm’s ordering costs.
On the other hand, if the firm maintains large inventory levels, they will be few orders
placed and ordering costs will be few orders placed and ordering costs will be relatively
small. Thus, the ordering costs decrease with increasing size of inventory.
B. Carrying Costs:
Costs incurred for maintaining a given level of inventory are called carrying costs.
They include storage, taxes, insurance, deterioration, obsolescence incurred in recording
and providing special facial facilities such as fencing, lines etc.
28
Carrying costs vary with inventory size. The economic size of the inventory
would thus depend on trade-off between costs and ordering costs.
EOQ:
The optimum inventory size is commonly referred to as economic order quantity.
It is that order size at which annual total costs of ordering and holding are the minimum.
To find this the formula is:
EOQ = Squire (2AO/C)
Where,
A = Annual Total Requirement,
O = Ordering Costs,
C = Carrying Costs.
Assumptions of EOQ:
1. The forecasts usage / demand for a given period, usually one year, is known.
2. The usage / demand is even throughout the period.
3. Inventory orders can be replenished immediately (there is no delay in placing and
receiving orders).
4. There are 2 distinguishable costs associated with inventories; costs of ordering
and costs of carrying.
5. The cost per order is constant regardless of the size of order.
6. The cost of carrying is a fixed percentage of the average value of inventory.
2. Safety Stock:
It is not always possible to estimate the daily usage of materials or daily sales of
different products with certainty. Similarly the lead time, though can be estimated on the
basis of past experience, due to some unforeseen reason it may get delayed by a few days.
In such cases, if materials are not in stock, sales activity may be stopped or slowed down.
Therefore it is always essential that some safety stock is maintained as a buffer for such
29
contingencies. Thus, “safety stock” is the quantity of stock to be maintained over and
above the ordinary level, to be able to meet such unforeseen situations. The ordinary level
should be adjusted for safety stock.
Thus the formula to determine the re-order point when the safety stock is
maintained is as follows:
Re-order = (Lead Time * Average Usage) + Safety Stock
3. Re-order Point:
The problem, how much to order, is solved by determined the economic order
quantity, yet the answer should be sought to the second problem, when to order. This is a
problem of determining the re-order point under certainty, we should know:
Lead time.
Average usage, and
Economic order quantity.
Re-order Point = (Lead Time * Average Usage)
4. Maximum Stock Level:
The maximum level is the largest quantity of a particular material, which should
be kept in the store at any one time. The fixation of maximum level is necessary to avoid
unnecessary blocking of capital in materials, losses on account of deterioration and
obsolescence of materials, extra overheads and temptation to thefts.
30
The maximum level of material should be decided after taking into consideration
the following:
Storage space.
Availability of working capital.
Seasonal considerations.
Rate of consumptions materials and time necessary in obtaining the new
materials.
Rules framed by govt. for import or procurement.
Cost of storage, insurance, interest on capital invested in stock.
Maximum Stock Level is ascertained by the following:
Maximum Stock Level = Reorder Level + EOQ
5. ABC Analysis (or) Selective Inventory Control:
Usually a firm to maintain several types of materials. It is not desirable to keep
the same degree of control on all the items. The firm should pay maximize attention to
those items whose value is the highest. The firm should, therefore, classify materials to
identify which items should receive the most effort in controlling. The firm should be
selective in its approach to control investment various type of materials. This analytical
approach is called ABC analysis and tends to measure the significance of each item of
material in terms of its value.
The high value it ms are classified as ‘A items’ and would be under the tightest
control. ‘C items’ represent relatively least value and would be under simple control. ‘B
items’ fall in between these 2 categories and require reasonable attention of management.
31
The ABC analysis concentrates on important items and is also known as control by
importance and exception. As items are classified in the importance of their relative
value, this approach is also known as “Proportional Value Analysis”.
The following steps are involved in implementing the ABC analysis:
Classify the items of materials, determining the expected use in units and price
per unit for each item.
Determining the total value of each item by multiplying the expected units by its
unit’s price.
Rank the items in accordance with the total value, giving first rank to item with
highest total value and so on.
Compute the ratios (%) of number of units of each item to total units of all items.
And the ratio of the total value of each item to total value of all items.
Combine items on the basis of their relative value to 3 categories, A, B and C.
32
CHAPTER-III
INDUSTRY PROFILE
33
INDUSTRY PROFILE
Indian bulk drug industry
The independent bulk drug manufacturers in India are currently caught between
the devil and the deep sea, as the option left with them is only the regulated markets or an
earlier closure without suffering huge loss.
The bulk drug units without a formulation activity on their own have been under
tremendous pressure of price war in the domestic market, which has forced them to get
34
into either exports where the global quality standards are to be met or quitting the
business once for all.
The industry sources are -- by large - of the opinion that competing in the
domestic market has become next to impossible as the market is currently flooded with
discounted sales and instant price cuts. The abundant supply, low demand from domestic
formulation companies for the local made drugs and dumping of imported drugs have
together contributed to this chaotic market situation and the result is uncertainty in the
industry, say industry sources.
The production of pharmaceuticals in India increased by 13.68 per cent during the
year 1997-98 against the previous year, the production value of bulk drugs during the
year was only Rs 2,623 crore and that of pharmaceutical formulations was Rs 12,068
crore. However, the exports of Pharmaceuticals during the year 1997-98 was Rs 49780
million, which continued to grow especially in the bulk drug segment in the following
years as the domestic market proved to be uncomfortable for the manufacturers. The
ruling prices of many of the bulk drugs in the domestic market have been on a declining
trend and even touched far below the notified price. From a meager Rs 46 crore worth of
pharmaceuticals, drugs and fine chemicals exports in 1980-81, pharmaceutical exports
has risen to approximately Rs. 6152 crore in 1998-99, with an average growth of 11.91
per cent annually.
Following the de-licensing of the pharmaceutical industry, industrial licensing for
most of the drugs and pharmaceutical products has been done away with; manufacturers
are free to produce any drug duly approved by the Drug Control Authority.
Technologically strong and totally self reliant, the pharmaceutical industry in India has
low costs of production, low R&D costs, innovative scientific manpower, strength of
national laboratories and an increasing balance of trade.
Though domestic pharmaceutical industry output is expected to exceed Rs 260
billion in the financial year 2002, the bulk drugs will account for only Rs 54 billion ie. 21
per cent and formulations the remaining Rs 210 billion with 79 per cent. Reflected in the
35
import export volume during the financial year 2001, there is a conscious move among
the bulk drug manufacturers from the domestic sales to foreign supply. However, during
the year, the imports were Rs 20 billion as against the exports of Rs. 87 billion.
The Indian Pharmaceutical sector is highly fragmented with more than 20,000
registered units. It has increased drastically in the last two decades. The leading 250
pharmaceutical companies control 70 per cent of the market with the market leader
having nearly 7 per cent of the market share. It is an extremely fragmented market with
severe price competition and government price control.
As a result, over 60 per cent of India’s bulk drug production is exported and only
40 per cent is currently sold in the local market to formulators. However, many of the
major formulation companies use their in house production of bulk drugs, where they
themselves have excess capacity.
The industry alleges that though the import of bulk drugs through official channel
have slowed down in the past 2-3 years, the dumping and smuggling of drugs are rampant
at present. This also has caused huge price discounts in the domestic market.
During the last decade the production of bulk drugs has grown from Rs. 240 crore
in 1980-81 to Rs. 1320 crore in 1993-94. Since 1986, the Drug Industry has grown
significantly, as mentioned earlier, in terms of production of bulk drugs and formulations.
In many cases manufacture of bulk drugs has also been established from the desired basic
stage. It is estimated that in case of bulk drug production the contribution of small-scale
sector is approximately 30 per cent of the total production in the country.
It may also be mentioned that the pharmaceutical sector has been able to carve a
special niche for itself in the international market as a dependable exporter of bulk drugs.
However, a number of small bulk drug units who were dependent only on the local
formulation sector are in fixes they are neither in a position to survive in the market with
present local prices nor capable of reaching out to the export market.
36
Thus, the industry sources predicts, at least 70 per cent to 80 per cent of the
independent bulk drug manufacturing units would face extinction from the sector in the
near future as the domestic market does not show any positive signals yet.
Pharmaceuticals are medicinally effective chemicals, which are converted to dosage
forms suitable for patients to imbibe. In it basic chemical form, pharmaceuticals are
called bulk drugs and the final dosage forms are knows as formulations. Usage of
pharmaceuticals is governed by the underlying medical science. The four primary
medical sciences are as under:
Allopathy or modern medicine has gained global popularity.
Ayurveda, an ancient Indian science, mainly herbal remedies.
Unani having Chinese Origin is South East Asia.
Homeopathy, founded by a German Physician, was fairly popular in the
early 20th century.
INDUSTRY SECNARIO:
World-over, the Pharmaceuticals industry is focused on Allopathy, the most
modern medical science. Other modes of medical treatment such Homeopathy,
Ayurveda and Unani are more prevalent in third world countries.
The exports from the Indian pharmaceutical industry to the well regulated market
in United States of America is increasing rapidly, by recording the highest growth in the
current financial year when compared to the recent past.
The Indian pharma exports to US have already recorded a favorable momentum
right from the year 2002, increasing from USD million 489.08 in April 02-March 03 to
USD million 680.50 in April 2005 – March 2006.
From being an import dependent industry in the past 1950,s Indian pharmaceutical
industry has achieved self-sufficiency and gained global recognition as a producer of low
37
cost high quality bulk drug and formulations. Leading Indian companies have developed
infrastructure in over 60 countries including developed markets like USA and EUROPE.
In the last few years several pharmaceutical companies have demonstrated that they
posses the ability to engage in commercially viable research and development activities
and become significant players in the international market.
MAJOR PLAYERS IN PHARMA
Ranbaxy Laboratories
(Sri S T Kalairaj, Chairman)
Ranbaxy is the leader in the Indian pharmaceutical market, taking in $1.174
billion in revenues for a net profit of $160 million in 2004. It was the first Indian
pharmaceutical to have a proprietary drug (extended-release ciprofloxacin, marketed by
Bayer) approved by the U.S. FDA, and the U.S. market accounts for 36% of its sales.
78% of Ranbaxy’s sales are from overseas markets; its offices in 44 countries manage
manufacturing in 7 countries and distribution in over 100.
IMS Health estimated that Ranbaxy is among the top 100 pharmaceuticals in the
world and that it is the 15th fastest growing company. By 2012, Ranbaxy hopes to be one
of the top 5 generics producers in the world, and it consolidated its position with the
purchase of French firm RGP Aventis in 2003. Ranbaxy also has higher aspirations,
however, “to build a proprietary prescription business in the advanced markets.” To this
end, it keeps a dedicated research facility in Gurgaon staffed with over 1100 scientists.
They currently have two molecules in Phase II trials and 3-5 in pre-clinical testing. It
spent $75 million in R&D in 2004, a 43% increase over its 2003 expenditure.
Dr. Reddy's Laboratories
(Dr.K. Anji Reddy, Chairman)
38
Founded in 1984 with $160,000, Dr. Reddy’s was the first Asia-Pacific
pharmaceutical outside of Japan and the sixth Indian company to be listed on the New
York Stock Exchange. It earned $446 million in fiscal year 2005, deriving 66% of this
income from the foreign market. In order to strengthen its global position, Dr. Reddy
acquired UK-based BMS Laboratories and subsidiary Meridian Healthcare.
Although 58% of Dr. Reddy’s revenues come from generic drugs, the company
was committed to WTO-compliance long before the 2005 bill took effect, and most of
these products were already off patent. Dr. Reddy has long been a research-oriented firm,
preceding many of its peers in setting up a New Drug Development Research (NDDR) in
1993 and out-licensing its first compound just four years later. Dr. Reddy’s has since
outlicensed two more molecules and currently has three others in clinical trials.
Although Dr. Reddy’s is publicly-traded, the Reddy family (including
founder/chairman K. Anji Reddy, son-in-law/CEO GV Prasad and son/COO Satish
Reddy) holds a hefty 26% share in the company.
Nicholas Piramal
(Asish Mishra, Chairman)
Now a company grossing $350 million per year, Nicholas Piramal started its
existence with the 1988 acquisition of Nicholas Laboratories and grew through a series of
mergers, acquisitions and alliances. The company has formed a name for itself in the field
of custom manufacturing. It cites its 1700-person global sales force as another core
strength; with its acquisition of Rhodia’s inhalation anesthetics business, Nicholas
Piramal gained a sales and marketing network spanning 90 countries.
Nicholas Piramal is well-poised for the challenge of surviving in the aftermath of product
patent protection. The company has respected intellectual property rights since its
inception and refused to "support generic companies seeking first-to-file or early-to-
market strategies." Instead, it decided to make its own intellectual property and opened a
39
research facility last November in Mumbai with hopes of launching its first drug in 2010
at a cost of $100,000.24.
Chapter-IV
COMPANY PROFIL
40
COMPANY PROFILE
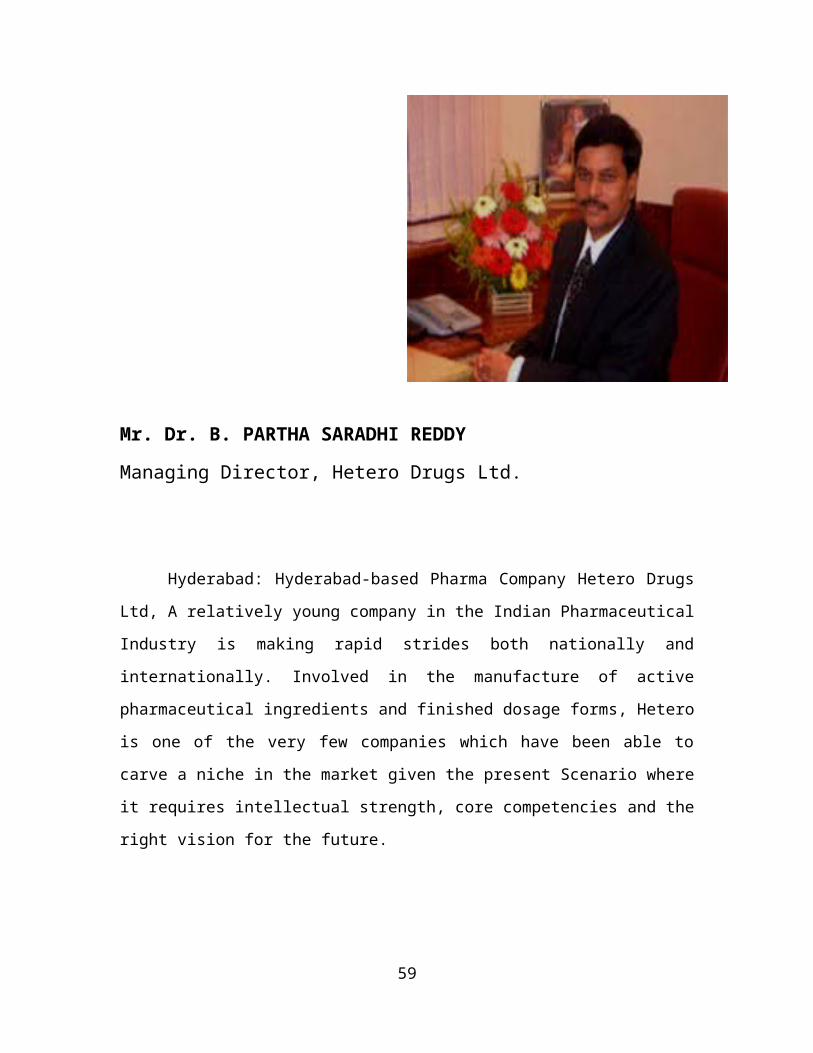
Mr. Dr. B. PARTHA SARADHI REDDY
Managing Director, Hetero Drugs Ltd.
Hyderabad: Hyderabad-based Pharma Company Hetero Drugs Ltd, A relatively
young company in the Indian Pharmaceutical Industry is making rapid strides both
nationally and internationally. Involved in the manufacture of active pharmaceutical
ingredients and finished dosage forms, Hetero is one of the very few companies which
41
have been able to carve a niche in the market given the present Scenario where it requires
intellectual strength, core competencies and the right vision for the future.
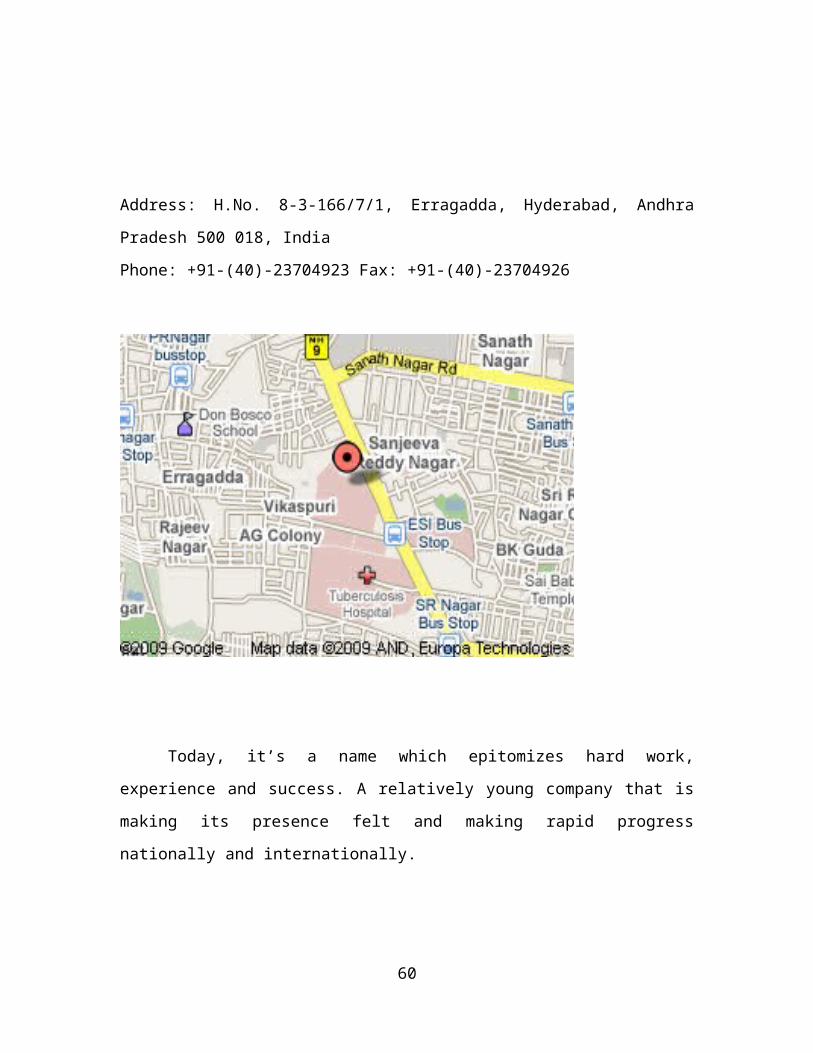
Address: H.No. 8-3-166/7/1, Erragadda, Hyderabad, Andhra Pradesh 500 018, India
Phone: +91-(40)-23704923 Fax: +91-(40)-23704926
Today, it’s a name which epitomizes hard work, experience and success. A
relatively young company that is making its presence felt and making rapid progress
nationally and internationally.
42
Involved in the manufacturing of active pharmaceutical ingredients and finished
dosage forms, Hetero is one of its kinds of the very few companies which have been able
to carve a niche in the pharmaceutical industry given the present scenario where it
requires a right blend of intellectual strength, core competencies and a precise foresight
for the future.
Hetero has come a long way since its inception in the year 1993 to be recognized
as a strong player in the field of pharmaceuticals, as a result of its combined strength in
research, manufacture and marketing.
Established in the year 1993, with the motto to be the best in the API
manufacturing, Hetero today embodies the vision of a top notch player in developing and
commercializing products catering to a variety of therapeutic categories, integrating into
a leading finished dosage manufacturer.
43
True to the Statement, "Where the Future Started Yesterday", with a foresight on the
current trends in the Pharmaceutical Market, Hetero has grown from strength to strength,
combining its Research Strengths, Manufacturing Capabilities, and Human Resources
and well established quality management system.
With full-fledged marketing capabilities, the company has been able to market its
products in over 100 countries in Asia, Middle-east, Eastern Europe and Latin America.
With its compliance to the most stringent regulatory requirements, Hetero has today
gained foothold to market several of its APIs in the United States, Canada and Europe.
With all six manufacturing facilities being supported by excellent infrastructure and
compliance to the GMP requirements, Hetero has crossed numerous milestones in a
comparatively short period since its inception.
Hetero Drugs Ltd has been chosen by the Clinton Research Foundation as one of
the four Indian pharmaceutical companies that would supply HIV/AIDS drugs to four
African and nine Caribbean nations. HDL range of three drug combinations, namely
'Nevirapine', 'Lamivudine', 'Stavudine', were available at a price that AIDS patients in
India could afford
The spirit and brain behind the success story of Hetero is its founder Dr.BPS Reddy, a
Scientist who started the company drawing immense strength from the vast and rich
experience he gained during his earlier stint at the Laboratory where he was instrumental
in developing and commercializing processes for several APIs.
44
The Company was started by him with a vision to be recognized as an aggressive
company that combines its strength of R&D and manufacturing with definite advantages
in terms of cost and chemistry with a strong emphasis on Quality of the products.
The untiring efforts of the Chairman saw Hetero develop processes for several
products at relatively low cost, thus making it possible for several life saving drugs to be
available at affordable prices, meeting all the Regulatory and Quality norms.
With the organization having reached a point where it is identified among the
widely recognized companies, the Chairman is now focusing on giving new dimensions
to the company in terms of exploring possibilities of further growth, exploring new
horizons in the field of Pharmaceutical development and evolving strategies to take the
company to greater heights.
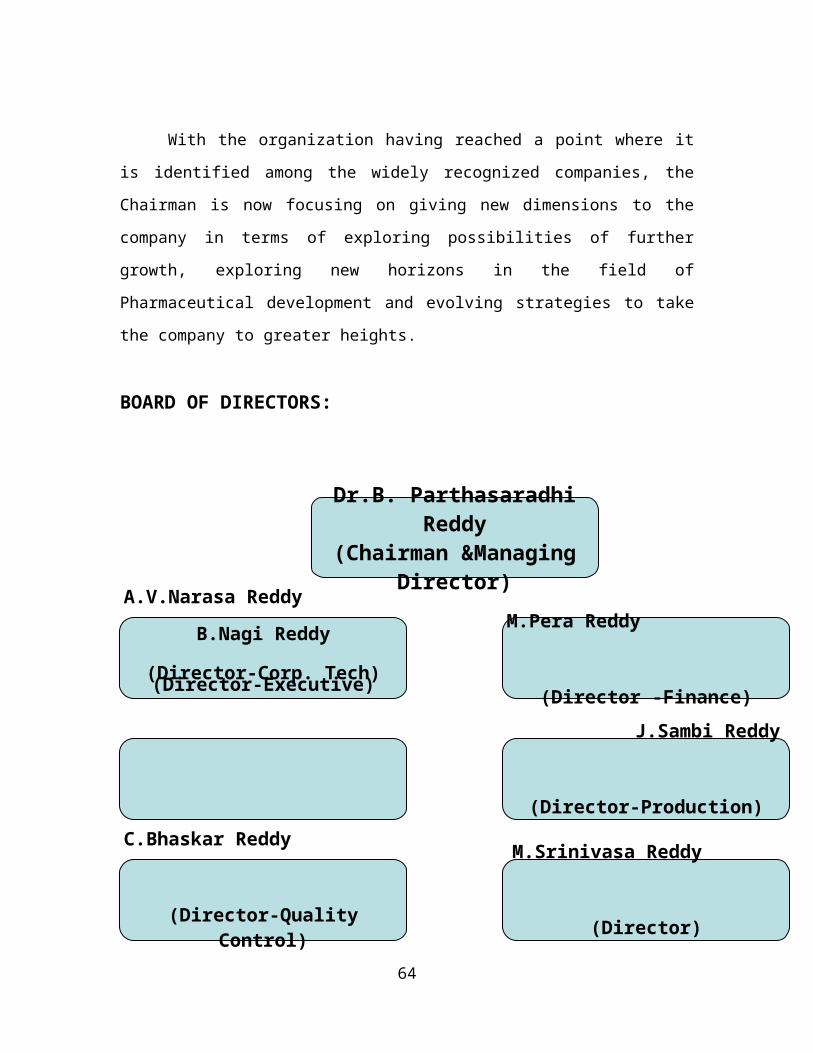
BOARD OF DIRECTORS:
45
46
Dr.B. Parthasaradhi Reddy(Chairman &Managing
Director)
B.Nagi Reddy
(Director-Executive)
M.Pera Reddy
(Director -Finance)
A.V.Narasa Reddy
(Director-Corp. Tech)
J.Sambi Reddy
(Director-Production)
C.Bhaskar Reddy
(Director-Quality Control)
M.Srinivasa Reddy
(Director)
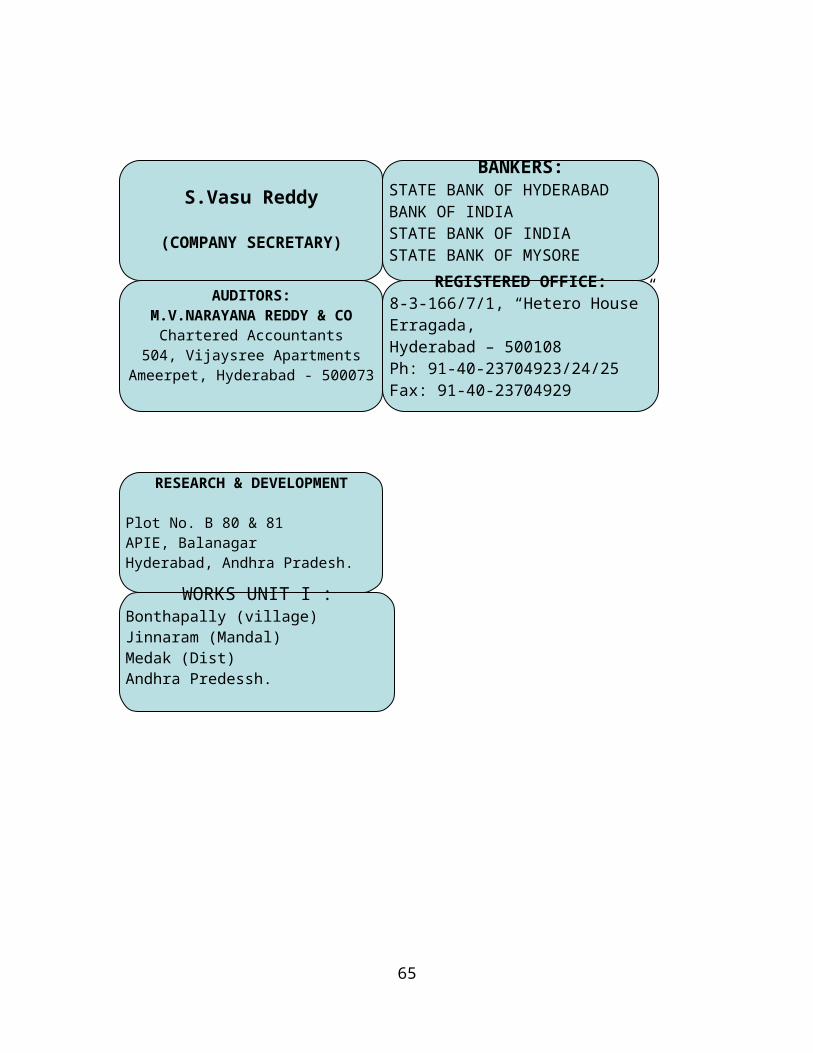
S.Vasu Reddy
(COMPANY SECRETARY)
BANKERS:STATE BANK OF HYDERABADBANK OF INDIASTATE BANK OF INDIASTATE BANK OF MYSORE
AUDITORS:M.V.NARAYANA REDDY & CO
Chartered Accountants504, Vijaysree Apartments
Ameerpet, Hyderabad - 500073
REGISTERED OFFICE:8-3-166/7/1, “Hetero House”Erragada,Hyderabad – 500108Ph: 91-40-23704923/24/25Fax: 91-40-23704929
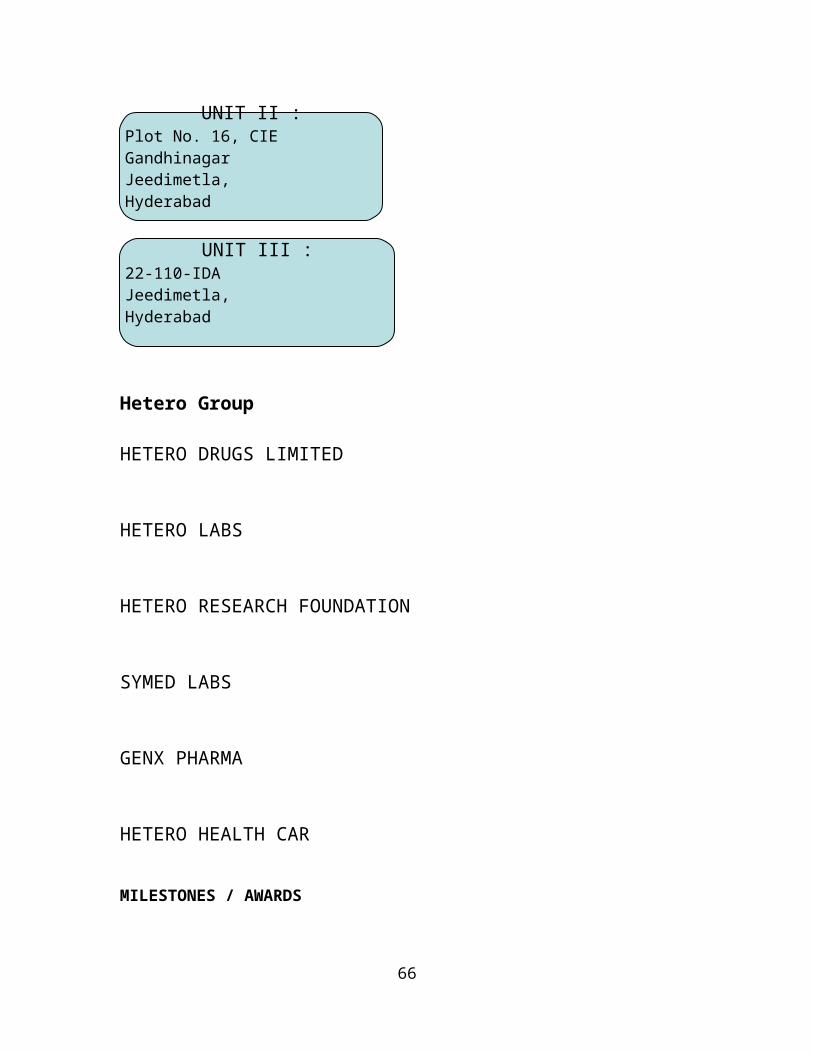
Hetero Group
HETERO DRUGS LIMITED
HETERO LABS
HETERO RESEARCH FOUNDATION
SYMED LABS
GENX PHARMA
HETERO HEALTH CAR
MILESTONES / AWARDS
47
RESEARCH & DEVELOPMENT
Plot No. B 80 & 81APIE, BalanagarHyderabad, Andhra Pradesh.
WORKS UNIT I :Bonthapally (village)Jinnaram (Mandal)Medak (Dist)Andhra Predessh.
UNIT II :Plot No. 16, CIE Gandhinagar Jeedimetla,Hyderabad
UNIT III :22-110-IDAJeedimetla,Hyderabad
The Company has been Scaling New Heights on a continual basis. These achievements
have been the result of concerted efforts on the part of different functions within the
organization to achieve the organizational goal of being a leader.
In its path to success, Hetero has seen many a milestone being crossed and achieved
many awards on various fronts. Awards for exemplary work in R&D and marketing are
just a few to name.
A track of few events that saw Hetero reaching its Zenith of glory is:
National Award for “Best Efforts in Research and Development” from the
Department of Scientific and Industrial Research, Ministry of Science and
Technology, Government of India, in the year 1996.
Highest Exporter award (for the year 1999) against stiff competition from
internationally recognized domestic competitors.
Approval of the API facilities by USFDA for compliance to CGMP norms
Approval of the finished dosage facilities by whom for the supply of anti-
retroviral drugs.
48
Vision & Values
Hetero visualizes itself as an aggressive player in the global pharmaceutical scenario,
supplying generics developed, combining intellectual property, research strengths and
strong human resource inputs.
The company values the concepts of having social responsibilities in the course of its
assent to greater heights. It strongly believes in focusing on customer requirements and
delivering the products at the right pace.
Hetero considers its human resources as the core of all its capabilities and believes in
tapping and honing the talents of its members to reach the zenith of success.
It believes in continuous evaluation and improvement in all the factors that contribute in
transforming the organization into a global force to reckon with.
Hetero takes due cognizance to the fact that the processes that it develops should be all
eco-friendly and should not result in any consequence that harms the ecological harmony.
MISSION
49
Hetero’s Mission is to be a globally acclaimed Pharmaceutical Company, Meeting the
requirements of Healthcare imbibing the philosophy of both commercial and social
concerns, driven by research and manufacturing capabilities.
APIs
Hetero API Facilities are designed to meet the best of global standards for an API
Facility.
This state- of- the- art facilities caters to the growing demand of manufacturing a large
spectrum of APIS.
Hetero's production muscle stems from its endeavors to install plant, equipment, systems
and personnel that portray the best in the Indian pharmaceutical industry. Professional
teams equipped with cutting-edge technology come together in developing,
commercializing and delivering latest Intermediate and Active Pharmaceutical
Ingredients across the globe.
50
Hetero's state-of-the-art plant, which conforms to stringent CGMP guidelines, facilitates
pilot and large scale production. This has enabled it to deliver a wide range of APIs of
international standard and intermediate chemicals for diverse healthcare applications.
RESEARCH AND DEVELOPMENT
Hetero’s emphasis has always been on Research and Development. The emphasis was to
ensure that the processes being adopted for the products are cost effective, safe to handle
and with optimum advantage in terms of yield and quality.
Having laid solid foundation towards the end Hetero’s R&D approach has also taken
cognizance of the present scenario where stringent patent regime is under
implementation. Hetero’s teams of scientists have been and are involved in developing
non-infringing processes for its products. With its ability to explore new heights and
achieve the best, Hetero has been able to file patents for several of its processes.
From an organization, which was concentrating on developing processes for API’s
Hetero, has now a full-fledged R&D Facility for formulation development.
51
STRENGHTS:
Strong emphasis on Research and Development.
Ability to develop processes for a large range of therapeutic Categories.
Ability to orient and adapt to the changing facets of Industry, particularly in terms
of Regulations, Intellectual property and Manufacturing Capabilities.
Cohesive team of Skilled Professionals in all Wings related to Research,
Manufacture and Marketing.
Strong Customer base and market Presence.
A Strong Commitment towards the society to provide timely support by providing
life Saving drugs at relatively low costs, Short Span of time.
52
CHAPTER – 4
DATA ANALYSIS
AND
INTERPRETATION
STATEMENT SHOWING INVENTORY TURNOVER RATIO
COST OF GOODS SOLD
53
INVENTORY TURNOVER RATIO = -------------------------------------------- AVERAGE INVENTORY
YEARCOST OF GOODS SOLD
AVERAGE INVENTORY
INVENTORY TURNOVER
RATIO
2009-10 4,30,31,502 2,25,29,582 1.91
2010-11 4,38,63,753 1,94,95,001 2.25
2011-12 6,72,32,180 2,25,61,134 2.98
2012-13 4,04,12,744 1,69,09,098 2.39
2013-14 6,01,39,019 2,16,32,740 2.78
54
INTERPRETATION:
In 2013-14 stock are converted into liquid more faster when compared to the
successive years 2010, 11, 12, 13. In this 2011-12 year Inventory Turnover ratio is very
high 2.98 lakhs and 2010-11 year Inventory Turnover Ratio is very low 1.91 lakhs. But
organization is satisfactory.
STATEMENT SHOWING INVENTORY HOLDING PERIOD
AVG. INVENTORY * NUMBER OF DAYS
INVENTORY HOLDING PERIOD = -------------------------------------------------------------
COST OF GOODS SOLD
YEARAVERAGE
INVENTORY
COST OF GOODS SOLD
INVENTORY HOLDING PERIOD
2009-10 2,25,29,582 4,30,31,502 191
2010-11 1,94,95,001 4,38,63,753 162
2011-12 2,25,61,134 6,72,32,180 122
2012-13 1,69,09,098 4,04,12,744 153
2013-14 2,16,32,740 6,01,39,019 131
55
0
1
2
3
200607
2007-08
2008-09
2009-10
2010-11
Years
INVENTORY TURNOVER RATIO
INTERPRETATION:
In 2012-13 the Inventory Conversion Period is less when compared to its
successive year 2011-12. In 2011-12 the inventory conversion period has tremendously
increased due to the problems in clearing stock. In 2006-07 holding period has decreased
to 162 days when compared to its 2009-10 holding period. Compared to 2010-11 holding
period 2010-11 holding period decreased to 122 days.
ECONOMIC ORDER QUANTITY
Suppose the ordering cost per order ‘O’ is fixed. Total order costs will be number of
orders during the year multiply by ordering cost per order. If ‘A’ represents the total
annual requirements and ‘Q’ represents the order size, the number of orders will the
‘A/Q’ and the total order costs will be
56
AO
Total Ordering Cost = --------- -------------- (1)
Q
Where,
A = Annual Requirements,
O = Ordering Costs,
Q = Order Size,
C = Carrying Costs per Unit.
Let us further assume that Carrying Costs per unit ‘C’ is constant. The total carrying costs
will be the product of the average material units and the carrying costs per unit. If ‘Q’ is
the order size and the usage is assumed to be steady, the average material will be
Q
Average Material = --------- -------------- (2)
2
QC
Average Material = --------- -------------- (3)
2
The total material costs, then, are the sum of total carrying and ordering costs;
QC AO
Average Material = --------- + -------- -------------- (4)
2 Q
57
Calculate (4) reveals that a large quantity. ‘Q’ the carrying costs will increase, but the
ordering costs will decrease. On the other hand the carrying cost will be lower and the
ordering cost for determining the Economic Order Quantity.
To obtain formula for Economic Order Quantity (EOQ), equation (4) is differentiated
with respect to ‘Q’ and setting the derivative equal to zero.
QC AO
Total Cost (TC) = --------- + -------- -------------- (a)
2 Q
Differentiating Equation (a) with respect to Q
D (TC) C AO
---------- + --------- - -------- -------------- (b)
DQ 2 Q
Setting Equation (b) to zero;
C AO
--------- - -------- = 0
2 Q
58
CQ = 2AO
EOQ = SQRT (2AO/C) -------------- (5)
Material turnover ratio can be calculated as follows;
VALUE OF MATERIALS CONSUMED
MATERIAL TURNOVER RATIO = ------------------------------------------------------
AVERAGE STOCK
Where,
Maximum Level + Minimum Level
Average Stock = ---------------------------------------------------
2
CALCULATION OF ECONOMIC ORDER QUANTITY
EOQ = SQRT (2AO/C)
Ordering Cost = 5.3 % on Price Value
Carrying Cost = 6.7 % on Price Value
1. AMONIUM SULPHATE
Annual Consumption = 93.800 Units
Price Value = 149.63
Ordering Cost (5.3 %) = 7.93
Carrying Cost (6.7 %) = 10.03
EOQ = SQRT (2*93.800*7.93/10.03)
= 12.18 = 12 Units
59
2. DIETHYL ETHER SQ
Annual Consumption = 32.000 Ltrs
Price Value = 424.22
Ordering Cost (5.3 %) = 22.48
Carrying Cost (6.7 %) = 28.42
EOQ = SQRT (2*32.000*22.48/28.42)
= 7.12 = 7 Ltrs
3. DEXTROSE
Annual Consumption = 246.980 Kgs
Price Value = 84.24
Ordering Cost (5.3 %) = 4.46
Carrying Cost (6.7 %) = 5.64
EOQ = SQRT (2*246.980*4.46/5.64)
= 19.77 = 20 Kgs
4. GLYCINE
Annual Consumption = 935.589 Kgs
Price Value = 767.17
Ordering Cost (5.3 %) = 40.66
Carrying Cost (6.7 %) = 51.40
EOQ = SQRT (2*935.589*40.66/51.40)
= 38.47 = 38 Kgs
5. HYDRO CHLORIC ACID
Annual Consumption = 645.600 Ltrs
Price Value = 110.32
Ordering Cost (5.3 %) = 5.85
Carrying Cost (6.7 %) = 7.39
EOQ = SQRT (2*645.600*5.85/7.39)
60
= 31.96 = 32 Ltrs
6. PEPSIN 1:10000
Annual Consumption = 63.294 Units
Price Value = 1250.00
Ordering Cost (5.3 %) = 66.25
Carrying Cost (6.7 %) = 83.75
EOQ = SQRT (2*63.294*66.25/83.75)
= 10.01 = 10 Ltrs
7. SODIUM CHLORIDE
Annual Consumption = 558.181 Kgs
Price Value = 45.80
Ordering Cost (5.3 %) = 2.43
Carrying Cost (6.7 %) = 3.07
EOQ = SQRT (2*558.181*2.43/3.07)
= 29.72 = 30 Kgs
8. SODIUM HYDROXIDE PELLETS
Annual Consumption = 560.667 Kgs
Price Value = 163.16
Ordering Cost (5.3 %) = 8.65
Carrying Cost (6.7 %) = 10.93
EOQ = SQRT (2*560.667*8.65/10.93)
= 29.78 = 30 Kgs
9. TRISODIUM CITRATE SQ
Annual Consumption = 183.507 Kgs
Price Value = 522.12
Ordering Cost (5.3 %) = 27.67
Carrying Cost (6.7 %) = 34.98
61
EOQ = SQRT (2*183.507*27.67/34.98)
= 17.04 = 17 Kgs
10. PLASMA ASVS
Annual Consumption = 35177.950 Units
Price Value = 1250.00
Ordering Cost (5.3 %) = 66.25
Carrying Cost (6.7 %) = 83.75
EOQ = SQRT (2*35177.950*66.25/83.75)
= 235.91 = 236 Units
11. PLASMA (DITHERIA)
Annual Consumption = 1654.050 Units
Price Value = 1250.00
Ordering Cost (5.3 %) = 66.25
Carrying Cost (6.7 %) = 83.75
EOQ = SQRT (2*1654.050*66.25/83.75)
= 51.16 = 51 Units
12. CITRIC ACID
Annual Consumption = 858.202 Kgs
Price Value = 99.84
Ordering Cost (5.3 %) = 5.29
Carrying Cost (6.7 %) = 6.69
EOQ = SQRT (2*858.202*5.29/6.69)
= 36.85 = 37 Kgs
13. CAPRYLIC ACID
Annual Consumption = 3036.870 Kgs
Price Value = 225.01
Ordering Cost (5.3 %) = 11.93
Carrying Cost (6.7 %) = 15.08
62
EOQ = SQRT (2*3036.870*11.93/15.08)
= 69.32 = 69 Kgs
14. ORTHO CRESOL
Annual Consumption = 63.500 Ltrs
Price Value = 657.23
Ordering Cost (5.3 %) = 34.83
Carrying Cost (6.7 %) = 44.03
EOQ = SQRT (2*63.500*34.83/44.03)
= 10.02 = 10 Ltrs
15. PLASMA ATS
Annual Consumption = 1832.800 Units
Price Value = 1250.00
Ordering Cost (5.3 %) = 66.25
Carrying Cost (6.7 %) = 83.75
EOQ = SQRT (2*1832.800*66.25/83.75)
= 53.85 = 54 Units
16. PLASMA ASVS AFRICAN-QUADRI/04
Annual Consumption = 482.000 Units
Price Value = 1250.00
Ordering Cost (5.3 %) = 66.25
Carrying Cost (6.7 %) = 83.75
EOQ = SQRT (2*482.000*66.25/83.75)
= 27.61 = 28 Units
17. PLASMA ASVS AFRICAN-POLY/10
Annual Consumption = 3375.230 Units
Price Value = 1250.00
Ordering Cost (5.3 %) = 66.25
Carrying Cost (6.7 %) = 83.75
63
EOQ = SQRT (2*3375.230*66.25/83.75)
= 73.07 = 73 Units
STATEMENT SHOWING ECONOMIC ORDER QUANTITY
EOQ SQRT (2AO/C)
A = Annual Consumption;
O = Ordering Cost;
C = Carrying Cost.
Here I am Considering;
Average means 5 years averages as like (2009-13),
Avg. Annual Consumption = 5 years total consumption / 5 years,
Avg. Ordering Cost = 5 years total ordering cost / 5 years,
Avg. Carrying Cost = 5 years total carrying cost / 5 years.
Example: EOQ = SQRT (2*93.800*7.93/10.03) = 12.18 = 12 Units (Item 1)
64
S.No ITEMSAVG. ANNUAL
CONSUMPTION
AVG. ORDERING
COST
AVG. CARRYING
COST
EOQ UNITS
1 AMONIUM SULPHATE 93.800 7.93 10.03 12
2 DIETHYL ETHER SQ 32.000 22.48 28.42 7
3 DEXTROSE 246.980 4.46 5.64 20
4 GLYCINE 935.589 40.66 51.40 38
5 HYDRO CHLORIC ACID 645.600 5.85 7.39 32
6 PEPSIN 1:10000 63.294 66.25 83.75 10
7 SODIUM CHLORIDE 558.181 2.43 3.07 30
8SODIUM HYDROXIDE PELLETS
560.667 8.65 10.93 30
9TRISODIUM CITRATE SQ
183.507 27.67 34.98 17
10 PLASMA ASVS 35177.950 66.25 83.75 236
11 PLASMA (DITHERIA) 1654.050 66.25 83.75 51
12 CITRIC ACID 858.202 5.29 6.69 37
13 CAPRYLIC ACID 3036.870 11.93 15.08 69
14 ORTHO CRESOL 63.500 34.83 44.03 10
15 PLASMA ATS 1832.800 66.25 83.75 54
16PLASMA ASVS AFRICAN-QUADRI/04
482.000 66.25 83.75 28
17PLASMA ASVS AFRICAN-POLY/10
3375.230 66.25 83.75 73
65
050
100150200250
EOQ
(IN
UNIT
S)
1 2 3 4 5 6 7 8 9 10 11 12 13 14 15 16 17
ITEM NUMBERS
ECONOMIC ORDER QUANTITY
Here I am Considering;
INTERPRETATION:
66
1 = AMONIUM SULPHATE
2 = DIETHYL ETHER SQ
3 = DEXTROSE
4 = GLYCINE
5 = HYDRO CHLORIC ACID
6 = PEPSIN 1:10000
7 = SODIUM CHLORIDE
8 = SODIUM HYDROXIDE PELLETS
9 = TRISODIUM CITRATE SQ
10 = PLASMA ASVS
11 = PLASMA (DITHERIA)
12 = CITRIC ACID
13 = CAPRYLIC ACID
14 = ORTHO CRESOL
15 = PLASMA ATS
16 = PLASMA ASVS AFRICAN-
QUADRI/04
17 = PLASMA ASVS AFRICAN-
POLY/10
Economic Order Quantity refers to the size of order that gives maximum economy is any
materials. It also referred as optimum or standard ordering quantity. In this EOQ analysis
“Plasma Asvs” EOQ values is very high when compared to other items. So this item
gives maximum economy
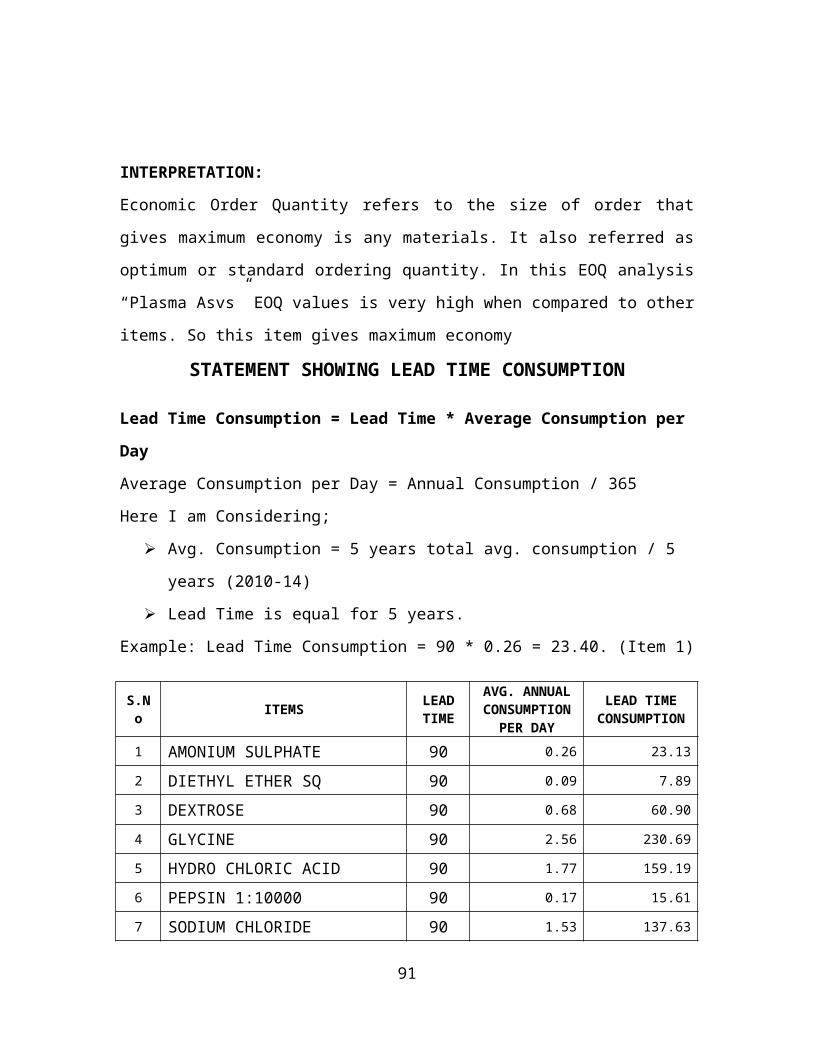
STATEMENT SHOWING LEAD TIME CONSUMPTION
Lead Time Consumption = Lead Time * Average Consumption per Day
Average Consumption per Day = Annual Consumption / 365
Here I am Considering;
Avg. Consumption = 5 years total avg. consumption / 5 years (2010-14)
Lead Time is equal for 5 years.
Example: Lead Time Consumption = 90 * 0.26 = 23.40. (Item 1)
S.No
ITEMSLEAD TIME
AVG. ANNUAL CONSUMPTION
PER DAY
LEAD TIME CONSUMPTION
1 AMONIUM SULPHATE 90 0.26 23.13
2 DIETHYL ETHER SQ 90 0.09 7.89
3 DEXTROSE 90 0.68 60.90
4 GLYCINE 90 2.56 230.69
5 HYDRO CHLORIC ACID 90 1.77 159.19
6 PEPSIN 1:10000 90 0.17 15.61
7 SODIUM CHLORIDE 90 1.53 137.63
8SODIUM HYDROXIDE PELLETS
90 1.54 138.25
9 TRISODIUM CITRATE SQ 90 0.50 45.25
10 PLASMA ASVS 90 96.38 8674.02
11 PLASMA (DITHERIA) 90 4.53 407.85
12 CITRIC ACID 90 2.35 211.61
13 CAPRYLIC ACID 90 8.32 748.82
14 ORTHO CRESOL 90 0.17 15.66
15 PLASMA ATS 90 5.02 451.92
16 PLASMA ASVS AFRICAN- 90 1.32 118.85
67
QUADRI/04
17PLASMA ASVS AFRICAN-POLY/10
90 9.25 832.25
0.002000.004000.006000.008000.00
10000.00
Quan
tity
of
units
1 2 3 4 5 6 7 8 9 10 11 12 13 14 15 16 17
Item Numbers
LEAD TIME CONSUMPTION
Here I am Considering;
INTERPRETATION:
Lead time is the period between placing an order for materials and actually receiving
delivery of these goods in case of raw materials. In this analysis lead time is 90 days. And
68
1 = AMONIUM SULPHATE
2 = DIETHYL ETHER SQ
3 = DEXTROSE
4 = GLYCINE
5 = HYDRO CHLORIC ACID
6 = PEPSIN 1:10000
7 = SODIUM CHLORIDE
8 = SODIUM HYDROXIDE PELLETS
9 = TRISODIUM CITRATE SQ
10 = PLASMA ASVS
11 = PLASMA (DITHERIA)
12 = CITRIC ACID
13 = CAPRYLIC ACID
14 = ORTHO CRESOL
15 = PLASMA ATS
16 = PLASMA ASVS AFRICAN-
QUADRI/04
17 = PLASMA ASVS AFRICAN-
POLY/10
“DIETHYL ETHER SQ” Items average annual consumption per day in 0.09, lead time
consumption is 7.89. It’s very low when compared to other items so tits better to produce
mote items.
STOCKABLE ITEMS PLANING SHEET OF THE COMPANY
Here I am Considering to 17 Particular Items;
Annual Avg. 5 years Consumption (2009-10 to 2013-14)
Avg. 5 years Unit Price as like (2009-10 to 2013-14)
Avg. 5 years Safety Stock.
S.NoMATERIAL
CODEITEMS
AVG. ANNUAL CONSUMPTION
UNIT PRICE
SAFETY STOCK
1 110001 AMONIUM SULPHATE 93.800 149.63 23.45
2 110002 DIETHYL ETHER SQ 32.000 424.22 8.00
3 110003 DEXTROSE 246.980 84.24 61.75
4 110006 GLYCINE 935.589 767.17 233.90
5 110007HYDRO CHLORIC ACID
645.600 110.32 161.40
6 110009 PEPSIN 1:10000 63.294 1250.00 15.82
7 110011 SODIUM CHLORIDE 558.181 45.80 139.55
8 110012SODIUM HYDROXIDE PELLETS
560.667 163.16 140.17
9 110014TRISODIUM CITRATE SQ
183.507 522.12 45.88
10 110016 PLASMA ASVS 35177.950 1250.00 8794.49
11 110017 PLASMA (DITHERIA) 1654.050 1250.00 413.51
12 110025 CITRIC ACID 858.202 99.84 214.55
13 110026 CAPRYLIC ACID 3036.870 225.01 759.22
14 110037 ORTHO CRESOL 63.500 657.23 15.88
15 110073 PLASMA ATS 1832.800 1250.00 458.20
16 110075PLASMA ASVS AFRICAN-QUADRI/04
482.000 1250.00 120.50
17 110076PLASMA ASVS AFRICAN-POLY/10
3375.230 1250.00 843.81
69
STATEMENT SHOWING RE-ORDER LEVEL
RE-ORDER LEVEL = SAFETY STOCK + LEAD TIME CONSUMPTION
Avg. Annual Safety Stock for 5 years (2010-14)
Avg. Lead Time Consumption for 5 years.
Example: 23.45 + 23.13 = 46.58. (Item 1)
S.No
ITEMS SAFETY STOCK
LEAD TIME CONSUMPTION
RE-ORDER LEVEL
1 AMONIUM SULPHATE 23.45 23.13 46.58
2 DIETHYL ETHER SQ 8.00 7.89 15.89
3 DEXTROSE 61.75 60.90 122.65
4 GLYCINE 233.90 230.69 464.59
5 HYDRO CHLORIC ACID 161.40 159.19 320.59
6 PEPSIN 1:10000 15.82 15.61 31.43
7 SODIUM CHLORIDE 139.55 137.63 277.18
8 SODIUM HYDROXIDE PELLETS 140.17 138.25 278.42
9 TRISODIUM CITRATE SQ 45.88 45.25 91.13
10 PLASMA ASVS 8794.49 8674.02 17468.51
11 PLASMA (DITHERIA) 413.51 407.85 821.36
12 CITRIC ACID 214.55 211.61 426.16
13 CAPRYLIC ACID 759.22 748.82 1508.04
14 ORTHO CRESOL 15.88 15.66 31.54
15 PLASMA ATS 458.20 451.92 910.12
16PLASMA ASVS AFRICAN-QUADRI/04 120.50 118.85 239.35
17PLASMA ASVS AFRICAN-POLY/10 843.81 832.25 1676.06
70
0.00
5000.00
10000.00
15000.00
20000.00
Quan
tity
in
units
1 2 3 4 5 6 7 8 9 10 11 12 13 14 15 16 17
Item Numbers
RE-ORDER LEVEL
Here I am Considering;
INTERPRETATION:
Re-order point includes lead time and average usage. Re-order level means combing of
safety stock and lead time consumption should be average. Combining of this high safety
71
1 = AMONIUM SULPHATE
2 = DIETHYL ETHER SQ
3 = DEXTROSE
4 = GLYCINE
5 = HYDRO CHLORIC ACID
6 = PEPSIN 1:10000
7 = SODIUM CHLORIDE
8 = SODIUM HYDROXIDE PELLETS
9 = TRISODIUM CITRATE SQ
10 = PLASMA ASVS
11 = PLASMA (DITHERIA)
12 = CITRIC ACID
13 = CAPRYLIC ACID
14 = ORTHO CRESOL
15 = PLASMA ATS
16 = PLASMA ASVS AFRICAN-
QUADRI/04
17 = PLASMA ASVS AFRICAN-
POLY/10
stock and average lead time consumption is the best re-order level. In this analysis
“Plasma Asvs” re-order level is better when compared to other items.
STATEMENT SHOWING MAXIMUM STOCK LEVEL
MAXIMUM STOCK LEVEL = RE-ORDER LEVEL + EOQ
Example: Maximum Stock Level = 46.58 + 12 = 58.58 (Item 1)
S.No ITEMSRE-ORDER
LEVELEOQ
UNITS
MAXIMUM STOCK LEVEL
1 AMONIUM SULPHATE 46.58 12 58.58
2 DIETHYL ETHER SQ 15.89 7 22.89
3 DEXTROSE 122.65 20 142.65
4 GLYCINE 464.59 38 502.59
5 HYDRO CHLORIC ACID 320.59 32 352.59
6 PEPSIN 1:10000 31.43 10 41.43
7 SODIUM CHLORIDE 277.18 30 307.18
8 SODIUM HYDROXIDE PELLETS 278.42 30 308.42
9 TRISODIUM CITRATE SQ 91.13 17 108.13
10 PLASMA ASVS 17468.51 236 17704.51
11 PLASMA (DITHERIA) 821.36 51 872.36
12 CITRIC ACID 426.16 37 463.16
13 CAPRYLIC ACID 1508.04 69 1577.04
14 ORTHO CRESOL 31.54 10 41.54
15 PLASMA ATS 910.12 54 964.12
16PLASMA ASVS AFRICAN-QUADRI/04 239.35 28 267.35
17 PLASMA ASVS AFRICAN-POLY/101676.06 73 1749.06
72
0
5000
10000
15000
20000
Qua
ntity
in
units
1 2 3 4 5 6 7 8 9 10 11 12 13 14 15 16 17
Item Numbers
MAXIMUM STOCK LEVEL
Here I am Considering;
INTERPRETATION:
The maximum stock level is the largest quantities of a particular material, which should
be kept in the store at any one time. And this maximum stock level is the combining of
re-order level and EOQ Units. In this analysis also “ Asvs” items maximum stock level is
73
1 = AMONIUM SULPHATE
2 = DIETHYL ETHER SQ
3 = DEXTROSE
4 = GLYCINE
5 = HYDRO CHLORIC ACID
6 = PEPSIN 1:10000
7 = SODIUM CHLORIDE
8 = SODIUM HYDROXIDE PELLETS
9 = TRISODIUM CITRATE SQ
10 = PLASMA ASVS
11 = PLASMA (DITHERIA)
12 = CITRIC ACID
13 = CAPRYLIC ACID
14 = ORTHO CRESOL
15 = PLASMA ATS
16 = PLASMA ASVS AFRICAN-
QUADRI/04
17 = PLASMA ASVS AFRICAN-
POLY/10
very high when compared to other items. This is the best level to kept in the store at any
one time.
DIFFERENT STAGE OF INVENTORY ANNUAL CONSUMPTION (in Rs / Thousands)
S.NO ITEMS 2008-09 2009-10 2010-11 2011-12 2012-13
1 RAW MATERIALS 2857.59 2476.92 1793.39 2493.33 2797.04
2 PACKING MATERIALS 476.18 606.93 596.13 609.88 716.67
3 LAB ITEMS 4.10 8.81 8.95 61.40 74.84
4 PRINTING & STATIONARY 27.62 60.71 48.98 27.92 29.81
5PRODUCTION CONSUMABLES 21.07 23.61 22.57 35.43 57.74
6 ELECTRICAL ITEMS 132.18 118.42 140.90 162.39 189.46
7 PIPES & FITTINGS 135.48 128.17 120.96 117.30 127.08
8 FEED MATERIAL 130.38 263.14 208.61 256.03 659.03
9 VETERNARY MEDICINES 78.17 106.90 127.93 161.27 312.76
10 FARM CONSUMABLES 36.69 41.06 43.88 50.87 109.49
74
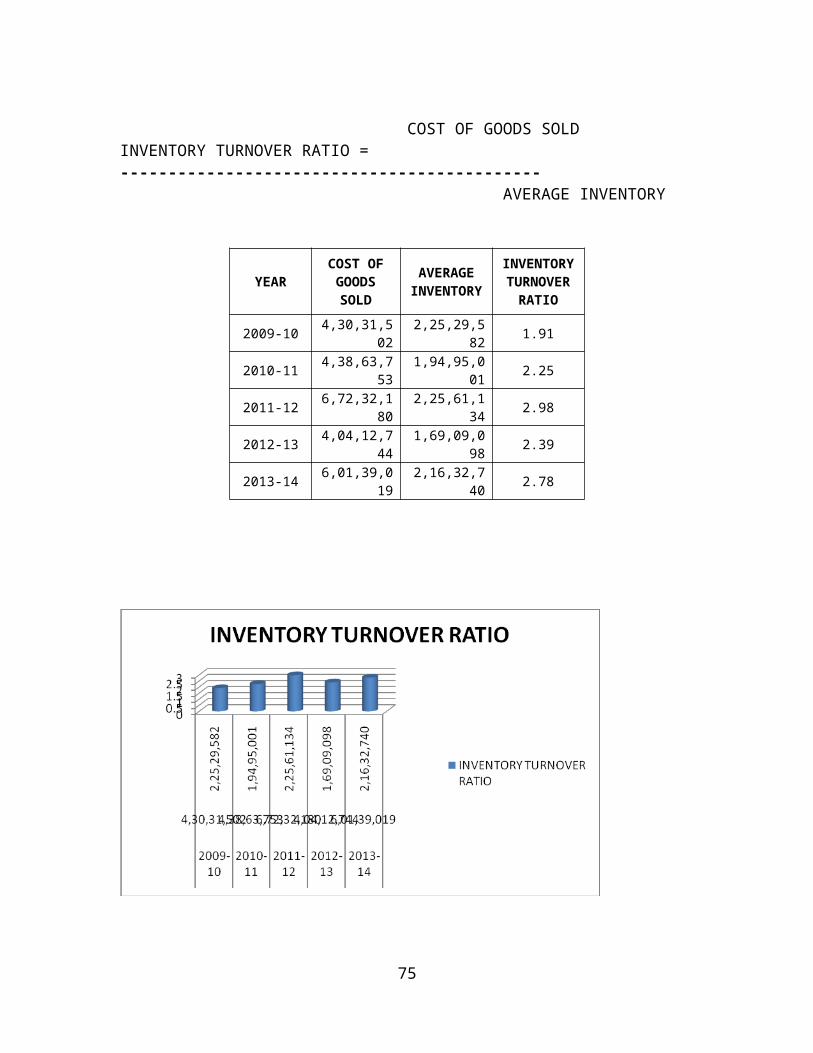
ABC ANALYSIS FOR THE YEAR 2009-10
S.NO ITEMSANNUAL
CONSUMPTIONCUMULATIVE
USAGECUMULATIVE % OF USAGE
INDIVIDUAL USAGE %
1 RAW MATERIALS 2857.59 2857.59 73.28 73.28
2 PACKING MATERIALS 476.18 3333.77 85.49 12.21
3 LAB ITEMS 4.10 3337.87 85.60 0.11
4 PRINTING & STATIONARY 27.62 3365.49 86.31 0.71
5PRODUCTION CONSUMABLES 21.07 3386.56 86.85 0.54
6 ELECTRICAL ITEMS 132.18 3518.74 90.24 3.39
7 PIPES & FITTINGS 135.48 3654.22 93.71 3.47
8 FEED MATERIAL 130.38 3784.61 97.05 3.34
9 VETERNARY MEDICINES 78.17 3862.78 99.06 2.00
10 FARM CONSUMABLES 36.69 3899.47 100.00 0.94
A – Occupies 80% Annual Consumption Value i.e., 80% of 3899.47 = 3119.58
B – Occupies 90% Annual Consumption Value i.e., 90% of 3899.47 = 3509.52
3333.77Actual Value of A = ----------------- * 100 = 85.49%
3899.47
320.46Actual Value of B = ----------------- * 100 = 8.22%
3899.47
245.25Actual Value of C = ----------------- * 100 = 6.29%
3899.47
Here I am Considering;
A = Items 1+2,
75
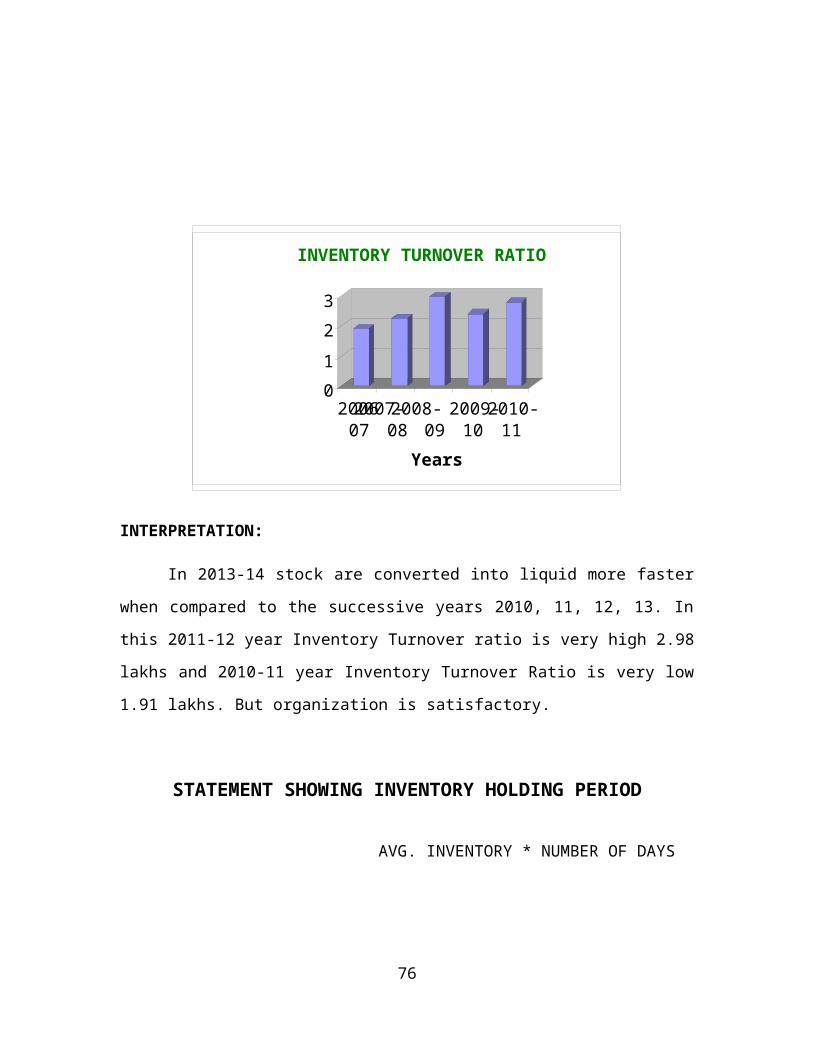
B = Items 3+4+5+6+7,
C = Items 8+9+10.
A = 85.49%
B = 8.22%
C = 6.29%
Here I am Considering;
A = R.M + P.M
B = L.I + P&S + P.C + E.I + P&F and
C = F.M + V.M + F.C.
INTERPRETATION:
ABC Analysis means the firm should be selective in its approach to control investment
various types of materials. Selective should be category wise i.e., high values materials
are “A” items , “C” items represent relatively least value and “B” item fall in between
these 2 categories.
In this analysis I representing raw materials and packing materials are “A” category, lab
items, printing & stationary, production consumables, electrical items, Pipes & fitting are
“B” category and In ”C” category I have taken feed materials, veterinary medicines and
farm consumables.
76
0
20
40
60
80
IND
IVID
UA
L
US
AG
E %
1 2 3 4 5 6 7 8 9 10
ITEM NUMBERS
ABC ANALYSIS (2008-09)
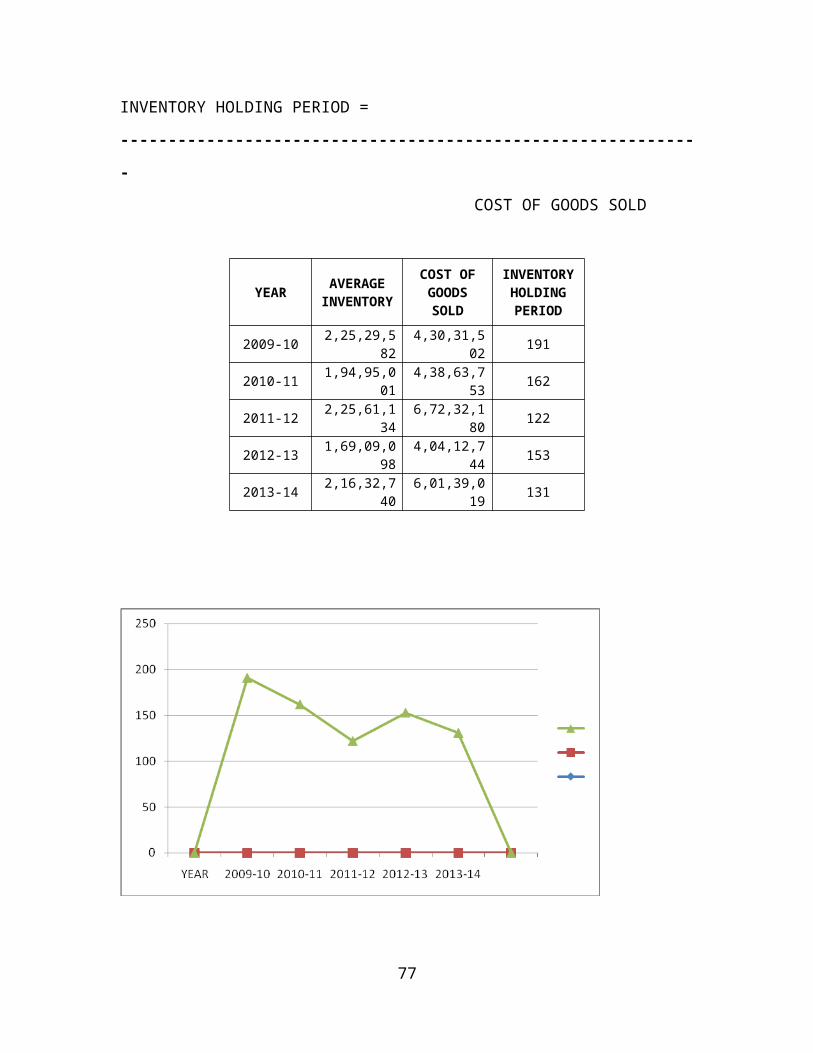
Coming to category wise analysis actual value of “A” items percentage very high. “B”
items usage percentage in 2nd place and “C” items usage percentage in 3rd place.
ABC ANALYSIS FOR THE YEAR 2010-11
S.NO ITEMSANNUAL
CONSUMPTIONCUMULATIVE
USAGE CUMULATIVE % OF USAGE
INDIVIDUAL USAGE %
1 RAW MATERIALS 2476.92 2476.92 64.59 64.59
2 PACKING MATERIALS 606.93 3083.84 80.42 15.83
3 LAB ITEMS 8.81 3092.65 80.65 0.23
4 PRINTING & STATIONARY 60.71 3153.36 82.23 1.58
5PRODUCTION CONSUMABLES 23.61 3176.97 82.85 0.62
6 ELECTRICAL ITEMS 118.42 3295.39 85.94 3.09
7 PIPES & FITTINGS 128.17 3423.56 89.28 3.34
8 FEED MATERIAL 263.14 3686.70 96.14 6.86
9 VETERNARY MEDICINES 106.90 3793.60 98.93 2.79
10 FARM CONSUMABLES 41.06 3834.66 100.00 1.07
A – Occupies 80% Annual Consumption Value i.e., 80% of 3834.66 = 3067.73
B – Occupies 90% Annual Consumption Value i.e., 90% of 3834.66 = 3451.19
3083.84Actual Value of A = ----------------- * 100 = 80.42%
3834.66
339.72Actual Value of B = ----------------- * 100 = 8.85%
3834.66
411.09Actual Value of C = ----------------- * 100 = 10.72%
3834.66
Here I am Considering;
A = Items 1+2,
77
B = Items 3+4+5+6+7,
C = Items 8+9+10.
A = 80.42%
B = 8.85%
C = 10.72%
Here I am Considering;
A = R.M + P.M
B = L.I + P&S + P.C + E.I + P&F and
C = F.M + V.M + F.C.
INTERPRETATION:
In this analysis I representing raw materials and packing materials are “A” category, lab
items, printing & stationary, production consumables, electrical items, Pipes & fitting are
“B” category and In ”C” category I have taken feed materials, veterinary medicines and
farm consumables.
Coming to category wise analysis actual value of “A” items percentage very high. “C”
items usage percentage in 2nd place and “B” items usage percentage in 3rd place.
78
0
20
40
60
80
IND
IVID
UA
L
US
AG
E %
1 2 3 4 5 6 7 8 9 10
ITEM NUMBERS
ABC ANALYSIS (2009-10
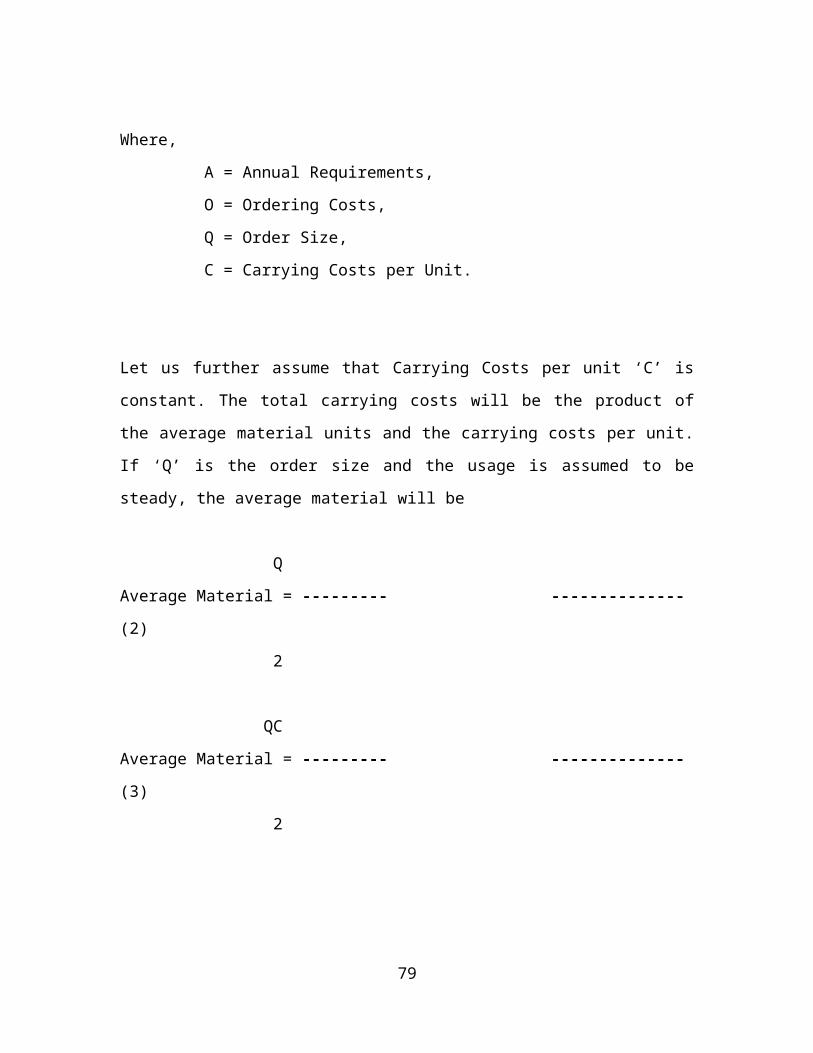
ABC ANALYSIS FOR THE YEAR 2011-12
S.NO ITEMSANNUAL
CONSUMPTIONCUMULATIVE
USAGE CUMULATIVE % OF USAGE
INDIVIDUAL USAGE %
1 RAW MATERIALS 1793.39 1793.39 57.62 57.62
2 PACKING MATERIALS 596.13 2389.53 76.78 19.15
3 LAB ITEMS 8.95 2398.48 77.06 0.29
4 PRINTING & STATIONARY 48.98 2447.46 78.64 1.57
5PRODUCTION CONSUMABLES 22.57 2470.03 79.36 0.73
6 ELECTRICAL ITEMS 140.90 2610.93 83.89 4.53
7 PIPES & FITTINGS 120.96 2731.89 87.78 3.89
8 FEED MATERIAL 208.61 2940.50 94.48 6.70
9 VETERNARY MEDICINES 127.93 3068.43 98.59 4.11
10 FARM CONSUMABLES 43.88 3112.31 100.00 1.41
A – Occupies 80% Annual Consumption Value i.e., 80% of 3112.31 = 2489.85
B – Occupies 90% Annual Consumption Value i.e., 90% of 3112.31 = 2801.08
2389.53Actual Value of A = ----------------- * 100 = 76.78%
3112.31
342.36Actual Value of B = ----------------- * 100 = 11.01%
3112.31
380.42Actual Value of C = ----------------- * 100 = 12.22%
3112.31
Here I am Considering;
A = Items 1+2,
79
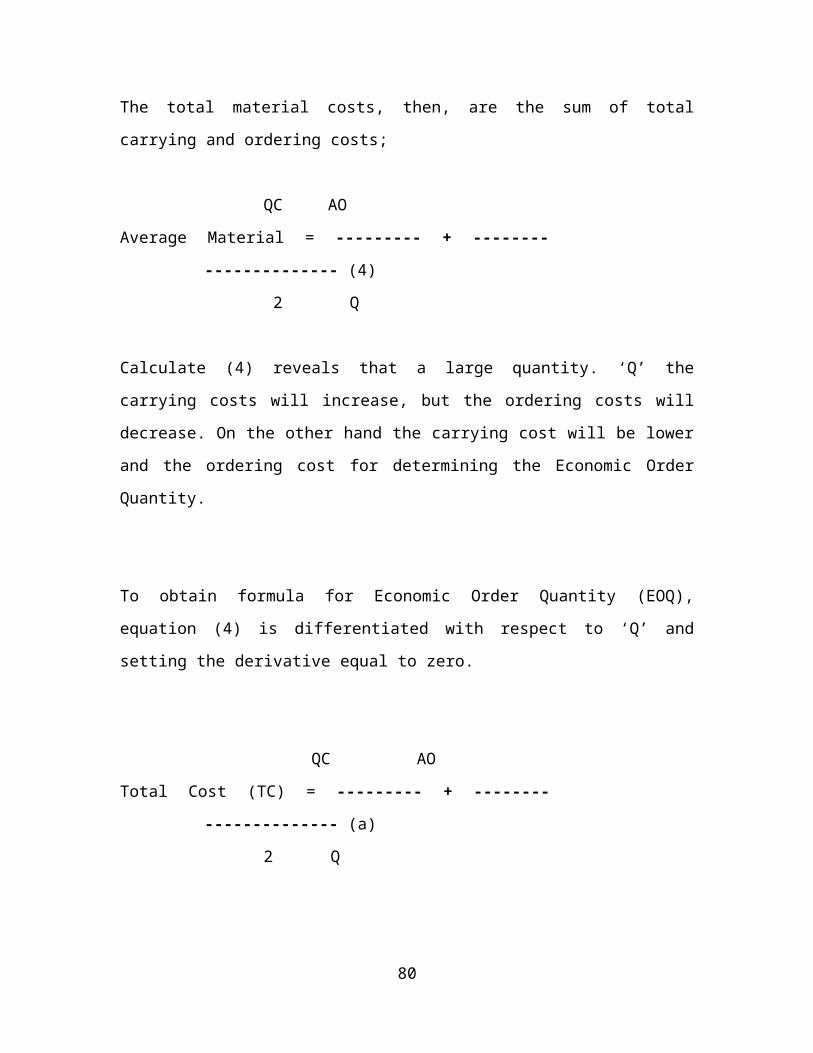
B = Items 3+4+5+6+7,
C = Items 8+9+10.
A = 76.78%
B = 11.01%
C = 12.22%
Here I am Considering;
A = R.M + P.M
B = L.I + P&S + P.C + E.I + P&F and
C = F.M + V.M + F.C.
INTERPRETATION:
In this analysis I representing raw materials and packing materials are “A” category, lab
items, printing & stationary, production consumables, electrical items, Pipes & fitting are
“B” category and In ”C” category I have taken feed materials, veterinary medicines and
farm consumables.
80
0102030405060
IND
IVID
UA
L
US
AG
E %
1 2 3 4 5 6 7 8 9 10
ITEM NUMBERS
ABC ANALYSIS (2010-11)
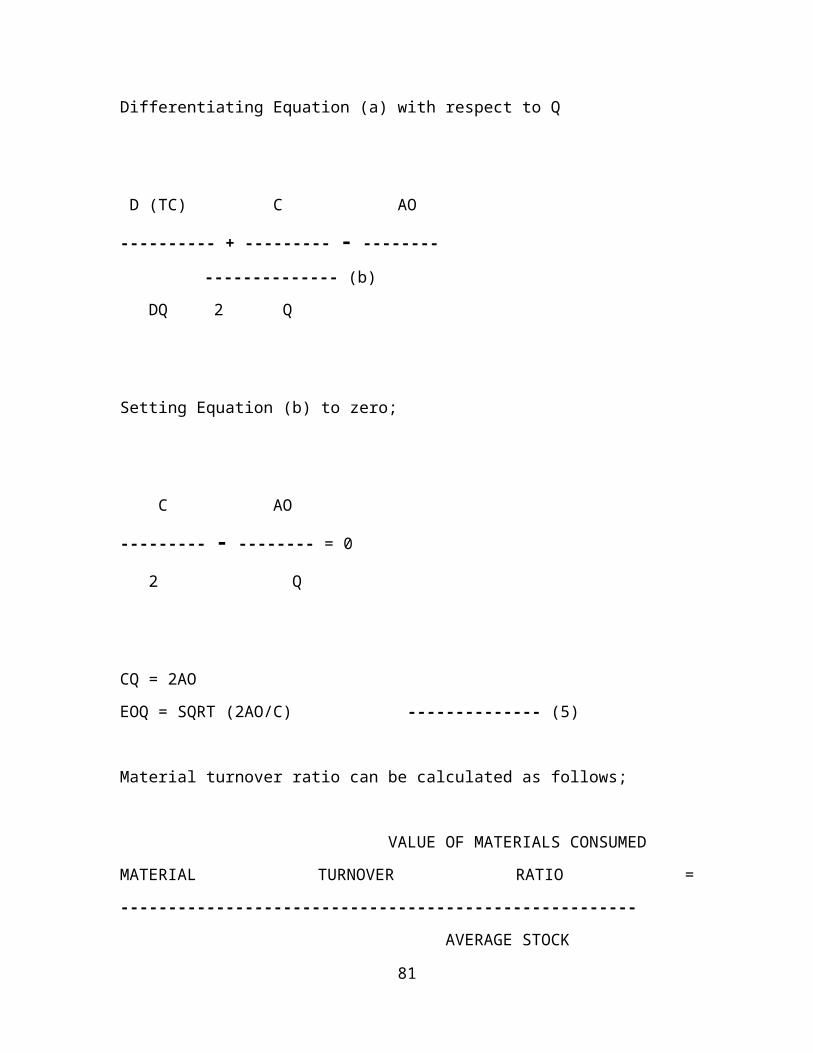
Coming to category wise analysis actual value of “A” items percentage very high. “C”
items usage percentage in 2nd place and “B” items usage percentage in 3rd place.
ABC ANALYSIS FOR THE YEAR 2012-13
S.NO ITEMSANNUAL
CONSUMPTIONCUMULATIVE
USAGE CUMULATIVE % OF USAGE
INDIVIDUAL USAGE %
1 RAW MATERIALS 2493.33 2493.33 62.71 62.71
2 PACKING MATERIALS 609.88 3103.21 78.05 15.34
3 LAB ITEMS 61.40 3164.61 79.60 1.54
4 PRINTING & STATIONARY 27.92 3192.53 80.30 0.70
5PRODUCTION CONSUMABLES 35.43 3227.95 81.19 0.89
6 ELECTRICAL ITEMS 162.39 3390.34 85.27 4.08
7 PIPES & FITTINGS 117.30 3507.65 88.22 2.95
8 FEED MATERIAL 256.03 3763.67 94.66 6.44
9 VETERNARY MEDICINES 161.27 3924.94 98.72 4.06
10 FARM CONSUMABLES 50.87 3975.81 100.00 1.28
A – Occupies 80% Annual Consumption Value i.e., 80% of 3975.81 = 3810.65
B – Occupies 90% Annual Consumption Value i.e., 90% of 3975.81 = 3578.23
3103.21Actual Value of A = ----------------- * 100 = 78.05%
3975.81
404.44Actual Value of B = ----------------- * 100 = 10.17%
3975.81
468.16Actual Value of C = ----------------- * 100 = 11.76%
3975.81
Here I am Considering;
81
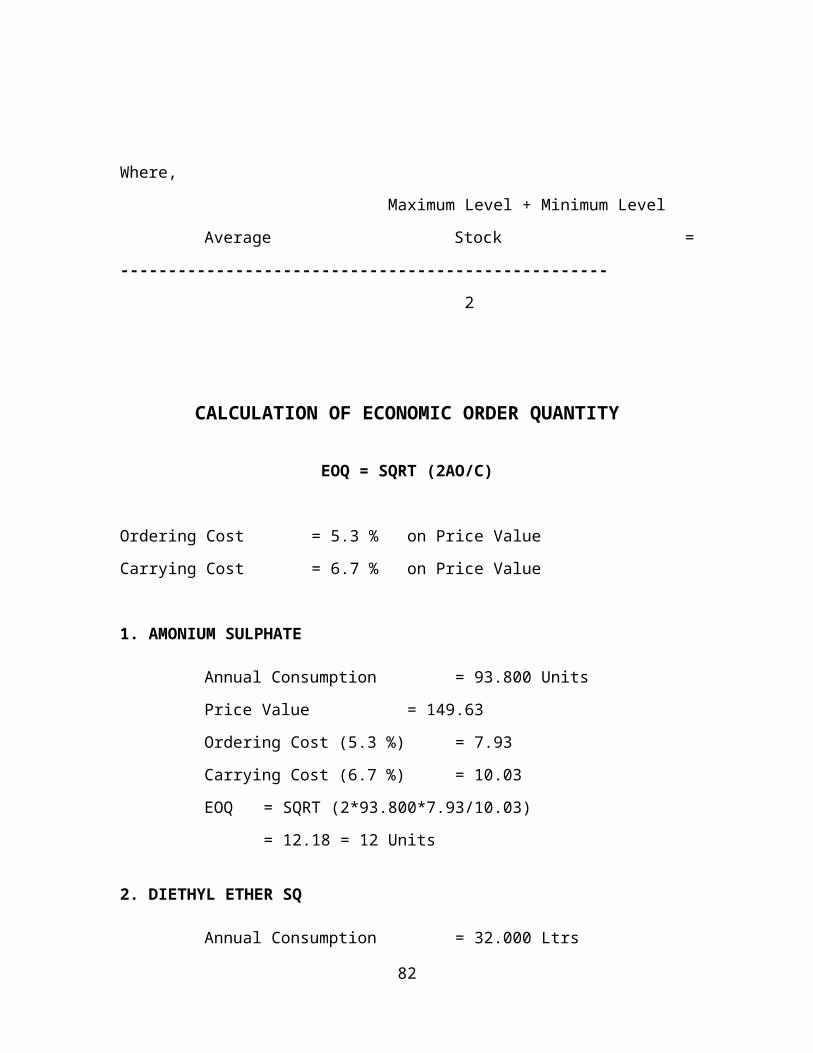
A = Items 1+2,
B = Items 3+4+5+6+7,
C = Items 8+9+10
A = 78.05%
B = 10.17%
C = 11.76%
Here I am Considering;
A = R.M + P.M
B = L.I + P&S + P.C + E.I + P&F and
C = F.M + V.M + F.C.
INTERPRETATION:
In this analysis I representing raw materials and packing materials are “A” category, lab
items, printing & stationary, production consumables, electrical items, Pipes & fitting are
“B” category and In ”C” category I have taken feed materials, veterinary medicines and
farm consumables.
82
0
20
40
60
80
IND
IVID
UA
L
US
AG
E %
1 2 3 4 5 6 7 8 9 10
ITEM NUMBERS
ABC ANALYSIS (2011-12)
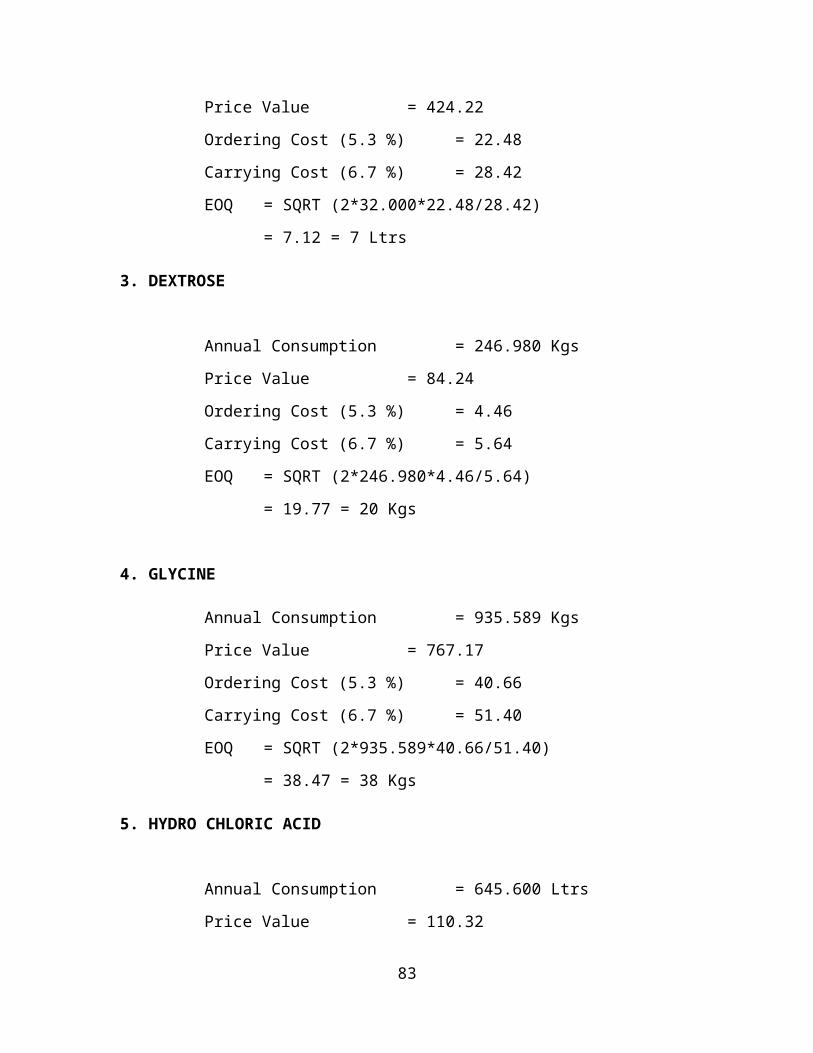
Coming to category wise analysis actual value of “A” items percentage very high. “C”
items usage percentage in 2nd place and “B” items usage percentage in 3rd place.
ABC ANALYSIS FOR THE YEAR 2013-14
S.NO ITEMSANNUAL
CONSUMPTIONCUMULATIVE
USAGE CUMULATIVE % OF USAGE
INDIVIDUAL USAGE %
1 RAW MATERIALS 2797.04 2797.04 55.13 55.13
2 PACKING MATERIALS 716.67 3513.71 69.25 14.12
3 LAB ITEMS 74.84 3588.56 70.73 1.48
4 PRINTING & STATIONARY 29.81 3618.36 71.31 0.59
5PRODUCTION CONSUMABLES 57.74 3676.11 72.45 1.14
6 ELECTRICAL ITEMS 189.46 3865.56 76.18 3.73
7 PIPES & FITTINGS 127.08 3992.65 78.69 2.50
8 FEED MATERIAL 659.03 4651.68 91.68 12.99
9 VETERNARY MEDICINES 312.76 4964.43 97.84 6.16
10 FARM CONSUMABLES 109.49 5073.92 100.00 2.16
A – Occupies 80% Annual Consumption Value i.e., 80% of 5073.92 = 4059.14
B – Occupies 90% Annual Consumption Value i.e., 90% of 5073.92 = 4566.53
351371Actual Value of A = ----------------- * 100 = 69.25%
5073.92
478.93Actual Value of B = ----------------- * 100 = 9.44%
5073.92
1081.28Actual Value of C = ----------------- * 100 = 21.31%
5073.92
Here I am Considering;
83
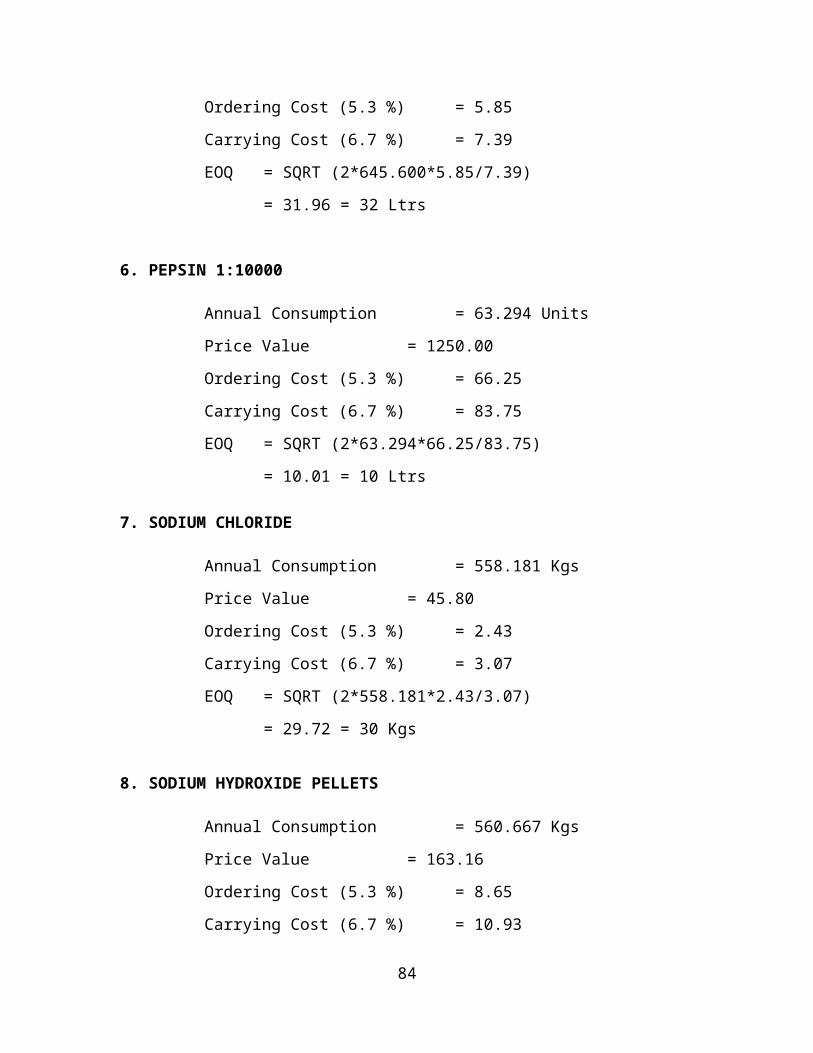
A = Items 1+2,
B = Items 3+4+5+6+7,
C = Items 8+9+10.
A = 69.25%
B = 9.44%
C = 21.31%
Here I am Considering;
A = R.M + P.M
B = L.I + P&S + P.C + E.I + P&F and
C = F.M + V.M + F.C.
INTERPRETATION:
In this analysis I representing raw materials and packing materials are “A” category, lab
items, printing & stationary, production consumables, electrical items, Pipes & fitting are
84
0102030405060
IND
IVID
UA
L
US
AG
E %
1 2 3 4 5 6 7 8 9 10
ITEM NUMBERS
ABC ANALYSIS (2012-13)
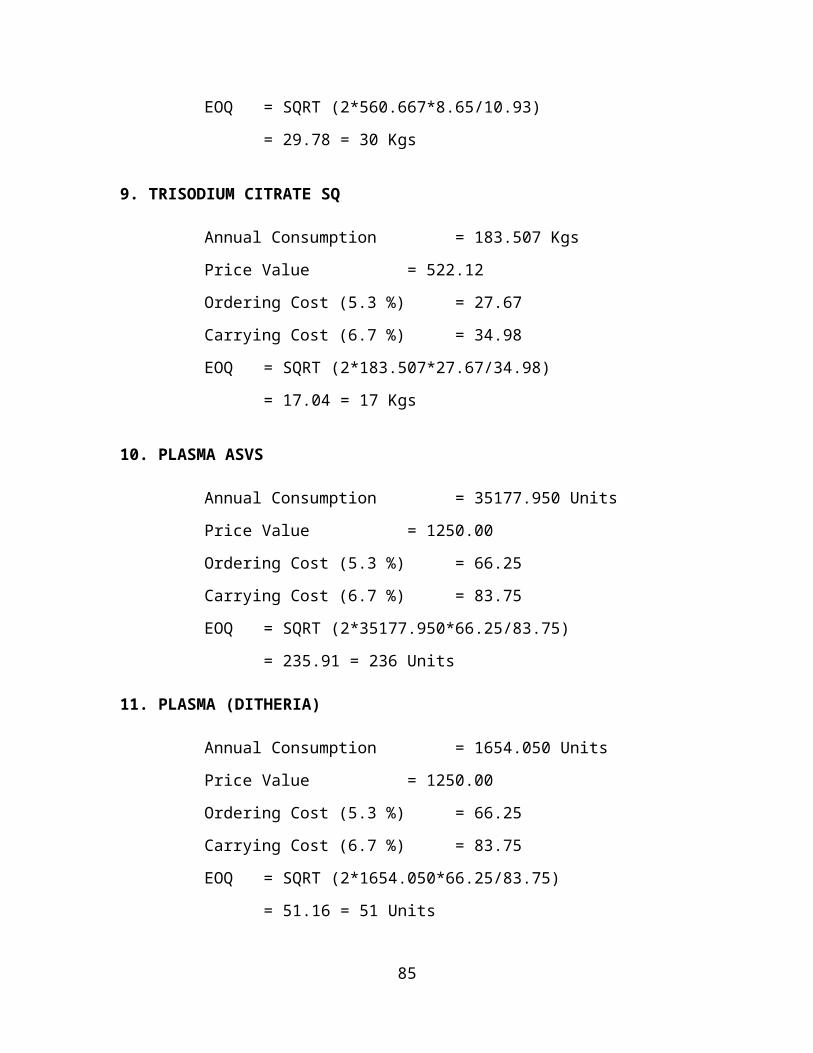
“B” category and In ”C” category I have taken feed materials, veterinary medicines and
farm consumables.
Coming to category wise analysis actual value of “A” items percentage very high. “C”
items usage percentage in 2nd place and “B” items usage percentage in 3rd place.
CHAPTER -VIFINDINGS, SUGGESTIONS AND
CONCLUSION
85
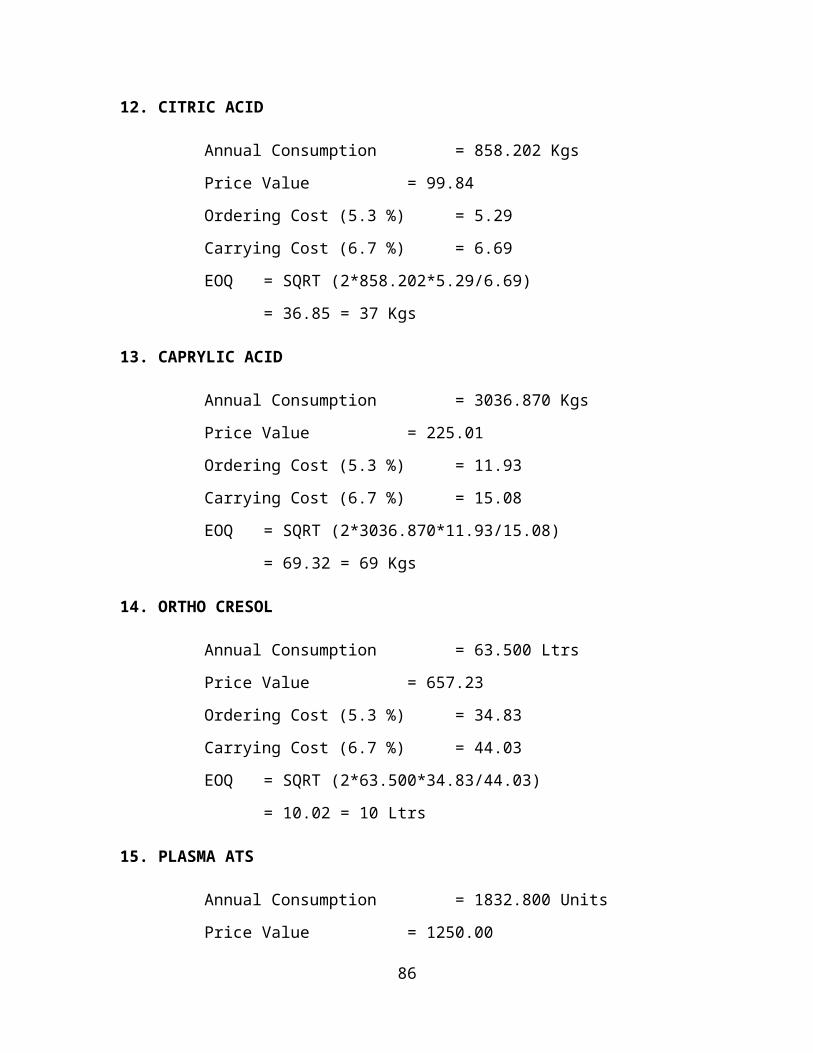
FINDINGS
Inventory Turnover Ratio in 2013-14 stock is converted into liquid more fast
when compared to successive years 2010,11,12,13.
Inventory Holding Period 131 days in 2013-14. The Inventory Conversion Period
is less when compared to previous years.
Economic Order Quantity refers to the size of order that gives maximum economy
in purchasing any materials. It also referred as optimum or standard ordering
quantity.
HETERO DRUGS LIMITED item’s Avg. Annual Consumption is very high when
compared to other items.
ABC Analysis:
A – Characteristic elements of previous years decreased, but 2013-14, was increasing.
B – Characteristic elements regularly decreased but 2011-12, only one was increased.
86

C – Characteristic elements decreased accepted 2011-12.
SUGGESTIONS
Inventory Turnover Ratio existing the organizational stock how efficiently used.
Inventory Turnover Ratio is not either more or less. It should be maintain
appropriate.
In 2012-13, Inventory Turnover Ratio is impressive compare than to previous
years, and they needs should be decreasing as much as possible.
Inventory Holding Period is too impressive comparable previous years. Its
reduction days are 60 from 2009-13. If might be possible they reduce.
EOQ purchase the materials at a reasonable price without sacrificing the quality
of such materials.
ABC Analysis:
A – Characteristic elements are important, because its investment regularly increased
on necessary inventories.
87
B – Characteristic elements are less important compare than A elements. So, its good
for the company.
C – Characteristic elements are less important than B.
CONCLUSION
Inventory Turnover Ratio in 2013-14 stock is converted into liquid more fast when
compared to successive years 2010,11,12,13. Inventory Turnover Ratio existing the
organizational stock how efficiently used. Inventory Turnover Ratio is not either more or
less. It should be maintain appropriate. Inventory Holding Period 131 days in 2013-14.
The Inventory Conversion Period is less when compared to previous years. In 2013-14,
Inventory Turnover Ratio is impressive compare than to previous years, and they needs
should be decreasing as much as possible. Inventory Holding Period is too impressive
comparable previous years. Its reduction days are 60 from 2010-14. If might be possible
they reduce.
Economic Order Quantity refers to the size of order that gives maximum economy in
purchasing any materials. It also referred as optimum or standard ordering quantity. EOQ
purchase the materials at a reasonable price without sacrificing the quality of such
materials. HETERO DRUGS LIMITED item’s Avg. Annual Consumption is very high when
compared to other items.
Overall company performance of ‘HETERO DRUGS LIMITED’ is well.
88
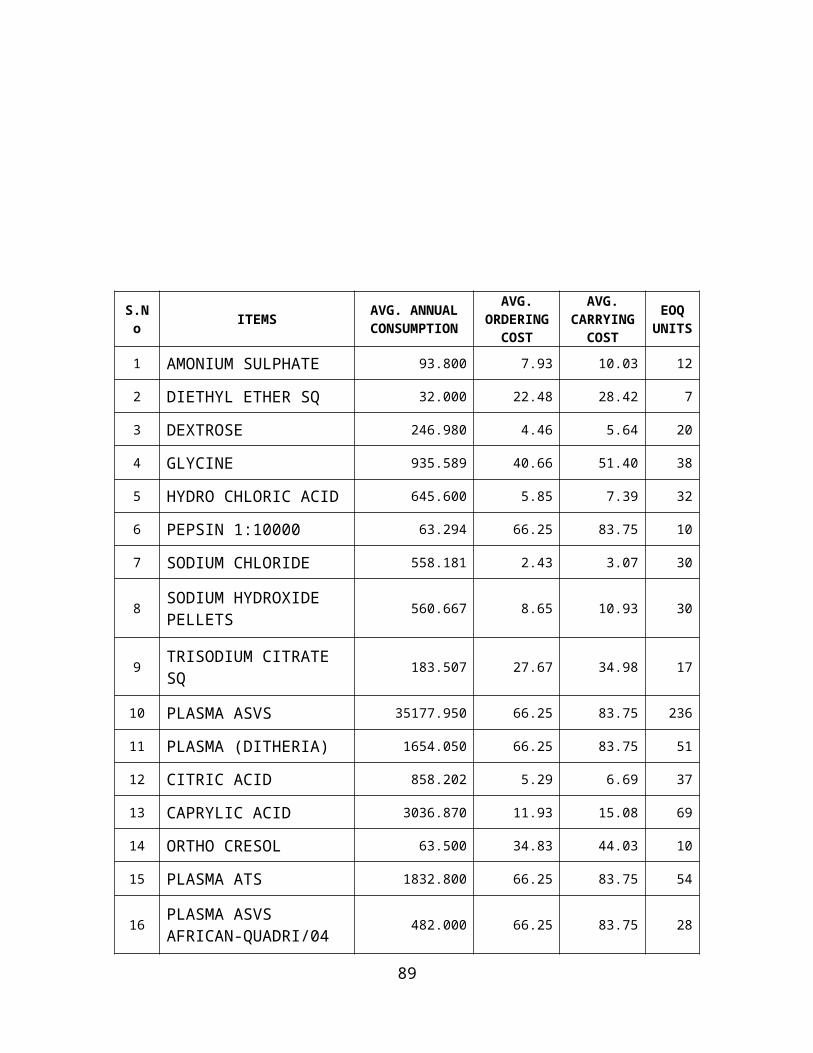
BIBLIOGRAPHY
89
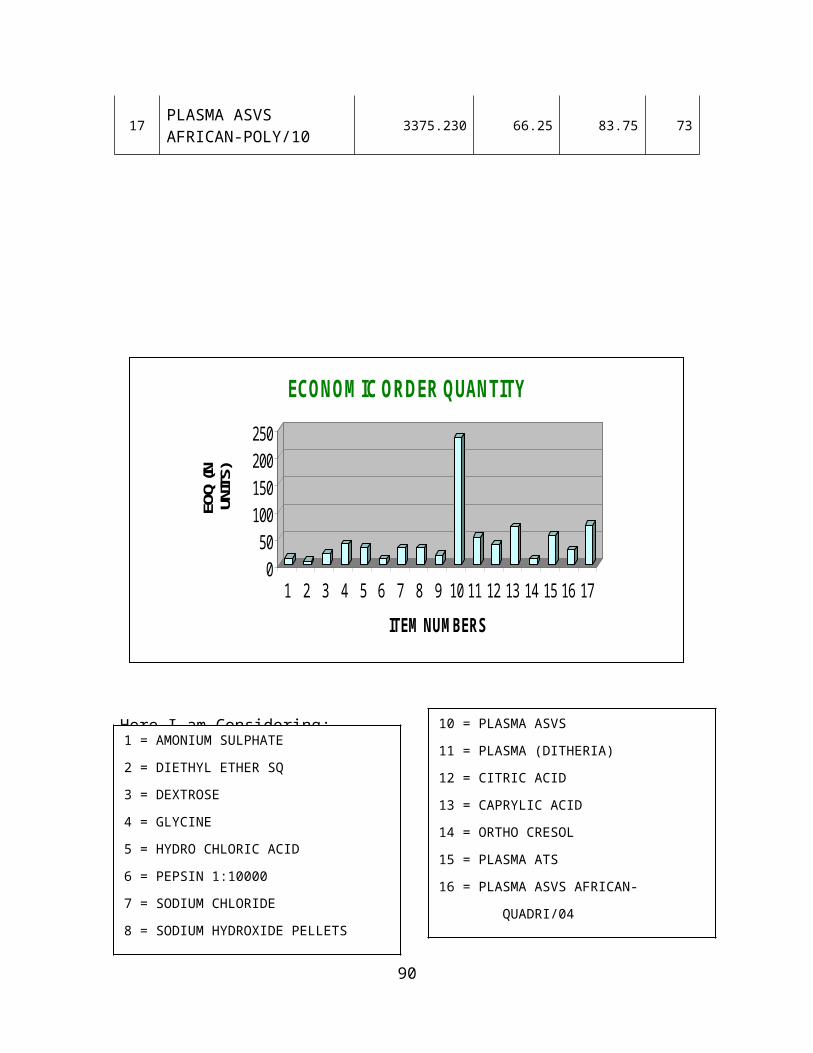
BIBLIOGRAPHY
REFERENCES: AUTHORS / SOURCE
1. FINANCIAL MANAGEMENT PRASANNA CHANDRA
Theory and Practice TMH, 2005 - 6th Edition
2. FINANCIAL MANAGEMENT I.M.PANDEY
VIKAS, 2005 - 9th Edition
3. FINANCIAL MANAGEMENT KHAN & JAIN
Text, Problems & Cases TMH, 2007 - 5th Edition
4. RESEARCH METHODOLOGY K.C. KOTHARI
Methods & Techniques NEW AGE, 2004 - 2nd Edition
5. ANNUAL REPORTS FOR THE
FINANCIAL YEAR 2004 TO 2008 HETERO DRUGS LTD.
90