Embed Size (px)
Citation preview

Invasive Species Mapping Made Easy

Why Created?


Bugwood Image Database System
www.forestryimages.org www.invasive.org
www.ipmimages.org www.insectimages.org
254,000 images available covering 23,000 subjects from 2400 photographers
Launch web interface in 2001 with 3,500 images
Support from USFS, APHIS, NIFA


What about Maps?

Lots of Maps


So, what do we need?
Common Operating Platform
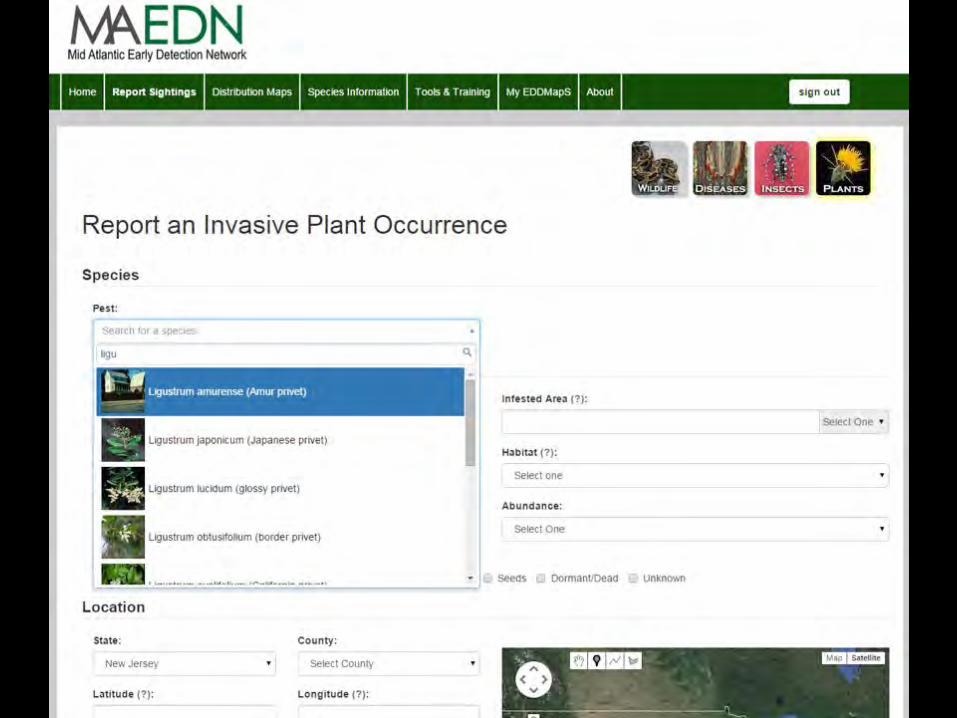
Easy Electronic Reporting

Invasive Species Mapping Made Easy!
EDDMapS, started in 2005 with Southeastern U.S. focus, is now providing a picture of the distribution of invasive species across North America

Who Funds?

Primary External Funding


Typical Users?

Citizen Science and Professional Users EDDMapS aggregates data from other invasive species mapping projects across North America with 3 million records coming in as “bulk data”. However, 152,962 records have been entered via web or smartphone. With: • 98% of reporters have <1000 reports • 94% of reporters have <100 reports


Scope of Data

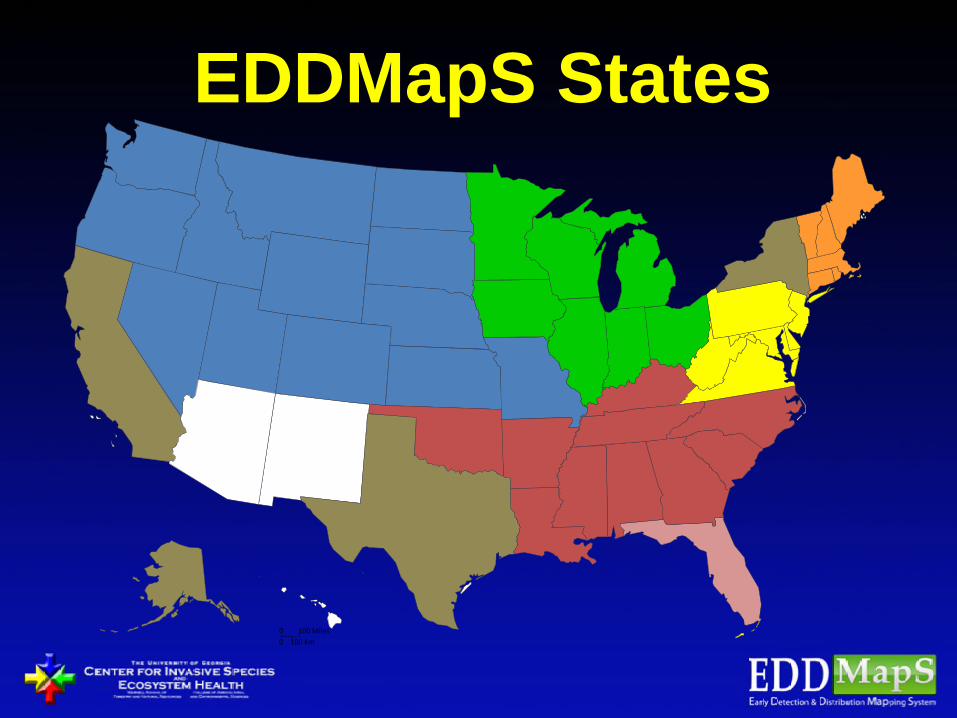
EDDMapS States
0 0 100 Km
100 Miles
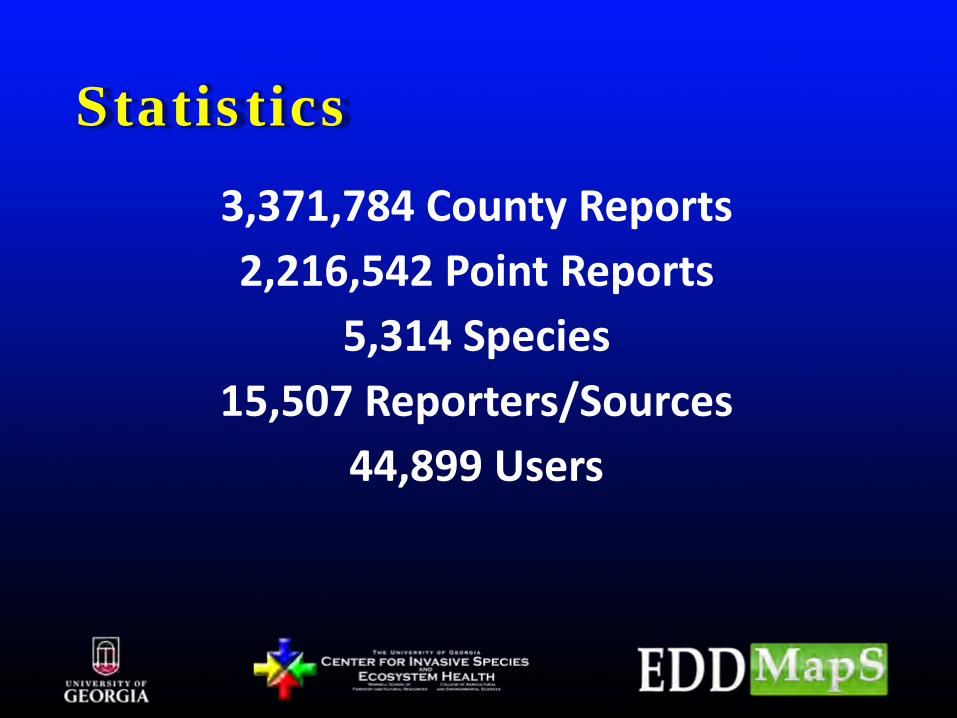
Statistics
3,371,784 County Reports 2,216,542 Point Reports
5,314 Species 15,507 Reporters/Sources
44,899 Users

Scope of Taxa
Plants 4157 Wildlife 538 Diseases 252 Insects 228

EDDMapS 2017 •Average 105 reports a day in 2017 from web or smartphones
•Most reports in a day: 980 on April 13, 2017
•38,555 Reports in 2017 from 4,805 reporters covering 825 species

0
10,000
20,000
30,000
40,000
50,000
60,000
2012 2013 2014 2015 2016 2017
Web iOS Android
Observations sent to EDDMapS by year

EDDMapS Data by State
0
2000
4000
6000
8000
10000
12000
14000

EDDMapS Florida Statistics
18%
82%
AnimalsPlants
What were the reports? Overall

EDDMapS Florida Statistics
42% 58% Animals
Plants
What were the reports? Smartphones

Example types of analyses used for


Positive Treated
Negative Eradicated


What does system do that the other
systems do not/ what makes it unique?


App Downloads
0
20,000
40,000
60,000
80,000
100,000
120,000
140,000
160,000
180,000
iOS Android
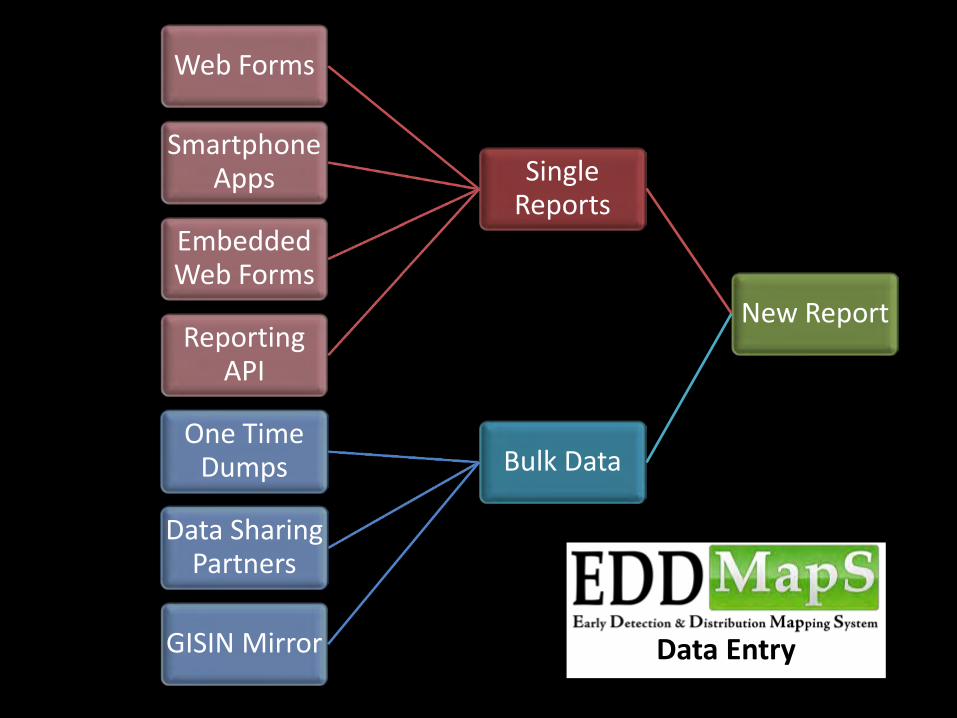
New Report
Single Reports
Web Forms
Smartphone Apps
Embedded Web Forms
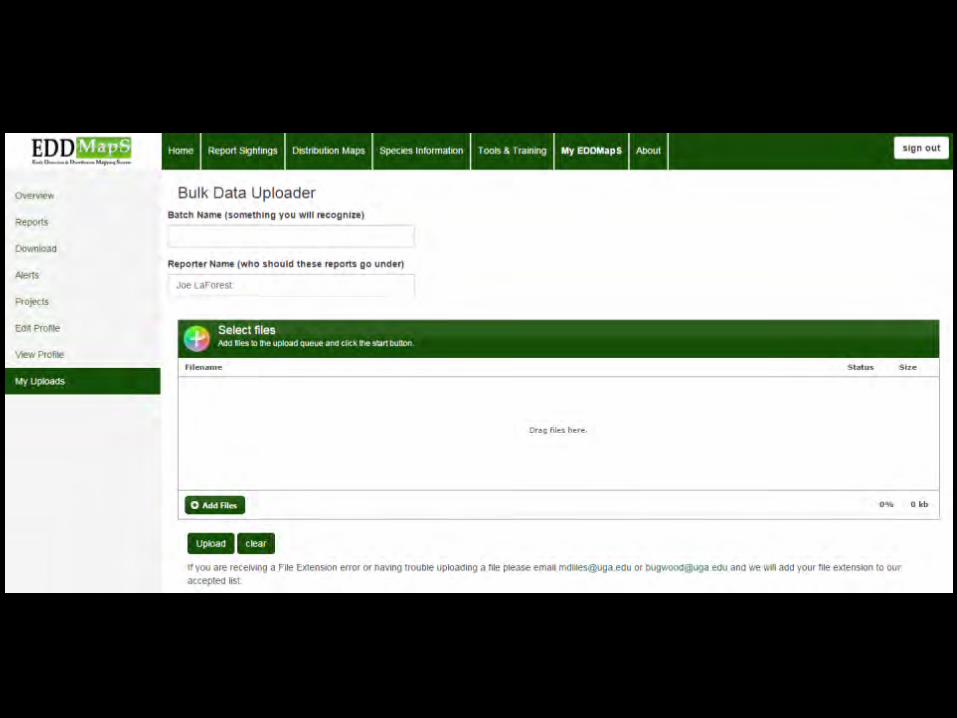
Reporting API
Bulk Data One Time
Dumps
Data Sharing Partners
GISIN Mirror
Data Entry

New Report
Regulated
State Agency Contact
Federal Agency Contact
Not regulated
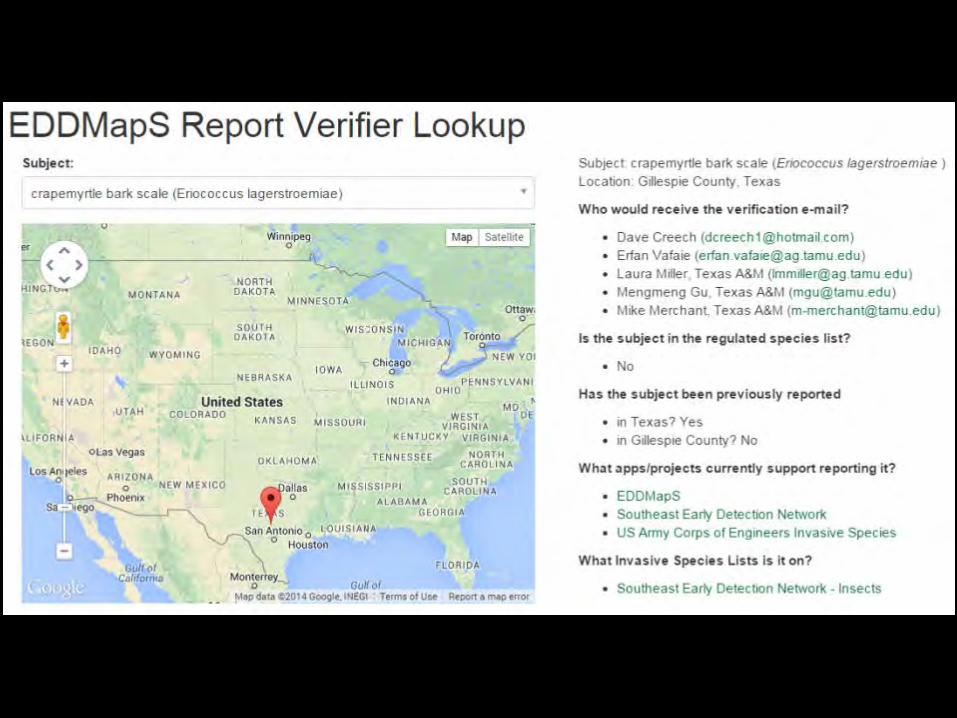
Species Verifier
Location Verifier
State Verifier
CISMA/CWMA Verifier
County Verifier
Park/Site Verifier
Project Verifier
No Verifier EDDMapS Admin
Verification Process
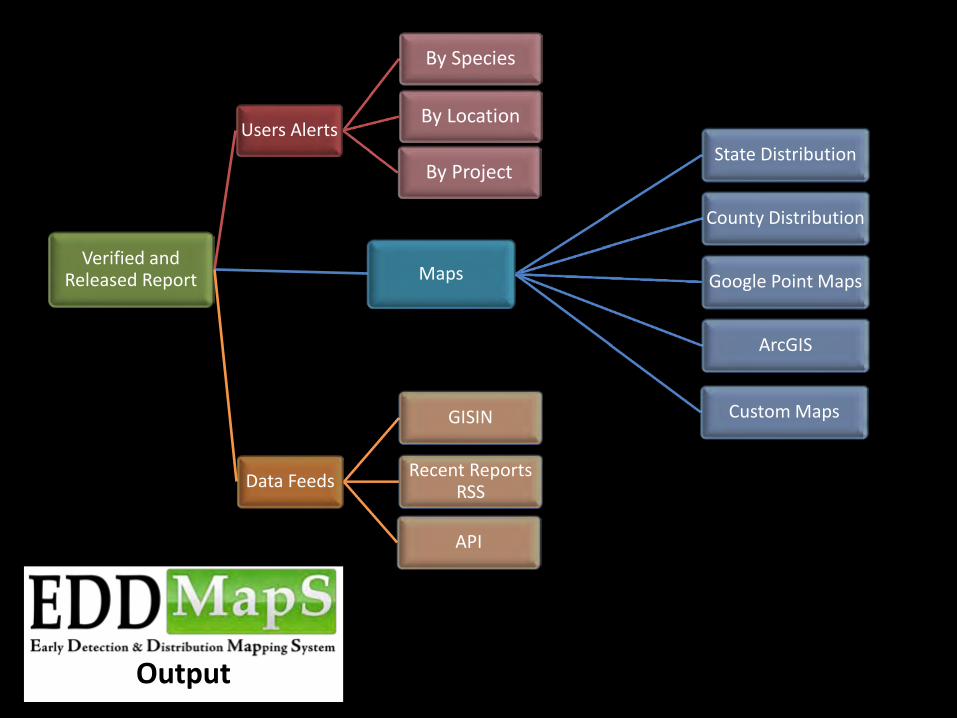
Verified and Released Report
Users Alerts
By Species
By Location
By Project
Maps
State Distribution
County Distribution
Google Point Maps
ArcGIS
Custom Maps
Data Feeds
GISIN
Recent Reports RSS
API
Output

How could the system be leveraged
for state-specific needs?


This incident shows how important it is to report sightings of nonnative
wildlife including constrictor snakes like this one. If you see nonnative fish and wildlife please report them to our
Invasive Species Hotline at 1-888-IveGot1 (1-888-483-4861), online
at IVEGOT1.org or by using the free smart phone app IVEGOT1.

Pulling it all together - Pest Information Site
www.kudzubug.org www.eddmaps.org/cmbs

EDDMapS – Kudzu Bug

EDDMapS – Kudzu Bug


Help us detect damage on invasive plants! > Add-on to invasive plant record submission > Answer a few questions and snap a picture
Plant damage by pathogens and insects can enhance or suppress invasive plants...
…but so much is unknown! > Which invasive plants have damage? > Where in the U.S. does the most damage occur?

If/how does it coordinate with
other systems now?

Major Data Sources Number of Records
USDA PLANTS Database, USDA NRCS 356,312
Biota of North America Program 343,662
International Biological Information System Database 238,082
Forest Inventory and Analysis Database, U.S. Forest Service - SRS 153,922
Minnesota Department of Natural Resources 137,644
Alaska Exotic Plants Information Clearinghouse Database 128,964
Idaho Department of Agriculture 126,047
Florida Natural Areas Inventory Database 124,306
Midwest Invasive Species Information Network Database 109,976
Oregon State Office Database, Bureau of Land Management 93,213
Other 15497 Users 1,559,656

7,850,064 Observations
~200,000 ”invasive species” records are being harvested
http://gimmefreshdata.github.io

Data Sharing Initiative Workshop in Denver
March 14-15, 2018 Recommendations Coming Soon

Enabling Decisions that Make a Difference Guidance for Improving Access to and Analysis of Invasive Species
Information
Jeff Morisette and Chuck Bargeron Western Governors Association Invasive Species Data Management Workshop March 14-15, 2018 Denver, CO 80202

https://www.doi.gov/sites/doi.gov/files/uploads/2016-2018-nisc-management-plan.pdf
“…establish guidance for data management standards, formats, and protocols.”

NISC Data management Guidance • Completed in Spring, 2018. • Input is welcome now. • Meant to help mobilize and manage
invasive species data to mutual benefit of federal agencies, states, tribes, and NGOs.
• Provides a “rally call” to leverage the best return on investment on what has been accomplished to date.
• Will contribute to continued interaction with the White House Office of Office of Science and Technology Policy (OSTP).

System Infrastructure

There is a tool for every job…
Early Detection Alerts Verification
Monitoring and Management
Visualization
Data Sharing and Collaboration


Any gaps in the system?

Smarter Apps • Interactive Keys • Management Recommendations • On demand resources • Project updateable content

Other Gaps
• Better use of ESRI ArcGIS technologies • Aquatic Animals • Better engagement of States with limited
data annual data submission • Federal agency data sets • Better searching tools/technologies

Key Points Available Now! Fast and easy to use - no knowledge of GIS Aggregate data (not replace) from other
systems Working toward “complete” county level
distribution Tool/platform to Facilitate Early Detection
and Rapid Response implementation with online data entry forms, e-mail alerts and network of expert verifiers

Key Points EDDMapS is a tool that can be used to
enhance existing programs It is up and working now, and was built to be
easily customizable Free to use, long term commitment from
UGA to support as key product of Center States don’t have to “buy” in and data is
freely shared Tool for Educating and Involve Others on the
Problem

Key Points One important point to remember is
that the public needs something as easy as possible, thus integrating regulated pests with non regulatory plants make sense (IveGot1 model) However, we must all work together to
make this happen and provide feedback to user when they report something

Information Management for EDRR
• What should be reported? • How is it reported? Detection
• Who has jurisdiction? • Is it new to the county, state, U.S? Responders Alerted
• Is the identification correct? • Has a risk assessment been done? Rapid Assessment
• What management options are available? • What was done and was it effective? Response
Information Needed EDRR Action
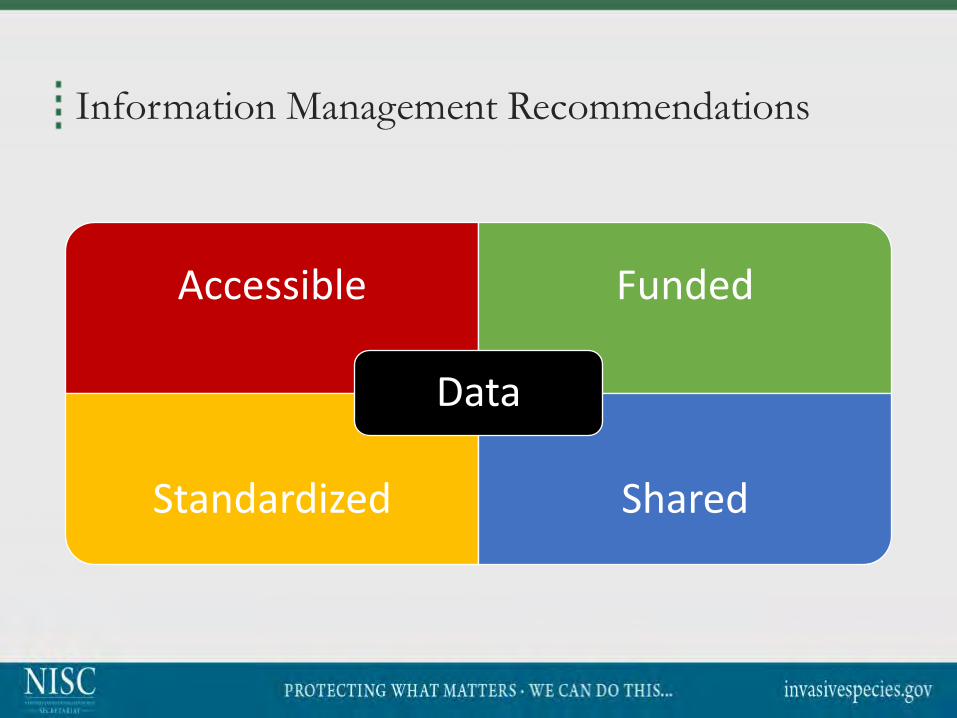
Information Management Recommendations
Accessible Funded
Standardized Shared
Data