Embed Size (px)
Citation preview

Influence of Combustion Conditions on Hydrophilic Properties andMicrostructure of Flame SootChong Han, Yongchun Liu,* Chang Liu, Jinzhu Ma, and Hong He*
Research Center for Eco-Environmental Sciences, Chinese Academy of Sciences, Beijing, 100085, China
ABSTRACT: Previous studies suggest that structure and reactivity of sootdepend on combustion conditions like the fuel/oxygen ratio and nature of fuels.However, the essence of how combustion conditions affect physical andchemical properties of soot is still an open question. In this study, soot sampleswere prepared by combusting toluene, n-hexane, and decane under controlledconditions, and their hydrophilic properties, morphology, microstructure,content of volatile organic compounds, and functional groups werecharacterized. The hydrophilicity of n-hexane and decane flame soot increasedwith decreasing fuel/oxygen ratio, while it almost did not change for tolueneflame soot. Fuel/oxygen ratio had little effect on the morphology of aggregatesand the graphite crystallite size. The primary particle size and the content ofvolatile organic compounds on soot decreased with decreasing fuel/oxygenratio. Less hydrophobic groups (C−H) and more hydrophilic groups (CO)were observed on lean n-hexane and decane flame soot than that on the corresponding rich flame soot. Volatile organiccompounds had little effect on the hydrophilicity of soot while the hydrophilicity correlated linearly with the ratio of COcontent to C−H content. The hydrophilic functional groups were found to be mainly located at graphene layer edges and onsurface graphene layers in soot.
1. INTRODUCTIONSoot aerosols have an important influence on the atmosphericradiative balance by directly absorbing solar radiation as well asby indirectly scattering solar radiation as cloud condensationnuclei (CCN).1,2 It has been reported that soot may beresponsible for the increase of droughts in the northeast andfloods in the southeast in China in the summer over the past 20years.2 The contribution of soot to global warming may besecond only to that of CO2.
3 Soot also poses a health risk bycausing and enhancing respiratory, cardiovascular, and allergicdiseases.4 In addition, soot particles are expected to be active inheterogeneous reactions with gaseous pollutants like NO2,H2SO4, and O3
5−9 significantly affecting the chemicalcomposition of the atmosphere and thus influencing theirclimatic and health effects. Many previous studies imply thatthe environmental effects and the reactivity of soot are greatlyinfluenced by combustion conditions, such as fuel/oxygen ratioand nature of fuels.10−14
In previous research, the morphology, microstructure, andchemical composition of soot particles, including flamesoot,15,16 spark discharge soot,17,18 and commercially availablesoot,17−19 have been investigated using combinations of severalmethods. It has been shown that soot is composed of chainlikeagglomerates of primary particles,17 which consist of perturbedgraphitic layers oriented concentrically in an onionlikefashion.18 Functional groups, including aliphatic or aromaticC−H, carbonyl CO, and ethers C−O, have been confirmedthrough infrared spectroscopy.13,20,21 Microstructures includinggraphitic carbon, disordered carbon, and amorphous carbonhave also been detected using Raman spectroscopy.15−17,19,22,23
Recent studies have shown that residence time in the flame andflame temperature can induce modifications in the micro-structures and functional groups of soot.15,20 Thus, thisdemonstrates that the structure and properties of soots shouldgreatly depend on their formation conditions. On the otherhand, the CCN and ice nuclei (IN) abilities of soot particlessignificantly depend on their hydrophilicity. Although severalprevious studies have investigated the water uptake behavior ofsoot particles,16,23−25 little attention has been paid to thequantitative relationships among hydrophilicity, structure, andcomposition of soot produced under different combustionconditions.In this study, toluene, n-hexane, and decane soot samples
were produced under well-controlled combustion conditions.Hydrophilic changes due to different combustion conditionswere studied by analyzing surface tension derived from contactangle. The morphology and microstructure of soot wereinvestigated using transmission electron microscopy (TEM)and Raman spectroscopy. Surface-bonded volatile organiccompounds (VOCs) and functional groups were also studiedby thermogravimetric (TG) analysis and single reflectionattenuated total internal reflection infrared (ATR-IR) spectra.Finally, the quantitative relationship relating the hydrophilicproperties, structure, and chemical composition of soot wasdiscussed.
Received: February 1, 2012Revised: March 29, 2012Published: March 29, 2012
Article
pubs.acs.org/JPCA
© 2012 American Chemical Society 4129 dx.doi.org/10.1021/jp301041w | J. Phys. Chem. A 2012, 116, 4129−4136

2. EXPERIMENTAL SECTION
2.1. Soot Production. Soot samples were produced byburning toluene, n-hexane, and decane (AR, SinopharmChemical Reagent Lo., Ltd.) in a coflow homemade burnersystem as described by Rossi and co-workers.10,26,27 The coflowburner consisted of a diffusion flame maintained in a flow ofsynthetic air, which was controlled by mass flow meters toregulate the fuel/oxygen ratio. The airflow consisted of highpure oxygen and nitrogen and the oxygen/nitrogen ratio was inthe range of 27.5−47.5%. The fuel was fed by a cotton wickextending into the liquid fuel reservoir. The fuel/oxygen ratio,which was the molar ratio of fuel (measured by consumed fuelmass) to oxygen (obtained by the entrained air flow volume),was in the range of (0.170−0.095), (0.180−0.100), and(0.110−0.060) for toluene, n-hexane, and decane. Thus, sootobtained in a relatively high fuel/oxygen ratio (0.170 fortoluene, 0.180 for n-hexane, 0.110 for decane) was roughlyidentified as rich flame soot, while one produced in a relativelylow fuel/oxygen ratio (0.095 for toluene, 0.100 for n-hexane,0.060 for decane) was roughly identified as lean flame soot.Soot was collected on aluminum foil suspended over thediffusion flame.2.2. Characterization of Soot. The hydrophilicity of soot
was investigated by measuring contact angle, which was definedgeometrically as the angle formed at the liquid, gas, and solidphase boundary. Before the contact angle measurements, 10 mgof the fresh fluffy soot powder was pressed into a sheet of 13mm diameter at a slight compacting pressure. Then, a waterdroplet with radius around 2 mm was immediately dropped onthe soot sheet. The contact angle of the water droplet on thesoot sheet was determined using sessile drop measurement,which has been extensively used.24,28−31 After the water wasdropped on the soot sheet, a picture of the spreading water onthe soot sheet was taken using a Sony digital camera.24Then,the contact angle of the water droplet was measured withImageJ 1.41 software.The morphology and particle size of the soot were examined
using a TEM (H-7500, Hitachi). Soot produced in a diffusionflame was directly deposited onto a Cu microgrid. Theacceleration voltage was set to 200 kV for the measurements.ImageJ 1.41 software was used to analyze the diameter of sootparticles.Raman spectra of soot were recorded on a UV resonance
Raman spectrometer (UVR DLPC-DL-03), which wasdescribed previously.23 A continuous diode-pumped solidstate (DPSS) laser beam (532 nm) was used as the excitingradiation with a source power of 40 mW. No samplemodification was observed when the sample was irradiatedunder the experimental conditions. The diameter of the laserspot on the sample surface was focused at 25 μm. The spectraresolution was 2.0 cm−1. The exposure time for each scan was50 s.The content of VOCs on these three flame soots was
investigated by thermal desorption using a commercial TGinstrument (TGA/DSC1/HT1600, Mettler-Toledo Co., Ltd.).The amount of VOCs lost from the soot was recorded whenthe temperature was ramped from 30 to 300 at 10 °C min−1 innitrogen flow.The functional groups of the samples were characterized
using a Fourier transform infrared spectrometer (FT-IR,NEXUS 6700, Thermo Nicolet Instrument Corp.) equippedwith a high-sensitivity mercury−cadmium−telluride (MCT)
detector cooled by liquid N2 and an ATR-IR cell. The spectraof soot were recorded (32 scans, 4 cm−1 resolution) using theblank Ge crystal as reference.
3. RESULTS3.1. Hydrophilicity of Soot. The value of contact angle,
which can be used as an indicator of the hydrophilicity ofmaterials, depends on the strength of the interaction betweenwater droplets and the material surfaces. A water droplet givinga small contact angle implies a hydrophilic solid surface, whilehydrophobic surfaces yield large contact angles. Figure 1 shows
the pictures of water droplets on the surfaces of the rich andlean n-hexane flame soot. The water droplet on the lean flamesoot displayed a less spherical shape than that on the rich flamesoot suggesting an increase in hydrophilicity of n-hexane flamesoot with decreasing fuel/oxygen ratio. Through comparingprevious reports,24,32 it was found that the contact angles oflean n-hexane and decane soot were similar to ones of propaneand kerosene soot indicating that they have similar hydro-philicity.The changes of contact angle indicate that the surface free
energies between water and soot are altered with the decreasingfuel/oxygen ratio. Surface free energies are extremely importantsince they not only determine the strength of interactionbetween water and solid surfaces but also control the dynamicsof molecular self-assembly, wetting, spreading, and adhesion.31
Therefore, surface free energies are taken as a key factor tounderstanding the mechanism of surface-based phenomena.The solid surface tension γsv, which is proportional to surfacefree energy, can be determined using Young’s equation.31
γ θ = γ − γcoslv sv sl (1)
where θ is the contact angle, and γlv, γsv, and γsl are theinterfacial tensions of the liquid−vapor, solid−vapor, andsolid−liquid interfaces, respectively. However, only γlv and θcan be experimentally measured. Thus, to determine the solidsurface tension γsv, Kwok and Neumann have obtained oneknown equation applying the Berhelot geometrical rules33
γ =γ θ +(cos 1)
4svlv
2
(2)
where γlv is the surface tension of water at ambient temperature(72.7 mJ m−2).33
The surface tensions for these three fuels’ flame soot werecalculated using eq 2 and are summarized in Figure 2. A largersurface tension means that particles are more hydrophilic. It canbe seen that, for n-hexane and decane flame soot, solid surfacetensions exhibited a significant increase with decreasing fuel/oxygen ratio, while little change was observed for toluene flamesoot. These results highlight differences in the roles of
Figure 1. Pictures of water droplets deposited on rich (A) and lean(B) n-hexane flame soot.
The Journal of Physical Chemistry A Article
dx.doi.org/10.1021/jp301041w | J. Phys. Chem. A 2012, 116, 4129−41364130

combustion conditions in determining hydrophilicity for sootof different origins. The different hydrophilicity as well as theresponse to the fuel/oxygen ratio for these three fuels’ sootimplies a different content of hydrophilic or polar speciesformed on these soot samples. Several studies measuredhydrophilicity of soot using water vapor adsorption iso-therms.16,23−25 To compare surface tension in this work withsoot hydrophilicity obtained using water vapor adsorptionisotherms, the following equation can be derived from theadsorption heat measured using adsorption isotherms, Young’sequation, and the definition of Gibbs free energy.
−γ + θ = − ΔQ T S(1 cos )lv 1 (3)
where Q1 is adsorption heat that can be obtained throughBrunauer−Emmett−Teller (BET) equation fitting, T istemperature, and ΔS is entropy change. Here, the relationshipbetween the contact angle and the adsorption heat can be
established in theory. If the part TΔS in eq 3 is similar in thesimilar systems, a small contact angle (θ) should correspond toa large Q1. Thus, we can qualitatively compare surface tensionin this work with soot hydrophilicity obtained using watervapor adsorption isotherms. Unfortunately, the ΔS isunavailable at present date, and so we cannot quantitativelycompare them.It has been reported that structures and compositions can
significantly affect the physical and chemical properties of soot.To identify the causes that may induce the changes in soothydrophilicity, TEM, Raman spectra, TG, and ATR-IR spectrawere used to obtain comprehensive information on themorphology, microstructure, VOCs content, and functionalgroups of soot produced under different combustionconditions.
3.2. Morphology and Microstructure.Morphology of SootAgglomerates. Figure 3 shows TEM images of fresh rich andlean flame soot samples. All soot samples consisted of typicalspherical particles, which formed long chainlike agglomerates asreported in other studies.13,17,18 To evaluate the aggregationproperties of soot samples, the ratio of maximum length (L) toaverage width of aggregates (W), the average particle diameter( dp), and the fractal dimension (Df) were calculated. Forfractal-like aggregates, the parameter Df has been widely used todescribe particle morphology.23 In addition, coagulationdynamics and optical properties of soot have often beenassessed using the parameter Df, which is calculated by thefollowing empirical and statistical relationships23
≅ ≅ N d d L d( / ) ( / )aa D
p2
pf
(4)
where N is the number of primary particles in an aggregatedsample, da = (4Aa/π)
1/2 is the area-equivalent diameter of theaggregated area (Aa), a = 1.09 is a parameter to account for theparticle screening on projected TEM images, and L is themeasured maximum aggregate length.
Figure 2. Plot of solid surface tension versus fuel/oxygen ratio.
Figure 3. A, B, and C are TEM images of rich soot for toluene, n-hexane, and decane, respectively; D, E, and F are TEM images of lean soot fortoluene, n-hexane, and decane, respectively.
The Journal of Physical Chemistry A Article
dx.doi.org/10.1021/jp301041w | J. Phys. Chem. A 2012, 116, 4129−41364131

As shown in Table 1, for all rich and lean flame soot fromtoluene, n-hexane, and decane, the parameters L/W and Df
were around 7.0 and 1.4, respectively. The values of theparameter L/W were significantly greater than that of DegussaPrintex U (2.0−3.0)23 exhibiting a longer chainlike agglom-erated structure. Although the Df parameters of soot in thiswork were slightly smaller than that (1.7) of ethylene andpropane flame soot,34,35 all of these studies found that Df isinsensitive to combustion conditions. A larger Df means thatthe sample is prone to coagulation and reconstruction. Dfremained almost unchanged with decreasing fuel/oxygen ratiosuggesting that the fuel/oxygen ratio has little effect on theformation of compacted aggregates and the growth ofsecondary particles. Compared to the average particle diameter( dp) of fresh rich toluene, n-hexane, and decane flame soot,however, the average particle diameter of all three lean flame
soots showed an obvious decrease. This result coincides wellwith results reported by Slowik.34 The decrease amplitude in dp
was 17.3%, 10.3%, and 16.5%. Figure 4 shows the diameterdistribution of primary particles from the three fuels. Theproportion of spherical particles with small diameter (<30 nm)for lean flame soot was significantly greater than that for richflame soot, while the opposite was observed for large particles(>30 nm).
Microstructure of Soot. Figure 5 shows the first-orderRaman spectra of three rich flame soots, which display well-known bands of soot near 1580 (G band) and 1360 cm−1 (Dband). The G band is a typical characteristic of crystallinegraphite, while the D band is only observed for disorderedgraphite. A detailed analysis of the first-order Raman spectrawas performed using the five-band fitting procedure proposedby Sadezky.19 Four Lorentzian-shaped bands (D1, D2, D4, andG, centered at about 1360, 1620, 1180, and 1580 cm−1,respectively) and one Gaussian-shaped band (D3, centered ataround 1500 cm−1) were used in the curve-fitting proc-ess.19,22,23 The D1 band arises from the A1g symmetry mode ofthe disordered graphitic lattice located at the graphene layeredges. The D2 band is attributed to the E2g symmetrystretching mode of the disordered graphitic lattice located atsurface graphene layers. The D3 band originates from theamorphous carbon fraction of soot. The D4 band is related tothe A1g symmetry mode of the disordered graphitic lattice orC−C and CC stretching vibrations of polyene-like structures.The G band is assigned to the ideal graphitic lattice with E2gsymmetry vibration mode.As shown in Figure 5, the curve-fitting results (red line) for
the three rich flame soots coincide well with the experimental
Table 1. Ratio of Maximum Length (L) to Average Width ofAggregates (W) and Average Particle Size ( dp) and theFractal Dimension (Df) of Fresh Toluene, n-Hexane, andDecane Soot
fuels type of soot L/W dp (nm) Df
toluene rich 5.8 ± 1.1 30.1 ± 8.7 1.42 ± 0.12lean 7.5 ± 0.9 24.9 ± 8.1 1.32 ± 0.10
n-hexane rich 6.0 ± 1.2 33.1 ± 8.1 1.47 ± 0.03lean 7.1 ± 1.9 29.7 ± 7.0 1.44 ± 0.07
decane rich 7.6 ± 1.3 28.4 ± 9.6 1.45 ± 0.05lean 7.3 ± 0.9 23.7 ± 5.9 1.37 ± 0.06
Figure 4. Diameter distribution of fresh rich and lean toluene, n-hexane, and decane soot.
The Journal of Physical Chemistry A Article
dx.doi.org/10.1021/jp301041w | J. Phys. Chem. A 2012, 116, 4129−41364132
curve (black line). The correlation coefficients are greater than0.980. We focused predominantly on discussion of changes inthree bands (D1, D2, and G). Table 2 summarizes the intensity
ratios ID1/IG and ID2/IG for different types of soot samples.Compared to the value of ID1/IG and ID2/IG for rich toluene, n-hexane, and decane flame soot, the values for the three leanflame soots exhibited increases. This suggests that the contentof disordered carbon at graphene layer edges and surfacegraphene layers increases with decreasing fuel/oxygen ratio. Italso implies that the lean flame soot has a lower degree of orderthan rich flame soot, which can be ascribed to higher degree ofsoot oxidation in lower fuel/oxygen ratio.36
For the integral intensity ratio (ID/IG) of D and G bands andthe graphite crystallite size La, an empirical correlation has beenderived. It was found that the ratio ID/IG is inverselyproportional to the graphite crystallite size La
37,38
=⎛⎝⎜
⎞⎠⎟L
II
44
a
D
G (5)
where La is the graphite crystallite size as determined by X-ray.The intensities of D and G bands have been widely determinedusing the sum of D1 and D4 bands and the sum of D2 and G
bands.17 By using eq 5, La was calculated and was found to varybetween 14 and 18 Å within the standard deviation, which wasconsistent with the upper limit (15−20 Å) reported by Shroderand Nemanich.39 However, La is smaller than the sizes of thegraphite crystallite size in diesel and candle soot.36 For all richand lean soots, La essentially did not change with the fuel/oxygen ratio. This indicates that the fuel/oxygen ratio has littleeffect on graphite crystallite size.
3.3. Chemical Composition. VOCs Content of Dif ferentSoot. Heating soot samples to 300 °C should cause loss ofVOCs without the bulk elemental carbon being modified.13
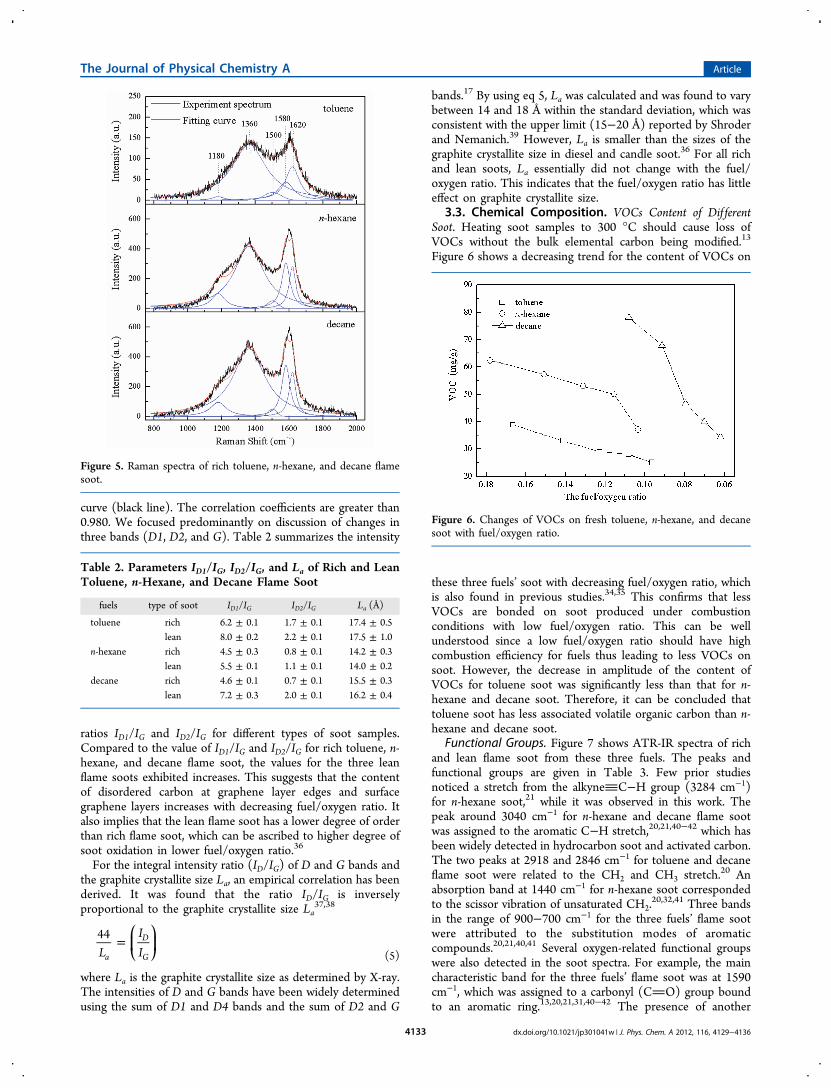
Figure 6 shows a decreasing trend for the content of VOCs on
these three fuels’ soot with decreasing fuel/oxygen ratio, whichis also found in previous studies.34,35 This confirms that lessVOCs are bonded on soot produced under combustionconditions with low fuel/oxygen ratio. This can be wellunderstood since a low fuel/oxygen ratio should have highcombustion efficiency for fuels thus leading to less VOCs onsoot. However, the decrease in amplitude of the content ofVOCs for toluene soot was significantly less than that for n-hexane and decane soot. Therefore, it can be concluded thattoluene soot has less associated volatile organic carbon than n-hexane and decane soot.
Functional Groups. Figure 7 shows ATR-IR spectra of richand lean flame soot from these three fuels. The peaks andfunctional groups are given in Table 3. Few prior studiesnoticed a stretch from the alkyneC−H group (3284 cm−1)for n-hexane soot,21 while it was observed in this work. Thepeak around 3040 cm−1 for n-hexane and decane flame sootwas assigned to the aromatic C−H stretch,20,21,40−42 which hasbeen widely detected in hydrocarbon soot and activated carbon.The two peaks at 2918 and 2846 cm−1 for toluene and decaneflame soot were related to the CH2 and CH3 stretch.20 Anabsorption band at 1440 cm−1 for n-hexane soot correspondedto the scissor vibration of unsaturated CH2.
20,32,41 Three bandsin the range of 900−700 cm−1 for the three fuels’ flame sootwere attributed to the substitution modes of aromaticcompounds.20,21,40,41 Several oxygen-related functional groupswere also detected in the soot spectra. For example, the maincharacteristic band for the three fuels’ flame soot was at 1590cm−1, which was assigned to a carbonyl (CO) group boundto an aromatic ring.13,20,21,31,40−42 The presence of another
Figure 5. Raman spectra of rich toluene, n-hexane, and decane flamesoot.
Table 2. Parameters ID1/IG, ID2/IG, and La of Rich and LeanToluene, n-Hexane, and Decane Flame Soot
fuels type of soot ID1/IG ID2/IG La (Å)
toluene rich 6.2 ± 0.1 1.7 ± 0.1 17.4 ± 0.5lean 8.0 ± 0.2 2.2 ± 0.1 17.5 ± 1.0
n-hexane rich 4.5 ± 0.3 0.8 ± 0.1 14.2 ± 0.3lean 5.5 ± 0.1 1.1 ± 0.1 14.0 ± 0.2
decane rich 4.6 ± 0.1 0.7 ± 0.1 15.5 ± 0.3lean 7.2 ± 0.3 2.0 ± 0.1 16.2 ± 0.4
Figure 6. Changes of VOCs on fresh toluene, n-hexane, and decanesoot with fuel/oxygen ratio.
The Journal of Physical Chemistry A Article
dx.doi.org/10.1021/jp301041w | J. Phys. Chem. A 2012, 116, 4129−41364133

carbonyl group, assigned to ketone species (1710 cm−1), wasobserved for decane soot.13,20,21,40,41
As seen in Figure 7, compared to the functional groups onthe rich toluene flame soot, no significant changes wereobserved on the lean toluene flame soot. For n-hexane anddecane soot, the lean flame soot exhibited lower intensities inthe peaks of alkynesC−H, aromatic C−H, unsaturated CH2,and highly substituted aromatic compounds, while the carbonyl(CO) group bound to an aromatic ring showed a largerintensity than that of the rich flame soot. These resultsdemonstrate that combustion conditions have significant effectson composition.
4. DISCUSSION
On the basis of the changes in the parameters L/W, Df, dp, andLa, it is difficult to directly establish the relationship betweenthe hydrophilicity of soot samples and the physical structure.
Therefore, it was necessary to further discuss the influence ofchemical structure on the hydrophilicity of soot.To confirm the influence of VOCs on the hydrophilicity of
soot samples, Figure 8 compared the surface tension of the
fresh and 300 °C heated n-hexane soot. Almost no differencewas observed between the heated samples and the freshsamples. This confirms that VOCs have little effect on theinteraction of soot with water, which may be ascribed to theirvery low content (35−65 mg/g) on soot. On the other hand, ifhydrophilic species are embedded in VOCs, the hydrophilicityof soot will decrease after removing VOCs. However, theobserved facts are that hydrophilicity of heated soot remainsunchanged suggesting that hydrophilic species should mainly belocated in the carbon skeleton of soot rather than in VOCs.It is well-known that C−H functional groups are hydro-
phobic while CO groups are hydrophilic.16,23,31 Thus, theintegrated areas of the absorption peaks in the ATR-IR spectracan be associated to the hydrophilic or hydrophobic characterof the organic materials. Table 4 summarizes the relative
intensities of hydrophilic and hydrophobic functional groups.The CO/Ar−H, CO/R−H, and TCO/TC−H (the ratio ofpeak areas of all hydrophilic groups to peak areas of allhydrophobic groups) ratios for rich and lean toluene flame sootonly exhibited a slight increase. This is well in accordance withthe small effect of the fuel/oxygen ratio on the changes ofcontact angle or surface tension for toluene flame soot.Compared to rich n-hexane flame soot, lean n-hexane flamesoot increased by factors of 2 for the ratio CO/Ar−H and ofmore than 3 for the ratio CO/R−H. The lean decane flamesoot exhibited a CO/Ar−H ratio larger by a factor of 8 than
Figure 7. Typical baseline-corrected, normalized ATR-IR spectra forrich and lean toluene, n-hexane, and decane soot.
Table 3. Functional Groups Observed for Rich and LeanToluene, n-Hexane, and Decane Soot
peak/cm−1 functional group
3284 alkynesC−H stretch3040 aromatic C−H stretch2918 alkane CH2 asymmetric stretch2846 alkane CH3 asymmetric stretch1710 carbonyl CO1590 CO bonded to an aromatic ring1440 unsaturated C−H(CH2) scissor vibration876 substituted aromatic C−H840 substituted aromatic C−H745 substituted aromatic C−H
Figure 8. Comparison of surface tension for fresh and 300 °C heatedn-hexane soot.
Table 4. Changes of the Hydrophobic and HydrophilicFunctional Groupsʼ Intensities
fuels
typeofsoot
CO/Ar−H (aromatic
C−H)
CO/R−H(aliphaticC−H)
TCO/TC−H (total CO/total C−H)
toluene rich 1.7 2.6 1.1lean 1.8 3.1 1.3
n-hexane rich 0.3 2.2 0.18lean 0.6 7.7 0.56
decane rich 0.7 5.5 0.65lean 6.2 4.5 2.6
The Journal of Physical Chemistry A Article
dx.doi.org/10.1021/jp301041w | J. Phys. Chem. A 2012, 116, 4129−41364134

that of rich decane flame soot. Additionally, the increase inamplitude in TCO/TC−H for lean n-hexane and decane flamesoot was 2 and 3 factors. Considering the convenience of thepreparation of n-hexane flame soot through the presentmethod, the surface tension values have been plotted versusTCO/TC−H of n-hexane soot obtained in the range of (0.180−0.100) of the fuel/oxygen ratio in Figure 9. It can be seen that
surface tension increases linearly with TCO/TC−H demonstrat-ing that more oxygen-related species can contribute to strongerhydrophilicity in lean flame soot.We also investigated the TCO/TC−H ratio for heated rich
and lean n-hexane soot, which was 0.25 and 0.66, showing aslight increase that cannot induce significant changes inhydrophilicity. After removal of VOCs, the larger TCO/TC−Hratio further confirmed that hydrophilic species were located inthe carbon skeleton of soot rather than in VOCs, whichcoincided well with results proposed by Akhter et al.40 Theystated that some oxygen-related functionalities such ascarbonyl, ether, and anhydride groups were incorporated inthe graphitic structure that formed the skeleton of soot. Toidentify microscopic regions containing hydrophilic species inthe soot skeleton, the parameter TCO/TC−H was plottedagainst the parameter I(D1+D2)/IG for three fuels’ flame soot(Figure 10). As shown in Figure 10, the parameter TCO/TC−H
displayed an increasing trend with an increase in the parameterI(D1+D2)/IG. This means that hydrophilic functional groups(CO) might be mainly located at graphene layer edges andsurface graphene layers. According to the results of Ramanspectra, a higher content of disordered carbon at graphene layeredges and surface graphene layers for lean n-hexane and decaneflame soot can be one of the reasons for their smaller contactangle and larger surface tension. This also suggests that thelower degree of structural order of soot may also result fromthe incorporation of oxygen-containing groups into thegraphene structure, which then contribute to the strongerhydrophilicity of soot. In comparing rich and lean toluene flamesoot, although the latter had a lower degree of structural order,it did not show stronger hydrophilicity because of theinsignificant increase in amplitude in the CO/Ar−H, CO/Ar−H, and TCO/TC−H ratios. The difference in sootformation mechanism upon pyrolysis of aliphatic and aromatichydrocarbon fuels may explain the reason why toluene datadeviates from the data for n-hexane and decane (Figure 2). It isbelieved that polycyclic aromatic hydrocarbons (PAHs) are thekey intermediate compounds in soot formation.43−46 Theformation of the first aromatic ring is perceived to be the rate-limiting step in the reaction sequence to larger aromatics.43,44
In flame of nonaromatic fuels, the formation of the firstaromatic ring starts with the joining of small aliphatics (C4H3,C2H2, C3H3, C5H5, et al.).43,44 Numerical simulations haveidentified oxidation of small aliphatics as the key point ofbranching between aromatics growth and aromatics oxida-tion.45,46 Thus, oxygen-containing groups might be morefavorably formed at low fuel/oxygen ratio for n-hexane anddecane combustion compared to toluene combustion. On thebasis of the above results, it may be concluded that the ratiobetween hydrophilic and hydrophobic functional groups andthe content of disordered carbon at graphene layer edges andsurface graphene layers reflect the chemical properties of sootwith respect to its hydrophilicity. These results confirm thatcombustion conditions can affect the hydrophilic properties ofsoot by altering its functional groups and chemical micro-structure.
5. CONCLUSIONS
Soot samples were produced under controlled combustionconditions. Surface tensions for n-hexane and decane flame sootexhibited a significant increase with decreasing fuel/oxygenratio, while that for toluene flame soot almost remainedunchanged. These results suggest that combustion conditionsplay different roles in hydrophilic changes for soot of differentorigins.The fuel/oxygen ratio has a little effect on physical structure
changes including maximum length (L) to average width ofaggregates (W), fractal dimension (Df), and graphite crystallitesize (La). However, average particle diameter ( dp) and contentof VOCs decreased with decreasing fuel/oxygen ratio. Becauseof the low content of VOCs on flame soot, their influence onthe hydrophilic changes of soot was negligible. On the basis ofthe infrared spectral results, it was found that the surfacetension of soot samples increases linearly with the ratio of CO content to C−H content, which greatly depends oncombustion conditions. On the basis of Raman and infraredspectra, it is suggested that hydrophilic functional groups weremainly located at the graphene layer edges and surfacegraphene layers of the carbon skeleton in soot.
Figure 9. Plot of surface tension versus TCO/TC−H for n-hexaneflame soot.
Figure 10. Plot of parameter TCO/TC−H versus parameter I(D1+D2)/IG.
The Journal of Physical Chemistry A Article
dx.doi.org/10.1021/jp301041w | J. Phys. Chem. A 2012, 116, 4129−41364135

■ AUTHOR INFORMATIONCorresponding Author*E-mail: [email protected] (Y.L.); [email protected] (H.H.).
NotesThe authors declare no competing financial interest.
■ ACKNOWLEDGMENTSThis research was financially supported by the National NaturalScience Foundation of China (20907069, 50921064, and20937004).
■ REFERENCES(1) Chameides, W. L.; Bergin, M. Science 2002, 297, 2214−2215.(2) Menon, S.; Hansen, J.; Nazarenko, L.; Luo, Y. Science 2002, 297,2250−2253.(3) Jacobson, M. Z. Nature 2001, 409, 695−697.(4) Sydbom, A.; Blomberg, A.; Parnia, S.; Stenfors, N.; Sandstrom,T.; Dahlen, S. E. Eur. Respir. J. 2001, 17, 733−746.(5) Monge, M. E.; D’Anna, B.; Mazri, L.; Giroir-Fendler, A.;Ammann, M.; Donaldson, D. J.; George, C. Proc. Natl. Acad. Sci. U. S.A. 2010, 107 (15), 6605−6609.(6) Arens, F.; Gutzwiller, L.; Baltensperger, U.; Gaggeler, H. W.;Ammann, M. Environ. Sci. Technol. 2001, 35, 2191−2199.(7) Kleffmann, J.; Becker, K. H.; Lackhoff, M.; Wiesen, P. Phys. Chem.Chem. Phys. 1999, 1, 5443−5450.(8) Zhang, D.; Zhang, R. Environ. Sci. Technol. 2005, 39, 5722−5728.(9) Lelievre, S.; Bedjanian, Y.; Pouvesle, N.; Delfau, J.; Vovelle, C.;Bras, G. L. Phys. Chem. Chem. Phys. 2004, 6, 1181−1191.(10) Stadler, D.; Rossi, M. J. Phys. Chem. Chem. Phys. 2000, 2, 5420−5429.(11) Munozy, M. S. S.; Rossi, M. J. Phys. Chem. Chem. Phys. 2002, 4,5110−5118.(12) Lelievre, S.; Bedjanian., Y.; Laverdet, G.; Bras, G. L. J. Phys.Chem. A 2004, 108, 10807−10817.(13) Daly, H. M.; Horn, A. B. Phys. Chem. Chem. Phys. 2009, 11,1069−1076.(14) Mccabe, J.; Abbatt, J. P. D. J. Phys. Chem. C 2009, 113, 2120−2127.(15) Dippel, B.; Jander, H.; Heintzenberg, J. Phys. Chem. Chem. Phys.1999, 1, 4707−4712.(16) Popovicheva, O. B.; Persiantseva, N. M. J. Phys. Chem. A 2003,107, 10046−10054.(17) Knauer, M.; Schuster, M. E.; Su, D.; Schlogl, R.; Niessner, R.;Ivleva, N. P. J. Phys. Chem. A 2009, 113, 13871−13880.(18) Muller, J. O.; Su, D. S.; Wild, U.; Schlogl, R. Phys. Chem. Chem.Phys. 2007, 9, 4018−4025.(19) Sadezky, A.; Muckenhuber, H.; Grothe, H.; Niessner, R.; Poschl,U. Carbon 2005, 43, 1731−1742.(20) Cain, J. P.; Gassman, P. L.; Wang, H.; Laskin, A. Phys. Chem.Chem. Phys. 2010, 12, 5206−5218.(21) Kirchner, U.; Scheer, V.; Vogt, R. J. Phys. Chem. A 2000, 104,8908−8915.(22) Ivleva, N.; Messerer, A.; Yang, X.; Niessner, R.; Poschl, U.Environ. Sci. Technol. 2007, 41, 3702−3707.(23) Liu, Y.; Liu, C.; Ma, J.; Ma, Q.; He, H. Phys. Chem. Chem. Phys.2010, 12, 10896−10903.(24) Persiantseva, N. M.; Popovicheva, O. B.; Shonija, N. K. J.Environ. Monit. 2004, 6, 939−945.(25) Popovitcheva, O. B.; Persiantseva, N. M.; Trukhin, M. E.; Rulev,G. B.; Shonija, N. K.; Buriko, Y. Y.; Starik, A. M.; Demirdjian, B.;Ferry, D.; Suzanne, J. Phys. Chem. Chem. Phys. 2000, 2, 4421−4426.(26) Alcala-Jornod, C.; Rossi, M. J. J. Phys. Chem. A 2004, 108,10667−10680.(27) Alcala-Jornod, C.; Bergh, H. V. D.; Rossi, M. J. Phys. Chem.Chem. Phys. 2000, 2, 5584−5593.(28) Jammoul, A.; Gligorovski, S.; George, C.; D’Anna, B. J. Phys.Chem. A 2008, 112, 1268−1276.
(29) Dubowski, Y.; Vieceli, J.; Tobias, D. J.; Gomez, A.; Lin, A.;Nizkorodov, S. A.; McIntire, T. M.; Finlayson-Pitts, B. J. J. Phys. Chem.A 2004, 108, 10473−10485.(30) Sumner, A. L.; Menke, E. J.; Dubowski, Y.; Newberg, J. T.;Penner, R. M.; Hemminger, J. C.; Wingen, L. M.; Brauers, T.;Finlayson-Pitts, B. J. Phys. Chem. Chem. Phys. 2004, 6, 604−613.(31) Nieto-Gligorovski, L.; Net, S.; Gligorovski, S.; Zetzsch, C.;Jammoul, A.; D′Anna, B.; George, C. Phys. Chem. Chem. Phys. 2008,10, 2964−2971.(32) Zelenay, V.; Monge, M. E.; D’Anna, B.; George, C.; Styler, S. A.;Huthwelker, T.; Ammann, M. J. Geophys. Res. 2011, 116, D11301.(33) Kwok, D. Y.; Neumann, A. W. Adv. Colloid Interface Sci. 1999,81, 167−249.(34) Slowik, J. G.; Cross, E. S.; Han, J. H.; Kolucki, J.; Davidovits, P.;Williams, L. R.; Onasch, T. B.; Jayne, J. T.; Kolb, C. E.; Worsnop, D. R.Aerosol Sci. Technol. 2007, 41, 734−750.(35) Slowik, J. G.; Stainken, K.; Davidovits, P.; Williams, L. R.; Jayne,J. T.; Kolb, C. E.; Worsnop, D. R.; Rudich, Y.; DeCarlo, P. F.; Jimenez,J. L. Aerosol Sci. Technol. 2004, 38, 1206−1222.(36) Escribano, R.; Sloan, J. J.; Siddique, N.; Sze, N.; Dudev, T. Vib.Spectrosc. 2001, 26, 179−186.(37) Knight, D. S.; White, W. B. J. Mater. Res. 1989, 4 (2), 385−393.(38) Schwan, J.; Ulrich, S.; Batori, V.; Ehrhardt, H. J. Appl. Phys.1996, 80 (1), 440−447.(39) Shroder, R. E.; Nemanich, R. J. Phys. Rev. 1990, 41, 3738−3745.(40) Akhter, M. S.; Chughtai, A. R.; Smith, D. M. Appl. Spectrosc.1985, 39, 143−153.(41) Smith, D. M.; Chughtai, A. R. Colloids Surf. 1995, 105, 47−77.(42) Smith, D. M.; Akhter, M. S.; Jassim, J. A.; Sergides, C. A.; Welch,W. F.; Chughtai, A. R. Aerosol Sci. Technol. 1989, 10, 311−325.(43) Frenklach, M. Phys. Chem. Chem. Phys. 2002, 4, 2028−2037.(44) Mansurov, Z. A. Combust., Explos. Shock Waves 2005, 41 (6),727−744.(45) Frenklach, M.; Warnatz, J. Combust. Sci. Technol. 1987, 51, 265−283.(46) Frenklach, M.; Clary, D. W.; Yuan, T. Combust. Sci. Technol.1986, 50, 79−115.
The Journal of Physical Chemistry A Article
dx.doi.org/10.1021/jp301041w | J. Phys. Chem. A 2012, 116, 4129−41364136