Embed Size (px)
Citation preview
Intrusion Detection by Combining and Clustering
Diverse Monitor DataTSS/ACC Seminar
April 05, 2016
Atul Bohara and Uttam Thakore
PI: Bill Sanders
1

Outline
• Motivation
• Overview of the approach
• Feature extraction and selection
• Clustering
• Intrusion detection
• Results
• Future directions
2
Motivation
• Monitoring in enterprise systems is extremely diverse and verbose
3
Motivation
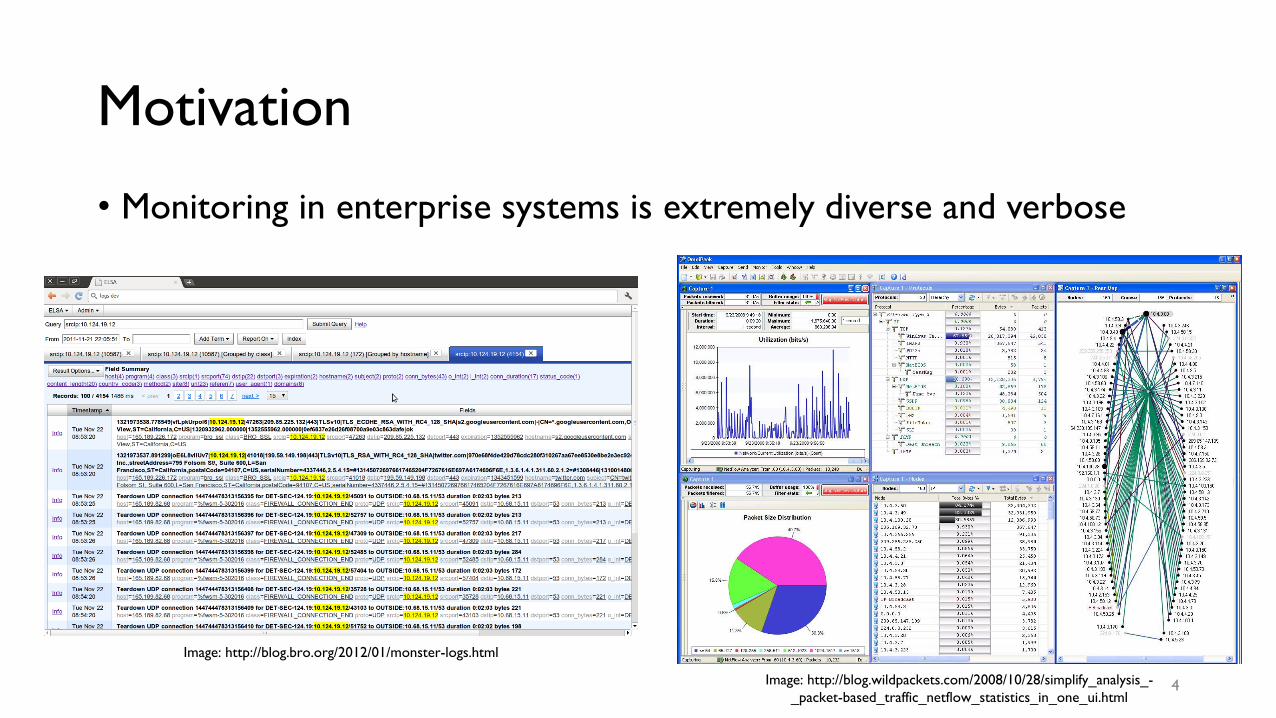
• Monitoring in enterprise systems is extremely diverse and verbose
Image: http://blog.bro.org/2012/01/monster-logs.html
Image: http://blog.wildpackets.com/2008/10/28/simplify_analysis_-
_packet-based_traffic_netflow_statistics_in_one_ui.html4
Motivation
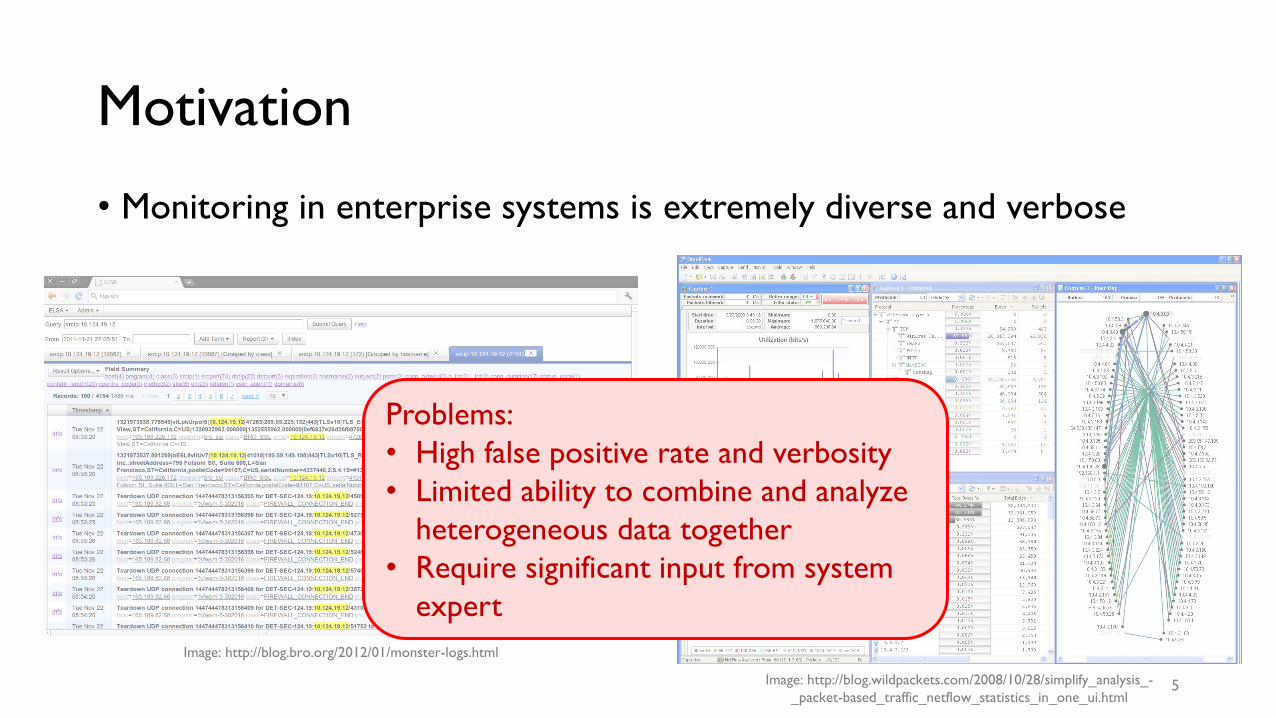
• Monitoring in enterprise systems is extremely diverse and verbose
Image: http://blog.bro.org/2012/01/monster-logs.html
Image: http://blog.wildpackets.com/2008/10/28/simplify_analysis_-
_packet-based_traffic_netflow_statistics_in_one_ui.html
Problems:
• High false positive rate and verbosity
• Limited ability to combine and analyze
heterogeneous data together
• Require significant input from system
expert
5

Our Contributions
• We fuse data from the host-level and network-level context to perform anomaly detection
• We use unsupervised clustering to identify usage behavior patterns in the data and detect anomalous behavior
• We find attacks that are undetectable with individual monitors alone
6

Overview of Approach
System Logs
Firewall Logs
Feature
Extraction
Feature
Selection &
Fusion
Cluster
Analysis
Intrusion
Detection
Data
Sources
7

Data Sources
System Logs
Firewall Logs
8
Dataset Description
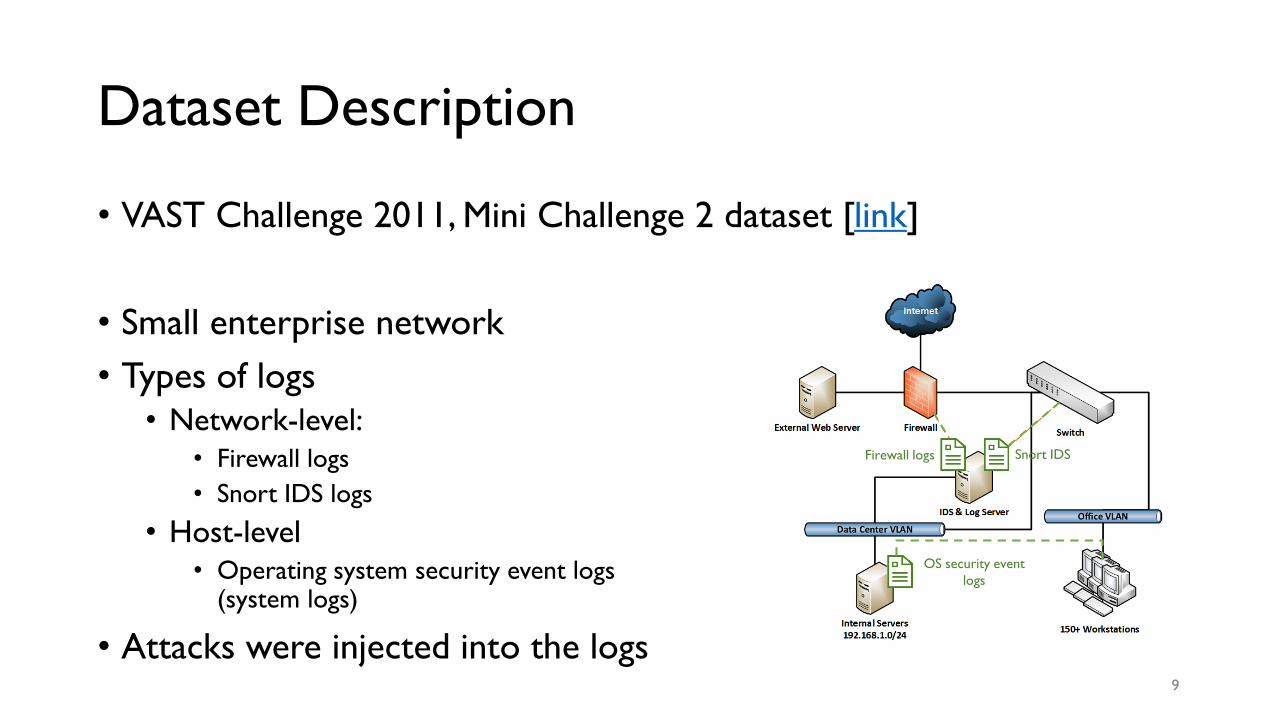
• VAST Challenge 2011, Mini Challenge 2 dataset [link]
• Small enterprise network
• Types of logs• Network-level:
• Firewall logs
• Snort IDS logs
• Host-level• Operating system security event logs
(system logs)
• Attacks were injected into the logs
Snort IDSFirewall logs
OS security event
logs
9

Threat Model
Network flooding attacks• Distributed Denial of Service
(DDoS) from Internet
• Port scan from external host
• Port scan from workstations
Behavior-changing malware• Worm installed on workstations
10
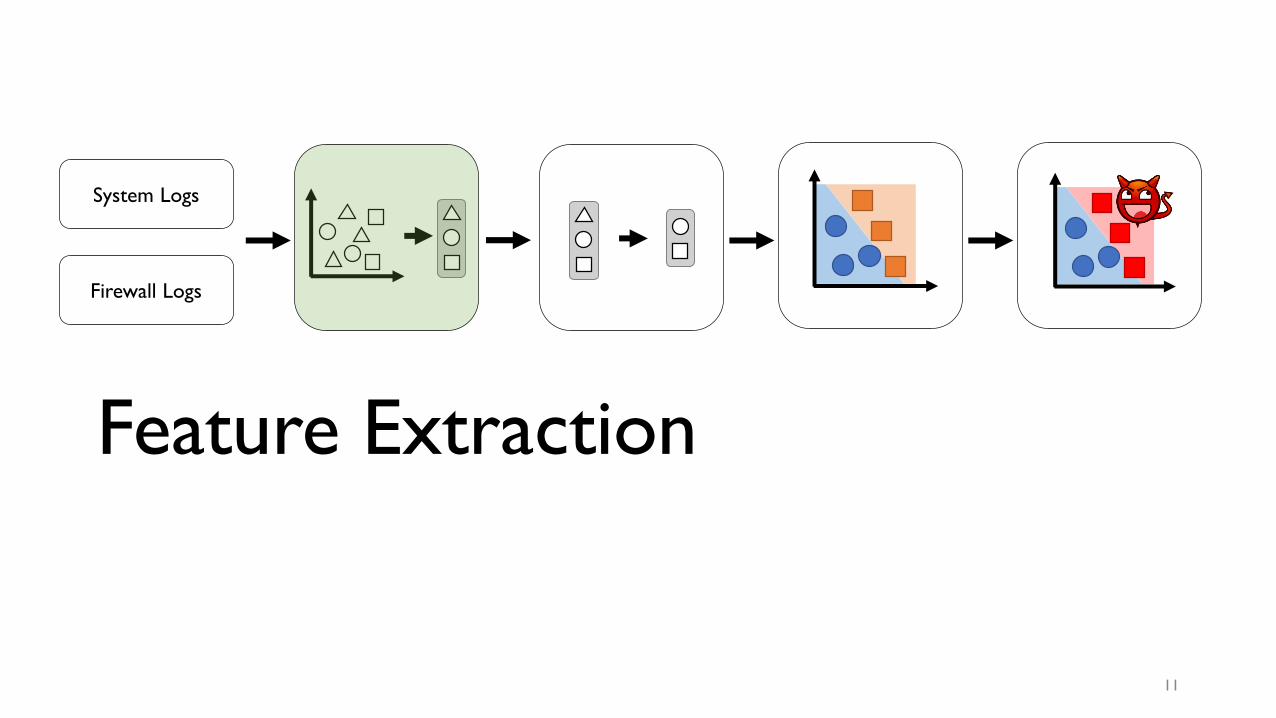
Feature Extraction
System Logs
Firewall Logs
11

Feature Extraction
Four types of features:• Identification – IP address and timestamp
• Network traffic-based – source/destination IP addresses and ports, TCP connections
• Service-based – connections to different types of servers, e.g., DNS, database, web
• Authentication-based – significant authentication events from system logs
Aggregated into one-minute time intervals
12

Features Extracted
Example System Log Features Example Firewall Log Features
13
Features in orange are identification features.
• IP address
• Timestamp
• # failed logon events from this host (4625)
• # special privileges assignment to new logon (4672)
• # target domain name = NT AUTHORITY
• # remote interactive logons (logon type = 10)
• # NTLM authentications/logons
• # distinct subject logon IDs
• IP address
• Timestamp
• # of unique destination IPs
• # of unique source ports
• # of connections built
• # of accesses to DNS server IPs
• # of accesses to database IPs

Feature Selection & Fusion
System Logs
Firewall Logs
14
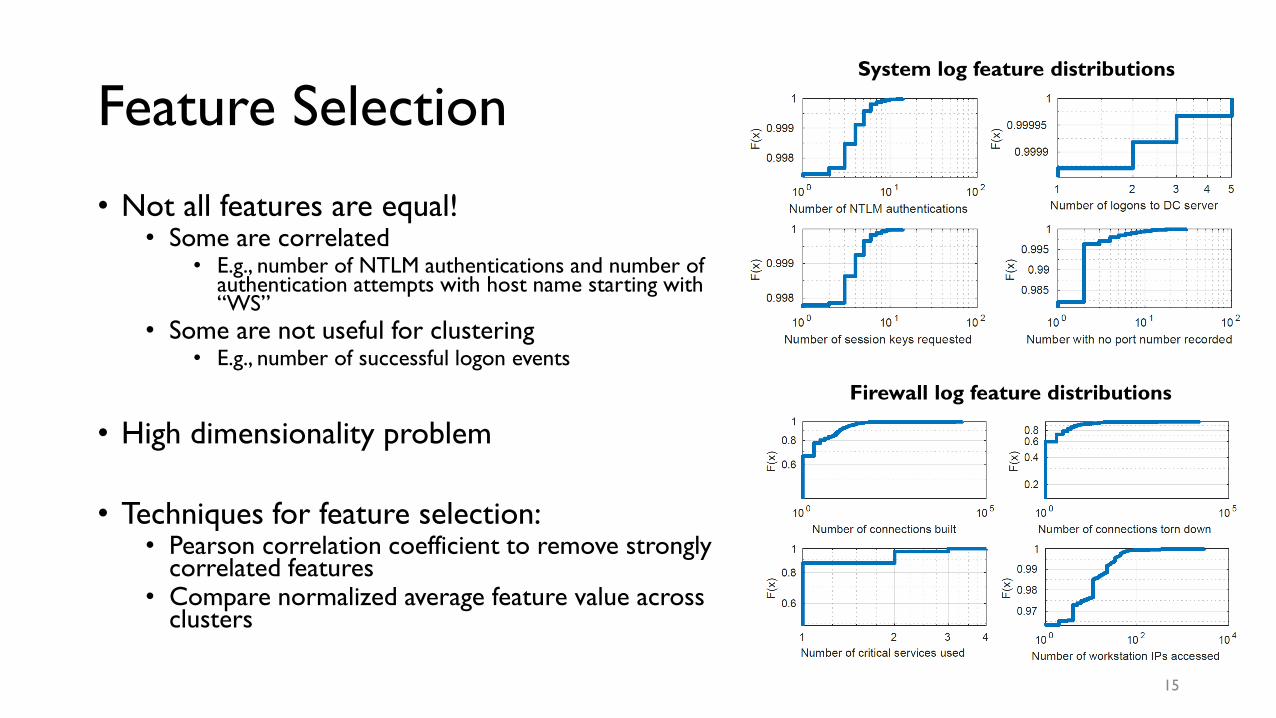
Feature Selection
• Not all features are equal!• Some are correlated
• E.g., number of NTLM authentications and number of authentication attempts with host name starting with “WS”
• Some are not useful for clustering• E.g., number of successful logon events
• High dimensionality problem
• Techniques for feature selection:• Pearson correlation coefficient to remove strongly
correlated features• Compare normalized average feature value across
clusters
System log feature distributions
Firewall log feature distributions
15
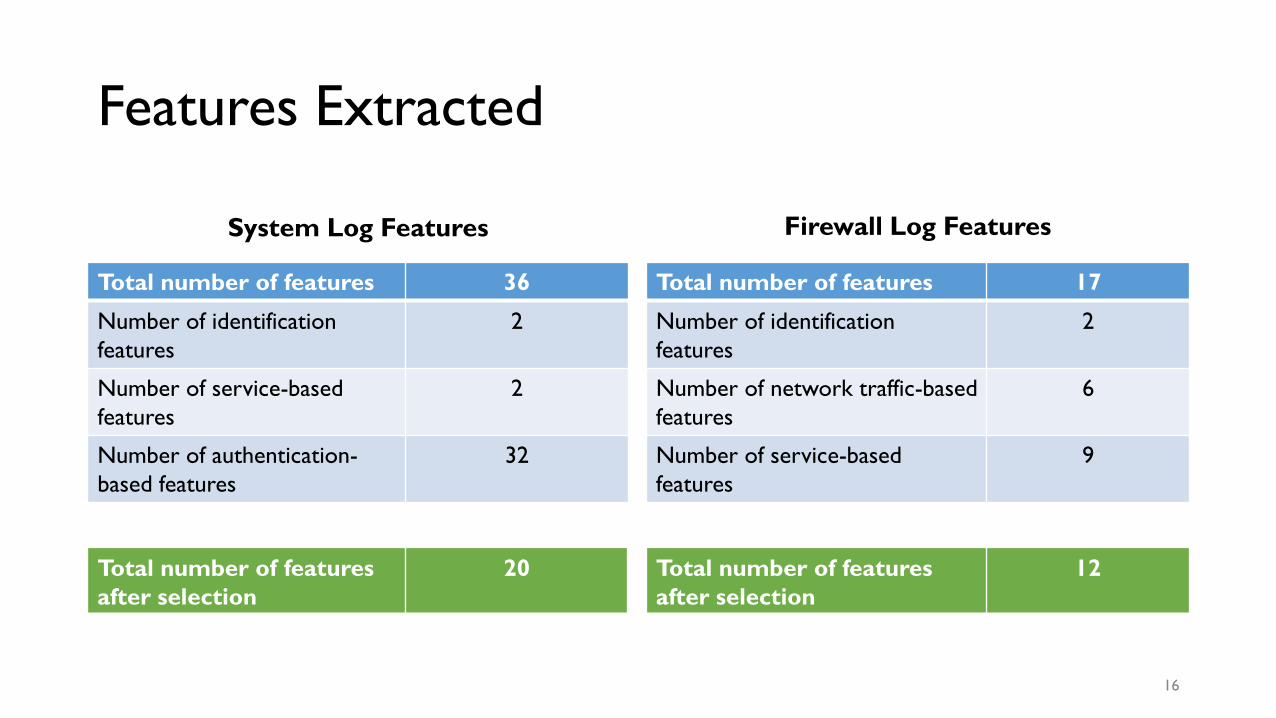
Features Extracted
System Log Features
Total number of features 36
Number of identification
features
2
Number of service-based
features
2
Number of authentication-
based features
32
Firewall Log Features
16
Total number of features 17
Number of identification
features
2
Number of network traffic-based
features
6
Number of service-based
features
9
Total number of features
after selection
20 Total number of features
after selection
12
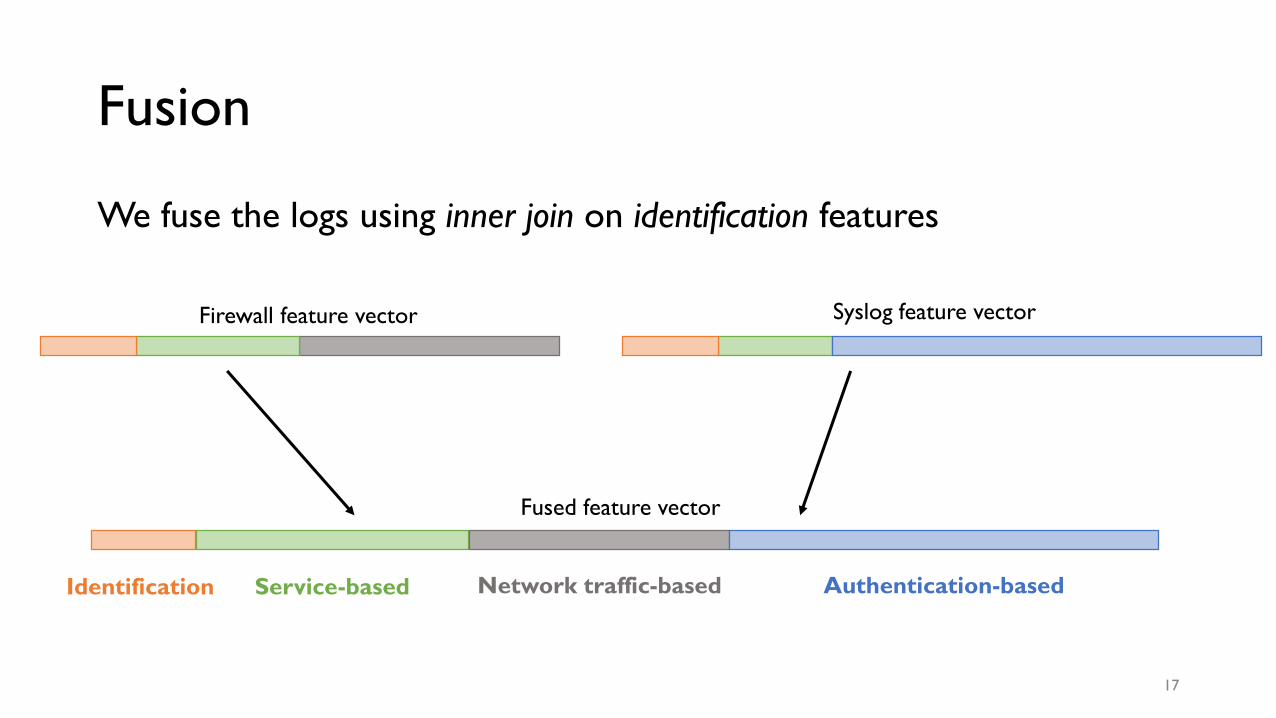
Fusion
We fuse the logs using inner join on identification features
Identification Network traffic-basedService-based Authentication-based
Fused feature vector
Syslog feature vectorFirewall feature vector
17

Cluster Analysis
System Logs
Firewall Logs
18

Clustering Techniques
• Apply k-means and DBSCAN clustering algorithms
19
Algorithm Type Cluster shape Noise
handling
Parameter
selection
k-means Centroid based Spherical
clusters
No WCSD,
Silhouettes
DBSCAN Density based Arbitrary
shaped clusters
Yes k-dist graph

Cluster Analysis
20
0
0.2
1.5
0.4
0.6
PC
3
0.8
1
PC2
0.80.5 0.6
PC1
0.40.2
0 0
Outliers : 80
Cluster1 : 14876
Cluster2 : 11825
Cluster3 : 810
Cluster4 : 3009
Cluster5 : 20
Cluster6 : 53
Cluster7 : 84
DBSCAN Clustering on Firewall Logs

Cluster Analysis
0
0.2
1.5
0.4
0.6
PC
3
0.8
1
PC2
0.80.5 0.6
PC1
0.40.2
0 0
Outliers : 80
Cluster1 : 14876
Cluster2 : 11825
Cluster3 : 810
Cluster4 : 3009
Cluster5 : 20
Cluster6 : 53
Cluster7 : 84
DBSCAN Clustering on Firewall Logs Normalized Average Feature Values
1 2 3 4 5 6 7 8 9 10
Features
0
0.2
0.4
0.6
0.8
1
No
rma
lize
d a
ve
rag
e v
alu
e
Cluster 1
1 2 3 4 5 6 7 8 9 10
Features
0
0.2
0.4
0.6
0.8
1
No
rma
lize
d a
ve
rag
e v
alu
e
Cluster 2
1 2 3 4 5 6 7 8 9 10
Features
0
0.2
0.4
0.6
0.8
1
No
rma
lize
d a
ve
rag
e v
alu
e
Cluster 6
1 2 3 4 5 6 7 8 9 10
Features
0
0.2
0.4
0.6
0.8
1
No
rma
lize
d a
ve
rag
e v
alu
e
Cluster 7
Cluster Analysis
22
0
0.2
0.8
0.4
0.5
0.6
PC
3
0.6
PC1PC2
0.8
0.4 00.2
0 -0.5
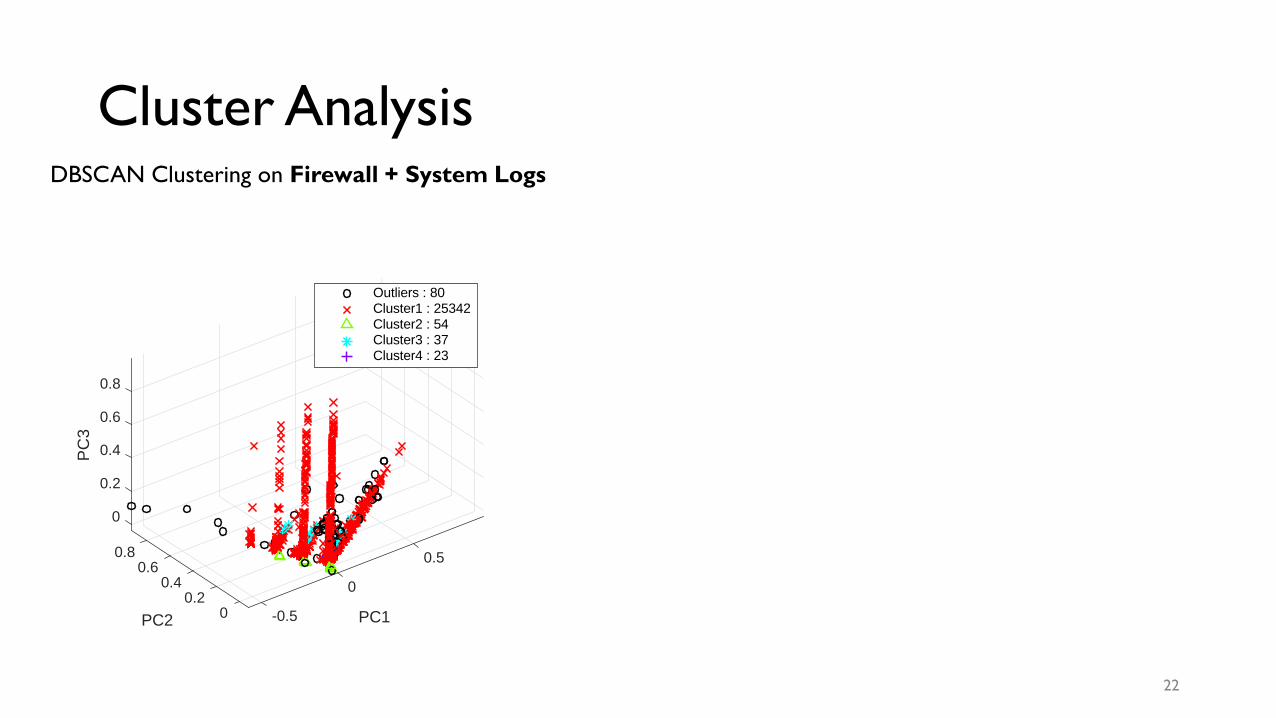
Outliers : 80Cluster1 : 25342Cluster2 : 54Cluster3 : 37Cluster4 : 23
DBSCAN Clustering on Firewall + System Logs

Cluster Analysis
0
0.2
0.8
0.4
0.5
0.6
PC
3
0.6
PC1PC2
0.8
0.4 00.2
0 -0.5
Outliers : 80Cluster1 : 25342Cluster2 : 54Cluster3 : 37Cluster4 : 23
DBSCAN Clustering on Firewall + System Logs Normalized Average Feature Values
1 3 5 7 9 11 13 15 17 19 21 23 25 27
Features
0
0.2
0.4
0.6
0.8
1
No
rma
lize
d a
vera
ge
va
lue
Cluster 1
1 3 5 7 9 11 13 15 17 19 21 23 25 27
Features
0
0.2
0.4
0.6
0.8
1
No
rma
lize
d a
vera
ge
va
lue
Cluster 2
1 3 5 7 9 11 13 15 17 19 21 23 25 27
Features
0
0.2
0.4
0.6
0.8
1
No
rma
lize
d a
vera
ge
valu
e
Cluster 3
1 3 5 7 9 11 13 15 17 19 21 23 25 27
Features
0
0.2
0.4
0.6
0.8
1
No
rma
lize
d a
vera
ge
valu
e
Cluster 4

Intrusion Detection
System Logs
Firewall Logs
24
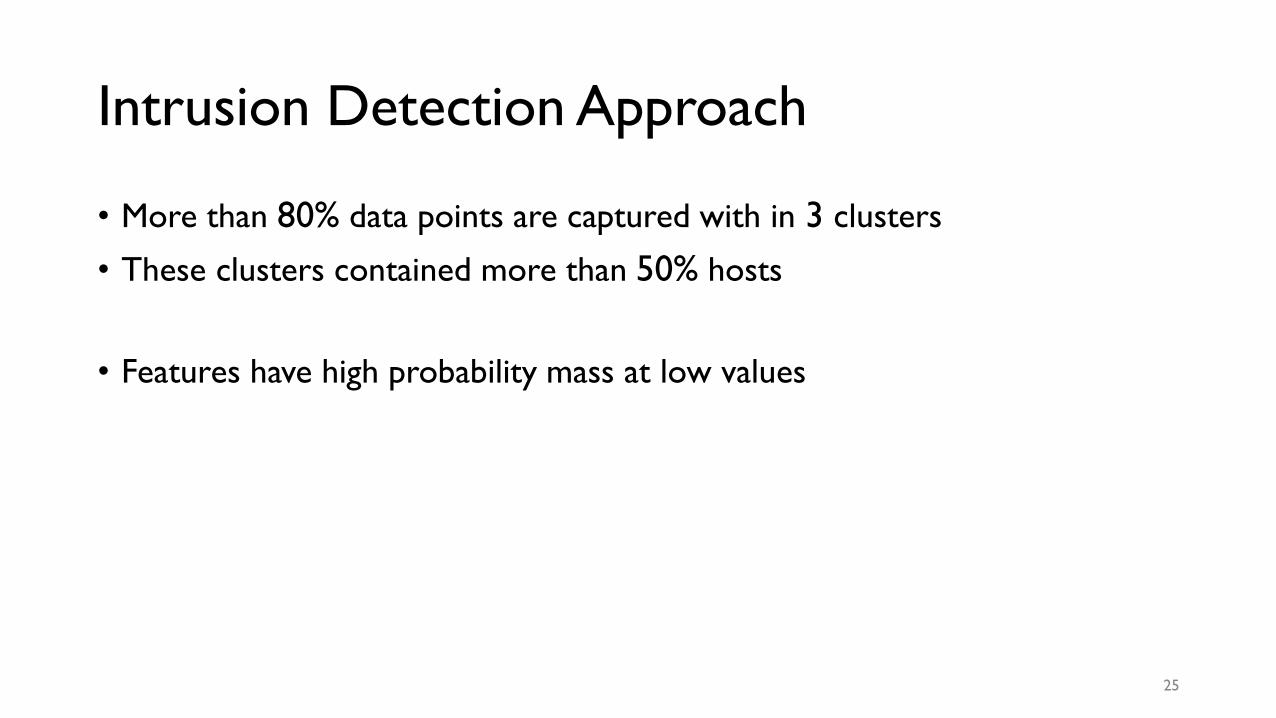
Intrusion Detection Approach
• More than 80% data points are captured with in 3 clusters
• These clusters contained more than 50% hosts
• Features have high probability mass at low values
25
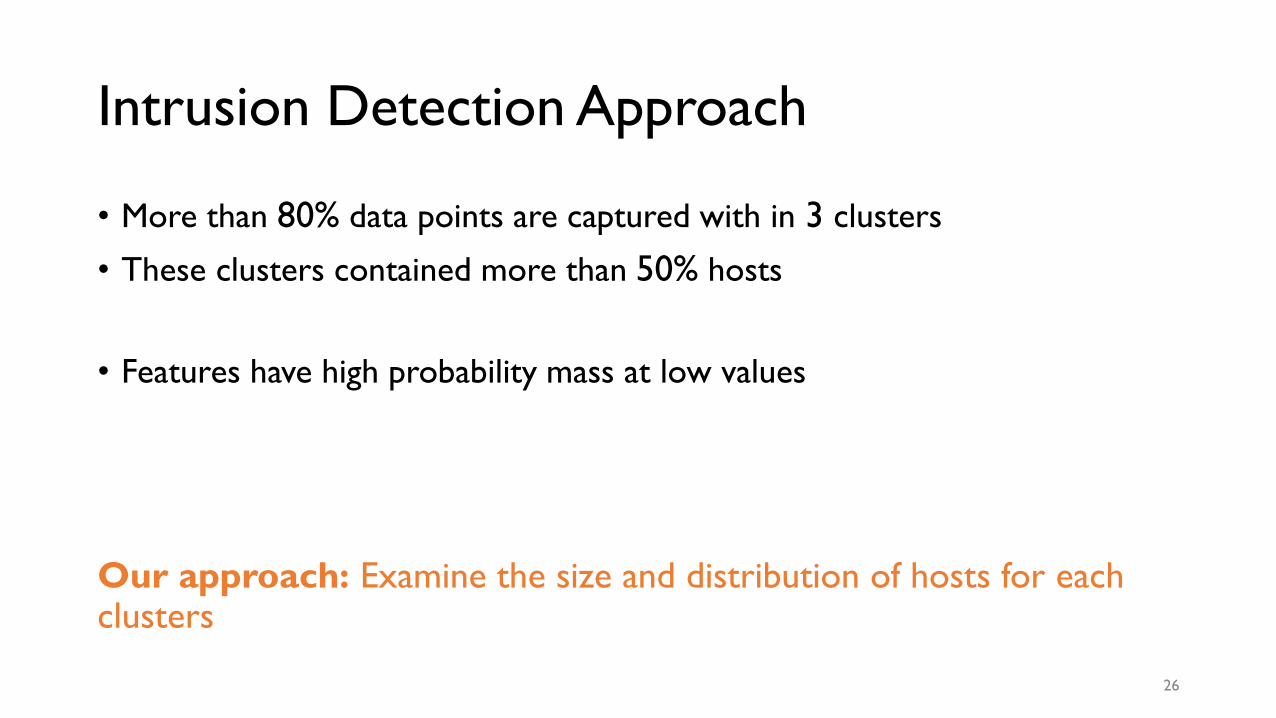
Intrusion Detection Approach
• More than 80% data points are captured with in 3 clusters
• These clusters contained more than 50% hosts
• Features have high probability mass at low values
Our approach: Examine the size and distribution of hosts for each clusters
26

Intrusion Detection Approach (contd.)
27
Clusters

Intrusion Detection Approach (contd.)
28
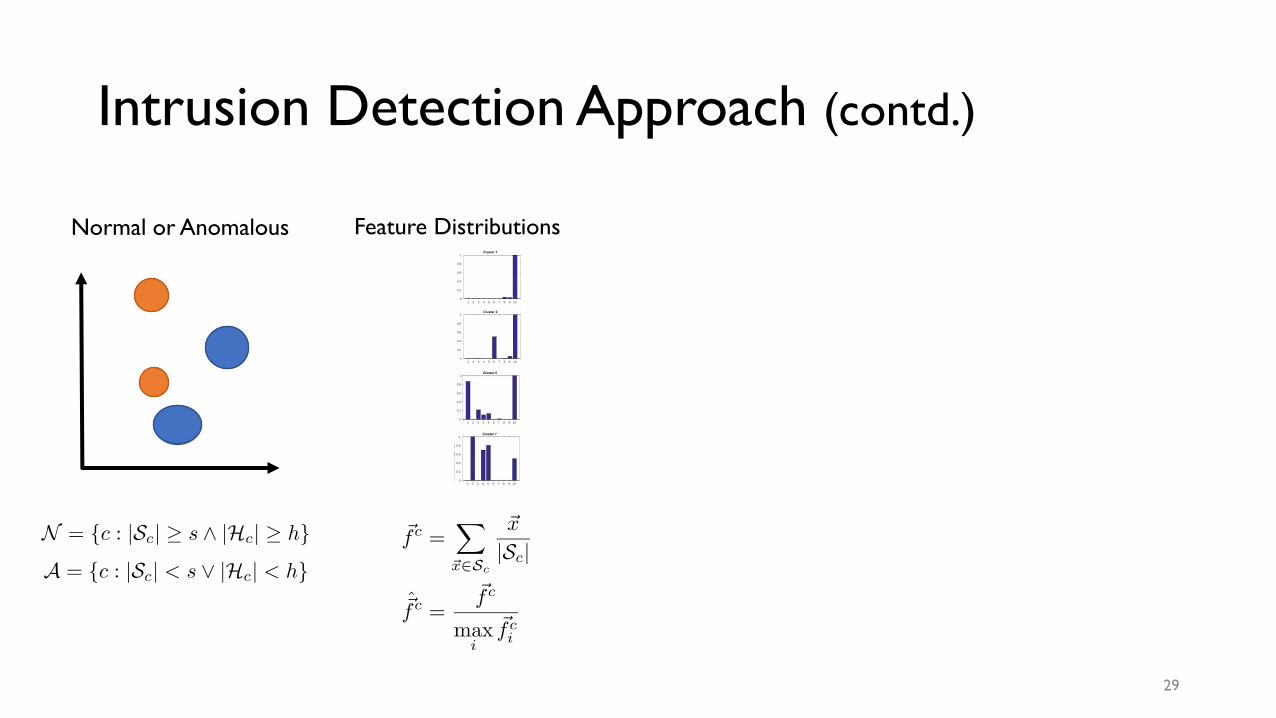
Normal or Anomalous
Intrusion Detection Approach (contd.)
29
Normal or Anomalous Feature Distributions
1 2 3 4 5 6 7 8 9 10
Features
0
0.2
0.4
0.6
0.8
1
No
rma
lize
d a
ve
rag
e v
alu
e
Cluster 1
1 2 3 4 5 6 7 8 9 10
Features
0
0.2
0.4
0.6
0.8
1
No
rma
lize
d a
ve
rag
e v
alu
e
Cluster 2
1 2 3 4 5 6 7 8 9 10
Features
0
0.2
0.4
0.6
0.8
1
No
rma
lized
ave
rag
e v
alu
e
Cluster 6
1 2 3 4 5 6 7 8 9 10
Features
0
0.2
0.4
0.6
0.8
1
No
rma
lized
ave
rag
e v
alu
e
Cluster 7
1 2 3 4 5 6 7 8 9 10
Features
0
0.2
0.4
0.6
0.8
1
No
rma
lize
d a
ve
rag
e v
alu
e
Cluster 1
1 2 3 4 5 6 7 8 9 10
Features
0
0.2
0.4
0.6
0.8
1
No
rma
lize
d a
ve
rag
e v
alu
e
Cluster 2
1 2 3 4 5 6 7 8 9 10
Features
0
0.2
0.4
0.6
0.8
1N
orm
aliz
ed a
ve
rag
e v
alu
e
Cluster 6
1 2 3 4 5 6 7 8 9 10
Features
0
0.2
0.4
0.6
0.8
1
No
rma
lize
d a
ve
rag
e v
alu
e
Cluster 7
1 2 3 4 5 6 7 8 9 10
Features
0
0.2
0.4
0.6
0.8
1
No
rma
lize
d a
ve
rag
e v
alu
e
Cluster 1
1 2 3 4 5 6 7 8 9 10
Features
0
0.2
0.4
0.6
0.8
1
No
rma
lize
d a
ve
rag
e v
alu
e
Cluster 2
1 2 3 4 5 6 7 8 9 10
Features
0
0.2
0.4
0.6
0.8
1
No
rma
lize
d a
ve
rag
e v
alu
e
Cluster 6
1 2 3 4 5 6 7 8 9 10
Features
0
0.2
0.4
0.6
0.8
1
No
rma
lize
d a
ve
rag
e v
alu
e
Cluster 7
1 2 3 4 5 6 7 8 9 10
Features
0
0.2
0.4
0.6
0.8
1N
orm
aliz
ed
ave
rag
e v
alu
e
Cluster 1
1 2 3 4 5 6 7 8 9 10
Features
0
0.2
0.4
0.6
0.8
1
Norm
aliz
ed
ave
rag
e v
alu
e
Cluster 2
1 2 3 4 5 6 7 8 9 10
Features
0
0.2
0.4
0.6
0.8
1
No
rma
lize
d a
ve
rag
e v
alu
e
Cluster 6
1 2 3 4 5 6 7 8 9 10
Features
0
0.2
0.4
0.6
0.8
1
No
rma
lize
d a
ve
rag
e v
alu
e
Cluster 7

Intrusion Detection Approach (contd.)
30
Normal or Anomalous Feature Distributions Distances
1 2 3 4 5 6 7 8 9 10
Features
0
0.2
0.4
0.6
0.8
1
No
rma
lize
d a
ve
rag
e v
alu
e
Cluster 1
1 2 3 4 5 6 7 8 9 10
Features
0
0.2
0.4
0.6
0.8
1
No
rma
lize
d a
ve
rag
e v
alu
e
Cluster 2
1 2 3 4 5 6 7 8 9 10
Features
0
0.2
0.4
0.6
0.8
1
No
rma
lized
ave
rag
e v
alu
e
Cluster 6
1 2 3 4 5 6 7 8 9 10
Features
0
0.2
0.4
0.6
0.8
1
No
rma
lized
ave
rag
e v
alu
e
Cluster 7
1 2 3 4 5 6 7 8 9 10
Features
0
0.2
0.4
0.6
0.8
1
No
rma
lize
d a
ve
rag
e v
alu
e
Cluster 1
1 2 3 4 5 6 7 8 9 10
Features
0
0.2
0.4
0.6
0.8
1
No
rma
lize
d a
ve
rag
e v
alu
e
Cluster 2
1 2 3 4 5 6 7 8 9 10
Features
0
0.2
0.4
0.6
0.8
1N
orm
aliz
ed a
ve
rag
e v
alu
e
Cluster 6
1 2 3 4 5 6 7 8 9 10
Features
0
0.2
0.4
0.6
0.8
1
No
rma
lize
d a
ve
rag
e v
alu
e
Cluster 7
1 2 3 4 5 6 7 8 9 10
Features
0
0.2
0.4
0.6
0.8
1
No
rma
lize
d a
ve
rag
e v
alu
e
Cluster 1
1 2 3 4 5 6 7 8 9 10
Features
0
0.2
0.4
0.6
0.8
1
No
rma
lize
d a
ve
rag
e v
alu
e
Cluster 2
1 2 3 4 5 6 7 8 9 10
Features
0
0.2
0.4
0.6
0.8
1
No
rma
lize
d a
ve
rag
e v
alu
e
Cluster 6
1 2 3 4 5 6 7 8 9 10
Features
0
0.2
0.4
0.6
0.8
1
No
rma
lize
d a
ve
rag
e v
alu
e
Cluster 7
1 2 3 4 5 6 7 8 9 10
Features
0
0.2
0.4
0.6
0.8
1N
orm
aliz
ed
ave
rag
e v
alu
e
Cluster 1
1 2 3 4 5 6 7 8 9 10
Features
0
0.2
0.4
0.6
0.8
1
Norm
aliz
ed
ave
rag
e v
alu
e
Cluster 2
1 2 3 4 5 6 7 8 9 10
Features
0
0.2
0.4
0.6
0.8
1
No
rma
lize
d a
ve
rag
e v
alu
e
Cluster 6
1 2 3 4 5 6 7 8 9 10
Features
0
0.2
0.4
0.6
0.8
1
No
rma
lize
d a
ve
rag
e v
alu
e
Cluster 7

Intrusion Detection Approach (contd.)
31
1 2 3 4 5 6 7 8 9 10
Features
0
0.2
0.4
0.6
0.8
1
No
rma
lize
d a
ve
rag
e v
alu
e
Cluster 1
1 2 3 4 5 6 7 8 9 10
Features
0
0.2
0.4
0.6
0.8
1
No
rma
lize
d a
ve
rag
e v
alu
e
Cluster 2
1 2 3 4 5 6 7 8 9 10
Features
0
0.2
0.4
0.6
0.8
1
No
rma
lized
ave
rag
e v
alu
e
Cluster 6
1 2 3 4 5 6 7 8 9 10
Features
0
0.2
0.4
0.6
0.8
1
No
rma
lized
ave
rag
e v
alu
e
Cluster 7
Normal or Anomalous Feature Distributions Distances Normalcy
1 2 3 4 5 6 7 8 9 10
Features
0
0.2
0.4
0.6
0.8
1
No
rma
lize
d a
ve
rag
e v
alu
e
Cluster 1
1 2 3 4 5 6 7 8 9 10
Features
0
0.2
0.4
0.6
0.8
1
No
rma
lize
d a
ve
rag
e v
alu
e
Cluster 2
1 2 3 4 5 6 7 8 9 10
Features
0
0.2
0.4
0.6
0.8
1N
orm
aliz
ed a
ve
rag
e v
alu
e
Cluster 6
1 2 3 4 5 6 7 8 9 10
Features
0
0.2
0.4
0.6
0.8
1
No
rma
lize
d a
ve
rag
e v
alu
e
Cluster 7
1 2 3 4 5 6 7 8 9 10
Features
0
0.2
0.4
0.6
0.8
1
No
rma
lize
d a
ve
rag
e v
alu
e
Cluster 1
1 2 3 4 5 6 7 8 9 10
Features
0
0.2
0.4
0.6
0.8
1
No
rma
lize
d a
ve
rag
e v
alu
e
Cluster 2
1 2 3 4 5 6 7 8 9 10
Features
0
0.2
0.4
0.6
0.8
1
No
rma
lize
d a
ve
rag
e v
alu
e
Cluster 6
1 2 3 4 5 6 7 8 9 10
Features
0
0.2
0.4
0.6
0.8
1
No
rma
lize
d a
ve
rag
e v
alu
e
Cluster 7
1 2 3 4 5 6 7 8 9 10
Features
0
0.2
0.4
0.6
0.8
1N
orm
aliz
ed
ave
rag
e v
alu
e
Cluster 1
1 2 3 4 5 6 7 8 9 10
Features
0
0.2
0.4
0.6
0.8
1
Norm
aliz
ed
ave
rag
e v
alu
e
Cluster 2
1 2 3 4 5 6 7 8 9 10
Features
0
0.2
0.4
0.6
0.8
1
No
rma
lize
d a
ve
rag
e v
alu
e
Cluster 6
1 2 3 4 5 6 7 8 9 10
Features
0
0.2
0.4
0.6
0.8
1
No
rma
lize
d a
ve
rag
e v
alu
e
Cluster 7
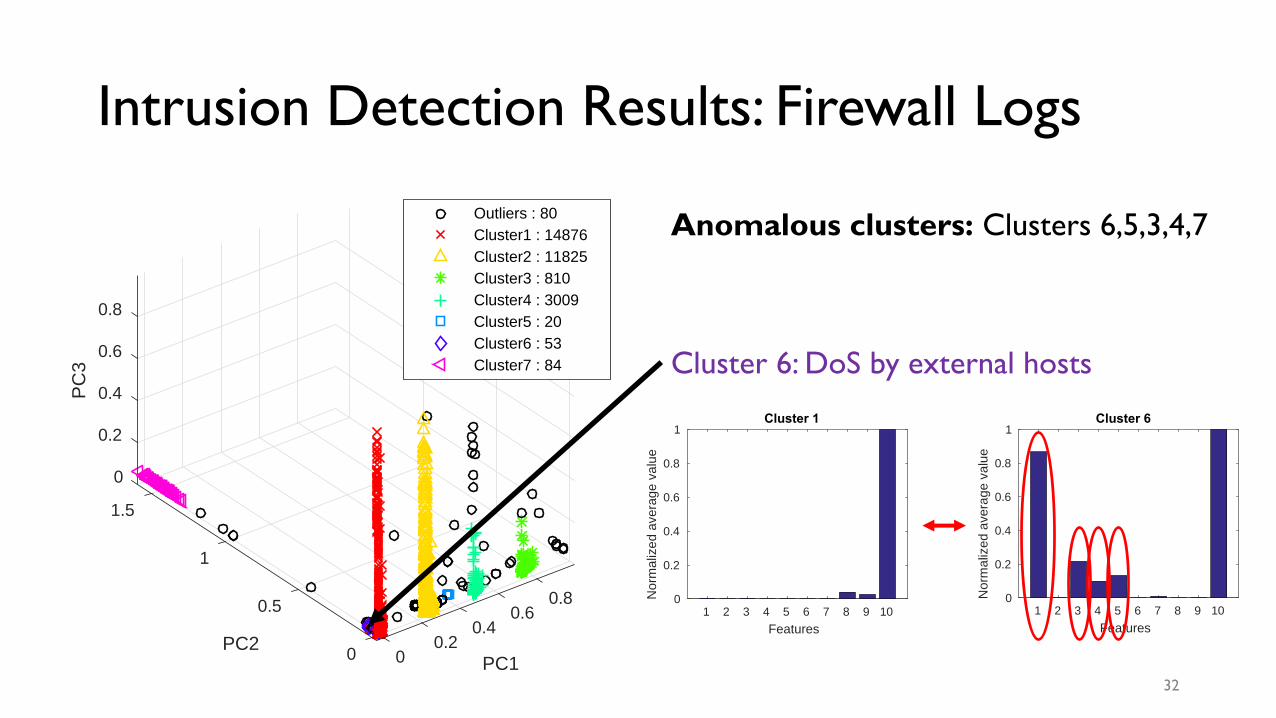
Intrusion Detection Results: Firewall Logs
0
0.2
1.5
0.4
0.6
PC
3
0.8
1
PC2
0.80.5 0.6
PC1
0.40.2
0 0
Outliers : 80
Cluster1 : 14876
Cluster2 : 11825
Cluster3 : 810
Cluster4 : 3009
Cluster5 : 20
Cluster6 : 53
Cluster7 : 84 Cluster 6: DoS by external hosts
Anomalous clusters: Clusters 6,5,3,4,7
32
1 2 3 4 5 6 7 8 9 10
Features
0
0.2
0.4
0.6
0.8
1
No
rma
lize
d a
ve
rag
e v
alu
e
Cluster 1
1 2 3 4 5 6 7 8 9 10
Features
0
0.2
0.4
0.6
0.8
1
No
rma
lize
d a
ve
rag
e v
alu
e
Cluster 2
1 2 3 4 5 6 7 8 9 10
Features
0
0.2
0.4
0.6
0.8
1
No
rma
lize
d a
ve
rag
e v
alu
e
Cluster 6
1 2 3 4 5 6 7 8 9 10
Features
0
0.2
0.4
0.6
0.8
1
No
rma
lize
d a
ve
rag
e v
alu
e
Cluster 7
1 2 3 4 5 6 7 8 9 10
Features
0
0.2
0.4
0.6
0.8
1
No
rma
lize
d a
ve
rag
e v
alu
e
Cluster 1
1 2 3 4 5 6 7 8 9 10
Features
0
0.2
0.4
0.6
0.8
1
No
rma
lize
d a
ve
rag
e v
alu
e
Cluster 2
1 2 3 4 5 6 7 8 9 10
Features
0
0.2
0.4
0.6
0.8
1N
orm
aliz
ed
ave
rag
e v
alu
eCluster 6
1 2 3 4 5 6 7 8 9 10
Features
0
0.2
0.4
0.6
0.8
1
No
rma
lize
d a
ve
rag
e v
alu
e
Cluster 7

Intrusion Detection Results: Firewall Logs
0
0.2
1.5
0.4
0.6
PC
3
0.8
1
PC2
0.80.5 0.6
PC1
0.40.2
0 0
Outliers : 80
Cluster1 : 14876
Cluster2 : 11825
Cluster3 : 810
Cluster4 : 3009
Cluster5 : 20
Cluster6 : 53
Cluster7 : 84
Cluster 5: Port scan by internal hosts
Cluster 6: DoS by external hosts
Cluster 3, 4, 7: Anomalous but not malicious
Anomalous clusters: Clusters 6,5,3,4,7
33

Intrusion Detection Results: Firewall + System Logs
0
0.2
0.8
0.4
0.5
0.6
PC
3
0.6
PC1PC2
0.8
0.4 00.2
0 -0.5
Outliers : 80Cluster1 : 25342Cluster2 : 54Cluster3 : 37Cluster4 : 23
Cluster 2: Worm infected host
Anomalous clusters: Clusters 2,4,3
34
1 3 5 7 9 11 13 15 17 19 21 23 25 27
Features
0
0.2
0.4
0.6
0.8
1
No
rma
lize
d a
vera
ge
va
lue
Cluster 1
1 3 5 7 9 11 13 15 17 19 21 23 25 27
Features
0
0.2
0.4
0.6
0.8
1
No
rma
lize
d a
vera
ge
va
lue
Cluster 2
1 3 5 7 9 11 13 15 17 19 21 23 25 27
Features
0
0.2
0.4
0.6
0.8
1N
orm
aliz
ed
avera
ge
valu
e
Cluster 3
1 3 5 7 9 11 13 15 17 19 21 23 25 27
Features
0
0.2
0.4
0.6
0.8
1
No
rma
lize
d a
vera
ge
valu
e
Cluster 4
1 3 5 7 9 11 13 15 17 19 21 23 25 27
Features
0
0.2
0.4
0.6
0.8
1
No
rma
lize
d a
vera
ge
va
lue
Cluster 1
1 3 5 7 9 11 13 15 17 19 21 23 25 27
Features
0
0.2
0.4
0.6
0.8
1
No
rma
lize
d a
vera
ge
va
lue
Cluster 2
1 3 5 7 9 11 13 15 17 19 21 23 25 27
Features
0
0.2
0.4
0.6
0.8
1
No
rma
lize
d a
vera
ge
valu
e
Cluster 3
1 3 5 7 9 11 13 15 17 19 21 23 25 27
Features
0
0.2
0.4
0.6
0.8
1
No
rma
lize
d a
vera
ge
valu
e
Cluster 4
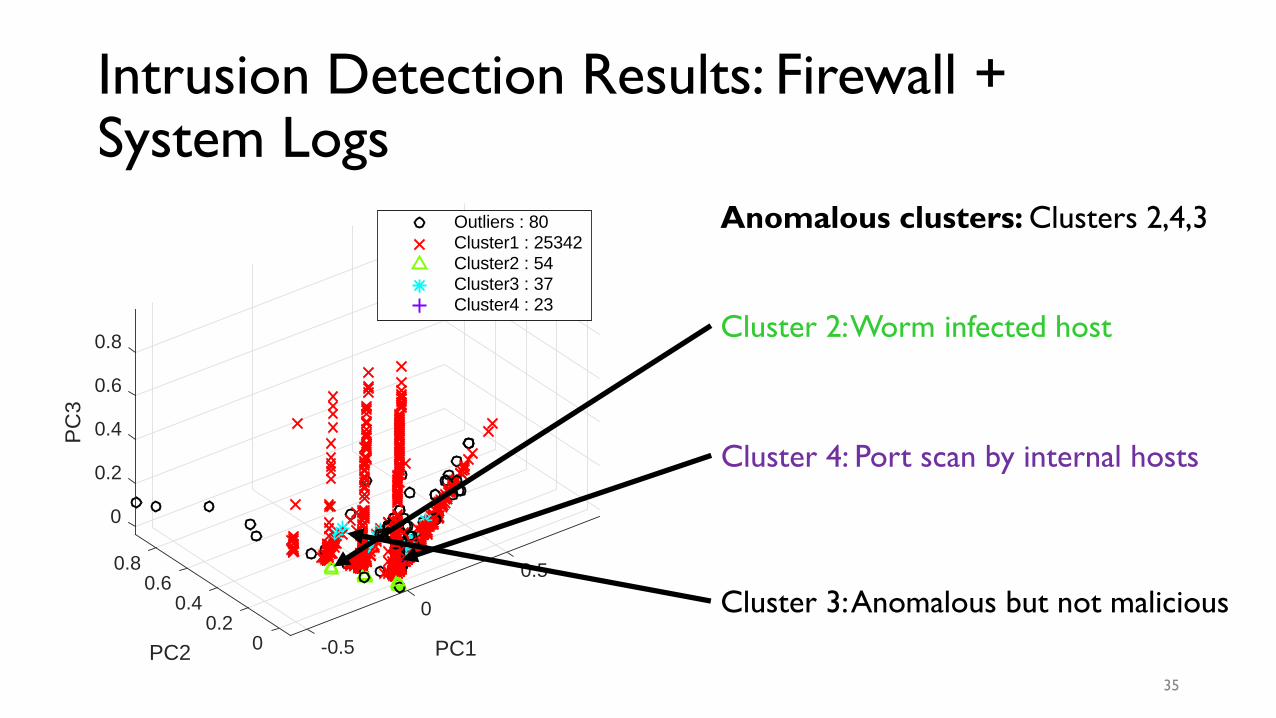
Intrusion Detection Results: Firewall + System Logs
0
0.2
0.8
0.4
0.5
0.6
PC
3
0.6
PC1PC2
0.8
0.4 00.2
0 -0.5
Outliers : 80Cluster1 : 25342Cluster2 : 54Cluster3 : 37Cluster4 : 23
Cluster 2: Worm infected host
Cluster 3: Anomalous but not malicious
Cluster 4: Port scan by internal hosts
Anomalous clusters: Clusters 2,4,3
35

Intrusion Detection Summary
Cluster
ID
% Data
points
No. of Unique
hosts
Represented
Attack
Significant features
Firewall data
6 0.172 5 DoS # of unique source ports, # of connections
built, # of connections torn down
5 0.065 3 Port scan # of unique destination IPs
Firewall + System log data
4 0.090 2 Port scan # of connections built, # of connections torn
down
2 0.211 1 Worm # anonymous target user names, # NTLM
authentications, # session keys requested
36
Conclusion
• Intrusion detection using clustering techniques• Without labelling the data
• Without explicit profile for normal behavior
• Generic time-aware features to detect malicious behavior• Can be used for other attack types, e.g., brute-force attacks and data
exfiltration
• Allow data fusion across monitors
• Additional visibility into the system behavior• Average feature values analysis
• More holistic view
• Data reduction
37
Discussion
• Works well for the attacks that change the system behavior, including zero-days
• Complementary to rule-based intrusion detection approaches
• Might not work properly for the attacks that do not change the outward behavior of hosts, such as privilege escalation• However, a better choice of features might change this for some attacks
38

Future Directions
• Attack classes and features• Classify security attacks and respective features to detect them
• Data-driven feature selection
• Clustering algorithm choice• Hierarchical clustering
• Distribution-based clustering
• Online classification• Online clustering
• Train classifier using cluster labels
39

Questions?
40

Thank you!
41

![Security Enrichment in Intrusion Detection System Using Classifier … · Govindarajan [8] introduced a new hybrid Intrusion Detection System by combining radial basis function and](https://img.pdfslide.us/doc/110x75/601d840f9a03283a5b682c16/security-enrichment-in-intrusion-detection-system-using-classifier-govindarajan.jpg)


![Implementation of an Hierarchical Hybrid Intrusion ... · intrusion detection system [4] for WSN using the clustering algorithm, to reduce the information forwarded and decrease the](https://img.pdfslide.us/doc/110x75/5fc09764c1f8af7bb80a8951/implementation-of-an-hierarchical-hybrid-intrusion-intrusion-detection-system.jpg)


![Information gain based feature selection for intrusion ......Jashan [5] proposed hybrid model for developing the intrusion detection system by combining C4.5 decision tree and Support](https://img.pdfslide.us/doc/110x75/612ece6e1ecc515869430bb4/information-gain-based-feature-selection-for-intrusion-jashan-5-proposed.jpg)


![Combining Bayesian Inference and Clustering for …gulated CDR [20]. The approach is based on travel times clustering followed by a comparison with Google travel times. Still, CDR](https://img.pdfslide.us/doc/110x75/5fb6217571b0cd35a17e8197/combining-bayesian-inference-and-clustering-for-gulated-cdr-20-the-approach-is.jpg)