Embed Size (px)
Citation preview
INTRODUCTORY PHYSICAL GEOGRAPHY
INTRODUCTORY PHYSICAL GEOGRAPHY
This is NOT a class about remembering the names, locations, or measures of physical
features and natural phenomena around the world. Instead you will learn the physical
explanation for their presence, location and magnitude through the application of simple
laws of physical science. This will create a knowledge base which you can apply to a variety
of future and past scenarios, as well as build upon to better understand issues facing our
global physical environment.
INTRODUCTORY PHYSICAL GEOGRAPHY
Course Objectives.
1. To understand the nature of solar energy reaching the surface of the Earth, and its temporal and global variability.
INTRODUCTORY PHYSICAL GEOGRAPHY
Course Objectives.
2. To understand the nature and origin of energy arriving at the surface of the Earth from within the planet, the mechanisms of this energy transfer, and their geographic distribution.
INTRODUCTORY PHYSICAL GEOGRAPHY
Course Objectives.
3. To understand how the interactions of oceans, continents and atmosphere transfer energy from places experiencing excess energy to those of deficit energy, and how this gives rise to the typical climate of a location.
INTRODUCTORY PHYSICAL GEOGRAPHY
Course Objectives.
4. To understand why energy from within the Earth arrives at specific, restricted geographic locations, and how these patterns give rise to the macro-scale geography of our planet.
INTRODUCTORY PHYSICAL GEOGRAPHY
Course Objectives.
5. To understand the processes by which the competing forces driven by energy derived from the climate system and those from within the Earth interact to produce typical landscapes.
INTRODUCTORY PHYSICAL GEOGRAPHY
Course Objectives.
6. To indicate the ways in which all of the above impinge upon human behavior, our interaction with our environment, and in turn, how our behavior may impact our environment.
INTRODUCTORY PHYSICAL GEOGRAPHY
Course Content.
The course is divided into three portions:• The first half deals with the Earth’s climate
system.• The third quarter considers the nature and
distribution of energy from within the Earth.• The final quarter examines the interaction of
the two former sets of forces in shaping landscapes.
WHAT IS GLOBAL CLIMATE AND ITS STUDY, GLOBAL CLIMATOLOGY?
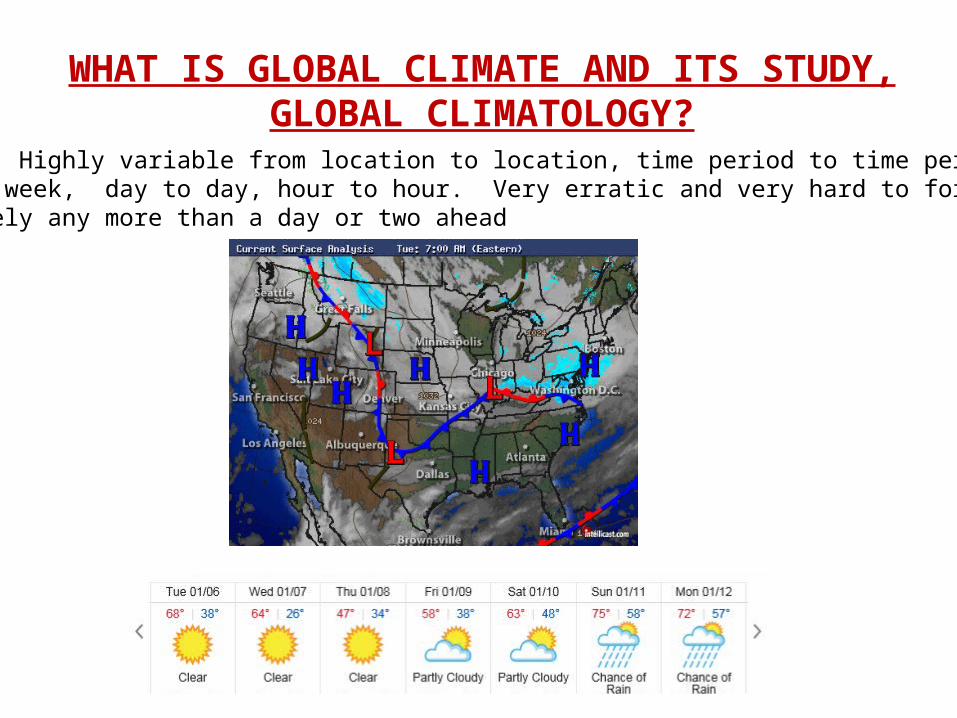
Weather: Highly variable from location to location, time period to time period,week to week, day to day, hour to hour. Very erratic and very hard to forecast accurately any more than a day or two ahead
WHAT IS GLOBAL CLIMATE AND ITS STUDY, GLOBAL CLIMATOLOGY?
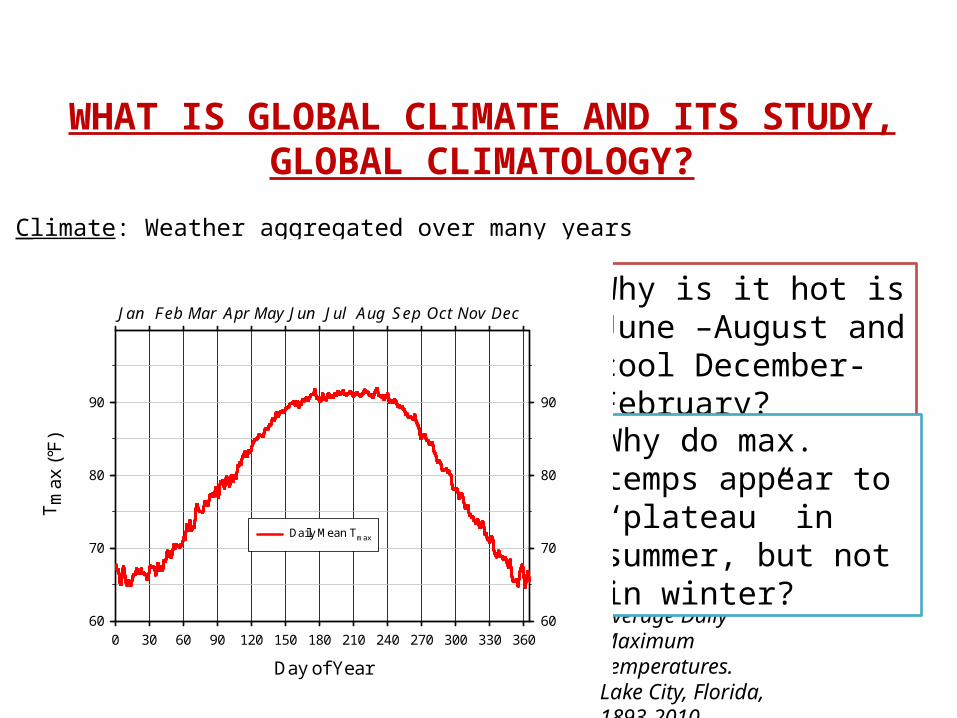
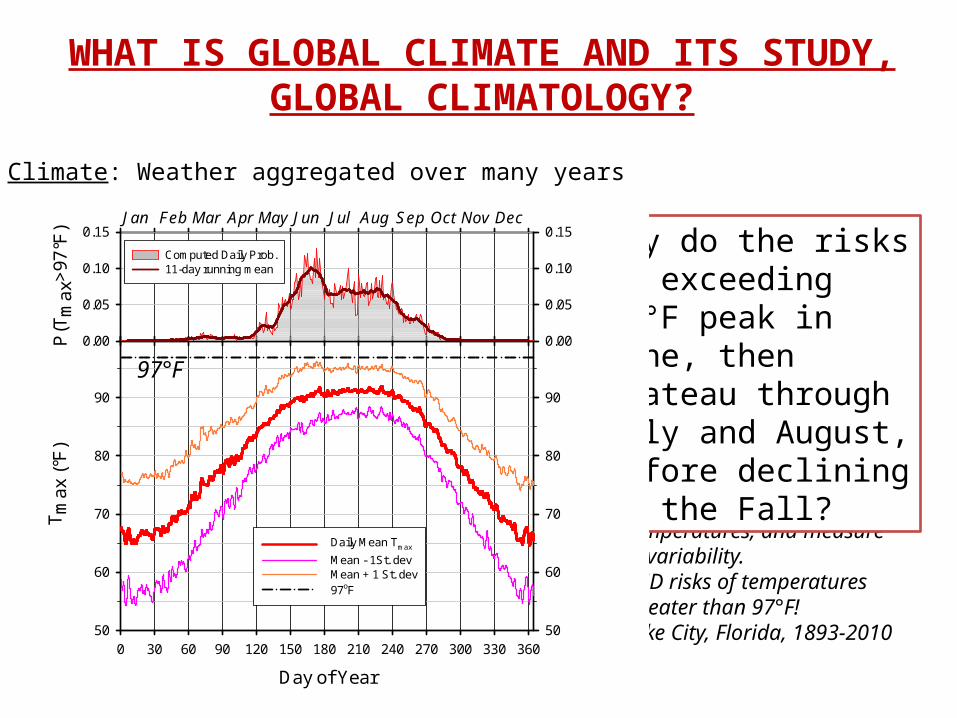
Climate: Weather aggregated over many years
Day of Year
0 30 60 90 120 150 180 210 240 270 300 330 360
Tm
ax (
°F)
60
70
80
90
60
70
80
90
Daily Mean Tmax
Jan Feb Mar Apr May Jun Aug Sep OctJul Nov Dec
Average Daily MaximumTemperatures.Lake City, Florida, 1893-2010
Why is it hot is June –August and cool December- February?
Why do max. temps appear to “plateau” in summer, but not in winter?
WHAT IS GLOBAL CLIMATE AND ITS STUDY, GLOBAL CLIMATOLOGY?
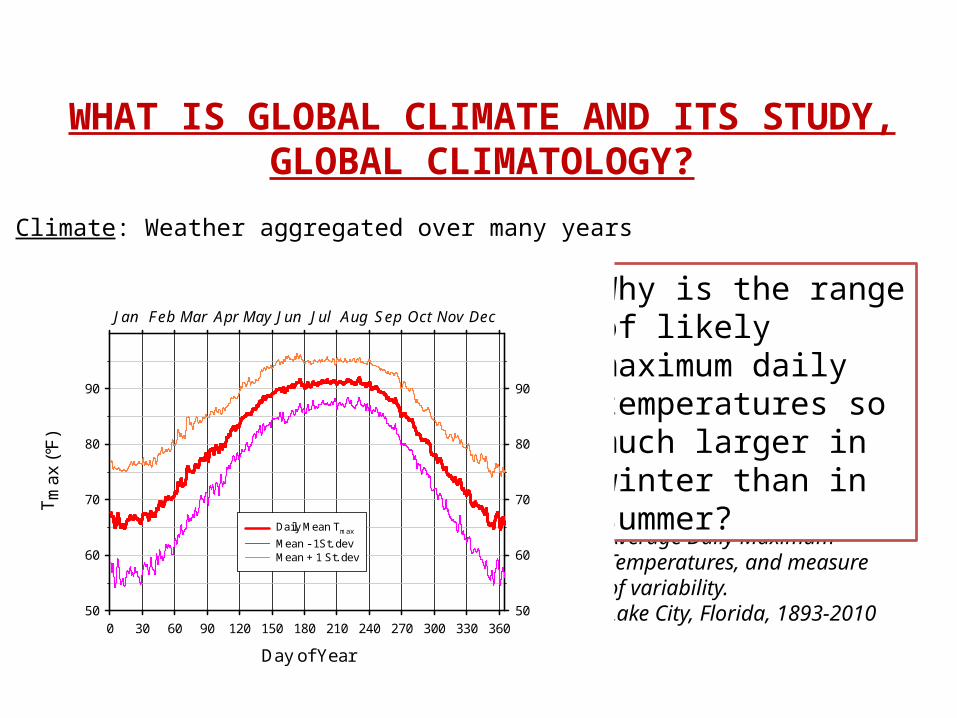
Climate: Weather aggregated over many years
Average Daily MaximumTemperatures, and measureof variability.Lake City, Florida, 1893-2010
Day of Year
0 30 60 90 120 150 180 210 240 270 300 330 360
Tm
ax (
°F)
50
60
70
80
90
50
60
70
80
90
Daily Mean Tmax
Mean - 1St. devMean + 1 St. dev
Jan Feb Mar Apr May Jun Aug Sep OctJul Nov Dec
Why is the range of likely maximum daily temperatures so much larger in winter than in summer?
WHAT IS GLOBAL CLIMATE AND ITS STUDY, GLOBAL CLIMATOLOGY?
Climate: Weather aggregated over many years
Day of Year
0 30 60 90 120 150 180 210 240 270 300 330 360
Tm
ax (
°F)
50
60
70
80
90
50
60
70
80
90
Daily Mean Tmax
Mean - 1St. devMean + 1 St. dev97oF
P(T
max
>97
°F)
0.00
0.05
0.10
0.15
0.00
0.05
0.10
0.15
Computed Daily Prob.11-day running mean
Jan Feb Mar Apr May Jun Aug Sep OctJul Nov Dec
97°F
Average Daily MaximumTemperatures, and measureof variability.AND risks of temperatures greater than 97°F!Lake City, Florida, 1893-2010
Why do the risks of exceeding 97°F peak in June, then plateau through July and August, before declining in the Fall?
WHAT IS GLOBAL CLIMATE AND ITS STUDY, GLOBAL CLIMATOLOGY?
Climate: Weather aggregated over many years
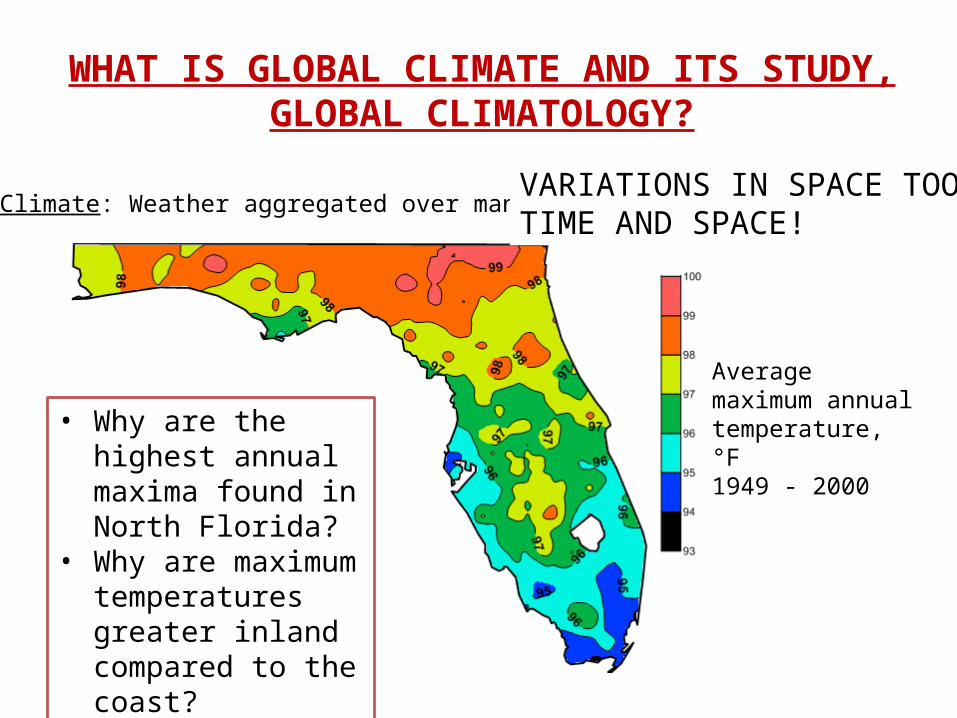
Average maximum annual temperature, °F 1949 - 2000
VARIATIONS IN SPACE TOO!TIME AND SPACE!
• Why are the highest annual maxima found in North Florida?
• Why are maximum temperatures greater inland compared to the coast?
1 0
1 3
1 5
1 8
2 0
2 3
2 5
2 8
3 0
3 5
5 0 0
1 0
1 5
2 0
2 5
3 0
5 0 0
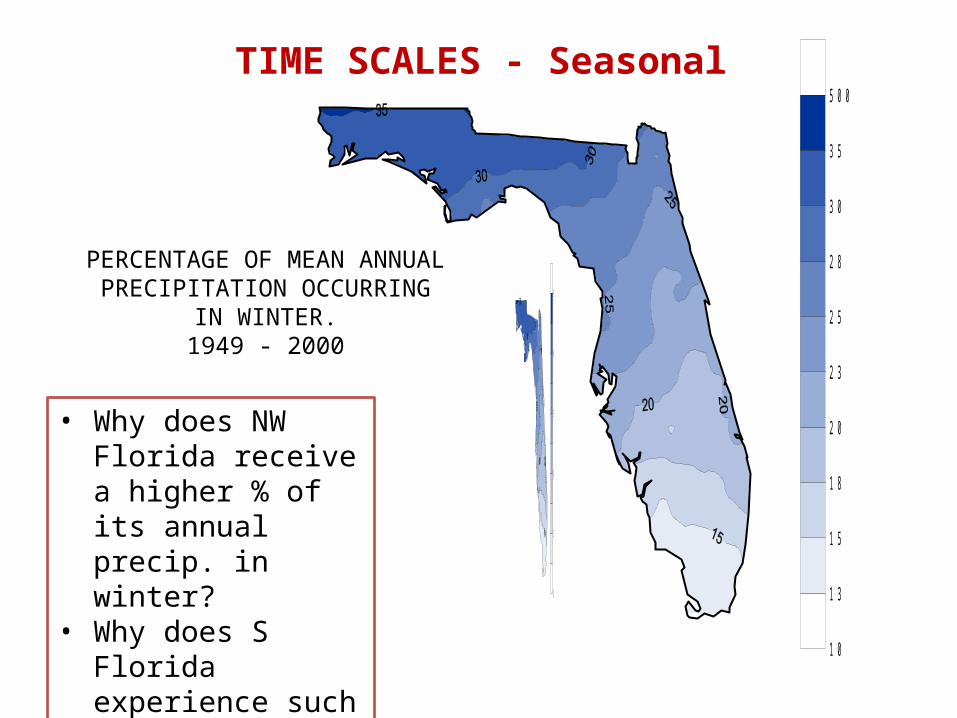
PERCENTAGE OF MEAN ANNUALPRECIPITATION OCCURRING
IN WINTER.1949 - 2000
TIME SCALES - Seasonal
• Why does NW Florida receive a higher % of its annual precip. in winter?
• Why does S Florida experience such a low % in winter?
-88 -87 -86 -85 -84 -83 -82 -81 -8025
26
27
28
29
30
31
-88 -87 -86 -85 -84 -83 -82 -81 -8025
26
27
28
29
30
31
-88 -87 -86 -85 -84 -83 -82 -81 -8025
26
27
28
29
30
31
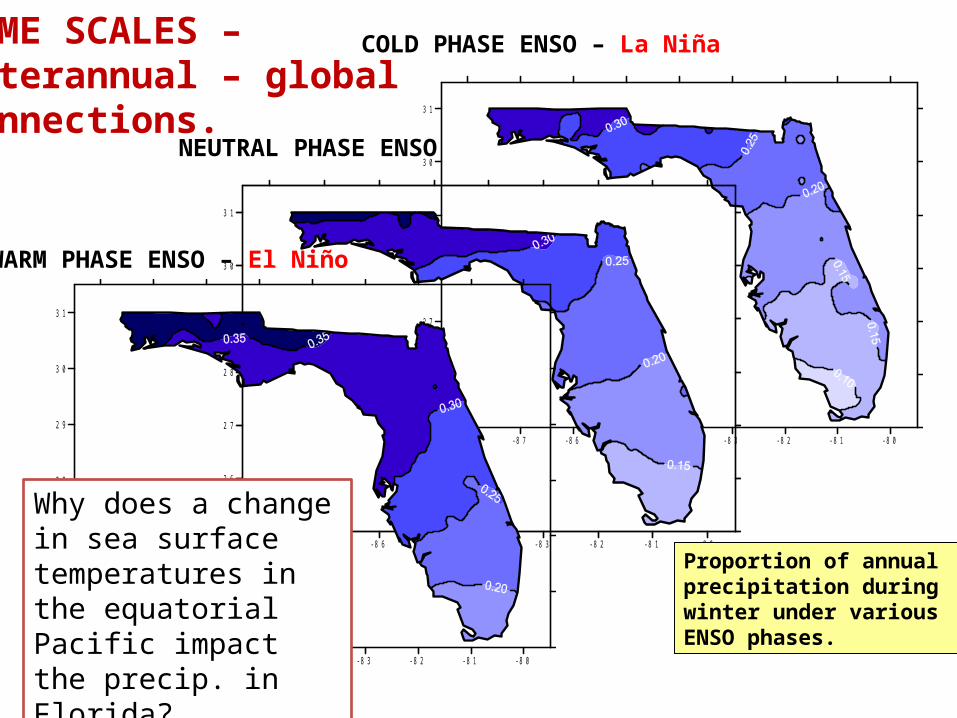
COLD PHASE ENSO – La Niña
NEUTRAL PHASE ENSO
WARM PHASE ENSO – El Niño
Proportion of annual precipitation duringwinter under variousENSO phases.
TIME SCALES – Interannual – globalConnections.
Why does a change in sea surface temperatures in the equatorial Pacific impact the precip. in Florida?
-88 -87 -86 -85 -84 -83 -82 -81 -8025
26
27
28
29
30
31
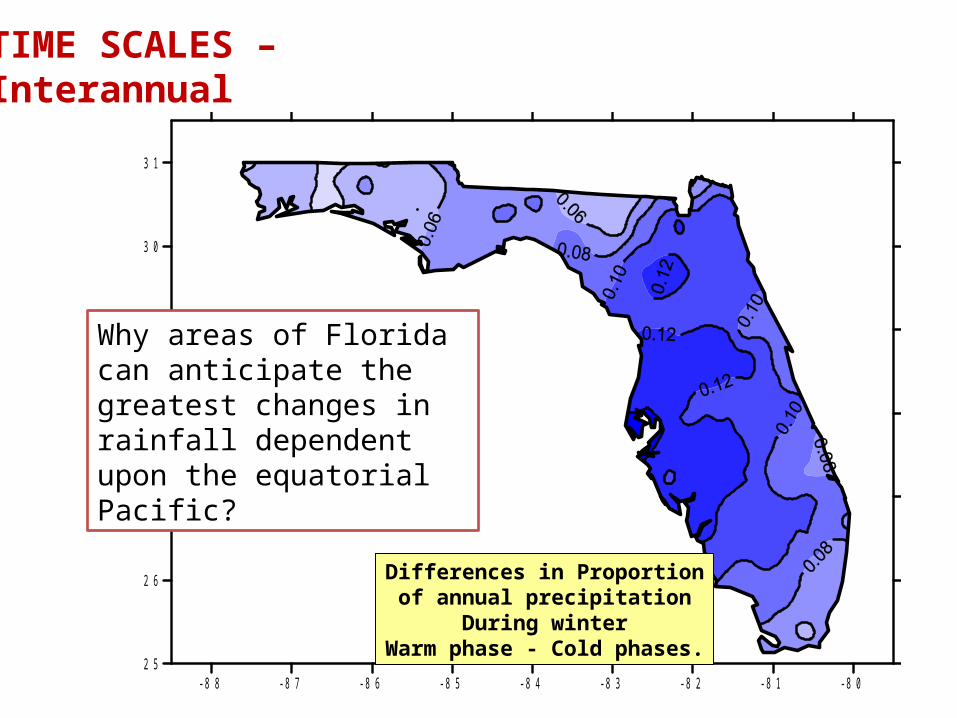
Differences in Proportionof annual precipitation
During winterWarm phase - Cold phases.
TIME SCALES – Interannual
Why areas of Florida can anticipate the greatest changes in rainfall dependent upon the equatorial Pacific?
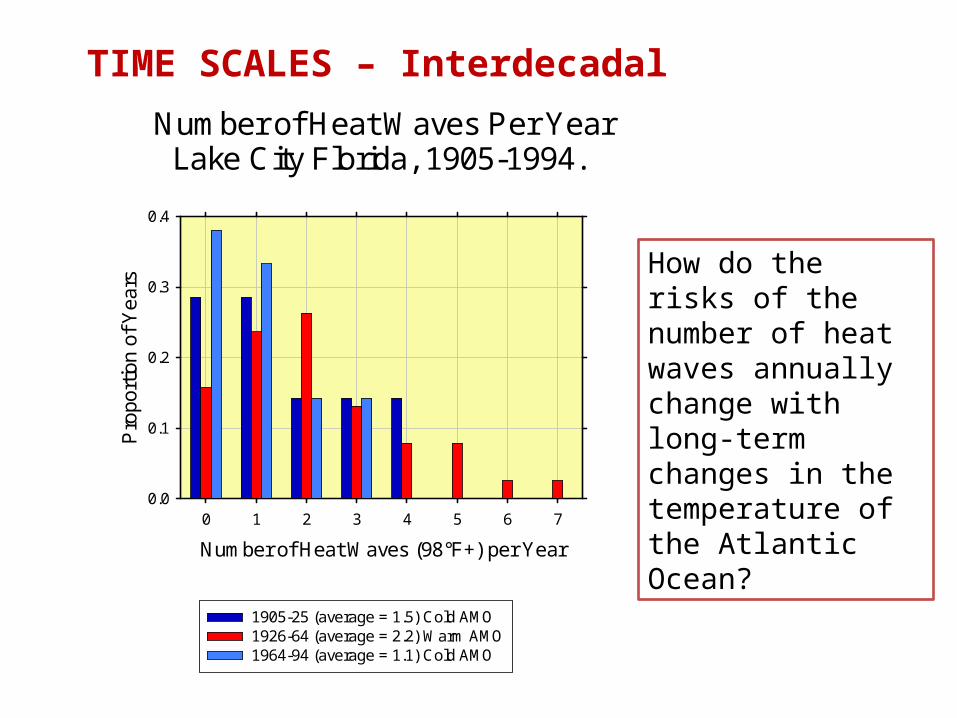
TIME SCALES – Interdecadal
Number of Heat Waves Per YearLake City Florida, 1905-1994.
Number of Heat Waves (98°F+) per Year
0 1 2 3 4 5 6 7
Pro
port
ion
of Y
ears
0.0
0.1
0.2
0.3
0.4
1905-25 (average = 1.5) Cold AMO1926-64 (average = 2.2) Warm AMO1964-94 (average = 1.1) Cold AMO
How do the risks of the number of heat waves annually change with long-term changes in the temperature of the Atlantic Ocean?
WHAT IS GLOBAL CLIMATE AND ITS STUDY, GLOBAL CLIMATOLOGY?
“Climate is what you expect,……..”
Includes average, variability and extremes
WHAT IS GLOBAL CLIMATE AND ITS STUDY, GLOBAL CLIMATOLOGY?
“Climate is what you expect,……..”
Includes average, variability and extremes
“………. Weather is what you get!”

HOW ARE WE GOING TO STUDY IT?
HOW ARE WE GOING TO STUDY IT?
Flows of Energy and Mass.
Movements of Energy and Mass within the Earth’s Atmospheric System

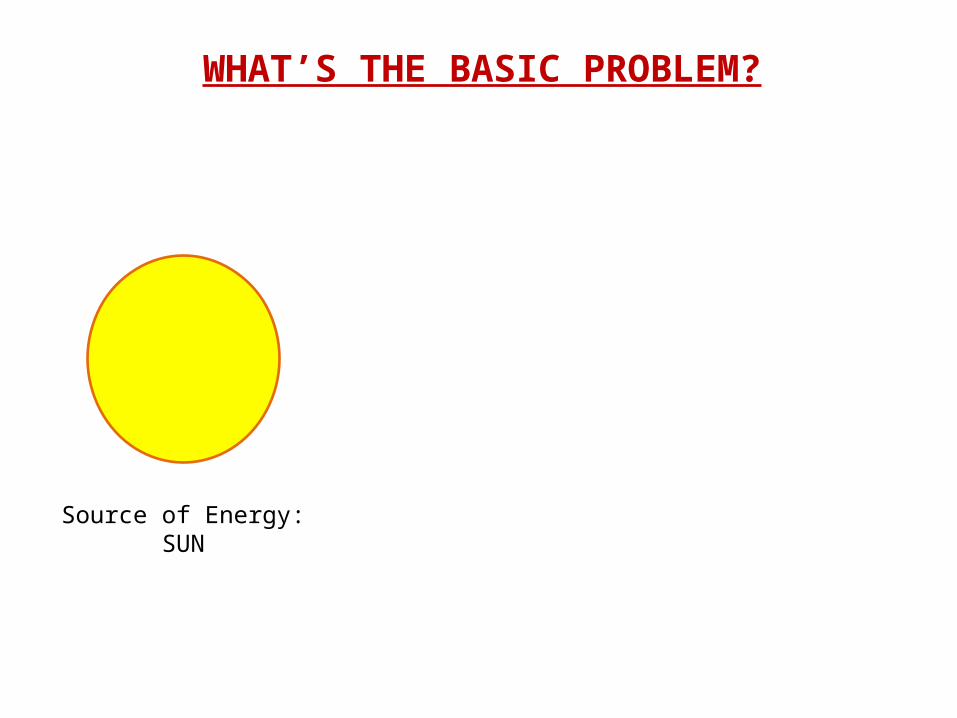
WHAT’S THE BASIC PROBLEM?
WHAT’S THE BASIC PROBLEM?
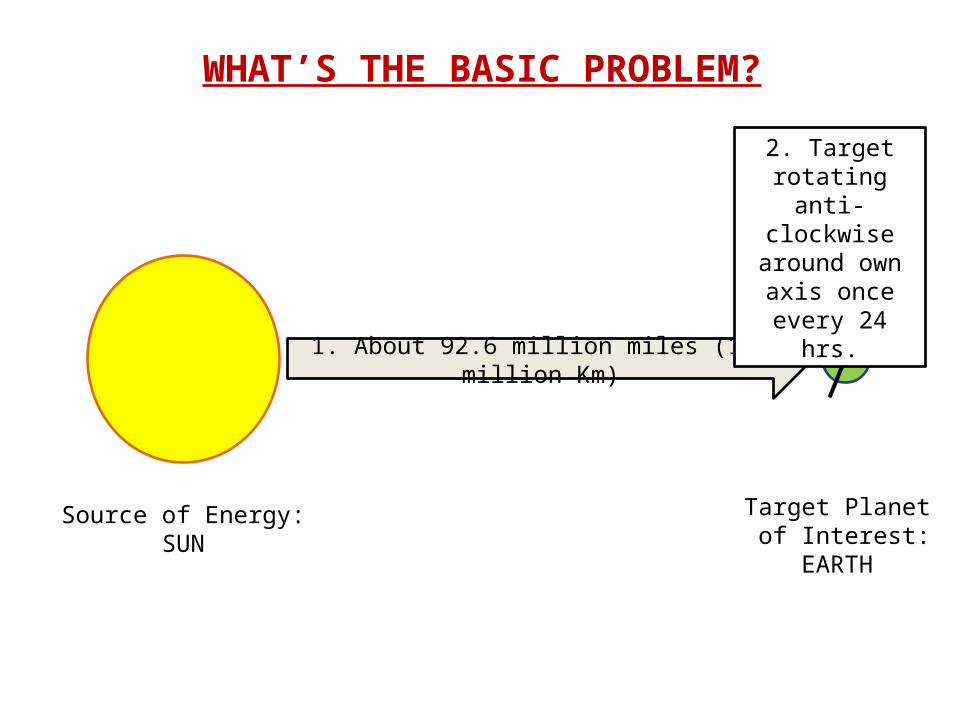
Source of Energy:SUN
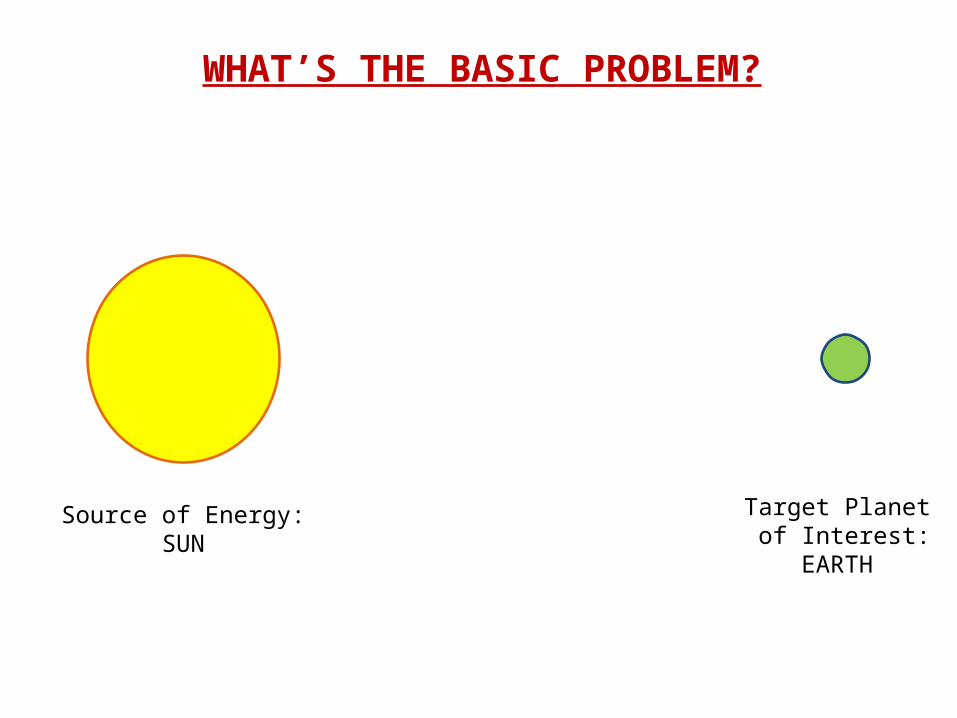
WHAT’S THE BASIC PROBLEM?
Source of Energy:SUN
Target Planet of Interest:
EARTH
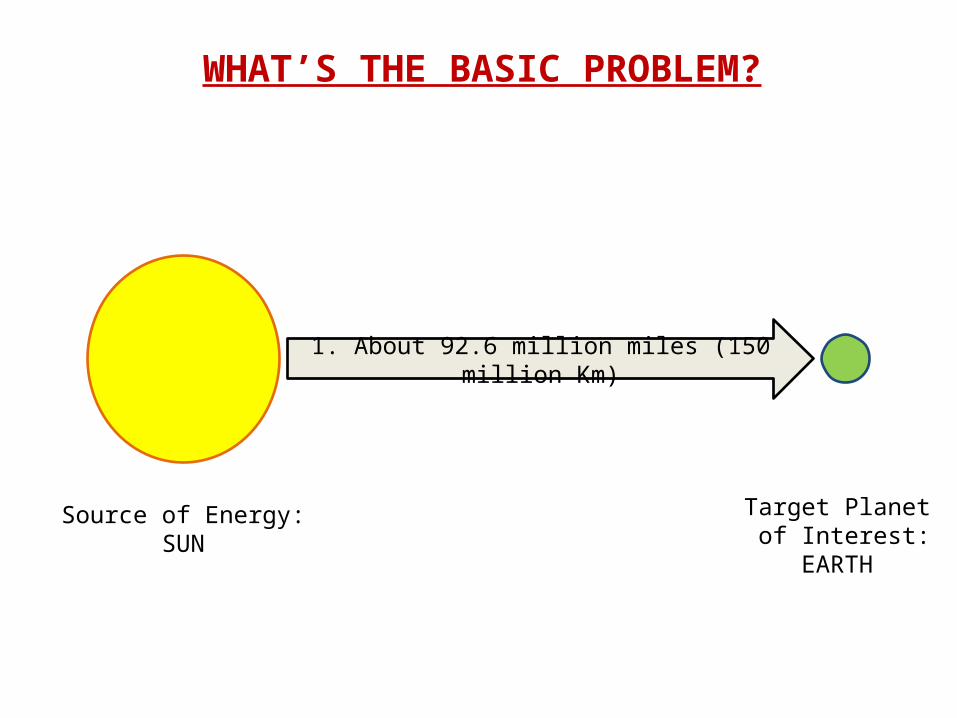
WHAT’S THE BASIC PROBLEM?
Source of Energy:SUN
Target Planet of Interest:
EARTH
1. About 92.6 million miles (150 million Km)
WHAT’S THE BASIC PROBLEM?
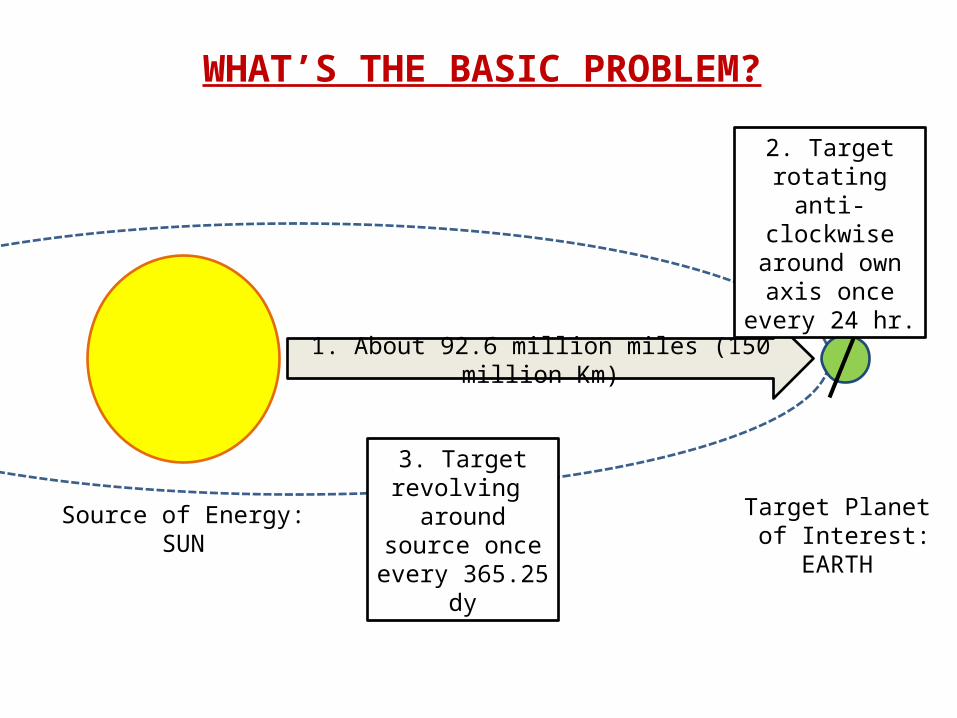
Source of Energy:SUN
Target Planet of Interest:
EARTH
1. About 92.6 million miles (150 million Km)
2. Target rotating anti-clockwise
around own axis once every 24
hrs.
WHAT’S THE BASIC PROBLEM?
Source of Energy:SUN
Target Planet of Interest:
EARTH
1. About 92.6 million miles (150 million Km)
2. Target rotating anti-clockwise
around own axis once every 24 hr.
3. Target revolving around
source once every 365.25 dy