Embed Size (px)
Citation preview
Industrial Inorganic Pigments. Edited by G. Buxbaum and G. PfaffCopyright c© 2005 WILEY-VCH Verlag GmbH & Co. KGaA, WeinheimISBN: 3-527-30363-4
1
1
Introduction
1.1
General Aspects
1.1.1
History, Classification, Standards
1.1.1.1
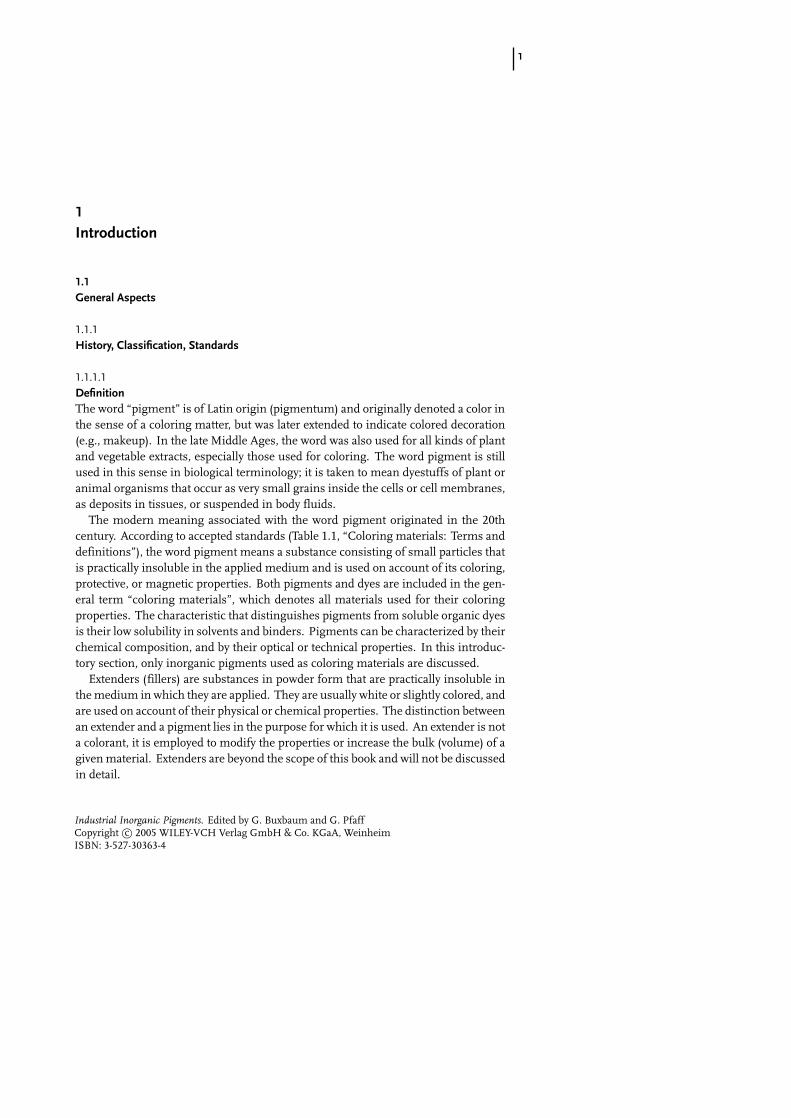
DefinitionThe word “pigment” is of Latin origin (pigmentum) and originally denoted a color inthe sense of a coloring matter, but was later extended to indicate colored decoration(e.g., makeup). In the late Middle Ages, the word was also used for all kinds of plantand vegetable extracts, especially those used for coloring. The word pigment is stillused in this sense in biological terminology; it is taken to mean dyestuffs of plant oranimal organisms that occur as very small grains inside the cells or cell membranes,as deposits in tissues, or suspended in body fluids.
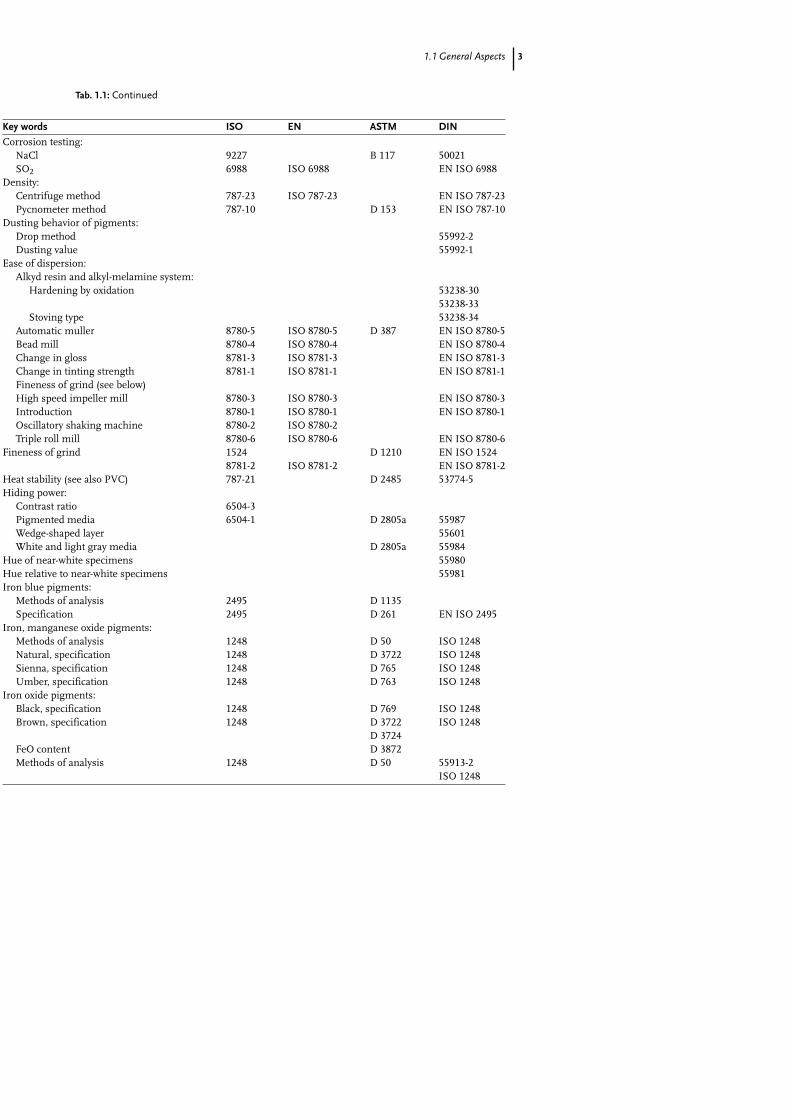
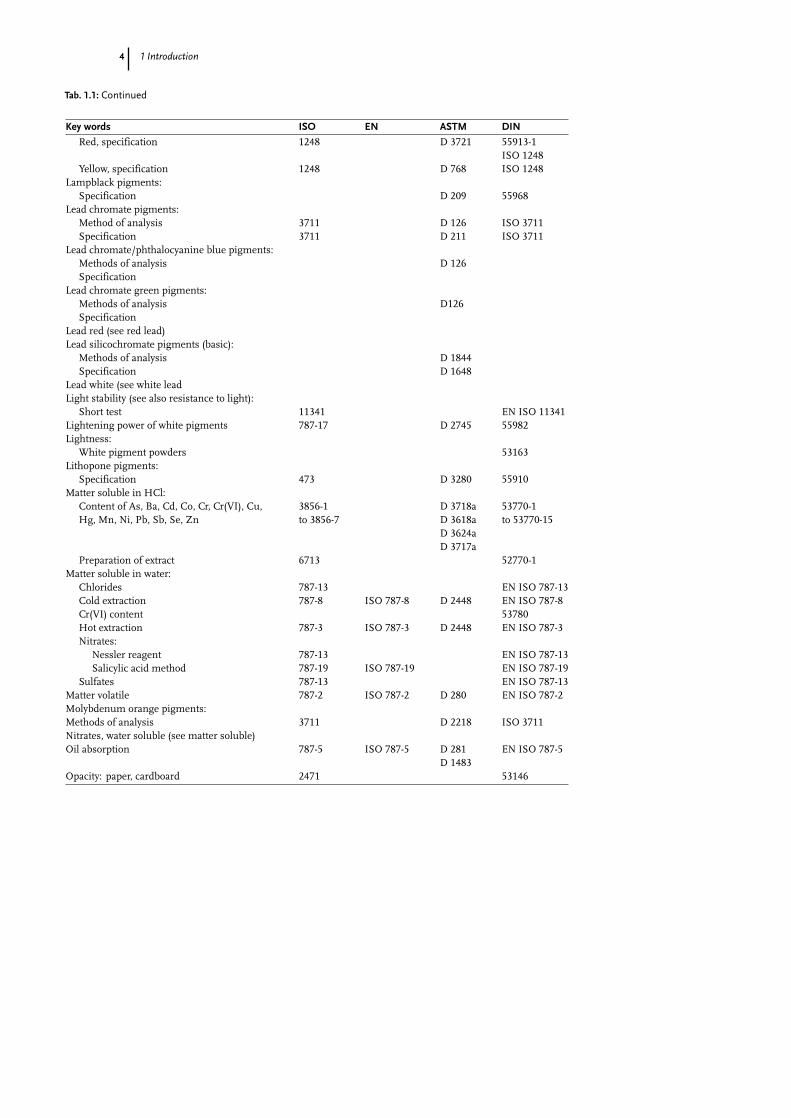
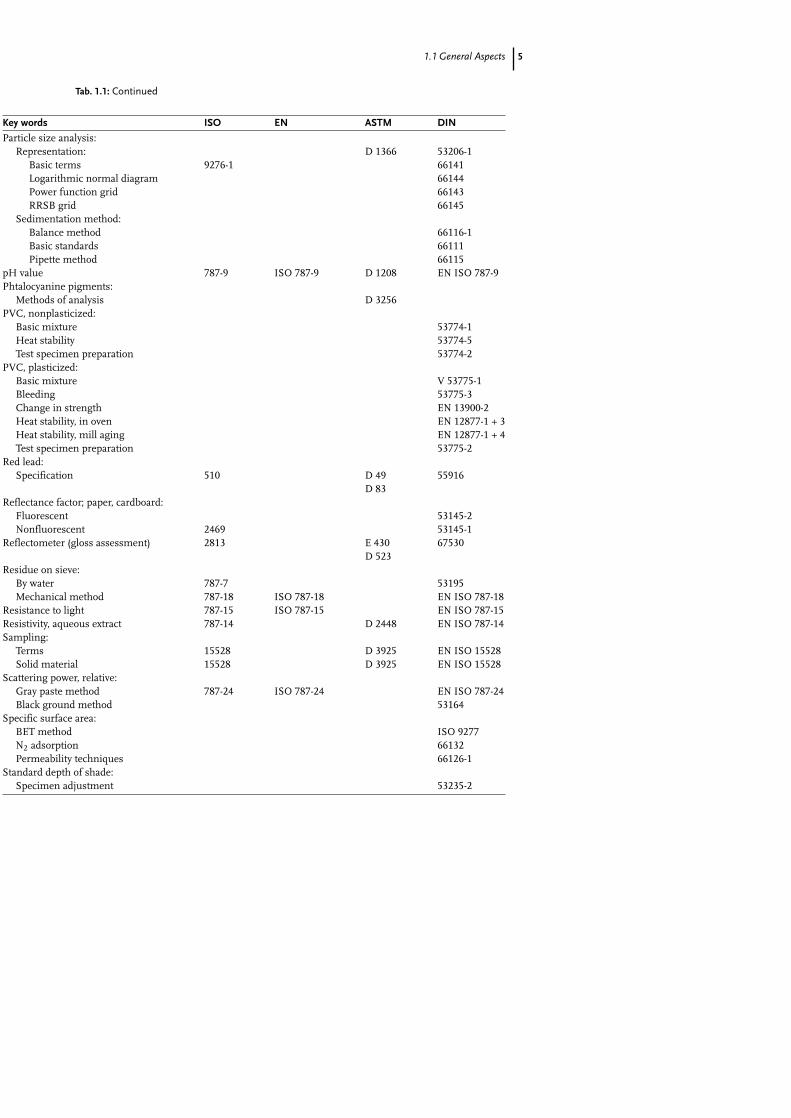
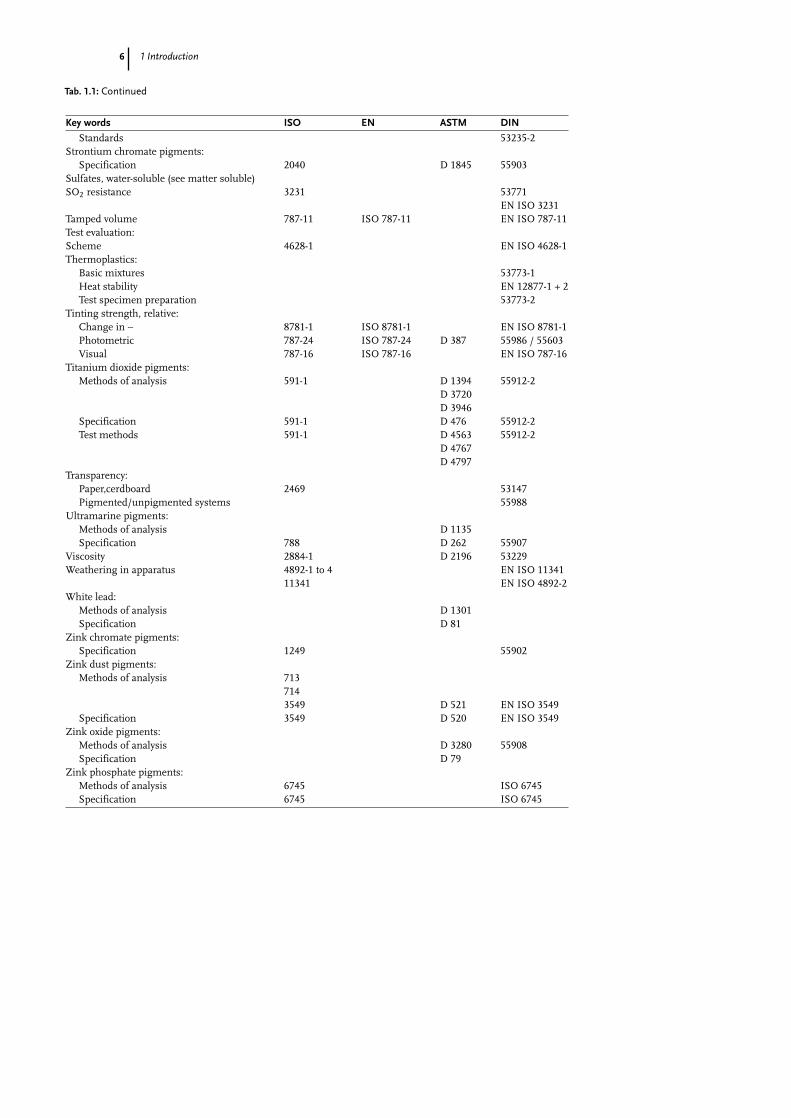
The modern meaning associated with the word pigment originated in the 20thcentury. According to accepted standards (Table 1.1, “Coloring materials: Terms anddefinitions”), the word pigment means a substance consisting of small particles thatis practically insoluble in the applied medium and is used on account of its coloring,protective, or magnetic properties. Both pigments and dyes are included in the gen-eral term “coloring materials”, which denotes all materials used for their coloringproperties. The characteristic that distinguishes pigments from soluble organic dyesis their low solubility in solvents and binders. Pigments can be characterized by theirchemical composition, and by their optical or technical properties. In this introduc-tory section, only inorganic pigments used as coloring materials are discussed.
Extenders (fillers) are substances in powder form that are practically insoluble inthe medium in which they are applied. They are usually white or slightly colored, andare used on account of their physical or chemical properties. The distinction betweenan extender and a pigment lies in the purpose for which it is used. An extender is nota colorant, it is employed to modify the properties or increase the bulk (volume) of agiven material. Extenders are beyond the scope of this book and will not be discussedin detail.
2 1 Introduction
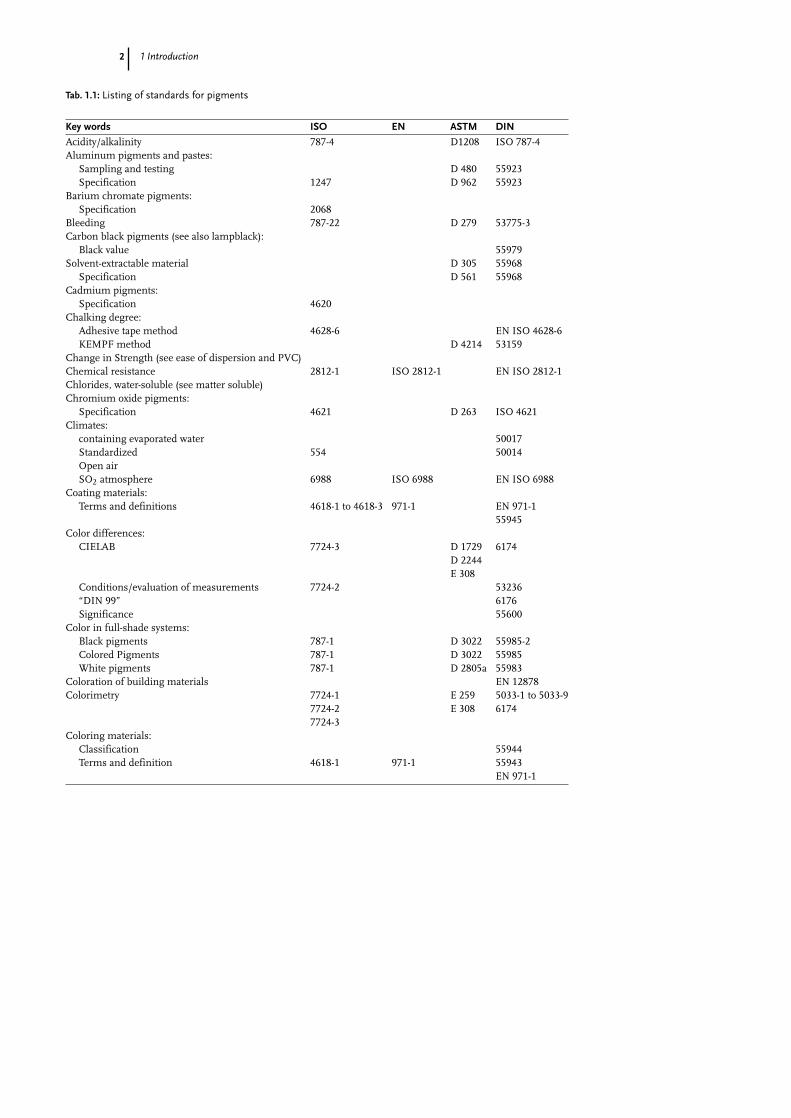
Tab. 1.1: Listing of standards for pigments
Key words ISO EN ASTM DIN
Acidity/alkalinity 787-4 D1208 ISO 787-4Aluminum pigments and pastes:
Sampling and testing D 480 55923Specification 1247 D 962 55923
Barium chromate pigments:Specification 2068
Bleeding 787-22 D 279 53775-3Carbon black pigments (see also lampblack):
Black value 55979Solvent-extractable material D 305 55968
Specification D 561 55968Cadmium pigments:
Specification 4620Chalking degree:
Adhesive tape method 4628-6 EN ISO 4628-6KEMPF method D 4214 53159
Change in Strength (see ease of dispersion and PVC)Chemical resistance 2812-1 ISO 2812-1 EN ISO 2812-1Chlorides, water-soluble (see matter soluble)Chromium oxide pigments:
Specification 4621 D 263 ISO 4621Climates:
containing evaporated water 50017Standardized 554 50014Open airSO2 atmosphere 6988 ISO 6988 EN ISO 6988
Coating materials:Terms and definitions 4618-1 to 4618-3 971-1 EN 971-1
55945Color differences:
CIELAB 7724-3 D 1729 6174D 2244E 308
Conditions/evaluation of measurements 7724-2 53236“DIN 99” 6176Significance 55600
Color in full-shade systems:Black pigments 787-1 D 3022 55985-2Colored Pigments 787-1 D 3022 55985White pigments 787-1 D 2805a 55983
Coloration of building materials EN 12878Colorimetry 7724-1 E 259 5033-1 to 5033-9
7724-2 E 308 61747724-3
Coloring materials:Classification 55944Terms and definition 4618-1 971-1 55943
EN 971-1
1.1 General Aspects 3
Tab. 1.1: Continued
Key words ISO EN ASTM DIN
Corrosion testing:NaCl 9227 B 117 50021SO2 6988 ISO 6988 EN ISO 6988
Density:Centrifuge method 787-23 ISO 787-23 EN ISO 787-23Pycnometer method 787-10 D 153 EN ISO 787-10
Dusting behavior of pigments:Drop method 55992-2Dusting value 55992-1
Ease of dispersion:Alkyd resin and alkyl-melamine system:
Hardening by oxidation 53238-3053238-33
Stoving type 53238-34Automatic muller 8780-5 ISO 8780-5 D 387 EN ISO 8780-5Bead mill 8780-4 ISO 8780-4 EN ISO 8780-4Change in gloss 8781-3 ISO 8781-3 EN ISO 8781-3Change in tinting strength 8781-1 ISO 8781-1 EN ISO 8781-1Fineness of grind (see below)High speed impeller mill 8780-3 ISO 8780-3 EN ISO 8780-3Introduction 8780-1 ISO 8780-1 EN ISO 8780-1Oscillatory shaking machine 8780-2 ISO 8780-2Triple roll mill 8780-6 ISO 8780-6 EN ISO 8780-6
Fineness of grind 1524 D 1210 EN ISO 15248781-2 ISO 8781-2 EN ISO 8781-2
Heat stability (see also PVC) 787-21 D 2485 53774-5Hiding power:
Contrast ratio 6504-3Pigmented media 6504-1 D 2805a 55987Wedge-shaped layer 55601White and light gray media D 2805a 55984
Hue of near-white specimens 55980Hue relative to near-white specimens 55981Iron blue pigments:
Methods of analysis 2495 D 1135Specification 2495 D 261 EN ISO 2495
Iron, manganese oxide pigments:Methods of analysis 1248 D 50 ISO 1248Natural, specification 1248 D 3722 ISO 1248Sienna, specification 1248 D 765 ISO 1248Umber, specification 1248 D 763 ISO 1248
Iron oxide pigments:Black, specification 1248 D 769 ISO 1248Brown, specification 1248 D 3722 ISO 1248
D 3724FeO content D 3872Methods of analysis 1248 D 50 55913-2
ISO 1248
4 1 Introduction
Tab. 1.1: Continued
Key words ISO EN ASTM DIN
Red, specification 1248 D 3721 55913-1ISO 1248
Yellow, specification 1248 D 768 ISO 1248Lampblack pigments:
Specification D 209 55968Lead chromate pigments:
Method of analysis 3711 D 126 ISO 3711Specification 3711 D 211 ISO 3711
Lead chromate/phthalocyanine blue pigments:Methods of analysis D 126Specification
Lead chromate green pigments:Methods of analysis D126Specification
Lead red (see red lead)Lead silicochromate pigments (basic):
Methods of analysis D 1844Specification D 1648
Lead white (see white leadLight stability (see also resistance to light):
Short test 11341 EN ISO 11341Lightening power of white pigments 787-17 D 2745 55982Lightness:
White pigment powders 53163Lithopone pigments:
Specification 473 D 3280 55910Matter soluble in HCl:
Content of As, Ba, Cd, Co, Cr, Cr(VI), Cu, 3856-1 D 3718a 53770-1Hg, Mn, Ni, Pb, Sb, Se, Zn to 3856-7 D 3618a to 53770-15
D 3624aD 3717a
Preparation of extract 6713 52770-1Matter soluble in water:
Chlorides 787-13 EN ISO 787-13Cold extraction 787-8 ISO 787-8 D 2448 EN ISO 787-8Cr(VI) content 53780Hot extraction 787-3 ISO 787-3 D 2448 EN ISO 787-3Nitrates:
Nessler reagent 787-13 EN ISO 787-13Salicylic acid method 787-19 ISO 787-19 EN ISO 787-19
Sulfates 787-13 EN ISO 787-13Matter volatile 787-2 ISO 787-2 D 280 EN ISO 787-2Molybdenum orange pigments:Methods of analysis 3711 D 2218 ISO 3711Nitrates, water soluble (see matter soluble)Oil absorption 787-5 ISO 787-5 D 281 EN ISO 787-5
D 1483Opacity: paper, cardboard 2471 53146
1.1 General Aspects 5
Tab. 1.1: Continued
Key words ISO EN ASTM DIN
Particle size analysis:Representation: D 1366 53206-1
Basic terms 9276-1 66141Logarithmic normal diagram 66144Power function grid 66143RRSB grid 66145
Sedimentation method:Balance method 66116-1Basic standards 66111Pipette method 66115
pH value 787-9 ISO 787-9 D 1208 EN ISO 787-9Phtalocyanine pigments:
Methods of analysis D 3256PVC, nonplasticized:
Basic mixture 53774-1Heat stability 53774-5Test specimen preparation 53774-2
PVC, plasticized:Basic mixture V 53775-1Bleeding 53775-3Change in strength EN 13900-2Heat stability, in oven EN 12877-1 + 3Heat stability, mill aging EN 12877-1 + 4Test specimen preparation 53775-2
Red lead:Specification 510 D 49 55916
D 83Reflectance factor; paper, cardboard:
Fluorescent 53145-2Nonfluorescent 2469 53145-1
Reflectometer (gloss assessment) 2813 E 430 67530D 523
Residue on sieve:By water 787-7 53195Mechanical method 787-18 ISO 787-18 EN ISO 787-18
Resistance to light 787-15 ISO 787-15 EN ISO 787-15Resistivity, aqueous extract 787-14 D 2448 EN ISO 787-14Sampling:
Terms 15528 D 3925 EN ISO 15528Solid material 15528 D 3925 EN ISO 15528
Scattering power, relative:Gray paste method 787-24 ISO 787-24 EN ISO 787-24Black ground method 53164
Specific surface area:BET method ISO 9277N2 adsorption 66132Permeability techniques 66126-1
Standard depth of shade:Specimen adjustment 53235-2
6 1 Introduction
Tab. 1.1: Continued
Key words ISO EN ASTM DIN
Standards 53235-2Strontium chromate pigments:
Specification 2040 D 1845 55903Sulfates, water-soluble (see matter soluble)SO2 resistance 3231 53771
EN ISO 3231Tamped volume 787-11 ISO 787-11 EN ISO 787-11Test evaluation:Scheme 4628-1 EN ISO 4628-1Thermoplastics:
Basic mixtures 53773-1Heat stability EN 12877-1 + 2Test specimen preparation 53773-2
Tinting strength, relative:Change in ∼ 8781-1 ISO 8781-1 EN ISO 8781-1Photometric 787-24 ISO 787-24 D 387 55986 / 55603Visual 787-16 ISO 787-16 EN ISO 787-16
Titanium dioxide pigments:Methods of analysis 591-1 D 1394 55912-2
D 3720D 3946
Specification 591-1 D 476 55912-2Test methods 591-1 D 4563 55912-2
D 4767D 4797
Transparency:Paper,cerdboard 2469 53147Pigmented/unpigmented systems 55988
Ultramarine pigments:Methods of analysis D 1135Specification 788 D 262 55907
Viscosity 2884-1 D 2196 53229Weathering in apparatus 4892-1 to 4 EN ISO 11341
11341 EN ISO 4892-2White lead:
Methods of analysis D 1301Specification D 81
Zink chromate pigments:Specification 1249 55902
Zink dust pigments:Methods of analysis 713
7143549 D 521 EN ISO 3549
Specification 3549 D 520 EN ISO 3549Zink oxide pigments:
Methods of analysis D 3280 55908Specification D 79
Zink phosphate pigments:Methods of analysis 6745 ISO 6745Specification 6745 ISO 6745
1.1 General Aspects 7
1.1.1.2
HistoryNatural inorganic pigments have been known since prehistoric times. Over 60,000years ago, natural ocher was used in the Ice Age as a coloring material. The cavepaintings of the Pleistocene peoples of southern France, northern Spain, and north-ern Africa were made with charcoal, ocher, manganese brown, and clays, and musthave been produced over 30,000 years ago. About 2000 BC, natural ocher was burnt,sometimes in mixtures with manganese ores, to produce red, violet, and black pig-ments for pottery. Arsenic sulfide and Naples yellow (a lead antimonate) were thefirst clear yellow pigments. Ultramarine (lapis lazuli) and artificial lapis lazuli (Egyp-tian blue and cobalt aluminum spinel) were the first blue pigments. Terra verte,malachite, and a synthetically prepared copper hydroxychloride were the first greenpigments. Colored glazes for bricks (i.e., ceramic pigments) were widely used by theChaldeans. Calcite, some phases of calcium sulfate, and kaolinite were the whitepigments used at that time.
Painting, enamel, glass, and dyeing techniques reached an advanced state of de-velopment in Egypt and Babylon. A synthetic lapis lazuli (a silicate of copper andcalcium) is still known as Egyptian blue. Antimony sulfide and galena (lead sulfide)were commonly used as black pigments, cinnabar as a red pigment, and groundcobalt glass and cobalt aluminum oxide as blue pigments. According to Plutarch, theGreeks and Romans did not regard the art of dyeing very highly, and made very littlecontribution to the development of new pigments. Pliny (23–79 AD) describes thepigments orpigment, realgar, massicot, red lead, white lead, verdigris, and pigmentslaked with alum, as well as the pigments already listed above. Certain types of chalkand clay were used as white pigments.
From the age of the migration of the peoples (fourth to sixth century AD) to theend of the late Middle Ages, there were no notable additions to the range of coloringmaterials. The reinvented pigment Naples yellow and certain dyestuffs for textilesfrom the orient were the only innovations. New developments in the field of pigmentsfirst occurred during the early Renaissance. Carmine was introduced from Mexicoby the Spanish. Smalt, safflore, and cobalt-containing blue glasses were developedin Europe.
The pigment industry started in the 18th century with products such as Berlin blue(1704), cobalt blue (1777), Scheele’s green, and chrome yellow (1778).
In the 19th century, ultramarine, Guignet’s green, cobalt pigments, iron oxidepigments, and cadmium pigments were developed in quick succession.
In the 20th century, pigments increasingly became the subject of scientific in-vestigation. In the past few decades, the synthetic colored pigments cadmium red,manganese blue, molybdenum red, and mixed oxides with bismuth came onto themarket. Titanium dioxide with anatase or rutile structures, and acicular zinc oxidewere introduced as new synthetic white pigments and extenders, respectively. Lus-ter pigments (metal effect, pearl/luster, and interference pigments) have assumedincreasing importance.
8 1 Introduction
1.1.1.3
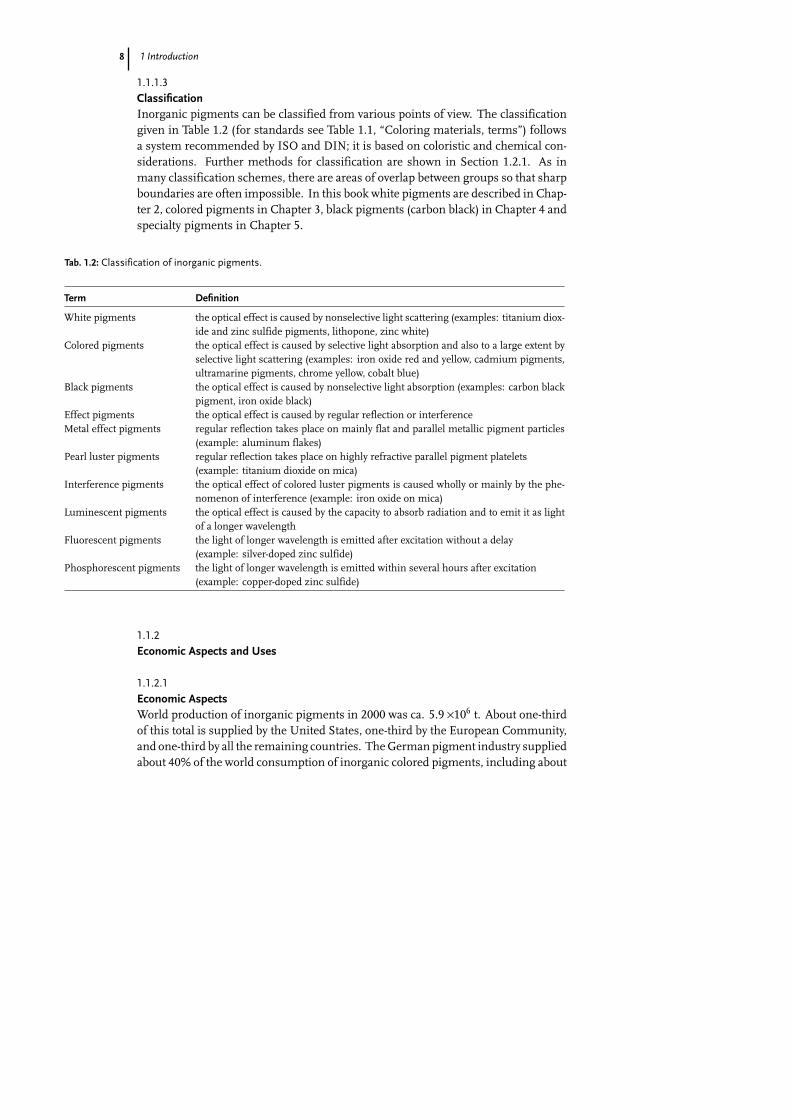
ClassificationInorganic pigments can be classified from various points of view. The classificationgiven in Table 1.2 (for standards see Table 1.1, “Coloring materials, terms”) followsa system recommended by ISO and DIN; it is based on coloristic and chemical con-siderations. Further methods for classification are shown in Section 1.2.1. As inmany classification schemes, there are areas of overlap between groups so that sharpboundaries are often impossible. In this book white pigments are described in Chap-ter 2, colored pigments in Chapter 3, black pigments (carbon black) in Chapter 4 andspecialty pigments in Chapter 5.
Tab. 1.2: Classification of inorganic pigments.
Term Definition
White pigments the optical effect is caused by nonselective light scattering (examples: titanium diox-ide and zinc sulfide pigments, lithopone, zinc white)
Colored pigments the optical effect is caused by selective light absorption and also to a large extent byselective light scattering (examples: iron oxide red and yellow, cadmium pigments,ultramarine pigments, chrome yellow, cobalt blue)
Black pigments the optical effect is caused by nonselective light absorption (examples: carbon blackpigment, iron oxide black)
Effect pigments the optical effect is caused by regular reflection or interferenceMetal effect pigments regular reflection takes place on mainly flat and parallel metallic pigment particles
(example: aluminum flakes)Pearl luster pigments regular reflection takes place on highly refractive parallel pigment platelets
(example: titanium dioxide on mica)Interference pigments the optical effect of colored luster pigments is caused wholly or mainly by the phe-
nomenon of interference (example: iron oxide on mica)Luminescent pigments the optical effect is caused by the capacity to absorb radiation and to emit it as light
of a longer wavelengthFluorescent pigments the light of longer wavelength is emitted after excitation without a delay
(example: silver-doped zinc sulfide)Phosphorescent pigments the light of longer wavelength is emitted within several hours after excitation
(example: copper-doped zinc sulfide)
1.1.2
Economic Aspects and Uses
1.1.2.1
Economic AspectsWorld production of inorganic pigments in 2000 was ca. 5.9 ×10⁶ t. About one-thirdof this total is supplied by the United States, one-third by the European Community,and one-third by all the remaining countries. The German pigment industry suppliedabout 40% of the world consumption of inorganic colored pigments, including about
1.1 General Aspects 9
50% of the iron oxides. Estimated world consumption of inorganic pigments in 2000can be broken down as follows:
Titanium dioxide 69%Synthetic iron oxides 14%Lithopone 3.5%Zinc oxide 1%Effect pigments 1%Chromates <1%Chromium oxide 0.5%Mixed metal oxide pigments <0.5%Ultramarine <0.5%Iron blue <0.5%
Pigment production is still increasing, but the rate of growth has decreased. Thevalue of inorganic pigments has diminished recent years and in 2002 totalled ca.US$ 10 ×109. The main manufacturing companies are given in the correspondingsections.
1.1.2.2
UsesThe most important areas of use of pigments are paints, varnishes, plastics, artists’colors, printing inks for paper and textiles, leather decoration, building materials (ce-ment, renderings, concrete bricks and tiles, mostly based on iron oxide and chromiumoxide pigments), imitation leather, floor coverings, rubber, paper, cosmetics, ceramicglazes, and enamels.
The paint industry uses high-quality pigments almost exclusively. An optimal,uniform particle size is important because it influences gloss, hiding power, tintingstrength, and lightening power. Paint films must not be too thick; therefore pigmentswith good tinting strength and hiding power combined with optimum dispersingproperties are needed.
White pigments are used not only for white coloring and covering, but also for re-ducing (lightening) colored and black pigments. They must have a minimal intrinsiccolor tone.
When choosing a pigment for a particular application, several points normallyhave to be considered. The coloring properties (e.g., color, tinting strength or light-ening power, hiding power, see Section 1.3) are important in determining applicationefficiency and hence economics. The following properties are also important:
1. General chemical and physical properties: chemical composition, moisture andsalt content, content of water-soluble and acid-soluble matter, particle size,density, and hardness (see Section 1.2).
2. Stability properties: resistance toward light, weather, heat, and chemicals, anti-corrosive properties, retention of gloss (see Section 1.4).
10 1 Introduction
3. Behavior in binders: interaction with the binder properties, dispersibility, specialproperties in certain binders, compatibility, and solidifying effect (see Section1.5).
Important pigment properties and the methods for determining them are de-scribed later.
1.1.3
New Developments
Notwithstanding that most inorganic pigments have been known for a very long time,new developments appear on the catwalk of colors. The so-called “high performancepigments” [1.1] show a lot of modern developments.
Driven by environmental laws, even some of the former important inorganic pig-ments have had to be replaced. For example, red lead was fully substituted in mostcountries in anticorrosion paint. However environmental considerations are not theonly driving force in the development of new pigments. The invention of new pig-ments and the improvement of the already existing pigments in this class in the lastdecade have made new color effects available on an industrial scale (see Section 5.3).New physical effects led to the so-called “quantum effect pigments”, but these are inthe very early stage of nanoscale laboratory curiosities.
The progress in multi-component mixed crystal systems shows lanthanum-tantalumoxide-nitrides as promising candidates with interesting color shades in the red to yel-low range [1.2, 1.3] but the development into industrially available pigments has yetto be proven. Even the promising candidate of the last decade, cerium sulfide [1.4],presently available in technical quantities, is still waiting for its breakthrough becauseof stability problems, which have not yet been resolved [1.5].
The reasons for the slow introduction of new pigments may be that the regulatoryhurdles for newly introduced chemicals are high, and also that customers are makingmore demands on the performance of new materials and the Three Essential E’s:Effectiveness, Economy and Ecology.
There are still challenges: Brilliant, inorganic, nontoxic, stable and cheap green orblue pigments are amongst these. Probably, the mixed crystal systems are promisingfields for new discoveries.
The general areas for the development of inorganic pigments that are new oralready on the market can be summarized as follows [1.5]:
1. Many pigments are coated with an additional layer, having no strong influenceon the color, but improving the application properties: better adjustment ofpigment and binder components (pre-wetting of the pigment surface, disper-sion behavior, settling behavior, etc.); improved weathering properties of thepigments in the binder system (i.e. stability against UV, humidity, etc.). Thesesurface treatments (aftertreatments) can consist of inorganic (SiO2, Al2O3,ZrO2), organic (polyalcohols, siloxanes, organo-functional silanes or titanates)or combined inorganic/organic compounds.
1.2 General Chemical and Physical Properties 11
2. The pigments are offered not only as pure, free-flowing powders, but also inthe form of preparations (granulates, chips, pastes, color concentrates). Thesepreparations contain the pigment in as high as possible concentration. Inaddition to the pigment, the preparations consist also of binder componentsor binder mixtures based on solvent and waterborne systems. Such pigment-binder combinations show certain advantages for the users of paints, printinginks or plastics (i.e. better pigment dispersibility, non-dusting introduction ofthe pigment in the application system, optimized wetting behavior, improvedcoloristic effects in the final products).
3. New approaches are being made combining the high hiding power and stabilityof inorganic pigments with the brilliance and saturation of organic pigments.Besides the known simple blending (e.g. “iron green” = yellow iron oxide hy-droxide with phthalocyanine) new preparations of specialized titanium dioxidewith high performance organic pigments show interesting properties, but theproof of merchantable quality is yet to come.
The further development of tailor-made surface treatments and pigment prepara-tions will lead to the faster introduction of new applications for inorganic pigmentsin the future.
1.2
General Chemical and Physical Properties
1.2.1
Fundamental Aspects [1.6]
1.2.1.1
Chemical CompositionWith few exceptions, inorganic pigments are oxides, sulfides, oxide hydroxides, sili-cates, sulfates, or carbonates (see Tables 1.3 and 1.4), and normally consist of single-component particles (e.g., red iron oxide, á-Fe2O3 with well-defined crystal structures.However, mixed and substrate pigments consist of non-uniform or multicomponentparticles.
Mixed pigments are pigments that have been mixed or ground with pigments orextenders in the dry state (e.g., chrome green pigments are mixtures of chrome yellowand iron blue). If the components differ in particle size and shape, density, reactivity,or surface tension, they may segregate during use.
In the case of substrate pigments, at least one additional component (pigment orextender) is deposited onto a substrate (pigment or extender), preferably by a wetmethod. Weak, medium, or strong attractive forces develop between these pigmentcomponents during drying or calcining. These forces prevent segregation of thecomponents during use.
Special substrate pigments include the aftertreated pigments and the core pig-ments. To produce aftertreated pigments the inorganic pigment particles are covered
12 1 Introduction
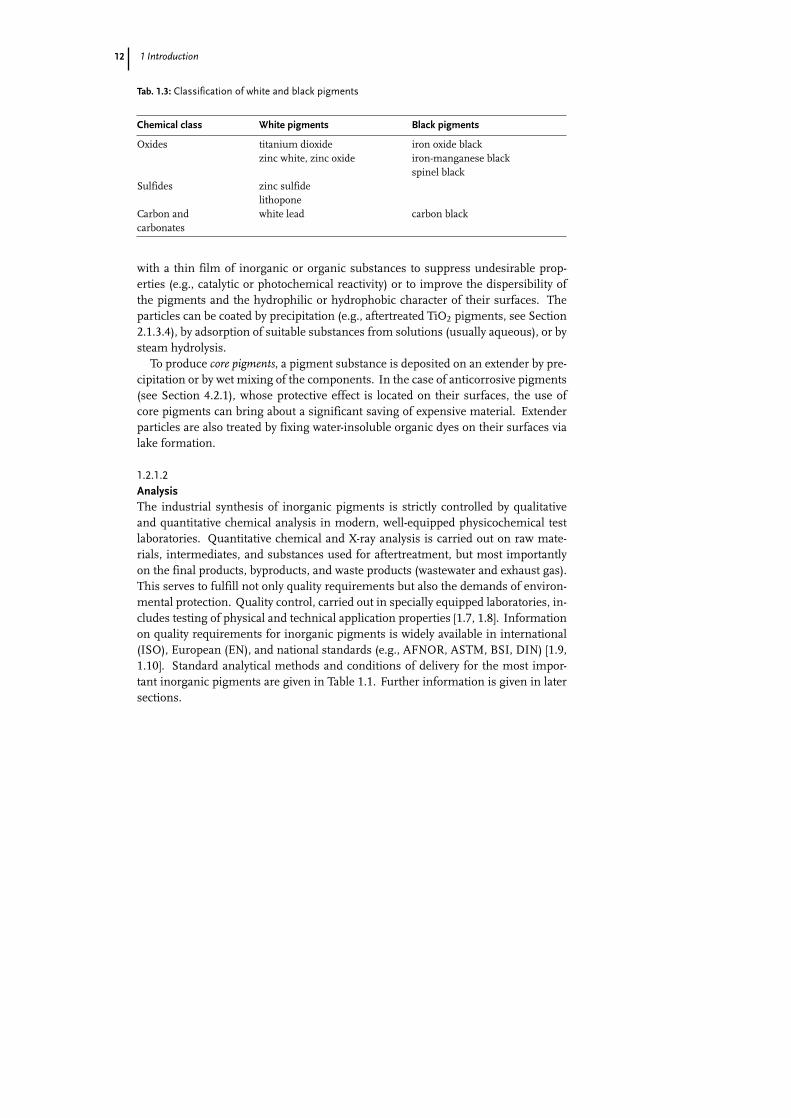
Tab. 1.3: Classification of white and black pigments
Chemical class White pigments Black pigments
Oxides titanium dioxide iron oxide blackzinc white, zinc oxide iron-manganese black
spinel blackSulfides zinc sulfide
lithoponeCarbon and white lead carbon blackcarbonates
with a thin film of inorganic or organic substances to suppress undesirable prop-erties (e.g., catalytic or photochemical reactivity) or to improve the dispersibility ofthe pigments and the hydrophilic or hydrophobic character of their surfaces. Theparticles can be coated by precipitation (e.g., aftertreated TiO2 pigments, see Section2.1.3.4), by adsorption of suitable substances from solutions (usually aqueous), or bysteam hydrolysis.
To produce core pigments, a pigment substance is deposited on an extender by pre-cipitation or by wet mixing of the components. In the case of anticorrosive pigments(see Section 4.2.1), whose protective effect is located on their surfaces, the use ofcore pigments can bring about a significant saving of expensive material. Extenderparticles are also treated by fixing water-insoluble organic dyes on their surfaces vialake formation.
1.2.1.2
AnalysisThe industrial synthesis of inorganic pigments is strictly controlled by qualitativeand quantitative chemical analysis in modern, well-equipped physicochemical testlaboratories. Quantitative chemical and X-ray analysis is carried out on raw mate-rials, intermediates, and substances used for aftertreatment, but most importantlyon the final products, byproducts, and waste products (wastewater and exhaust gas).This serves to fulfill not only quality requirements but also the demands of environ-mental protection. Quality control, carried out in specially equipped laboratories, in-cludes testing of physical and technical application properties [1.7, 1.8]. Informationon quality requirements for inorganic pigments is widely available in international(ISO), European (EN), and national standards (e.g., AFNOR, ASTM, BSI, DIN) [1.9,1.10]. Standard analytical methods and conditions of delivery for the most impor-tant inorganic pigments are given in Table 1.1. Further information is given in latersections.
1.2 General Chemical and Physical Properties 13
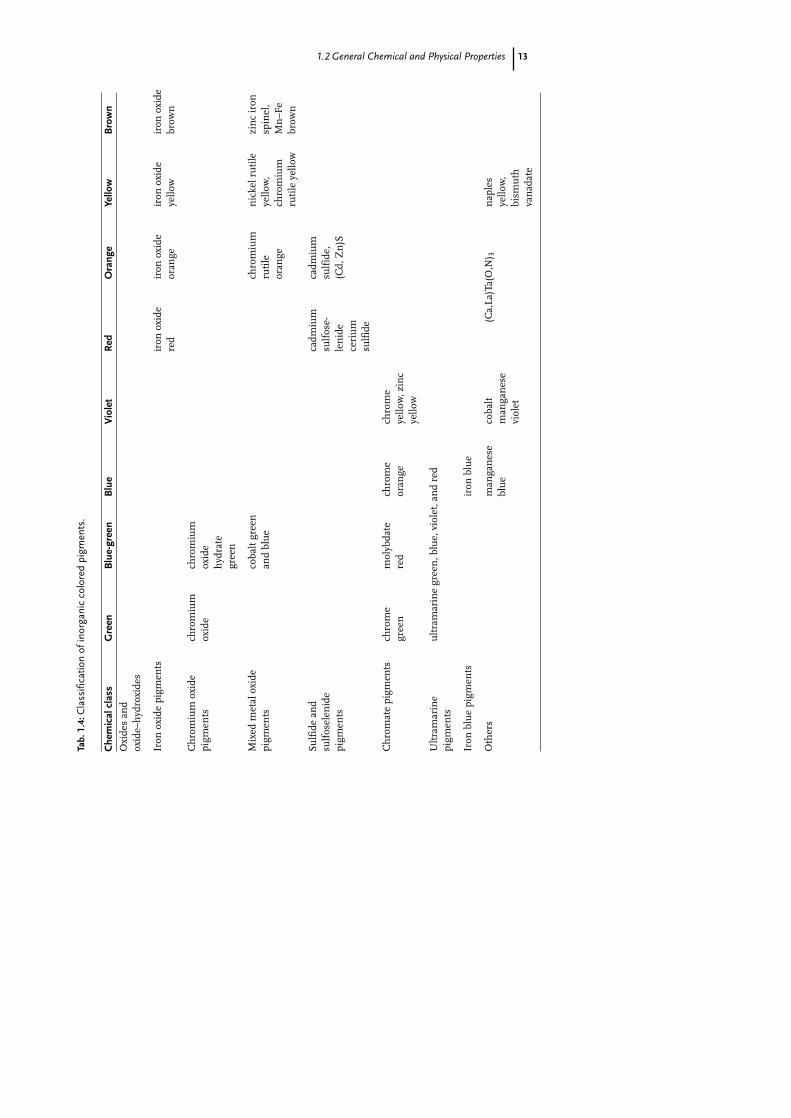
Tab.
1.4:
Cla
ssifi
catio
nof
inor
gani
cco
lore
dpi
gmen
ts.
Che
mic
alcl
ass
Gre
enB
lue-
gree
nB
lue
Vio
let
Red
Ora
nge
Yello
wB
row
n
Oxi
des
and
oxid
e–h
ydro
xide
s
Iron
oxid
epi
gmen
tsir
onox
ide
red
iron
oxid
eor
ange
iron
oxid
eye
llow
iron
oxid
ebr
own
Ch
rom
ium
oxid
epi
gmen
tsch
rom
ium
oxid
ech
rom
ium
oxid
eh
ydra
tegr
een
Mix
edm
etal
oxid
epi
gmen
tsco
balt
gree
nan
dbl
ue
chro
miu
mru
tile
oran
ge
nic
kelr
uti
leye
llow
,ch
rom
ium
ruti
leye
llow
zin
cir
onsp
inel
,M
n–F
ebr
own
Sulf
ide
and
sulf
osel
enid
epi
gmen
ts
cadm
ium
sulf
ose-
len
ide
ceri
um
sulf
ide
cadm
ium
sulf
ide,
(Cd,
Zn
)S
Ch
rom
ate
pigm
ents
chro
me
gree
nm
olyb
date
red
chro
me
oran
gech
rom
eye
llow
,zin
cye
llow
Ult
ram
arin
epi
gmen
tsu
ltra
mar
ine
gree
n,b
lue,
viol
et,a
nd
red
Iron
blu
epi
gmen
tsir
onbl
ue
Oth
ers
man
gan
ese
blu
eco
balt
man
gan
ese
viol
et
(Ca,
La)T
a(O
,N) 3
nap
les
yello
w,
bism
uth
van
adat
e
14 1 Introduction
1.2.1.3
Crystallography and SpectraThe following are the most common crystal classes:
1. Cubic: zinc blend lattice (e.g., precipitated CdS), spinel lattice (e.g., Fe3O4,CoAl2O4)
2. Tetragonal: rutile lattice (e.g., TiO2, SnO2)
3. Rhombic: goethite lattice (e.g., á-FeOOH)
4. Hexagonal: corundum lattice (e.g., á-Fe2O3, á-Cr2O3)
5. Monoclinic: monazite lattice (e.g., PbCrO4)
In ideal solid ionic compounds, the absorption spectrum is composed of the spec-tra of the individual ions, as is the case in ionic solutions. For metal ions with filleds, p, or d orbitals, the first excited energy level is so high that only ultraviolet light canbe absorbed. Thus, when the ligands are oxygen or fluorine, white inorganic com-pounds result. The absorption spectra of the chalcogenides of transition elementswith incompletely filled d and f orbitals are mainly determined by the charge-transferspectrum of the chalcogenide ion, which has a noble gas structure. For the transitionmetals, lanthanides, and actinides, the energy difference between the ground stateand the first excited state is so small that wavelength-dependent excitations take placeon absorption of visible light, leading to colored compounds [1.11].
X-ray investigation of inorganic pigments yields information on the structure, finestructure, state of stress, and lattice defects of the smallest coherent regions that arecapable of existence (i.e. crystallites) and on their size. This information cannot beobtained in any other way. Crystallite size need not be identical with particle size asmeasured by the electron microscope, and can, for example, be closely related to themagnetic properties of the pigment.
1.2.1.4
Particle SizeThe important physical data for inorganic pigments comprise not only optical con-stants, but also geometric data: mean particle size, particle size distribution, andparticle shape [1.12]. The standards used for the terms that are used in this sectionare listed in Table 1.1 (“Particle size analysis”).
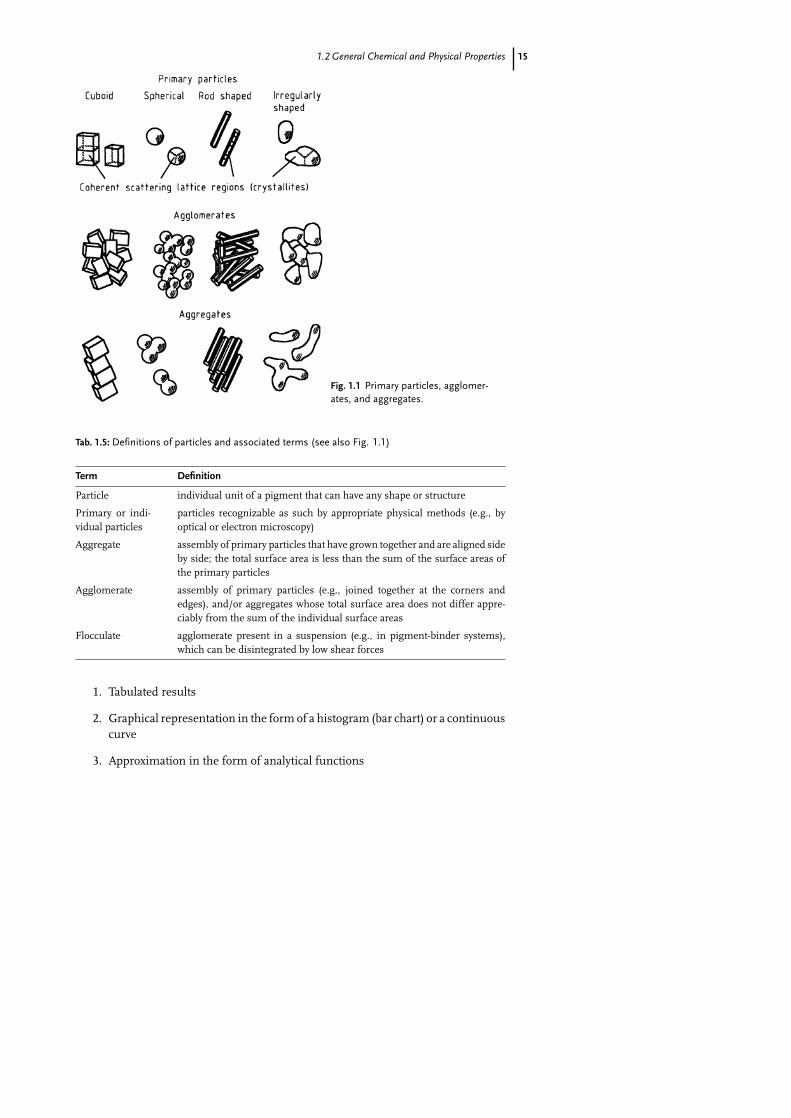
The concept of particles and particle shape corresponds to that used in the recom-mended and internationally accepted classification of pigment particles given in Ref.[1.13] (see Figure 1.1 and Table 1.5).
The term particle size must be used with care, as is borne out by the large numberof different “particle diameters” and other possible terms used to denote size (seeTable 1.6). In granulometry, so-called shape factors are sometimes used to convertequivalent diameters to “true” diameters. However, the determination and use ofshape factors is problematic.
In practice, empirically determined particle size distributions are represented by:
1.2 General Chemical and Physical Properties 15
Fig. 1.1 Primary particles, agglomer-ates, and aggregates.
Tab. 1.5: Definitions of particles and associated terms (see also Fig. 1.1)
Term Definition
Particle individual unit of a pigment that can have any shape or structure
Primary or indi-vidual particles
particles recognizable as such by appropriate physical methods (e.g., byoptical or electron microscopy)
Aggregate assembly of primary particles that have grown together and are aligned sideby side; the total surface area is less than the sum of the surface areas ofthe primary particles
Agglomerate assembly of primary particles (e.g., joined together at the corners andedges), and/or aggregates whose total surface area does not differ appre-ciably from the sum of the individual surface areas
Flocculate agglomerate present in a suspension (e.g., in pigment-binder systems),which can be disintegrated by low shear forces
1. Tabulated results
2. Graphical representation in the form of a histogram (bar chart) or a continuouscurve
3. Approximation in the form of analytical functions
16 1 Introduction
Tab. 1.6: Particle size, particle size distribution, and characteristic quantities
Term Definition
Particle size geometrical value characterizing the spatial state of a particleParticle diameter Deff diameter of a spherical particle or characteristic dimension of a
regularly shaped particleEquivalent diameter D diameter of a particle that is considered as a sphereParticle surface area ST surface area of a particle: a distinction is made between the internal
and external surface areasParticle volume VT volume of a particle: a distinction is made between effective vol-
ume (excluding cavities) and apparent volume (including cavities)Particle mass MT mass of a particleParticle density QT density of a particleParticle size distribution statistical representation of the particle size of a particulate materialDistribution density gives the relative amount of a particulate material in relation to a
given particle size diameter. Density distribution functions mustalways be normalized
Cumulative distribution normalized sum of particles that have a diameter less than a givenparticle size parameter
Fractions and class a fraction is a group of particles that lies between two set values ofthe chosen particle size parameter that limits the class
Mean value and othersimilar parameters
the mean values of particle size parameters can be expressed inmany ways, some values are used frequently in practice
Distribution spread parameter for characterizing the nonuniformity of the particle size
For standards see Table 1.1 “Particle size, representation”. Special distributionfunctions are specified in some standards (e.g., power distribution, logarithmic nor-mal distribution, and RRSB distribution). The representation of particle size distri-butions and methods for their determination are described elsewhere. Methods ofdetermination for pigments are rated in Section 1.2.2.
The important parameters relating to particle size distribution are the mean particlesize and the spread of the distribution. The way of expressing the mean particle sizedepends on the test method used or on which mean value best reflects the pigmentproperty of interest. Depending on the spread of parameter, the various mean valuesfor a given particulate material can differ considerably. The mean particle sizes ofinorganic pigments lie in the range 0.01–10 ìm, and are usually between 0.1 and1 ìm.
The specific surface area also represents a mean of the pigment particle size dis-tribution. It can be used to calculate the mean diameter of the surface distribution.Care must be taken that the effect of the “internal surface area” is taken into account.If the product has an internal surface area, which cannot be neglected in compari-son to the external surface area, then the measured specific surface area no longergives a true measure of the mean diameter. This applies, for instance, to aftertreatedpigments, because the treatment material is often very porous.
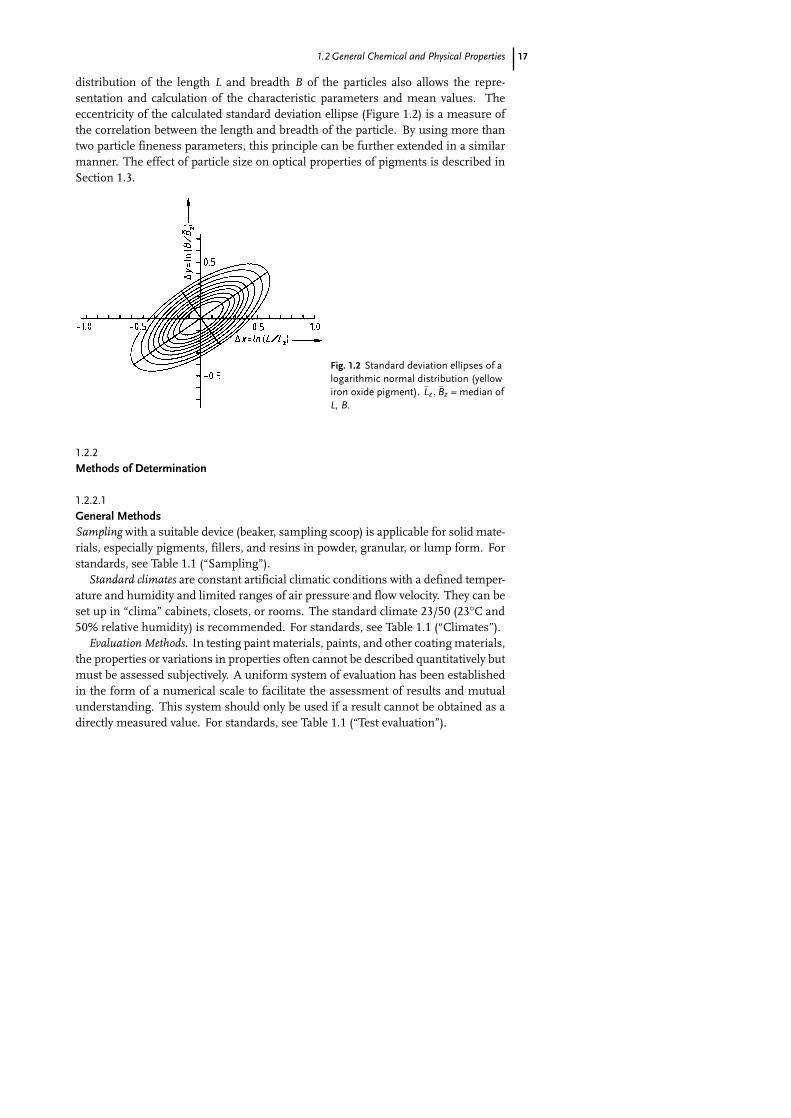
For anisomeric particles (e.g., needle- or platelet-shaped particles) mathematicalstatistics may likewise be applied [1.14]. The two-dimensional logarithmic normal
1.2 General Chemical and Physical Properties 17
distribution of the length L and breadth B of the particles also allows the repre-sentation and calculation of the characteristic parameters and mean values. Theeccentricity of the calculated standard deviation ellipse (Figure 1.2) is a measure ofthe correlation between the length and breadth of the particle. By using more thantwo particle fineness parameters, this principle can be further extended in a similarmanner. The effect of particle size on optical properties of pigments is described inSection 1.3.
Fig. 1.2 Standard deviation ellipses of alogarithmic normal distribution (yellowiron oxide pigment). L̄z, B̄z = median ofL, B.
1.2.2
Methods of Determination
1.2.2.1
General MethodsSampling with a suitable device (beaker, sampling scoop) is applicable for solid mate-rials, especially pigments, fillers, and resins in powder, granular, or lump form. Forstandards, see Table 1.1 (“Sampling”).
Standard climates are constant artificial climatic conditions with a defined temper-ature and humidity and limited ranges of air pressure and flow velocity. They can beset up in “clima” cabinets, closets, or rooms. The standard climate 23/50 (23°C and50% relative humidity) is recommended. For standards, see Table 1.1 (“Climates”).
Evaluation Methods. In testing paint materials, paints, and other coating materials,the properties or variations in properties often cannot be described quantitatively butmust be assessed subjectively. A uniform system of evaluation has been establishedin the form of a numerical scale to facilitate the assessment of results and mutualunderstanding. This system should only be used if a result cannot be obtained as adirectly measured value. For standards, see Table 1.1 (“Test evaluation”).
18 1 Introduction
1.2.2.2
Matter Volatile and Loss on IgnitionThe content of matter volatile in a pigment is determined by drying a sample in an ovenat 105 ± 2°C. This normally gives a measure of the moisture content. For standards,see Table 1.1 (“Matter volatile”).
Loss on ignition is determined by various means, depending on the pigment. Theprinciple is the same in all the methods: a weighed sample is heated to a predeter-mined temperature, cooled in a desiccator, and reweighed. Special standard proce-dures are specified for iron oxide pigments and carbon black. For standards, seeTable 1.1 (“Iron oxide pigments: Specifications” and “Carbon black pigments: Spec-ifications”).
1.2.2.3
Aqueous ExtractsThe content of matter soluble in water in pigments is determined by hot or cold extrac-tion of the pigments under prescribed testing conditions. For standards, see Table1.1 (“Matter soluble in water”). The decision whether to use hot or cold extraction de-pends on the properties of the pigment and should be agreed between the interestedparties unless otherwise prescribed.
The pH value of a pigment denotes the pH of an aqueous suspension of the pig-ment prepared in a prescribed manner. For standards, see Table 1.1 (“pH value”).Apparatus: pH meter.
The electrical conductivity (or resistivity) of an aqueous pigment extract is deter-mined from the electrical conductance (or resistance). For standards, see Table 1.1(“Resistivity”). Apparatus: centrifuge with glass containers, resistance measurementbridge, electrolytic cell.
The acidity or alkalinity is measured as the quantity of cubic centimeters of 0.1 Nalkali (NaOH or KOH) or acid solution that are required to neutralize an aqueousextract of 100 g pigment under prescribed conditions. Unless otherwise agreed, thepigment is extracted with hot water. If cold water is used, this must be specificallystated. For standards, see Table 1.1 (“Acidity/alkalinity”). Test reagents: 0.5 N HClor H2SO4, 0.5 N NaOH or KOH, indicators (by agreement).
Water-soluble Sulfates, Chlorides and Nitrates. The procedures are applicable to pig-ments and extenders. The choice of hot or cold extraction depends on the propertiesof the pigment and should be agreed. The anions are determined by the usual analyt-ical methods. For standards, see Table 1.1 (“Sulfates”, “Chlorides”, and “Nitrates”).Apparatus: Nessler tubes or spectrophotometer, equipment for pH measurement.
Water-Soluble Chromium(VI). Chromium(VI) is determined photometrically in anaqueous extract obtained by hot or cold extraction using the color produced withdiphenylcarbazide, or directly as chromate. For standards, see Table 1.1 (“Mattersoluble in water”). Apparatus: equipment for shaking conical flasks, photometerwith glass cells, pH meter.
Matter Soluble in HCl. The pigment is extracted with 0.1 M hydrochloric acid underprescribed conditions to determine the content of As, Ba, Cd, Co, Cr, Cr(VI), Cu, Hg,
1.2 General Chemical and Physical Properties 19
Mn, Ni, Pb, Sb, Se, and Zn. For standards, see Table 1.1 (“Matter soluble in HCl”).Apparatus: shaker for conical flasks.
1.2.2.4
Particle Size DistributionThe particle sizes relevant for inorganic pigments stretch between several tens ofnanometers for transparent pigment types to approximately two micrometers. Forpractical applications it is very desirable to determine not only the mean particlesize but also the whole distribution. These parameters must not be confused withthe crystal size determined by X-ray diffraction, as pigment particles usually are notmonocrystals.
The determination of the particle size distribution is a complex issue and thesubject of voluminous monographs [1.15] so only an introduction to the questionsrelevant for applications concerning inorganic pigments can be given.
Measuring and counting the particles shown on a suitable electron micrographis the most straightforward means of determination of the particle size distributionof inorganic pigments. The necessary number of particles (2500–10000) rendersthis method too costly and time consuming for day-to-day business, although theprocess can be automated to a certain degree. Another disadvantage is the length oftime for the process, which makes it impossible to apply this method for productioncontrol. An advantage is of course that additional information about particle shapeand morphology can be obtained in this way.
Two methods are mainly used for the determination of particle size of inorganicpigments: Sedimentation methods (centrifuges) and Fraunhofer diffraction withadditional correction due to Mie scattering.
When evaluating the results of these measurements one has to remember thata property of the particles (light scattering or the velocity of sedimentation) is de-termined. With models relying on a number of assumptions (for example that allparticles are spherical) and further input (for example the complex index of refractionor the density) the particle size distribution is calculated in the final step. Applyingthe results of the measurement this and other deviations from the model have to betaken into account. Different measurement techniques usually result in differentresults for the measurements of particle size distributions.
The main advantage of centrifuges is the high resolution these instruments usu-ally deliver, making it possible to differentiate between particle sizes that are veryclosely spaced. Instruments using Fraunhofer diffraction with Mie correction havefound wide use in the industry during the last decade. They can make fast and veryreproducible measurements while being able to determine particle sizes between0.05 and 1500 ìm, although it seems that the lower range cannot be reached with allsubstances. An advantage is that these instruments can also be used with fluidizedsamples and can determine the particle size distribution of dry powders.
While using a dilute suspension in a pump-through cell there is the possibilityto determine even particles far from the main distribution, present only in minoramounts, with high precision. This makes it possible to catch the particles severaltimes, resulting in good reproducibility of the measurement result.
20 1 Introduction
As stated above these instruments need the complex index of refraction at all thewavelengths used by the instrument. Most types apply only a single wavelength butthere are also instruments available which make use of four different wavelengths.While this can be advantageous with respect to the resolution of the instrument itshould be ascertained that the index of refraction is known with sufficient certaintyfor the materials to be measured.
Furthermore it should be proven in every case and for every instrument that theresults are independent of the remnant error in this and every other input parameter.One of the most important topics regarding the particle size distribution is samplepreparation and dispersion. The dispersion process typically generates most of theparticles determined in the measurement.
The dispersion procedure must reflect the conditions that the particles are sub-jected to in the application considered for the substances. In practice the task isoften not to determine the mean particle size of a pigment, but to analyze problemsoccurring in an application.
As pigments are most often used in paints and varnishes a dispersion with a highenergetic input should be used if not otherwise stated. This can conceal effectsoccurring at lower energy levels as, for example, more agglomerates can be brokenup. A common feature of both instrument types mentioned above is the use of avery dilute solution. The exact concentration is dependent on the specific type ofinstrument used, as well as on the material and particle size to be measured, but isnearly always below 1% (weight).
Although the effect of the concentration of suspension on the results of the mea-surement of pigments has never been proven, the development of techniques able tocope with concentrations closer to the applications if of interest. These would make itpossible, for example, to determine the particle size distribution in a dispersion paintor in a reaction vessel where a pigment is produced by the precipitation process. Ameasurement technique having no problems, in principle, with high concentrationdispersions is the scattering of ultrasonic waves. Nevertheless the instruments onthe market have up to now failed to realize the great expectations of this technique.
Sieve Analysis. The sieving residue can be determined by two methods:
1. Wet Sieving by Hand. In the utilization of pigments, it is important to knowthe content of pigment particles that are appreciably larger than the mean par-ticle size. This material can consist of coarse impurities, pigment aggregates(agglomerates), or large primary particles. The dried pigment is washed withwater through a sieve of the appropriate mesh size, and the retained material isdetermined gravimetrically after drying. For standards, see Table 1.1 (“Residueon sieve: By water”).
2. Wet Sieving by a Mechanical Flushing Procedure. The sieve residue is the portionof coarse particles that cannot be washed through a specified test sieve withwater. The result depends on the mesh size of the sieve. For standards, seeTable 1.1 (“Residue on sieve: Mechanical method”). Apparatus: Mocker’sapparatus.
1.2 General Chemical and Physical Properties 21
Additionally, wet sieving down to a mesh size of 5 ìm can be realized by applyingspecial sieves of pure nickel membranes. The material is fluidized in an ultrasonicbath.
The specific surface is usually understood to mean the area per unit mass of the solidmaterial, but it is sometimes useful to relate the surface area to the volume of thesolid (see Section 1.2.1). The specific surface area can only be determined indirectlyowing to the small size of the pigment particles:
1. Gas Adsorption by the Brunauer, Emmett, and Teller (BET) Method. The specificsurface area of porous or finely divided solids is measured. The method is limitedto solids that do not react with the gas used (e.g., while the gas is adsorbed), andnonmicroporous materials. For standards, see Table 1.1 (“Specific Surface, BETMethod” and “N2 Adsorption”).
2. Carman’s Gas Permeability Method. A gas or a wetting liquid is made to flowthrough the porous material in a tube by applying vacuum or pressure. The pressuredrop or flow rate is measured. For pigments, a modified procedure is used in whichmainly nonlaminar flow takes place [1.16]. For standards, see Table 1.1 (“Specificsurface: Permeability techniques”).
1.2.2.5
Pigment DensityDensity is determined by pyknometry at a standard temperature of 25°C. For stan-dards, see Table 1.1 (“Density”). Apparatus: pyknometer, vacuum pump or cen-trifuge.
The apparent density of a powdered or granulated material after tamping is the mass(g) of 1 cm3 of the material after tamping in a tamping volumeter under prescribedconditions. The tamped volume is the volume (cm3) of 1 g of the material. Tampedvolume and apparent density after tamping depend mainly on the true density, shape,and size of the particles. Knowledge of these parameters allows decisions to be maderegarding dimensions of packing materials and product uniformity. For standards,see Table 1.1 (“Tamped volume”). Apparatus: tamping volumeter.
1.2.2.6
Hardness and AbrasivenessThe abrasiveness of a pigment is not identical to its intrinsic hardness, i.e., thehardness of its primary particles. In practice the Mohs hardness is therefore nota useful indication of the abrasiveness of a pigment. Abrasion rather depends onpigment particle size and shape and is usually caused by the sharp edges of theparticles. A standard test procedure for determining abrasiveness does not exist. Amethod based on the abrasion of steel balls by the pigment is described in Ref. [1.17].
22 1 Introduction
1.3
Color Properties
1.3.1
Fundamental Aspects [1.18–1.22]
When a photon enters a pigmented film, one of three events may occur:
1. It may be absorbed by a pigment particle
2. It may be scattered by a pigment particle
3. It may simply pass through the film (the binder being assumed to be nonab-sorbent)
The important physical-optical properties of pigments are therefore their light-absorption and light-scattering properties. If absorption is very small compared withscattering, the pigment is a white pigment. If absorption is much higher than scat-tering over the entire visible region, the pigment is a black pigment. In a coloredpigment, absorption (and usually scattering) is selective (i.e., dependent on wave-length).
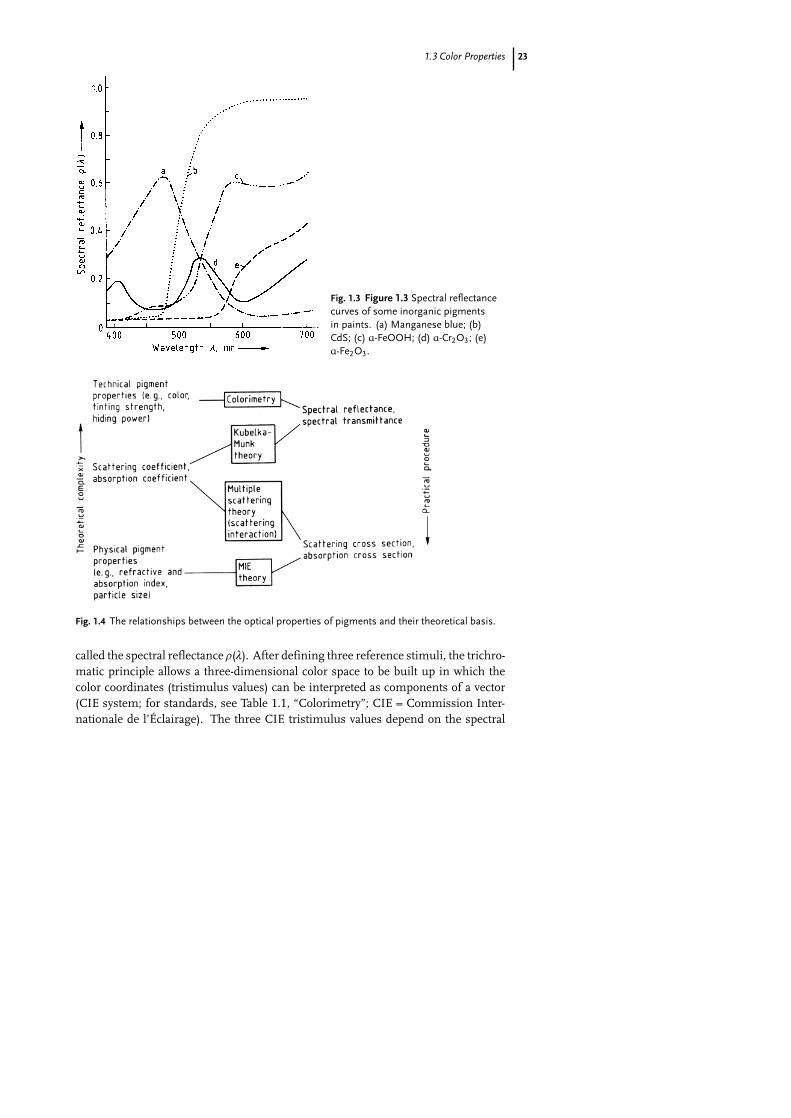
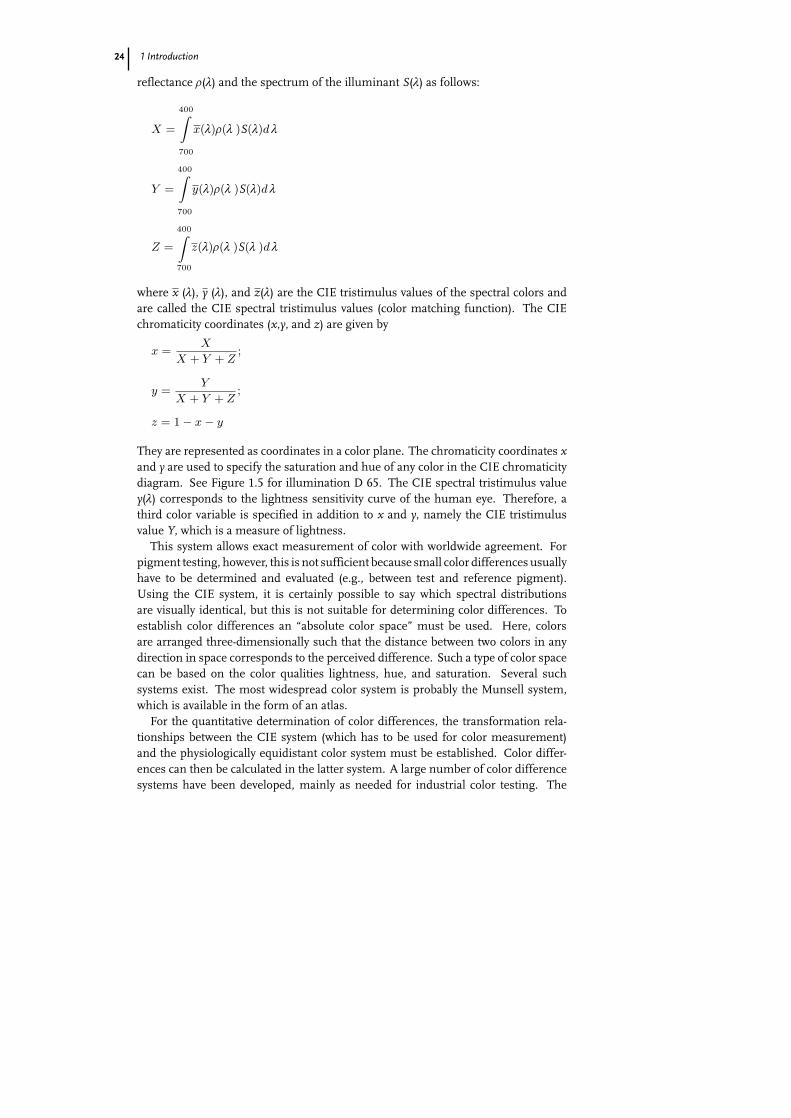
Pigments and coatings may be unambiguously characterized by their spectral re-flectance curves ñ(ë) or spectral reflectance factor curves R(ë) (Figure 1.3). The re-flectance spectrum ñ(ë) or R(ë) and hence the color properties can be almost com-pletely derived from physical quantities [1.21] (Figure 1.4):
1. Colorimetry relates the perceived color quality to the color stimulus, which inturn is based on the reflectance spectrum ñ(ë).
2. The Kubelka–Munk theory relates ñ(ë) to scattering, absorption, and film thick-ness (scattering coefficient S, absorption coefficient K, film thickness h).
3. The theory of multiple scattering (scattering interaction) relates the scatteringcoefficient S to the pigment volume concentration ó and to the scatteringdiameter QS of the individual particle. The absorption coefficient K is directlyproportional to the absorption diameter QA and the concentration ó.
4. In Mie’s theory, the scattering diameter QS and the absorption diameter QA arerelated to the particle size D, the wavelength ë, and the optical constants of thematerial (refractive index n and absorption index ê).
1.3.1.1
Colorimetry [1.23–1.25]The principles of colorimetry are based on the fact that all color stimuli can be sim-ulated by additively mixing only three selected color stimuli (trichromatic principle).A color stimulus can, however, also be produced by mixing the spectral colors. Thus,it has a spectral distribution, which in the case of nonluminous, perceived colors is
1.3 Color Properties 23
Fig. 1.3 Figure 1.3 Spectral reflectancecurves of some inorganic pigmentsin paints. (a) Manganese blue; (b)CdS; (c) á-FeOOH; (d) á-Cr2O3; (e)á-Fe2O3.
Fig. 1.4 The relationships between the optical properties of pigments and their theoretical basis.
called the spectral reflectance ñ(ë). After defining three reference stimuli, the trichro-matic principle allows a three-dimensional color space to be built up in which thecolor coordinates (tristimulus values) can be interpreted as components of a vector(CIE system; for standards, see Table 1.1, “Colorimetry”; CIE = Commission Inter-nationale de l’Éclairage). The three CIE tristimulus values depend on the spectral
24 1 Introduction
reflectance ñ(ë) and the spectrum of the illuminant S(ë) as follows:
X =
400∫
700
x(ë)ñ(ë )S(ë)d ë
Y =
400∫
700
y(ë)ñ(ë )S(ë)d ë
Z =
400∫
700
z(ë)ñ(ë )S(ë )d ë
where x (ë), y (ë), and z(ë) are the CIE tristimulus values of the spectral colors andare called the CIE spectral tristimulus values (color matching function). The CIEchromaticity coordinates (x,y, and z) are given by
x =X
X + Y + Z;
y =Y
X + Y + Z;
z = 1 − x − y
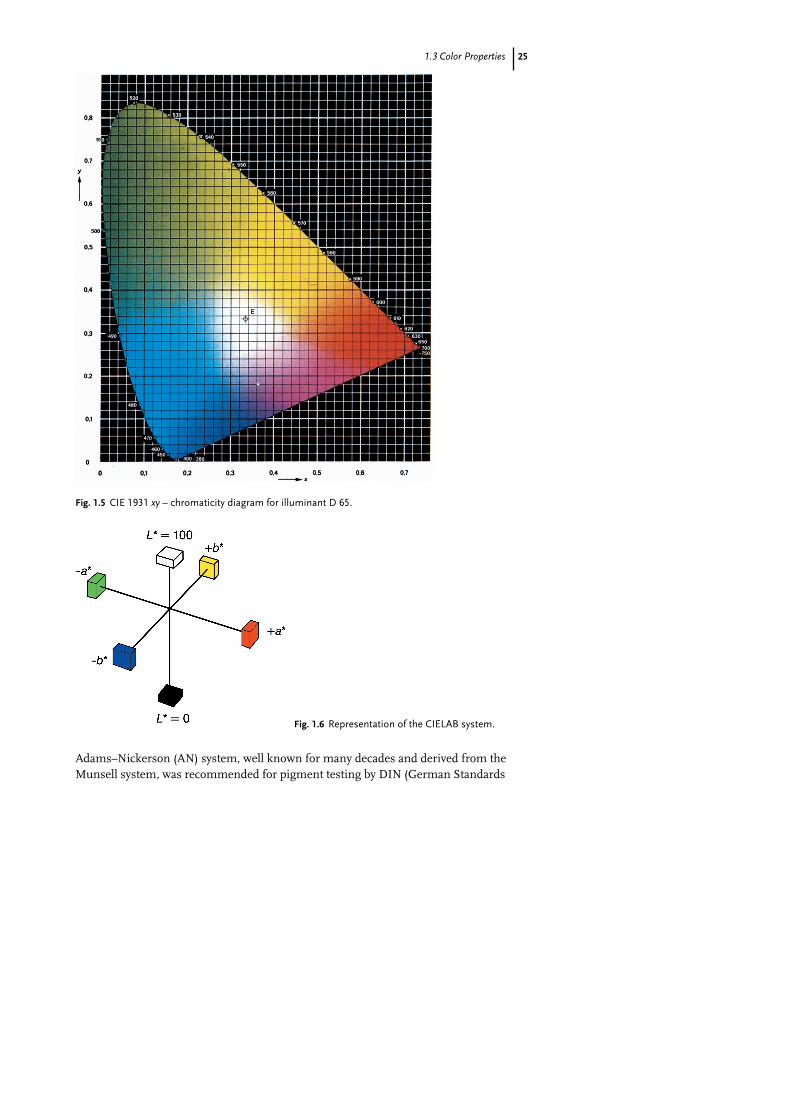
They are represented as coordinates in a color plane. The chromaticity coordinates xand y are used to specify the saturation and hue of any color in the CIE chromaticitydiagram. See Figure 1.5 for illumination D 65. The CIE spectral tristimulus valuey(ë) corresponds to the lightness sensitivity curve of the human eye. Therefore, athird color variable is specified in addition to x and y, namely the CIE tristimulusvalue Y, which is a measure of lightness.
This system allows exact measurement of color with worldwide agreement. Forpigment testing, however, this is not sufficient because small color differences usuallyhave to be determined and evaluated (e.g., between test and reference pigment).Using the CIE system, it is certainly possible to say which spectral distributionsare visually identical, but this is not suitable for determining color differences. Toestablish color differences an “absolute color space” must be used. Here, colorsare arranged three-dimensionally such that the distance between two colors in anydirection in space corresponds to the perceived difference. Such a type of color spacecan be based on the color qualities lightness, hue, and saturation. Several suchsystems exist. The most widespread color system is probably the Munsell system,which is available in the form of an atlas.
For the quantitative determination of color differences, the transformation rela-tionships between the CIE system (which has to be used for color measurement)and the physiologically equidistant color system must be established. Color differ-ences can then be calculated in the latter system. A large number of color differencesystems have been developed, mainly as needed for industrial color testing. The
1.3 Color Properties 25
Fig. 1.5 CIE 1931 xy – chromaticity diagram for illuminant D 65.
Fig. 1.6 Representation of the CIELAB system.
Adams–Nickerson (AN) system, well known for many decades and derived from theMunsell system, was recommended for pigment testing by DIN (German Standards
26 1 Introduction
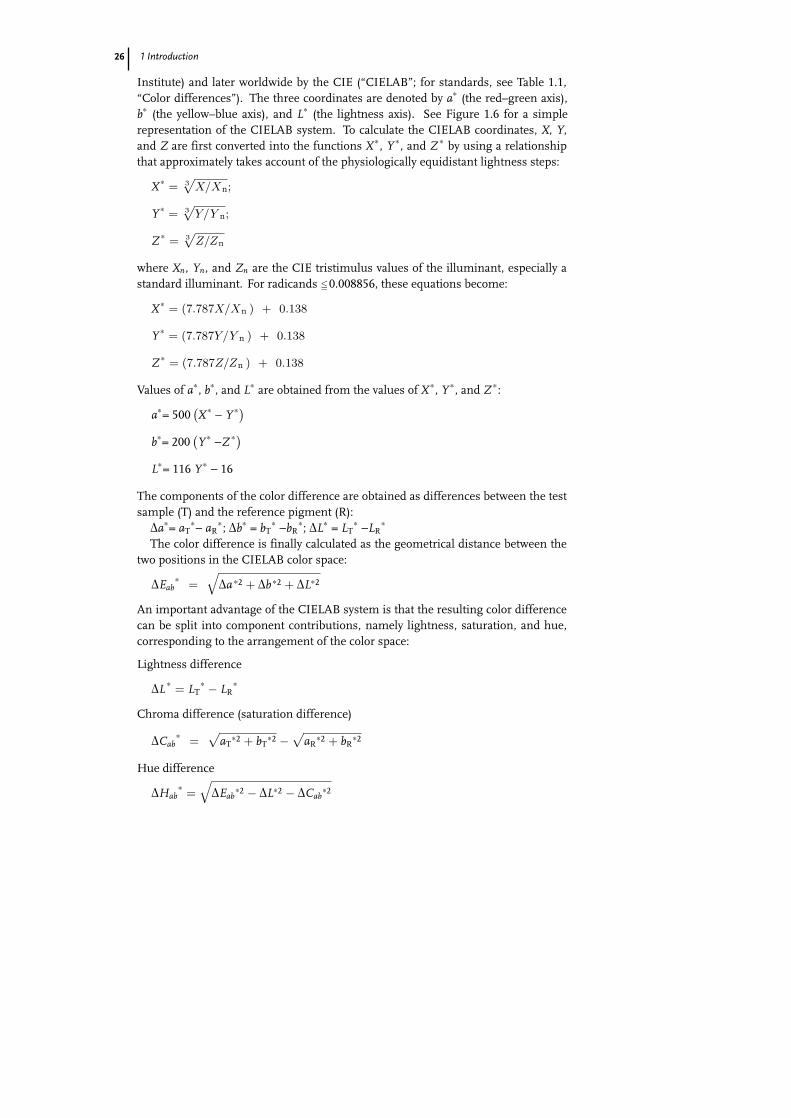
Institute) and later worldwide by the CIE (“CIELAB”; for standards, see Table 1.1,“Color differences”). The three coordinates are denoted by a∗ (the red–green axis),b∗ (the yellow–blue axis), and L∗ (the lightness axis). See Figure 1.6 for a simplerepresentation of the CIELAB system. To calculate the CIELAB coordinates, X, Y,and Z are first converted into the functions X ∗, Y ∗, and Z ∗ by using a relationshipthat approximately takes account of the physiologically equidistant lightness steps:
X ∗ = 3√
X/Xn;
Y ∗ = 3√
Y/Y n;
Z ∗ = 3√
Z/Zn
where Xn, Yn, and Zn are the CIE tristimulus values of the illuminant, especially astandard illuminant. For radicands �0.008856, these equations become:
X ∗ = (7.787X/Xn ) + 0.138
Y ∗ = (7.787Y/Y n ) + 0.138
Z ∗ = (7.787Z/Zn ) + 0.138
Values of a∗, b∗, and L∗ are obtained from the values of X ∗, Y ∗, and Z ∗:
a∗= 500(X ∗ − Y ∗)
b∗= 200(Y ∗ −Z ∗)
L∗= 116 Y ∗ − 16
The components of the color difference are obtained as differences between the testsample (T) and the reference pigment (R):
Äa∗= aT∗− aR
∗; Äb∗ = bT∗ −bR
∗; ÄL∗ = LT∗ −LR
∗
The color difference is finally calculated as the geometrical distance between thetwo positions in the CIELAB color space:
ÄEab∗ =
√Äa ∗2 + Äb ∗2 + ÄL∗2
An important advantage of the CIELAB system is that the resulting color differencecan be split into component contributions, namely lightness, saturation, and hue,corresponding to the arrangement of the color space:
Lightness difference
ÄL ∗ = LT∗ − LR
∗
Chroma difference (saturation difference)
ÄCab∗ =
√aT
∗2 + bT∗2 −
√aR
∗2 + bR∗2
Hue difference
ÄHab∗ =
ÀEab
∗2 − ÄL∗2 − ÄCab∗2
1.3 Color Properties 27
In 1994 the CIE proposed a modified formula called “CIE94”. This formula is to betested by interested laboratories [1.26].
1.3.1.2
Kubelka–Munk TheoryThe Kubelka–Munk theory [1.25, 1.27, 1.28] is based on the fact that the optical prop-erties of a film which absorbs and scatters light may be described by two constants:the absorption coefficient K and the scattering coefficient S. In a simplification, theflux of the diffuse incident light is represented by a single beam L+, and the flux ofthe light scattered in the opposite direction by a beam L−. Each beam is attenuatedby absorption and scattering losses, but is reinforced by the scattering losses of therespectively opposite beam. The absorption and scattering losses are determinedquantitatively by the two coefficients K and S. A simple system of two linked dif-ferential equations can be written. These can be integrated for the valid boundaryconditions at the incident light side, and at the opposite side. Solutions for the trans-mittance ô and the reflectance ñ are obtained from these integrals as a function ofthe absorption coefficient K, the scattering coefficient S, the film thickness h, and inspecial cases of the reflectance ño of a given substrate.
The most important and widely used quantity derived from the Kubelka–Munktheory is the reflectance of an opaque (infinitely thick) film that is described by a verysimple equation:
K/S = (1 − ñ∞) 2/ (2ñ∞)
From this expression (Kubelka–Munk function) it follows that, within the range ofvalidity of the theory, ñ ∞ depends only on the ratio of the absorption coefficient tothe scattering coefficient, and not on their individual values. The equation has beenmost useful where reflectance measurements are used to obtain information aboutabsorption and scattering (e.g., in textile dyeing, thin layer chromatography, and IRspectroscopy).
This theory is especially useful for computer color matching of pigmented systems[1.25, 1.29–1.31]: absorption and scattering coefficients are combined additively usingthe specific coefficients of the components multiplied by their concentrations.
1.3.1.3
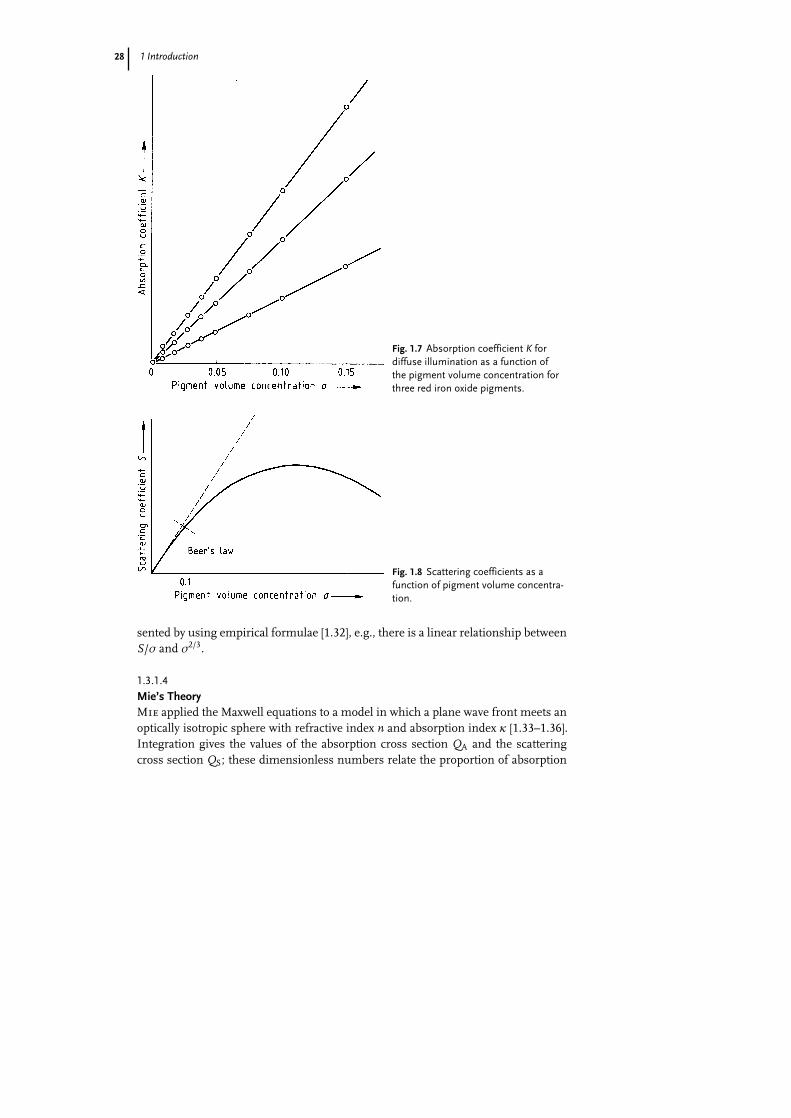
Multiple ScatteringThe absorption coefficient K obeys Beer’s law, even at high pigment volume concen-trations ó, and is therefore proportional to ó (Figure 1.7). The relationship betweenthe scattering coefficient S and the concentration gives rise to problems, however.The distance between the pigment particles decreases with increasing concentration;consequently there is interaction and hindrance between the light scattered by indi-vidual particles, and their scattering power usually falls. The scattering coefficient Sis therefore linearly related to concentration only at low concentrations (the Beer’s lawregion), at higher concentrations it remains below the linear value (Figure 1.8). Theconcentration dependence of the scattering coefficient can be quantitatively repre-
28 1 Introduction
Fig. 1.7 Absorption coefficient K fordiffuse illumination as a function ofthe pigment volume concentration forthree red iron oxide pigments.
Fig. 1.8 Scattering coefficients as afunction of pigment volume concentra-tion.
sented by using empirical formulae [1.32], e.g., there is a linear relationship betweenS/ó and ó2/3.
1.3.1.4
Mie’s TheoryMie applied the Maxwell equations to a model in which a plane wave front meets anoptically isotropic sphere with refractive index n and absorption index ê [1.33–1.36].Integration gives the values of the absorption cross section QA and the scatteringcross section QS; these dimensionless numbers relate the proportion of absorption
1.3 Color Properties 29
and scattering to the geometric diameter of the particle. The theory has provideduseful insights into the effect of particle size on the color properties of pigments.
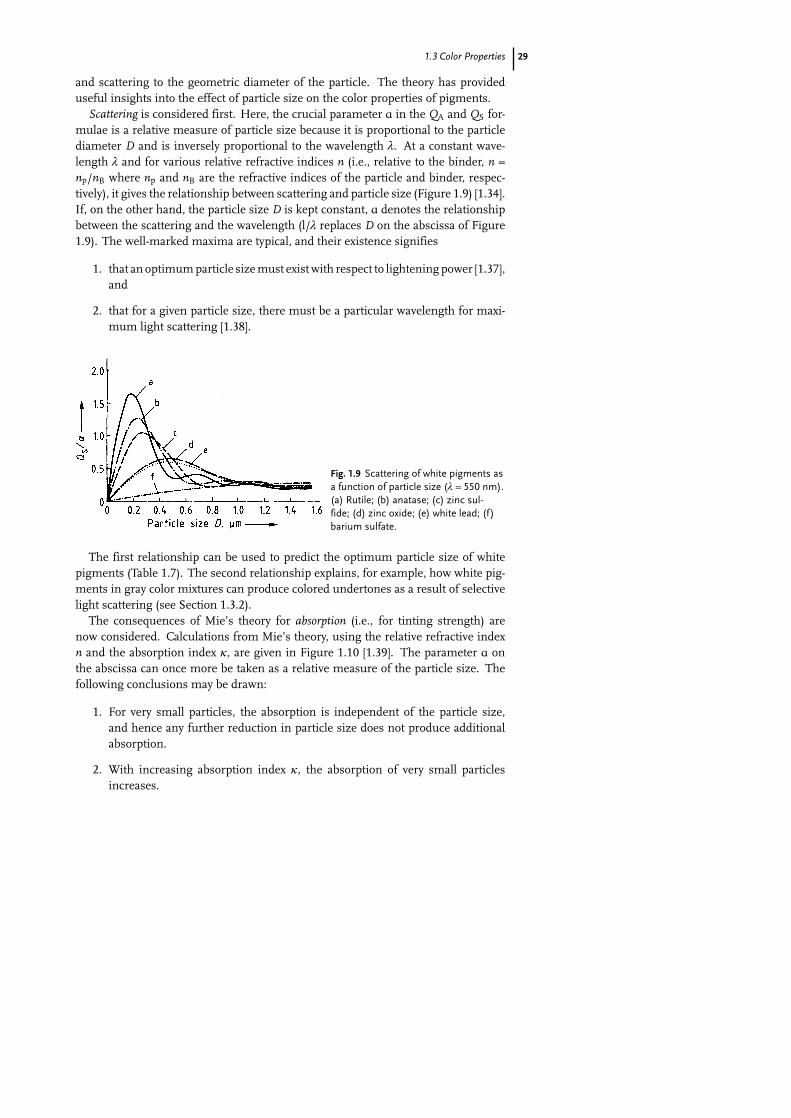
Scattering is considered first. Here, the crucial parameter á in the QA and QS for-mulae is a relative measure of particle size because it is proportional to the particlediameter D and is inversely proportional to the wavelength ë. At a constant wave-length ë and for various relative refractive indices n (i.e., relative to the binder, n =np/nB where np and nB are the refractive indices of the particle and binder, respec-tively), it gives the relationship between scattering and particle size (Figure 1.9) [1.34].If, on the other hand, the particle size D is kept constant, á denotes the relationshipbetween the scattering and the wavelength (l/ë replaces D on the abscissa of Figure1.9). The well-marked maxima are typical, and their existence signifies
1. that an optimum particle size must exist with respect to lightening power [1.37],and
2. that for a given particle size, there must be a particular wavelength for maxi-mum light scattering [1.38].
Fig. 1.9 Scattering of white pigments asa function of particle size (ë = 550 nm).(a) Rutile; (b) anatase; (c) zinc sul-fide; (d) zinc oxide; (e) white lead; (f)barium sulfate.
The first relationship can be used to predict the optimum particle size of whitepigments (Table 1.7). The second relationship explains, for example, how white pig-ments in gray color mixtures can produce colored undertones as a result of selectivelight scattering (see Section 1.3.2).
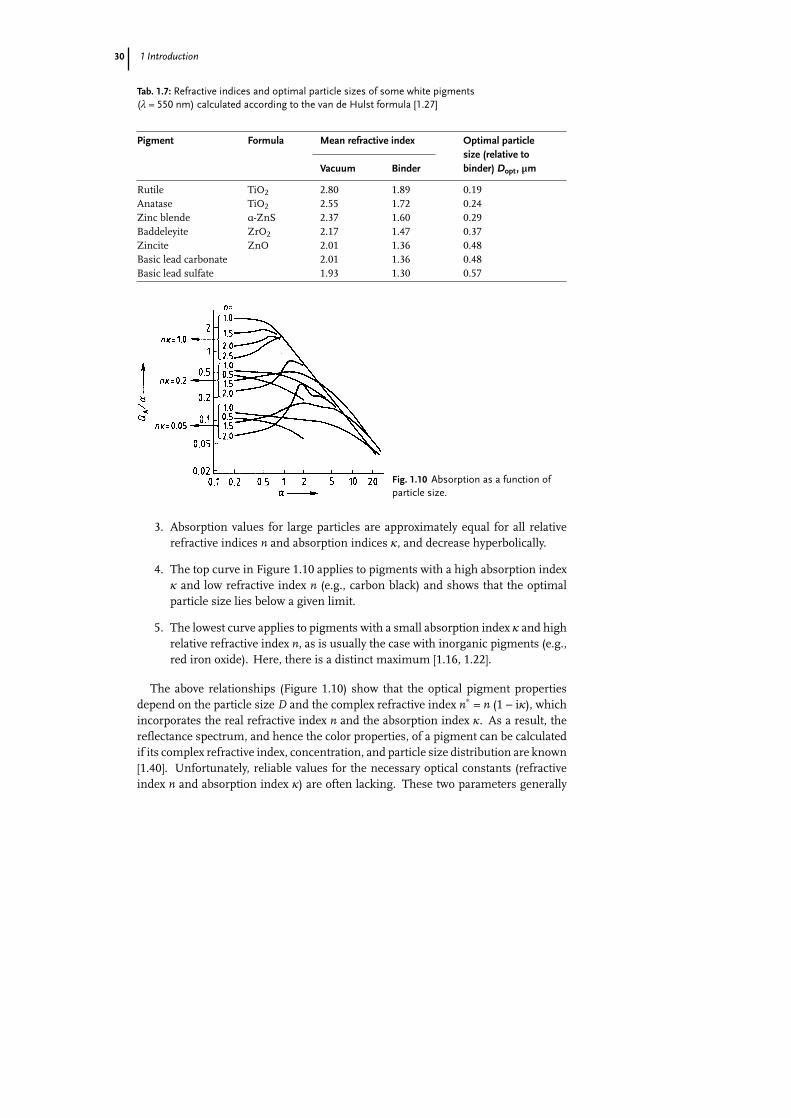
The consequences of Mie’s theory for absorption (i.e., for tinting strength) arenow considered. Calculations from Mie’s theory, using the relative refractive indexn and the absorption index ê, are given in Figure 1.10 [1.39]. The parameter á onthe abscissa can once more be taken as a relative measure of the particle size. Thefollowing conclusions may be drawn:
1. For very small particles, the absorption is independent of the particle size,and hence any further reduction in particle size does not produce additionalabsorption.
2. With increasing absorption index ê, the absorption of very small particlesincreases.
30 1 Introduction
Tab. 1.7: Refractive indices and optimal particle sizes of some white pigments(ë = 550 nm) calculated according to the van de Hulst formula [1.27]
Pigment Formula Mean refractive index Optimal particlesize (relative tobinder) Dopt, ìmVacuum Binder
Rutile TiO2 2.80 1.89 0.19Anatase TiO2 2.55 1.72 0.24Zinc blende á-ZnS 2.37 1.60 0.29Baddeleyite ZrO2 2.17 1.47 0.37Zincite ZnO 2.01 1.36 0.48Basic lead carbonate 2.01 1.36 0.48Basic lead sulfate 1.93 1.30 0.57
Fig. 1.10 Absorption as a function ofparticle size.
3. Absorption values for large particles are approximately equal for all relativerefractive indices n and absorption indices ê, and decrease hyperbolically.
4. The top curve in Figure 1.10 applies to pigments with a high absorption indexê and low refractive index n (e.g., carbon black) and shows that the optimalparticle size lies below a given limit.
5. The lowest curve applies to pigments with a small absorption index ê and highrelative refractive index n, as is usually the case with inorganic pigments (e.g.,red iron oxide). Here, there is a distinct maximum [1.16, 1.22].
The above relationships (Figure 1.10) show that the optical pigment propertiesdepend on the particle size D and the complex refractive index n∗ = n (1 − iê), whichincorporates the real refractive index n and the absorption index ê. As a result, thereflectance spectrum, and hence the color properties, of a pigment can be calculatedif its complex refractive index, concentration, and particle size distribution are known[1.40]. Unfortunately, reliable values for the necessary optical constants (refractiveindex n and absorption index ê) are often lacking. These two parameters generally
1.3 Color Properties 31
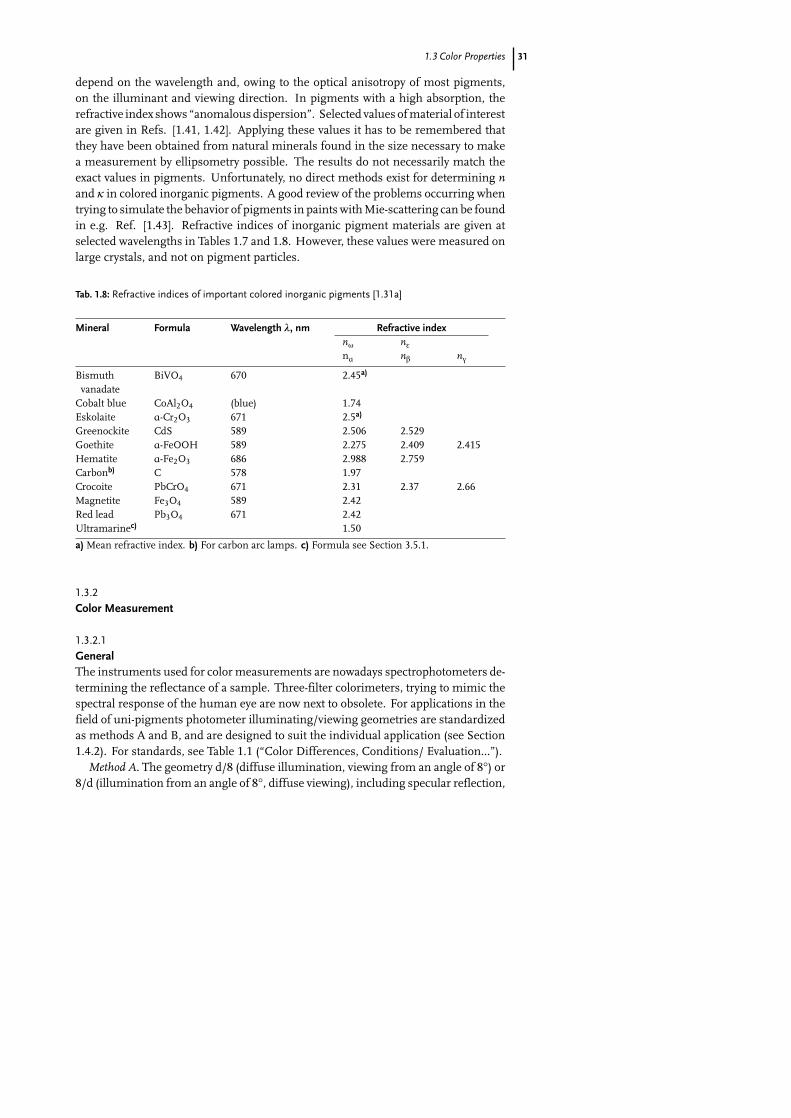
depend on the wavelength and, owing to the optical anisotropy of most pigments,on the illuminant and viewing direction. In pigments with a high absorption, therefractive index shows “anomalous dispersion”. Selected values of material of interestare given in Refs. [1.41, 1.42]. Applying these values it has to be remembered thatthey have been obtained from natural minerals found in the size necessary to makea measurement by ellipsometry possible. The results do not necessarily match theexact values in pigments. Unfortunately, no direct methods exist for determining nand ê in colored inorganic pigments. A good review of the problems occurring whentrying to simulate the behavior of pigments in paints with Mie-scattering can be foundin e.g. Ref. [1.43]. Refractive indices of inorganic pigment materials are given atselected wavelengths in Tables 1.7 and 1.8. However, these values were measured onlarge crystals, and not on pigment particles.
Tab. 1.8: Refractive indices of important colored inorganic pigments [1.31a]
Mineral Formula Wavelength ë, nm Refractive indexnù nå
ná nâ nã
Bismuth BiVO4 670 2.45a)
vanadateCobalt blue CoAl2O4 (blue) 1.74Eskolaite á-Cr2O3 671 2.5a)
Greenockite CdS 589 2.506 2.529Goethite á-FeOOH 589 2.275 2.409 2.415Hematite á-Fe2O3 686 2.988 2.759Carbonb) C 578 1.97Crocoite PbCrO4 671 2.31 2.37 2.66Magnetite Fe3O4 589 2.42Red lead Pb3O4 671 2.42Ultramarinec) 1.50
a) Mean refractive index. b) For carbon arc lamps. c) Formula see Section 3.5.1.
1.3.2
Color Measurement
1.3.2.1
GeneralThe instruments used for color measurements are nowadays spectrophotometers de-termining the reflectance of a sample. Three-filter colorimeters, trying to mimic thespectral response of the human eye are now next to obsolete. For applications in thefield of uni-pigments photometer illuminating/viewing geometries are standardizedas methods A and B, and are designed to suit the individual application (see Section1.4.2). For standards, see Table 1.1 (“Color Differences, Conditions/ Evaluation...”).
Method A. The geometry d/8 (diffuse illumination, viewing from an angle of 8°) or8/d (illumination from an angle of 8°, diffuse viewing), including specular reflection,
32 1 Introduction
enables total surface reflection and reflection from the interior of a sample to bemeasured. An amount representing the surface reflection has to be subtracted fromthe measured value. Thus, measured color variations can be ascribed to differencesor changes of the colorants in the interior of the sample.
Method B. Here, color differences in samples are evaluated in almost the same wayas in visual evaluation by exclusion of gloss effects. Suitable geometries are d/8, d/0,8/d, and 0/d with a gloss trap, and 45/0 and 0/45.
After the color of the sample and reference pigments has been measured, colordifferences are usually calculated by transformation of the X,Y, and Z values intothe CIELAB system to calculate color differences. Color measurement results ofblack and white pigments can be expressed more simply because they only amountto a determination of the relative color undertone. For this, the environment of thereference pigment is divided into eight sectors, these being filled with color namesfrom “red” to “violet”. The octant in which the CIELAB color position of the sampleis located is found by calculation.
When colored or black systems are reduced with white pigments, an undertone isobserved, which is a particle-size effect of the white pigment (see Section 1.3.1). Theseundertones can be conveniently expressed as CIELAB color differences. The effectscan, however, also be measured by using the difference Rz-Rx between the valuesobtained with the blue and red reflectometer values. The undertone measured inthis way depends on the lightness, and has a maximum at Y = 41.4. The lightnessof a gray paste should therefore have this value to ensure that undertone differencesbetween white pigments are comparable [1.44, 1.45].
Measured color differences are only true (i.e., significant) when they are not fal-sified by measuring errors. A significance test standard (see Table 1.1, “Color differ-ences, significance”) has been developed to check this [1.45]. The numerical value ofa color difference must be higher than a critical value, which is statistically calculatedusing the standard deviation.
Problems concerning the acceptance (tolerance) of color differences (e.g., in pro-duction quality control or in computer color matching) should also be solved bymathematical statistics [1.22].
The gloss of pigmented coatings is not a true pigment property. The pigment can,however, influence the luster quality, mainly via its dispersing properties (see Section1.5.2). The degree of gloss of a coating can range from high gloss (specular reflection)to an ideally matt surface (complete scattering). Gloss haze is due to a disturbanceof specular reflection: the reflected objects appear as if seen through a veil, this iscaused by halation effects. Gloss retention is discussed in Section 1.4.1; a methodof gloss measurement is described in Section 1.4.2. Special problems arise in themeasurement of black [1.46] and fluorescent pigments [1.47].
1.3.2.2
Methods of DeterminationLightness. The white pigment powder is compressed in a suitable powder press to givean even, matt surface. The CIE tristimulus value Y is measured with color measuring
1.3 Color Properties 33
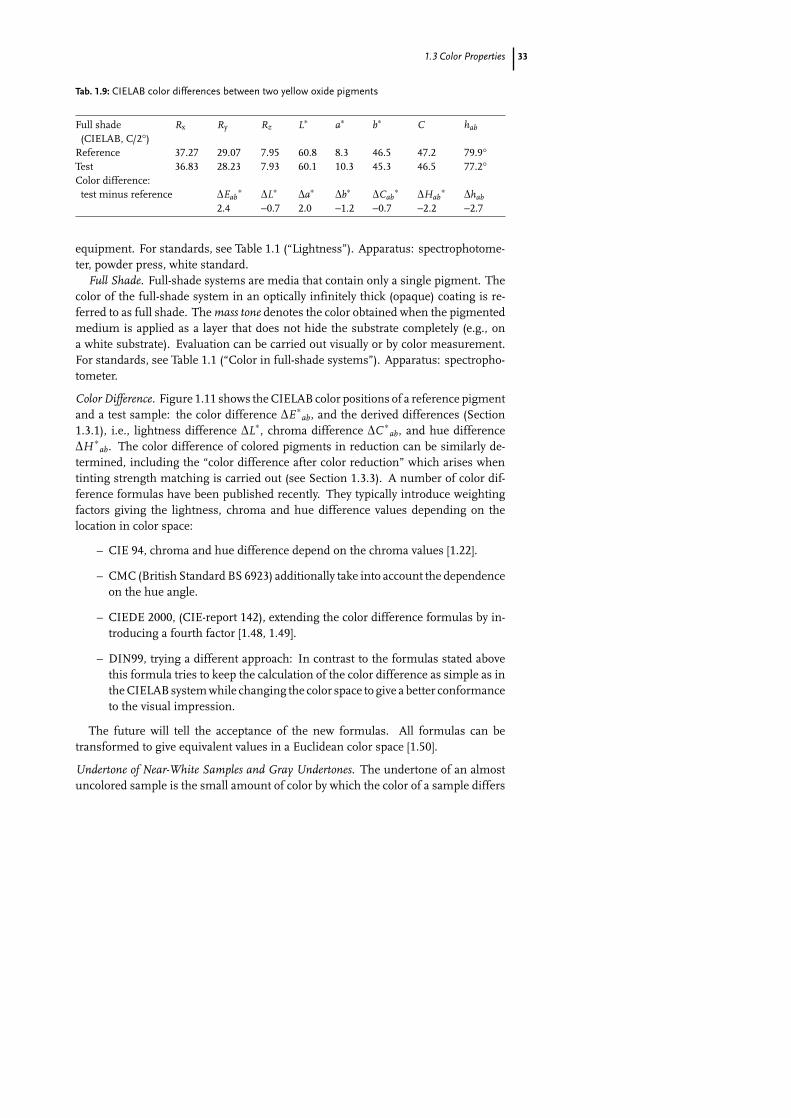
Tab. 1.9: CIELAB color differences between two yellow oxide pigments
Full shade Rx Ry Rz L∗ a∗ b∗ C hab
(CIELAB, C/2°)Reference 37.27 29.07 7.95 60.8 8.3 46.5 47.2 79.9°Test 36.83 28.23 7.93 60.1 10.3 45.3 46.5 77.2°Color difference:
test minus reference ÄEab∗ ÄL∗ Äa∗ Äb∗ ÄCab
∗ ÄHab∗ Ähab
2.4 −0.7 2.0 −1.2 −0.7 −2.2 −2.7
equipment. For standards, see Table 1.1 (“Lightness”). Apparatus: spectrophotome-ter, powder press, white standard.
Full Shade. Full-shade systems are media that contain only a single pigment. Thecolor of the full-shade system in an optically infinitely thick (opaque) coating is re-ferred to as full shade. The mass tone denotes the color obtained when the pigmentedmedium is applied as a layer that does not hide the substrate completely (e.g., ona white substrate). Evaluation can be carried out visually or by color measurement.For standards, see Table 1.1 (“Color in full-shade systems”). Apparatus: spectropho-tometer.
Color Difference. Figure 1.11 shows the CIELAB color positions of a reference pigmentand a test sample: the color difference ÄE ∗
ab, and the derived differences (Section1.3.1), i.e., lightness difference ÄL∗, chroma difference ÄC ∗
ab, and hue differenceÄH ∗
ab. The color difference of colored pigments in reduction can be similarly de-termined, including the “color difference after color reduction” which arises whentinting strength matching is carried out (see Section 1.3.3). A number of color dif-ference formulas have been published recently. They typically introduce weightingfactors giving the lightness, chroma and hue difference values depending on thelocation in color space:
– CIE 94, chroma and hue difference depend on the chroma values [1.22].
– CMC (British Standard BS 6923) additionally take into account the dependenceon the hue angle.
– CIEDE 2000, (CIE-report 142), extending the color difference formulas by in-troducing a fourth factor [1.48, 1.49].
– DIN99, trying a different approach: In contrast to the formulas stated abovethis formula tries to keep the calculation of the color difference as simple as inthe CIELAB system while changing the color space to give a better conformanceto the visual impression.
The future will tell the acceptance of the new formulas. All formulas can betransformed to give equivalent values in a Euclidean color space [1.50].
Undertone of Near-White Samples and Gray Undertones. The undertone of an almostuncolored sample is the small amount of color by which the color of a sample differs
34 1 Introduction
from ideal white or achromatic material. It is described by hue and chroma. Thedistance and direction of the CIELAB color position of the test sample (aT
∗, bT∗) from
the achromatic position (0, 0) are used to characterize the hue. The relative undertoneis expressed by the distance and direction between the CIELAB color position of thetest sample (aT
∗, bT∗) and that of the reference pigment (aR
∗, bR∗). In both cases, the
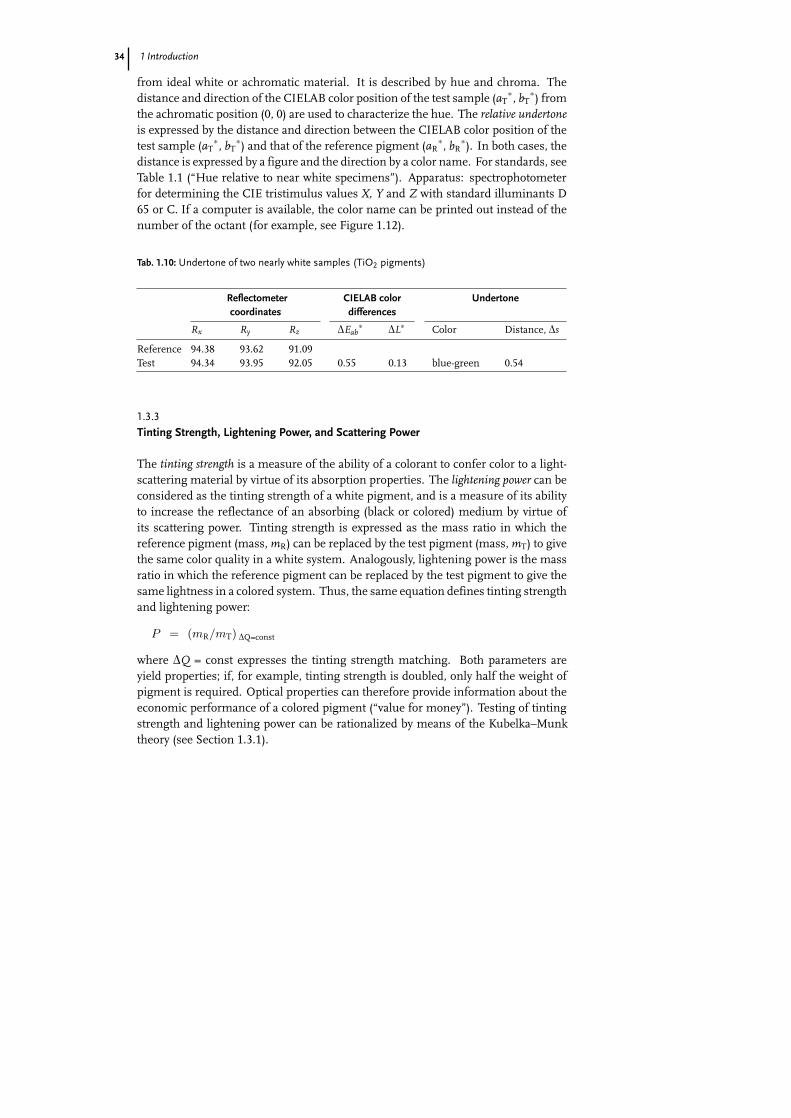
distance is expressed by a figure and the direction by a color name. For standards, seeTable 1.1 (“Hue relative to near white specimens”). Apparatus: spectrophotometerfor determining the CIE tristimulus values X, Y and Z with standard illuminants D65 or C. If a computer is available, the color name can be printed out instead of thenumber of the octant (for example, see Figure 1.12).
Tab. 1.10: Undertone of two nearly white samples (TiO2 pigments)
Reflectometer CIELAB color Undertonecoordinates differences
Rx Ry Rz ÄEab∗ ÄL∗ Color Distance, Äs
Reference 94.38 93.62 91.09Test 94.34 93.95 92.05 0.55 0.13 blue-green 0.54
1.3.3
Tinting Strength, Lightening Power, and Scattering Power
The tinting strength is a measure of the ability of a colorant to confer color to a light-scattering material by virtue of its absorption properties. The lightening power can beconsidered as the tinting strength of a white pigment, and is a measure of its abilityto increase the reflectance of an absorbing (black or colored) medium by virtue ofits scattering power. Tinting strength is expressed as the mass ratio in which thereference pigment (mass, mR) can be replaced by the test pigment (mass, mT) to givethe same color quality in a white system. Analogously, lightening power is the massratio in which the reference pigment can be replaced by the test pigment to give thesame lightness in a colored system. Thus, the same equation defines tinting strengthand lightening power:
P = (mR/mT) ÄQ=const
where ÄQ = const expresses the tinting strength matching. Both parameters areyield properties; if, for example, tinting strength is doubled, only half the weight ofpigment is required. Optical properties can therefore provide information about theeconomic performance of a colored pigment (“value for money”). Testing of tintingstrength and lightening power can be rationalized by means of the Kubelka–Munktheory (see Section 1.3.1).
1.3 Color Properties 35
1.3.3.1
Tinting StrengthWithin certain limits, relative tinting strength can be interpreted as the ratio of the ab-sorption coefficients of equal masses of test and reference pigments. This procedureavoids visual matching of the test and reference pigments employed in a previouslyused method (tinting strength matching). For standards, see Table 1.1 (“Tintingstrength, relative”). Materials and apparatus: white paste, spectrophotometer.
In the determination of the tinting strength, specification of the matching betweenthe test and the reference pigments is extremely important [1.51]. Since the criterionused for matching greatly influences the value of the tinting strength, it is not per-missible to speak of tinting strength purely and simply. There are as many tintingstrength values as there are matching criteria. In the German Standard, the followingcriteria are permitted:
1. The lowest of the three CIE tristimulus values X, Y and Z.2. The CIE tristimulus value Y.3. The depth of shade (see Section 1.4.2.1).When using commercial colorimeter software it has to be ascertained which for-
mula is used to calculate the tinting strength. As there is no universally accepted defi-nition and the formulas in use result in divergent results under certain circumstancesonly values with a known tinting strength criteria can be applied. When determin-ing the tinting strength of inorganic pigments, the tristimulus value Y (lightness) isusually used [1.51].
Another standard method uses depth of shade as the matching criterion, but itis employed almost exclusively for testing organic pigments. This method can beapplied by means of the “principle of spectral evaluation” (see Section 1.3.4 [1.52],which uses the wavelength-dependent Kubelka–Munk coefficients S(ë), K (ë) to cal-culate the match [1.53]. The tinting strength for all other matching criteria can bedetermined by applying the principle of spectral evaluation. (For tinting strength incement, see Section 1.5.2.3; for change in tinting strength, see Section 1.5.2.2).
1.3.3.2
Lightening PowerIf the gray paste method is used to determine the lightening power (for standards,see Table 1.1, “Lightening power of white pigments”), the concentration at whichthe white pigment should be assessed has to be agreed between the intended partiesin accordance with the type of application [1.54]. This process is especially recom-mended for the routine testing of pigments because the lightening power, the relativescattering power (see below), and the undertone can be determined with the samegray milling paste of the test pigment.
The method can be rationalized by means of the Kubelka–Munk theory. For stan-dards, see Table 1.1 (“Tinting strength, relative: Photometric”).
36 1 Introduction
1.3.3.3
Relative Scattering PowerFor standards, see Table 1.1 (“Scattering power, relative”). The relative scatteringpower S is the ratio of the scattering power ST of the test white pigment to thescattering power of a white reference pigment SR [1.55]. It can be determined in twoways:
1. Black-Ground Method. The relative scattering power is determined from thetristimulus values Y of the pigmented medium applied in various film thick-nesses to black substrates. Compared with the gray paste method, the black-ground method has the advantage that it is not restricted to any particular testmedium. Apparatus: spectrophotometer.
2. Gray Paste Method. The relative scattering power is determined from the tris-timulus values Y of gray pastes. The method has the advantage of being lesstime consuming than the black-ground method. The results of the two meth-ods are not, however, generally in agreement. Materials and apparatus: blackpaste, spectrophotometer.
1.3.4
Hiding Power and Transparency
The definition of hiding power is based on a black and white contrasting supportupon which the film of coating is applied. The thickness h of the applied film isdetermined at the point at which the contrasting surface just disappears, as judgedby eye. The film thickness (mm), which fulfills this condition, is called the hidingthickness. Its reciprocal, the hiding power (mm−1 = m2 L−1) is, like tinting strength,an indicator of yield because it gives the area (m2) that can be covered with 1 L ofapplied paint. This traditional visual testing method has been improved by the useof a photometer and a colorimetric criterion to evaluate the hiding film thickness,e.g., ÄE ∗
ab = 1 for equally thick films applied to black and white backgrounds. Themethod can, however, be further rationalized. In this method only a single coatinghas to be prepared. The total reflectance spectrum is measured and after measuringthe film thickness, the spectral scattering and absorption coefficients S(ë) and K(ë)are calculated at selected wavelengths (e.g., at intervals of 20 nm) by the Kubelka–Munk method. Once these values are known, the expected reflectance over blackand white at the chosen wavelengths of the spectrum can be calculated for a givenfilm thickness. Using the CIE and CIELAB systems, the CIELAB position of a color,which would have this spectrum, is calculated. This provides an iteration methodfor determining the film thickness at which the hiding power criterion ÄE ∗
ab = 1 issatisfied [1.52, 1.56, 1.57]. This principle of spectral evaluation [1.52] is the key tohandling test methods based on the visual matching of two color samples (see also“Transparency” and “Tinting Strength”, Section 1.3.3).
The transparency of a pigmented system denotes its ability to scatter light as littleas possible. The color change of a transparent pigmented system when applied toa black substrate has to be very small; the lower the color change, the higher is
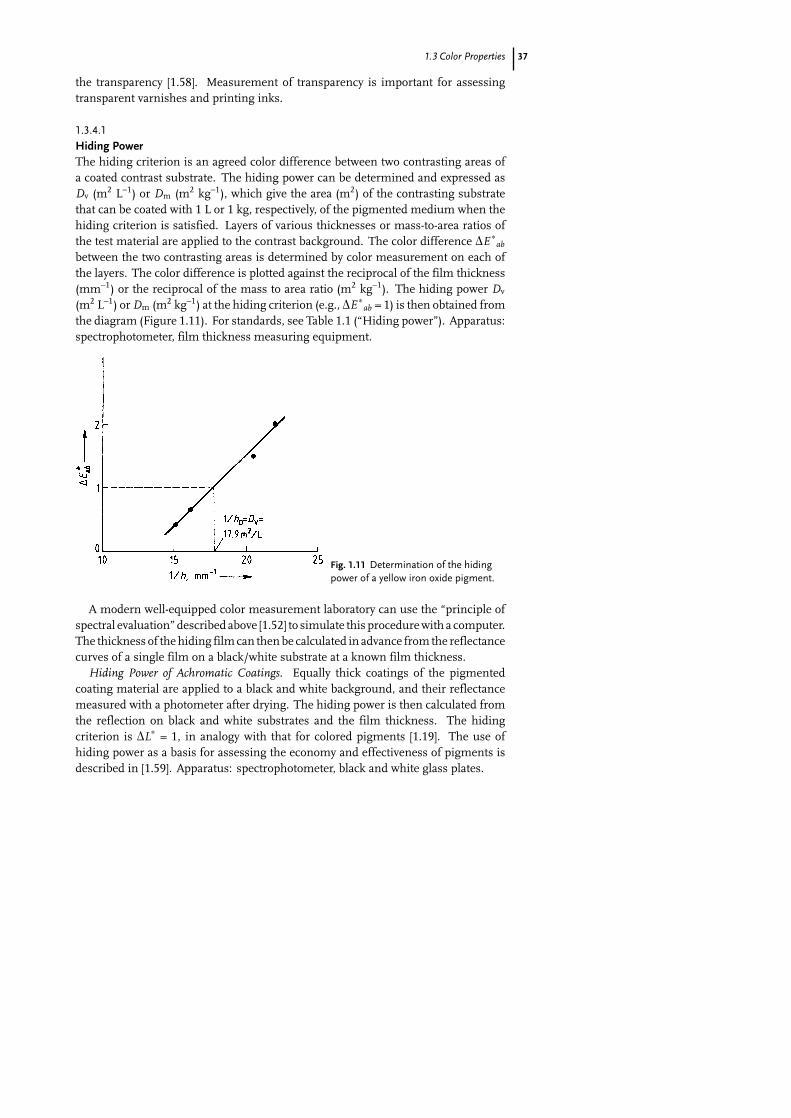
1.3 Color Properties 37
the transparency [1.58]. Measurement of transparency is important for assessingtransparent varnishes and printing inks.
1.3.4.1
Hiding PowerThe hiding criterion is an agreed color difference between two contrasting areas ofa coated contrast substrate. The hiding power can be determined and expressed asDv (m2 L−1) or Dm (m2 kg−1), which give the area (m2) of the contrasting substratethat can be coated with 1 L or 1 kg, respectively, of the pigmented medium when thehiding criterion is satisfied. Layers of various thicknesses or mass-to-area ratios ofthe test material are applied to the contrast background. The color difference ÄE ∗
ab
between the two contrasting areas is determined by color measurement on each ofthe layers. The color difference is plotted against the reciprocal of the film thickness(mm−1) or the reciprocal of the mass to area ratio (m2 kg−1). The hiding power Dv
(m2 L−1) or Dm (m2 kg−1) at the hiding criterion (e.g., ÄE ∗ab = 1) is then obtained from
the diagram (Figure 1.11). For standards, see Table 1.1 (“Hiding power”). Apparatus:spectrophotometer, film thickness measuring equipment.
Fig. 1.11 Determination of the hidingpower of a yellow iron oxide pigment.
A modern well-equipped color measurement laboratory can use the “principle ofspectral evaluation” described above [1.52] to simulate this procedure with a computer.The thickness of the hiding film can then be calculated in advance from the reflectancecurves of a single film on a black/white substrate at a known film thickness.
Hiding Power of Achromatic Coatings. Equally thick coatings of the pigmentedcoating material are applied to a black and white background, and their reflectancemeasured with a photometer after drying. The hiding power is then calculated fromthe reflection on black and white substrates and the film thickness. The hidingcriterion is ÄL∗ = 1, in analogy with that for colored pigments [1.19]. The use ofhiding power as a basis for assessing the economy and effectiveness of pigments isdescribed in [1.59]. Apparatus: spectrophotometer, black and white glass plates.
38 1 Introduction
1.3.4.2
TransparencyTransparency is expressed quantitatively as the transparency number. This is definedas the reciprocal of the increase in color difference ÄE ∗
ab = 1 on a black substrateobtained on increasing the film thickness h of the pigmented medium. The trans-parency number has the unit mm (= L m−2). It indicates the number of liters ofpigmented medium needed to coat 1 m2 of a black substrate in order to obtain acolor difference of ÄE ∗
ab = 1 relative to this substrate. In a simplified method thetransparency number can be determined by evaluating one or two points on thestraight part of the ÄE ∗
ab (h) curve. A computer method is more exact; furthermore,calculations can be made using the spectral “principle of spectral evaluation.” Forstandards, see Table 1.1 (“Transparency”).
1.4
Stability Towards Light, Weather, Heat, and Chemicals
1.4.1
Fundamental Aspects [1.60]
Many pigmented systems show typical color or structural changes when subjectedto intense radiation or weathering [1.61]. The best known of these are yellowing[1.62], chalking, and loss of gloss. These processes involve photochemical reactionsin which the pigment can act as a catalyst or in which the pigment itself undergoeschemical changes.
Inorganic pigments are chemically very stable and are classed as one of the moststable coloring matters. This is especially true for oxide pigments, which often havea highly protective effect on the substrate [1.63]. Apart from the purely mechanicalstabilization imparted by the pigment, this protective effect can give a coating anincreased economic advantage. On the other hand, sulfide pigments can be oxidizedby the atmosphere to form sulfates, which can be washed away by rain [1.64].
The photochemical processes that take place when TiO2-containing coatings un-dergo chalking have been elucidated [1.65]. The shorter wavelength radiation ofsunlight acts on rainwater and atmospheric oxygen to form extremely reactive rad-icals (•OH, HO2•) that cause deterioration of the coating matrix by oxidative attack.Titanium dioxide pigments may be stabilized by reducing the number of radical-producing hydroxy groups on the surface of the TiO2 particles (e.g., by doping withzinc oxide). Alternatively, coatings of oxide hydrates are produced by aftertreatmentof the pigment surface to give "reaction walls” on which the radicals are destroyed[1.66].
Continuous breakdown of the binder leads to the loss of gloss. Surface gloss givesan attractive appearance and is usually desired, it is obtained by ensuring that thepigment particles are well dispersed. The stability of gloss to weathering is thereforeof great importance. If breakdown of the binder is so extensive that the pigment maybe loosened, chalking takes place. Chalking is defined as loosening of pigment or
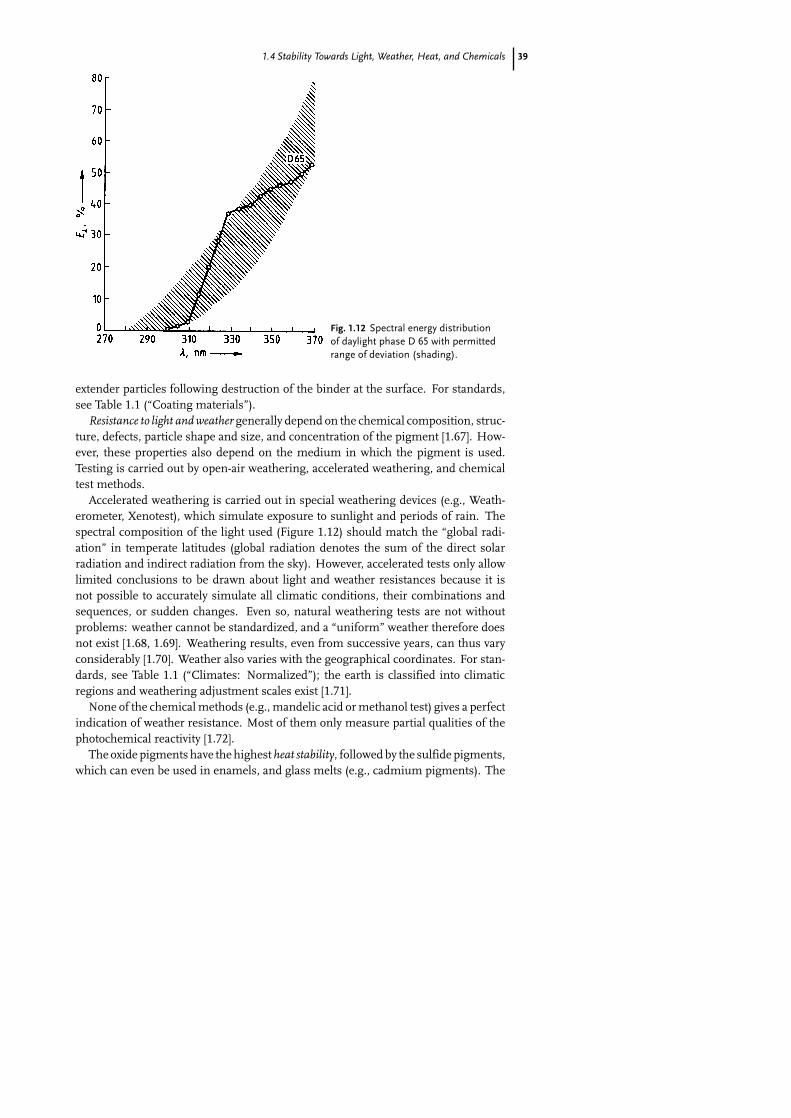
1.4 Stability Towards Light, Weather, Heat, and Chemicals 39
Fig. 1.12 Spectral energy distributionof daylight phase D 65 with permittedrange of deviation (shading).
extender particles following destruction of the binder at the surface. For standards,see Table 1.1 (“Coating materials”).
Resistance to light and weather generally depend on the chemical composition, struc-ture, defects, particle shape and size, and concentration of the pigment [1.67]. How-ever, these properties also depend on the medium in which the pigment is used.Testing is carried out by open-air weathering, accelerated weathering, and chemicaltest methods.
Accelerated weathering is carried out in special weathering devices (e.g., Weath-erometer, Xenotest), which simulate exposure to sunlight and periods of rain. Thespectral composition of the light used (Figure 1.12) should match the “global radi-ation” in temperate latitudes (global radiation denotes the sum of the direct solarradiation and indirect radiation from the sky). However, accelerated tests only allowlimited conclusions to be drawn about light and weather resistances because it isnot possible to accurately simulate all climatic conditions, their combinations andsequences, or sudden changes. Even so, natural weathering tests are not withoutproblems: weather cannot be standardized, and a “uniform” weather therefore doesnot exist [1.68, 1.69]. Weathering results, even from successive years, can thus varyconsiderably [1.70]. Weather also varies with the geographical coordinates. For stan-dards, see Table 1.1 (“Climates: Normalized”); the earth is classified into climaticregions and weathering adjustment scales exist [1.71].
None of the chemical methods (e.g., mandelic acid or methanol test) gives a perfectindication of weather resistance. Most of them only measure partial qualities of thephotochemical reactivity [1.72].
The oxide pigments have the highest heat stability, followed by the sulfide pigments,which can even be used in enamels, and glass melts (e.g., cadmium pigments). The
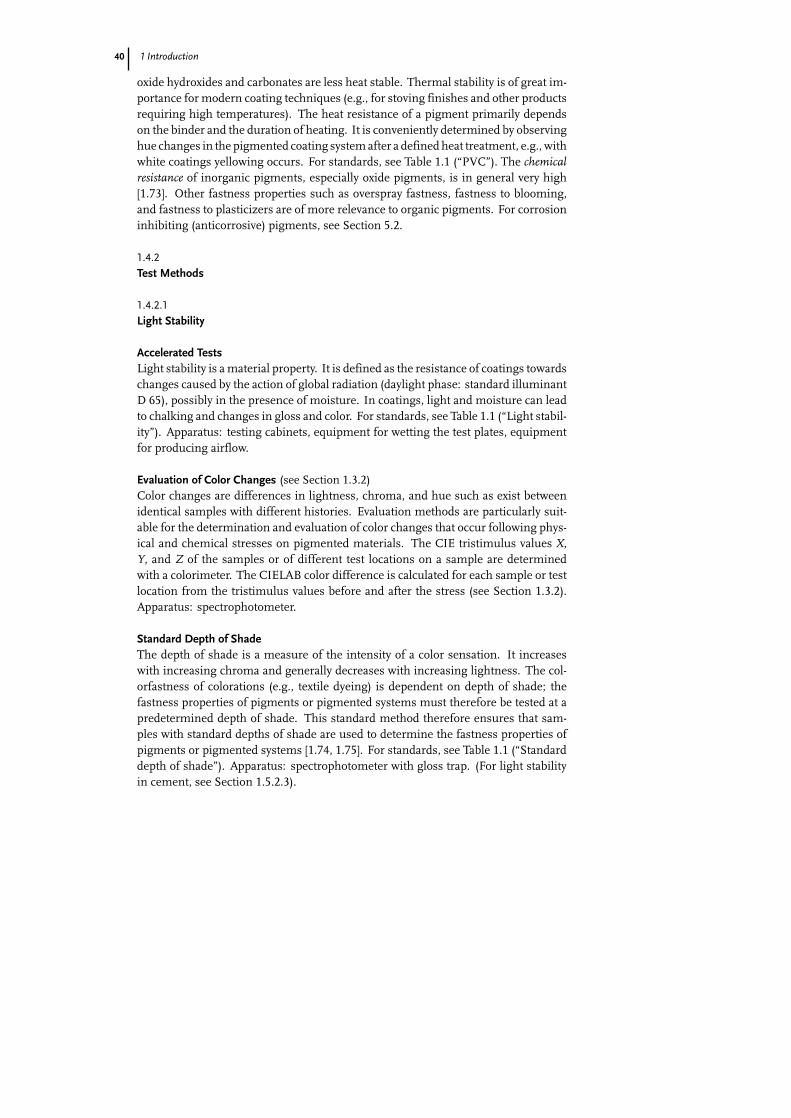
40 1 Introduction
oxide hydroxides and carbonates are less heat stable. Thermal stability is of great im-portance for modern coating techniques (e.g., for stoving finishes and other productsrequiring high temperatures). The heat resistance of a pigment primarily dependson the binder and the duration of heating. It is conveniently determined by observinghue changes in the pigmented coating system after a defined heat treatment, e.g., withwhite coatings yellowing occurs. For standards, see Table 1.1 (“PVC”). The chemicalresistance of inorganic pigments, especially oxide pigments, is in general very high[1.73]. Other fastness properties such as overspray fastness, fastness to blooming,and fastness to plasticizers are of more relevance to organic pigments. For corrosioninhibiting (anticorrosive) pigments, see Section 5.2.
1.4.2
Test Methods
1.4.2.1
Light Stability
Accelerated TestsLight stability is a material property. It is defined as the resistance of coatings towardschanges caused by the action of global radiation (daylight phase: standard illuminantD 65), possibly in the presence of moisture. In coatings, light and moisture can leadto chalking and changes in gloss and color. For standards, see Table 1.1 (“Light stabil-ity”). Apparatus: testing cabinets, equipment for wetting the test plates, equipmentfor producing airflow.
Evaluation of Color Changes (see Section 1.3.2)Color changes are differences in lightness, chroma, and hue such as exist betweenidentical samples with different histories. Evaluation methods are particularly suit-able for the determination and evaluation of color changes that occur following phys-ical and chemical stresses on pigmented materials. The CIE tristimulus values X,Y, and Z of the samples or of different test locations on a sample are determinedwith a colorimeter. The CIELAB color difference is calculated for each sample or testlocation from the tristimulus values before and after the stress (see Section 1.3.2).Apparatus: spectrophotometer.
Standard Depth of ShadeThe depth of shade is a measure of the intensity of a color sensation. It increaseswith increasing chroma and generally decreases with increasing lightness. The col-orfastness of colorations (e.g., textile dyeing) is dependent on depth of shade; thefastness properties of pigments or pigmented systems must therefore be tested at apredetermined depth of shade. This standard method therefore ensures that sam-ples with standard depths of shade are used to determine the fastness properties ofpigments or pigmented systems [1.74, 1.75]. For standards, see Table 1.1 (“Standarddepth of shade”). Apparatus: spectrophotometer with gloss trap. (For light stabilityin cement, see Section 1.5.2.3).
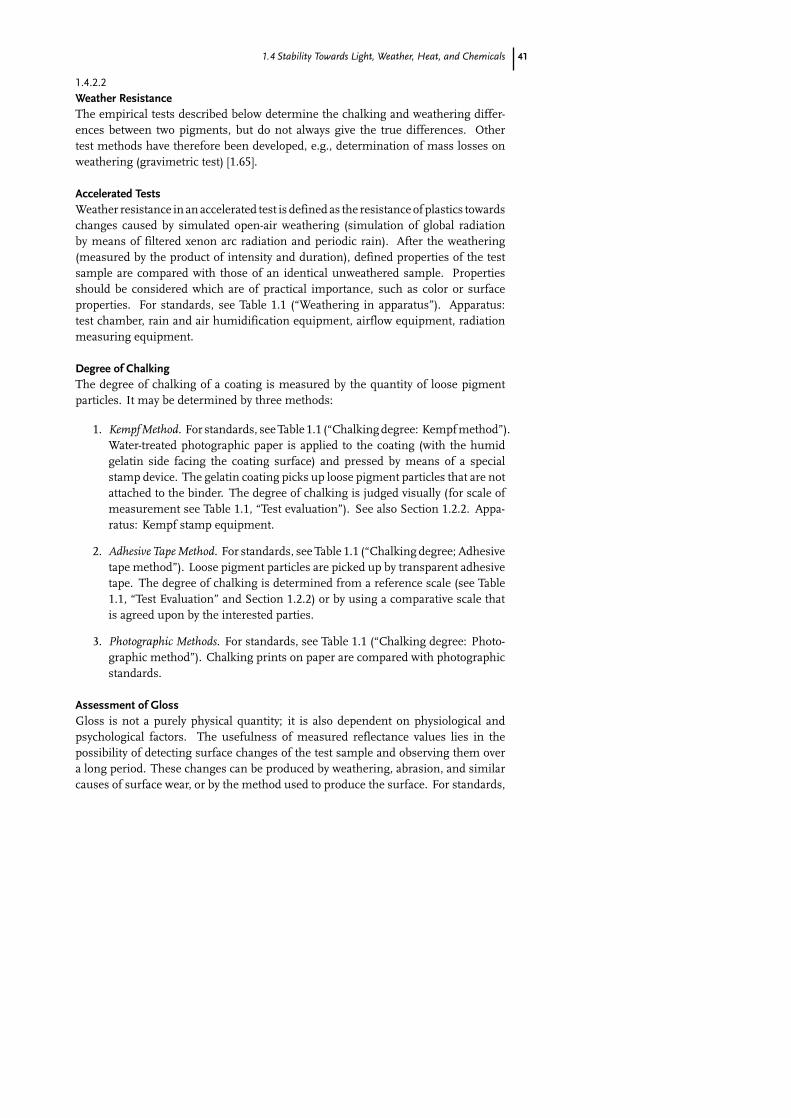
1.4 Stability Towards Light, Weather, Heat, and Chemicals 41
1.4.2.2
Weather ResistanceThe empirical tests described below determine the chalking and weathering differ-ences between two pigments, but do not always give the true differences. Othertest methods have therefore been developed, e.g., determination of mass losses onweathering (gravimetric test) [1.65].
Accelerated TestsWeather resistance in an accelerated test is defined as the resistance of plastics towardschanges caused by simulated open-air weathering (simulation of global radiationby means of filtered xenon arc radiation and periodic rain). After the weathering(measured by the product of intensity and duration), defined properties of the testsample are compared with those of an identical unweathered sample. Propertiesshould be considered which are of practical importance, such as color or surfaceproperties. For standards, see Table 1.1 (“Weathering in apparatus”). Apparatus:test chamber, rain and air humidification equipment, airflow equipment, radiationmeasuring equipment.
Degree of ChalkingThe degree of chalking of a coating is measured by the quantity of loose pigmentparticles. It may be determined by three methods:
1. Kempf Method. For standards, see Table 1.1 (“Chalking degree: Kempf method”).Water-treated photographic paper is applied to the coating (with the humidgelatin side facing the coating surface) and pressed by means of a specialstamp device. The gelatin coating picks up loose pigment particles that are notattached to the binder. The degree of chalking is judged visually (for scale ofmeasurement see Table 1.1, “Test evaluation”). See also Section 1.2.2. Appa-ratus: Kempf stamp equipment.
2. Adhesive Tape Method. For standards, see Table 1.1 (“Chalking degree; Adhesivetape method”). Loose pigment particles are picked up by transparent adhesivetape. The degree of chalking is determined from a reference scale (see Table1.1, “Test Evaluation” and Section 1.2.2) or by using a comparative scale thatis agreed upon by the interested parties.
3. Photographic Methods. For standards, see Table 1.1 (“Chalking degree: Photo-graphic method”). Chalking prints on paper are compared with photographicstandards.
Assessment of GlossGloss is not a purely physical quantity; it is also dependent on physiological andpsychological factors. The usefulness of measured reflectance values lies in thepossibility of detecting surface changes of the test sample and observing them overa long period. These changes can be produced by weathering, abrasion, and similarcauses of surface wear, or by the method used to produce the surface. For standards,
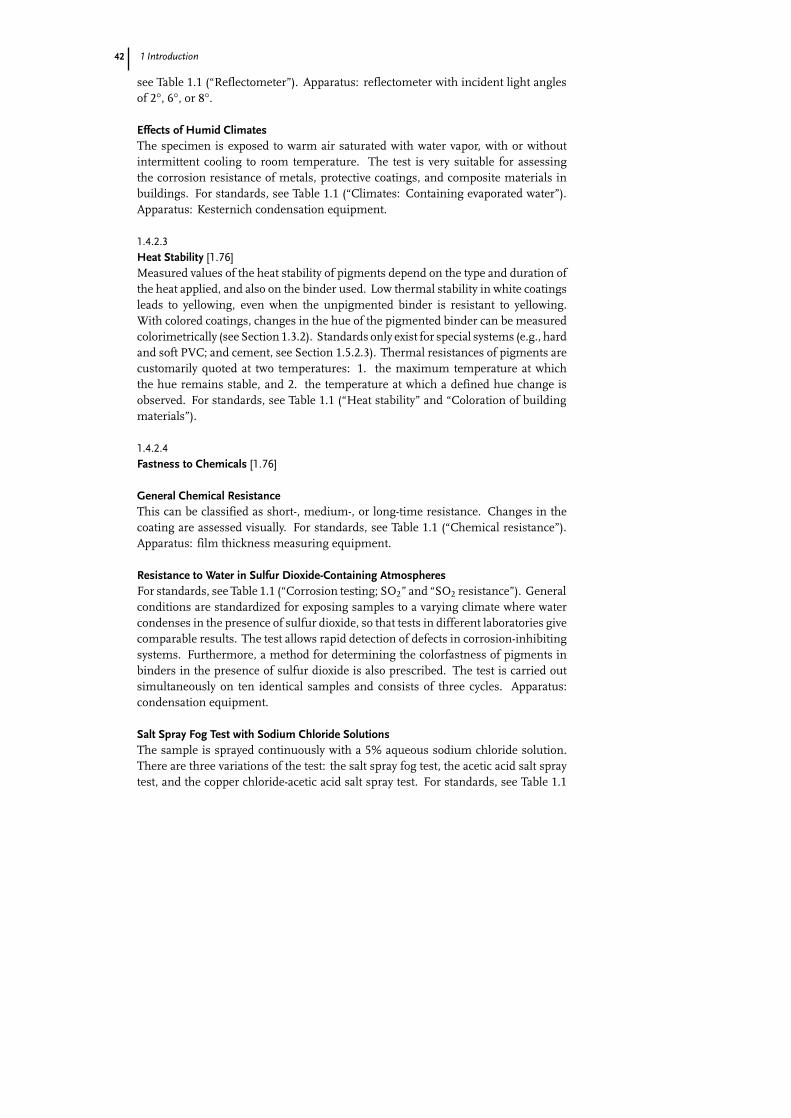
42 1 Introduction
see Table 1.1 (“Reflectometer”). Apparatus: reflectometer with incident light anglesof 2°, 6°, or 8°.
Effects of Humid ClimatesThe specimen is exposed to warm air saturated with water vapor, with or withoutintermittent cooling to room temperature. The test is very suitable for assessingthe corrosion resistance of metals, protective coatings, and composite materials inbuildings. For standards, see Table 1.1 (“Climates: Containing evaporated water”).Apparatus: Kesternich condensation equipment.
1.4.2.3
Heat Stability [1.76]Measured values of the heat stability of pigments depend on the type and duration ofthe heat applied, and also on the binder used. Low thermal stability in white coatingsleads to yellowing, even when the unpigmented binder is resistant to yellowing.With colored coatings, changes in the hue of the pigmented binder can be measuredcolorimetrically (see Section 1.3.2). Standards only exist for special systems (e.g., hardand soft PVC; and cement, see Section 1.5.2.3). Thermal resistances of pigments arecustomarily quoted at two temperatures: 1. the maximum temperature at whichthe hue remains stable, and 2. the temperature at which a defined hue change isobserved. For standards, see Table 1.1 (“Heat stability” and “Coloration of buildingmaterials”).
1.4.2.4
Fastness to Chemicals [1.76]
General Chemical ResistanceThis can be classified as short-, medium-, or long-time resistance. Changes in thecoating are assessed visually. For standards, see Table 1.1 (“Chemical resistance”).Apparatus: film thickness measuring equipment.
Resistance to Water in Sulfur Dioxide-Containing AtmospheresFor standards, see Table 1.1 (“Corrosion testing; SO2” and “SO2 resistance”). Generalconditions are standardized for exposing samples to a varying climate where watercondenses in the presence of sulfur dioxide, so that tests in different laboratories givecomparable results. The test allows rapid detection of defects in corrosion-inhibitingsystems. Furthermore, a method for determining the colorfastness of pigments inbinders in the presence of sulfur dioxide is also prescribed. The test is carried outsimultaneously on ten identical samples and consists of three cycles. Apparatus:condensation equipment.
Salt Spray Fog Test with Sodium Chloride SolutionsThe sample is sprayed continuously with a 5% aqueous sodium chloride solution.There are three variations of the test: the salt spray fog test, the acetic acid salt spraytest, and the copper chloride-acetic acid salt spray test. For standards, see Table 1.1
1.5 Behavior of Pigments in Binders 43
(“Corrosion testing: NaCl”). Materials and apparatus: spray chamber, test solutions(5% NaCl solutions).
Resistance to Spittle and SweatThis test indicates whether a pigment on a child’s colored toy is likely to be trans-ferred to the mouth, mucous membranes, or skin during use. Strips of filter paperare wetted with NaHCO3 and NaCl solutions and pressed against the test samples.The discoloration of the paper is judged visually. For standards, see Table 1.1 (“Spit-tle/sweat resistance”).
1.5
Behavior of Pigments in Binders
1.5.1
Fundamental Aspects [1.77, 1.78]
A pigment–binder dispersion is a suspension before it is dried; after drying it is a solidsol. In pigment-binder systems, the concepts and laws of colloid chemistry thereforeapply. The dispersing of pigments and extenders in binders is an extremely complexprocess consisting of a series of steps that can be interlinked [1.77]. Dispersinginvolves the following steps:
1. Wetting. Removal of the air from the surface of the pigment particles andformation of a solvate layer [1.79, 1.80].
2. Disintegration. Breaking up of pigment agglomerates with external energy(e.g., by dispersing equipment).
3. Stabilization. Maintenance of the disperse state by creating repulsive forcesbetween the particles (e.g., by coating them with solvate layers). These forcesmust be greater than the van der Waals attraction forces [1.81] that cause floc-culation [1.82, 1.83].
The degree of dispersing usually has a large influence on the properties of thecoating system [1.84, 1.85]. Some of these properties depend strongly on the degreeof dispersing, and are therefore used to measure dispersibility. For standards, seeTable 1.1 (“Ease of dispersion”). Examples are viscosity (pigment-binder dispersionsalways show non-Newtonian behavior properties before drying) and color properties,especially hue, tinting strength, gloss, and gloss haze [1.86] (see Sections 1.3 and 1.4).
In many systems, tinting strength depends so highly on the degree of dispersingthat the rate of tinting strength development can be taken as a direct measure of dis-persibility [1.87–1.90] (see Section 1.5.2.2). The numerical values of the half-life times(characterizing the dispersibility) and of the increases in strength (characterizing thestrength potential) depend on the binder and the dispersing equipment used.
In systems where different pigments are combined (e.g., white and colored pig-ments), segregation effects can occur which change the optical appearance (flooding
44 1 Introduction
[1.91]). Flooding can be counteracted by preflocculation of the pigments with suit-able gelling agents, and in some cases by addition of extenders. In solvent-containingsystems with several pigments, but also in full-shade systems, color changes (rub-outeffect) can take place due to flocculation, especially if the systems are subjected tomechanical stress during application and drying. The flocculation tendency can bedetermined by means of the “rub-out test”.
1.5.2
Test Methods
1.5.2.1
Pigment–Binder Interaction
Oil AbsorptionThe oil absorption gives the mass or volume of linseed oil required to form a coherentputty-like mass with 100 g pigment under specified conditions. The mixture shouldjust not smear on a glass plate. For standards, see Table 1.1 (“Oil absorption”).Materials and apparatus: rough glass plate, spatula with steel blade, raw linseed oil.
Binder Absorption, Smear Point, and Yield Point[1.92] Smear point and yield point are used to determine the binder needed to for-mulate a suitable millbase for grinding by dissolvers, roll mills, ball mills, attritors,sand mills, and pearl mills. The amount of binder is given in volume or mass units.Apparatus: rough glass plate, spatula with steel blade.
ViscosityViscosity is a useful parameter for coatings applied by brushing. It is determined bymeasuring the torque applied to a rotating cylinder or disk in or on the surface of asuspension. This method is applicable to Newtonian and non-Newtonian systems. Innon-Newtonian suspensions, the apparent viscosity is obtained by dividing the shearstress by the shear rate. The viscosities provide information about the force requiredin the initial brushing phase of a coating. For standards, see Table 1.1 (“Viscosity”).Apparatus: cone/plate or rotating cylinder viscometer.
Fineness of Grindfineness of grind The grind gauge (grindometer) consists of a steel block with agroove. The depth of the groove at one end is approximately twice the diameter ofthe largest pigment particle, and decreases continuously to zero at the other end.The sample is placed at the deep end of the groove and drawn to the other endwith a scraper. The depth at which a large number of particles become visible aspinholes or scratches on the surface of the pigment–binder system is read off from ascale graduated in micrometers. For standards, see Table 1.1 (“Fineness of grind”).Apparatus: Hegman’s grindometer gauge (block and scraper).
1.5 Behavior of Pigments in Binders 45
1.5.2.2
Dispersing Behavior in Paint Systems
Low-Viscosity MediaThe time that is required to produce a homogeneous suspension of particles in thedispersion medium using an oscillatory shaking machine equipped with several con-tainers is measured. Not only can small quantities of the millbase with the samecomposition be tested (as with other types of apparatus), but various millbases canalso be tested under the same conditions. A low-viscosity alkyd resin system of thestoving or oxidatively drying type can be used as a test medium. For standards, seeTable 1.1 (“Ease of dispersion: Oscillatory shaking machine”).
High-Viscosity Media (Pastes)The dispersion properties are determined with an automatic muller. The advantageis that small amounts of material can be simply tested under reproducible conditions.For standards, see Table 1.1 (“Ease of dispersion: Automatic muller”).
Development of Fineness of GrindThe quantity measured is the dispersing effect needed to achieve a given fineness ofgrind. Samples of the product are taken at various stages of the dispersion process andthe fineness of grind is determined with a grindometer gauge. The method is usedto compare diverse millbase material types of dispersing equipment, or dispersingmethods used with the same pigment. For standards, see Table 1.1 (“Fineness ofgrind”).
Change in Tinting Strength, Half-Life Times, and Increase in StrengthFor standards see Table 1.1 (“Change in strength”). Dispersibilities of pigments maybe compared by means of their dispersing resistance; dispersing equipment maybe characterized by means of dispersing effects. Measurement can be based on thedetermination of half-life times in relation to the final tinting strength. The increasein strength, however, only gives the difference between the initial and final tintingstrength [1.90]. Half-life times are functions of the dispersing rate. They are only validfor a given combination of dispersing equipment, dispersing process, and medium.Samples are taken from the millbase at specified stages in the dispersing process andmixed with a white paint based on the same binder material, or with a compatiblewhite paste. The tinting strength is then determined (see Section 1.3.3) and a graphis drawn; development of tinting strength is plotted against the dispersion stages(Figure 1.13) [1.93].
Making use of equations used in the description of the kinetics of chemical reac-tions a quantitative description of the dispersion process can even be achieved [1.22]by defining three types of size reduction of large particles:
– against themselves (2nd order reaction)
– against the vessel walls and grinding bodies (1st order reaction)
– against the small particles already produced (interaction).
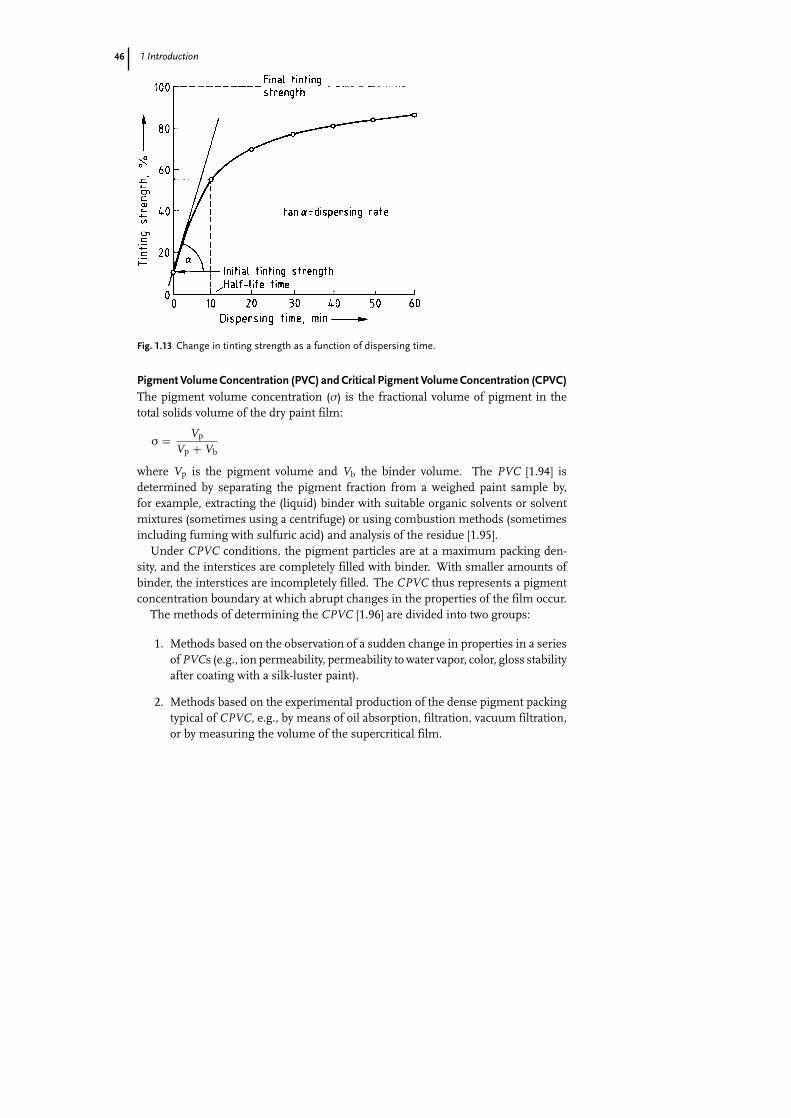
46 1 Introduction
Fig. 1.13 Change in tinting strength as a function of dispersing time.
Pigment Volume Concentration (PVC) and Critical Pigment Volume Concentration (CPVC)The pigment volume concentration (ó) is the fractional volume of pigment in thetotal solids volume of the dry paint film:
ó =Vp
Vp + Vb
where Vp is the pigment volume and Vb the binder volume. The PVC [1.94] isdetermined by separating the pigment fraction from a weighed paint sample by,for example, extracting the (liquid) binder with suitable organic solvents or solventmixtures (sometimes using a centrifuge) or using combustion methods (sometimesincluding fuming with sulfuric acid) and analysis of the residue [1.95].
Under CPVC conditions, the pigment particles are at a maximum packing den-sity, and the interstices are completely filled with binder. With smaller amounts ofbinder, the interstices are incompletely filled. The CPVC thus represents a pigmentconcentration boundary at which abrupt changes in the properties of the film occur.
The methods of determining the CPVC [1.96] are divided into two groups:
1. Methods based on the observation of a sudden change in properties in a seriesof PVCs (e.g., ion permeability, permeability to water vapor, color, gloss stabilityafter coating with a silk-luster paint).
2. Methods based on the experimental production of the dense pigment packingtypical of CPVC, e.g., by means of oil absorption, filtration, vacuum filtration,or by measuring the volume of the supercritical film.
1.5 Behavior of Pigments in Binders 47
Measurement of DepositCommon methods used to measure sediments are manual testing, sedimentationbalance, radioactive methods, dipping of bodies, and probe tools.
The special measuring equipment known as the Bayer system [1.97] can test fordeposits with great accuracy and good reproducibility. The force acting on a needleprobe which penetrates into the coating material from above is measured.
1.5.2.3
Miscellaneous Pigment–Binder Systems
PlasticsSpecifications for thermoplastics are given in Table 1.1 (“Thermoplastics”). Specifi-cations for poly(vinyl chloride) are also listed (“PVC”). These specifications includemethods for producing basic mixtures for testing pigments in PVC and for specimenpreparation. A method is described for determining bleeding, i.e., the migrationof coloring matter into a material in contact with the sampling equipment. Specialprocedures are also included for the determination of heat stability and increase instrength caused by cold rolling.
Building Materials For standards, see Table 1.1 (“Coloration of building materials”).The following tests are prescribed for assessing the suitability of a pigment for color-ing cement and lime-bonded building materials:
– Relative tinting strength
– Colorfastness in cement
– Colorfastness in lime
– Lightfastness
– Heat stability
– Influence of the pigment on the hardness of the building material
– Influence of the pigment on setting properties
Paper and BoardFor standards, see Table 1.1 (“Opacity” and “Transparency”). Methods of measure-ment are specified for the reflectance of paper and board (nonfluorescent), and theopacity or transparency of paper (to measure the transmitted light).
48
References
1 Smith, H. M. (Ed.), High PerformancePigments, Wiley-VCH, Weinheim,2002
2 Jansen, M., Letschert, H. P., Nature404 (2000), p. 980
3 Jansen, M., Letschert, H. P., Speer,
D. (Cerdec AG) EP 0627382 (1994)4 Berte, J. N., in High Performance Pig-
ments (Ed.: H. M.Smith), Wiley-VCH,Weinheim, 2002, p. 27
5 Pfaff, G., Phänomen Farbe 22 (2002),p. 19
6 Kirk-Othmer, 3rd edn., 17, 788. Kit-
tel, J., Spille, J., Lehrbuch der Lackeund Beschichtungen, Band 5: Pig-mente, Füllstoffe und Farbmetrik, S.Hirzel Verlag, Stuttgart, 2003
7 Rechmann, H., Sutter, G., Farbe +Lack 82 (1976), p. 793
8 Gall, L., Farbe + Lack 81 (1975),p. 1015
9 Fritzsche, E., Farbe + Lack 80 (1974),p. 731
10 Völz, H. G., DEFAZET – Dtsch. Far-ben Z. 28 (1974), p. 559
11 Hund, F., Farbe + Lack 73 (1967),p. 111
12 Kämpf, G., Farbe + Lack 71 (1965),p. 353.
13 Honigmann, B., Stabenow, J., in:Congress FATIPEC VI, 1962, VerlagChemie, Weinheim, 1963, p. 89
14 Völz, H. G., Farbe + Lack 90 (1984),pp. 642, 752
15 Allen, T., Particle Size Measurement,Vol. 1 and 2, 5th edn., Kluwer, Dor-drecht, 1997
16 Kindervater, F., in CongressFATIPEC XII, 1974, Verlag Chemie,Weinheim, 1974, p. 399
17 Keifer, S., Wingen, A., Farbe + Lack79 (1973), p. 886
18 Judd, D. B., Wyszecki, G., Color inBusiness, Science and Industry, J. Wiley& Sons, New York, 1975
19 Völz, H. G. Prog. Org. Coat. 1 (1973),p. 1
20 Berns, R. S., Billmeyer and Saltzman’sPrinciples of Color Technology, WileyInterscience, New York, 2000
21 Völz, H. G., Angew. Chem., Int. Ed.Eng. 14 (1975), p. 655
22 Völz, H. G., Industrial Color Testing.Fundamentals and Techniques, Wiley-VCH, Weinheim, 2001
23 Berger-Schunn, A., Practical ColorMeasurement: A Primer for the Begin-ner, a Reminder for the Expert, WileyInterscience, New York, 1994
24 Wyszecki, G., Stiles, W. S. Color Sci-ence, Wiley Interscience, New York,2000
25 Colour Physics for Industry, (Ed.: R.McDonald) Society of Dyers andColourists, 1997
26 CIE Technical Report 116 (1995)27 Kubelka, P., Munk, F., Z. Tech. Phys.
12 (1931), p. 53928 Kubelka, P., J. Opt. Soc. Am. 38
(1948), p. 44829 Gall, L., Farbe + Lack 80 (1974), p. 29730 Hoffmann, K., Farbe + Lack 80
(1974), pp. 118, 22131 Billmeyer, Jr., F. W., Abrams, R. L.,
Phillips, D. G., J. Paint Technol. 45
References 49
(1973) pp. 23, 31; 46 (1974), p. 36; 48(1976), p. 30
32 Völz, H. G., Ber. Bunsen-Ges. Phys.Chem. 71 (1967), p. 326
33 Mie, G. Ann. Phys. 25 (1908), p. 37734 van de Hulst, H. C., Light Scattering
by Small Particles, J. Wiley & Sons,New York, 1957
35 Kerker, M., The Scattering of Lightand other Electromagnetic Radiation,Academic Press, New York, 1969
36 Bohren, C. F., Absorption and LightScattering by Small Particles, J. Wiley &Sons, New York, 1983
37 Jaenicke, W., Z. Elektrochem. 60(1956), p. 163
38 Völz, H. G., DEFAZET – Dtsch. Far-ben Z. 31 (1977), p. 469
39 Brockes, A., Optik (Stuttgart) 21(1964), p. 550
40 Brossmann, R., in InternationaleFarbtagung “Color 69”, vol. II, Ver-lag Musterschmidt, Göttingen, 1969,p. 890
41 Handbook of Optical Constants of Solids(Ed.: E. D. Palik), Academic Press,Boston, 1985
42 Querry M. R., Optical Constants, Gov-ernment Report, CRDC-CR-85034,Kansas City, Missouri, MO64110
43 Bohren, C. F., Saltzman, G. C.,
Palmer, B. R., Stamatakis, P., A Mul-tiple Scattering Model for OpacifyingParticles in Polymer Films, J. Coat.Technol. 61, 779 (1989), p. 41
44 Völz, H. G., Farbe + Lack 76 (1970),p. 9; Keifer, S., Farbe + Lack 81 (1975)p. 289
45 Völz, H. G., Farbe + Lack 88 (1982),pp. 264, 443
46 Schumacher, W., in CongressFATIPEC XIII. 1976, EREC, Paris,1977, p. 582
47 Finus, F., DEFAZET – Dtsch. FarbenZ. 28 (1974), p. 494
48 Cui, G., Luo, M. R., Rigg, B., Col.Res. Appl. 26 (2001), No. 5, p. 340
49 Fairchild, M. D., Johnson, G. M.,Col. Res. Appl. 28 (2003), No. 6, p. 425
50 Völz, H. G., DIE FARBE 44 (1998), H.1–3, 1 and H. 4–6, 97, 45 (1999/2000),H. 1–3, 1 and 4–6, 187; Col. Res. Appl.,in press
51 Keifer, S., Völz, H. G., Farbe + Lack83 (1977), pp. 180, 278
52 Völz, H. G., Progr. Org. Coat. 15(1987), p. 99
53 Gall, L., in Congress FATIPEC IX,1968, Chimie des Peintures, Brussels,1969, p. 34
54 Keifer, S., Farbe + Lack 82 (1976),p. 811
55 Vial, F., in Congress FATIPEC XII,1974, Verlag Chemie, Weinheim,1975, p. 159
56 Gall, L., Farbe + Lack 72 (1966), p. 95557 Gall, L., Farbe + Lack 72 (1966),
p. 107358 Völz, H. G., DEFAZET – Dtsch. Far-
ben Z. 30 (1976), pp. 392, 45459 Keifer, S., Deckvermögen, in Anor-
ganische Pigmente für Anstrich- undBeschichtungsstoffe, Bayer, Leverkusen,1973, Section 3.3.2
60 Völz, H. G., in Lehrbuch der Lacke undBeschichtungen, Ed. H. Kittel, Vol. II,Verlag W. A. Colomb, Berlin, 1974,p. 22
61 Brugger, K., Jehle, N., in CongressFATIPEC XIII, 1976, EREC, Paris,1977, p. 15
62 Epple, R., Englisch, A., in CongressFATIPEC XII. 1974, Verlag Chemie,Weinheim, 1975, p. 241
63 Kämpf, G., Papenroth, W., Farbe +Lack 83 (1977), p. 18
64 Grassmann, W., Farbe + Lack 66(1960), p. 67
65 Völz, H. G., Kämpf, G., Fitzky, H. G.,
Klaeren, A., ACS Symp. Ser. 151(1981) p. 163
66 Völz, H. G., Kämpf, G., Fitzky, H. G.,Farbe + Lack 78 (1972), p. 1037
67 Bohmann, Th., in Congress FATIPECX, 1970, Verlag Chemie, Weinheim,1971, p. 123
68 Papenroth, W., Koxholt, P. Farbe +Lack 82 (1976), p. 1011
69 Freier, H. J., Farbe + Lack 72 (1967),p. 1127
70 Rechmann H. et al., in CongressFATIPEC X, 1970, Verlag Chemie,Weinheim, 1971, p. 3
71 Sadowski, F., Farbe + Lack 80 (1974),p. 29
50 References
72 Keifer, S., in Congress FATIPEC XII,1974, Verlag Chemie, Weinheim,1975, p. 517
73 Kresse, P., in Congress FATIPEC XIII,1976, EREC, Paris, 1977, p. 346
74 Gall, L., DEFAZET – Dtsch. Farben Z.30 (1976), p. 127
75 Finus, F., Fleck, W., DEFAZET –Dtsch. Farben Z. 28 (1974), p. 153
76 Lincke, G., Einfärben Kunststoffe, VDI-Verlag, Düsseldorf, 1975, p. 135
77 Bialas, D., in Lehrbuch der Lacke undBeschichtungen, Ed. H. Kittel, Vol. II,Verlag W. A. Colomb, Berlin, 1974,p. 486
78 Kämpf, G., DEFAZET – Dtsch. FarbenZ. 31 (1977), p. 347
79 Joppien, G. R., Farbe + Lack 81 (1975),p. 1102
80 Marwedel, G., Farbe + Lack 82 (1976),p. 789
81 Herrmann, E., DEFAZET – Dtsch.Farben Z. 29 (1975), p. 116
82 Keifer, S., Farbe + Lack 79 (1973),p. 1161
83 Kresse, P., DEFAZET – Dtsch. FarbenZ. 28 (1974), p. 459
84 Miele, M., Farbe + Lack 81 (1975),p. 495
85 Zosel, A., in Congress FATIPEC XIII,1976, EREC, Paris, 1977, p. 653
86 Bohmann, Th., in Congress FATIPECIX, 1968, Chimie des Peintures, Brus-sels, 1969, p. 47
87 Schmitz, O. J., in Congress FATIPECXII, 1974, Verlag Chemie, Weinheim,1975, p. 511
88 Gall, L., Kaluza, U., DEFAZET –Dtsch. Farben Z. 29 (1975), p. 102
89 Klaeren, A., Völz, H. G. Farbe + Lack81 (1975), p. 709
90 Völz, H. G., Farbe + Lack 96 (1990),p. 19
91 Kaluza, U., DEFAZET – Dtsch. FarbenZ. 27 (1973), pp. 427–439; 28 (1974),p. 449
92 Gardner, H. A., Sward, G. G.,Paints, Varnishes, Lacquers and Col-ors, Gardner Laboratory, Inc., 12thedn., Bethesda, 1962, p. 251
93 Kaluza, U., Farbe + Lack 80 (1974),p. 404
94 Gardner, H. A., Sward G. G., in Ref.[1.92], p. 501
95 Stock, E.. Analyse der Körperfar-ben, Wissenschaftl. Verlags GmbH,Stuttgart, 1953
96 Kresse, P., Farbe + Lack 71 (1965),p. 178
97 Papenroth, W., Kox, K. DEFAZET –Dtsch. Farben Z. 28 (1974), p. 311