Embed Size (px)
Citation preview

The Effect of Digitalisation on CorruptionA longitudinal global analysis
Academic Year 2016-2017
Daily supervisor: Mr. P. ShresthaPromoter: Prof. dr. S. de Prijcker
Master's thesis submitted to obtain the degree of
Robert Haafst
FACULTY OF ECONOMICS AND BUSINESS
R0611763
MASTER OF BUSINESS ADMINISTRATION


Contents1
Abstract............................................................................................................................A
1 Introduction............................................................................................................2
2 Literature review....................................................................................................3
2.1 Corruption......................................................................................................3
2.1.1 Corruption as determinant...................................................................3
2.1.2 Determinants of Corruption..................................................................4
2.2 Digitalisation..................................................................................................4
2.3 Place in literature...........................................................................................5
2.4 Hypotheses....................................................................................................6
3 Research Design & Methodology.........................................................................8
3.1 Dependent Variables.....................................................................................8
3.2 Independent Variables...................................................................................9
3.3 Control Variables...........................................................................................9
3.4 Moderating & Classifying variables..............................................................10
3.5 Econometric Models....................................................................................10
4 Empirical Results.................................................................................................13
4.1 Basic Models...............................................................................................13
4.2 Additional Models........................................................................................13
4.3 Grouped Analysis........................................................................................14
4.4 Post Analysis...............................................................................................16
5 Conclusion............................................................................................................17
6 References............................................................................................................19
Appendix 1......................................................................................................................... i
Appendix 2........................................................................................................................ ii
Appendix 3....................................................................................................................... iv
Press release................................................................................................................... vi
1 This document might contain (parts of) texts from earlier submitted documents related to the Master’s Thesis process of the same author as the author of this work.

Abstract
Corruption is often seen as slowing down economic growth. On the other hand, digitalisation is considered to stimulate economic growth. While the link of those concepts with economic growth is studied in great length, the underlying nexus of corruption and digitalisation has not been studied in detail. For that reason, this nexus is analysed by means of a longitudinal study of a large cross-section of countries. We argue the inclusion of two composite proxies for digitalisation: one at a population level, and one at a government level. Modelled through fixed effects, we present evidence that a significant correlation exists between digitalisation and corruption. Digitalisation shows to be more impacting in the mid-income range than low or high income range. Moreover, democratic countries show less corruption than non-democratic. Furthermore, the results are robust to specification, but the nexus is somewhat sensitive to a different choice of corruption measurement.
JEL Codes: D73; G18; H8; H11; K4; O5
Keywords: corruption; democracy; digitalization; e-government
Acknowledgements
Traditionally, the acknowledgement section of a thesis underlines in almost biblical and mythical terms the ordeal and agony of the thesis process. As I have had a different experience, I would like to set all despair aside, and focus on various special persons whom I would like to address.
First and foremost, I would like to thank my promotor, Prof. Dr. Sofie de Prijcker, to be open-minded about my topic and suggestions, and for giving me the chance to work it out, with this thesis as result. Subsequently, Prabal Shrestha, thank you for supervising my work. Especially your input and interesting discussions regarding Stata and inside IT information is deemed invaluable. I wish you all the best for your Ph.D. Also, big thanks for Goele Kerkhofs and the students in my writing group for their continuous support and discussions regarding writing style.
Apart from the ‘Academic world’, I would like to mention the following persons. My parents, Sonja and Toon, for their continuous support and believing in me. My fiancé Nadesja, for working almost 24/7, allowing me to fully enjoy my study endeavours, and her non-stop belief and support, you rock. Norman and René, thank you for proofreading and discussions. Especially the insights of Norman in IT were priceless in the beginning, and saved me from a wrong perception of IT variables. Lastly, Dajana Bojanic, for your interest in my research, and insights in your research.
I may have forgotten a few people here or there. Thank you all for being there.
A

1 Introduction
“…while having a meeting with one of the representatives of the company, the government official suddenly mentions that soon there will be a multimillion tender from the government. Bids have to be sent by post only, and for the sum of $ 100.000, the government official would make sure that other bids would magically disappear, and that the company would get a contract of at least $ 1 million…(Dondjio & Haafst, 2017)”
This quote stems from a meeting the author had with a government official, and is one of the numerous examples one could think of, which shows the ease of corruption when there is no digital trail. The ease of corruption may well be one of the reasons that the cost of corruption is quite high. As of today, The International Monetary Fund (2016a) estimates that the yearly total cost of corruption is around USD 2.6 trillion, and The World Bank (2016a) estimated that approximately USD 1 trillion is paid in bribes every single year. Compared to the total world economy of USD 73.7 trillion (International Monetary Fund, 2016b), total corruption cost would be roughly 3.5% of the world economy. Due to the high claimed cost of corruption, several organizations such as Transparency International are trying to combat corruption.
While corruption is said to be detrimental to economic growth (Méon & Sekkat, 2005; Mo, 2001), it is also noted that digitalization has a positive effect on the economy (Meijers, 2014). The European Commission estimates that digitalization could contribute up to USD 3.7 trillion to the world economy (The European Commission, 2016).
The connection between corruption and digitalization has not been widely researched. On top of that, due to a lack of longitudinal data, the amount of research conducted on digitalisation is considerably less as compared to corruption. Now that internet, mobile communication, and other technological diffusion is of high density, one might argue that this diffusion also generates more digitalisation of government processes. Digitalisation increases the digital ‘trail’, which in turn could lead to a higher chance of getting caught in the act of performing corrupt practises.
The suggestion arises that when a country increases its digitalisation efforts, and thus increasing the usage of digitalisation, would, ceteris paribus, result in a decline of the corruption level in the country. This paper presents an empirical evaluation of this proposition, which evolves around the research question:
“Does digitalisation significantly affect the level of corruption in a country?”
This paper argues for the inclusion of two unique proxies of digitalisation, which captures the multifaceted dimensions of digital usage. This proposition is supported by the empirical analysis of a longitudinal dataset which comprises a large set of countries. The analysis is mostly based on a fixed effects analysis.
Not only does this paper contributes theoretically by filling a gap in research, also practical use may be found. Governments could use this paper as a basis to devise a key to lowering corruption. Moreover, organizations corruption combating could use the paper as a theoretical foundation for their plea for lower corruption.
The paper is organized as follows. Section 2 reviews the literature on corruption and digital transformation, together with an explanation on how digitalisation relates to corruption. Section 3 describes the main data, the specifications estimated and the statistical approach. Section 4 shows empirical results for a range of models and tests. Section 5 tests the sensitivity of results to alternative measures of corruption, and section 6 concludes.
2

2 Literature review
The role of digitalization on corruption is of interest in this paper. Section 2.1 discusses the literature on corruption, followed by a discussion on digitalisation in section 2.2. Section 2.3 relates to the place of this paper in the literature, and section 2.4 concludes with the hypotheses.
2.1 Corruption
Corruption is a complicated topic, not so much because of a lack of research, but rather because there is no clear, worldwide accepted definition of corruption. The most used definitions in scholarly papers are for example: “The behaviour that deviates from the formal duties of a public role because of private-regarding (personal, close family, private clique) pecuniary or status gains; or violates rules against the exercise of certain private-regarding behaviour” (Klitgaard, 1991:23), or “Misuse of entrusted power for private gain” as noted by UNDP (2008).
Corruption may not be that clear-cut in the practical sense as well, because what may be considered an act of corruption in Europe, might be seen as a kind act of friendship in Africa (Bailard, 2009). Next to that, one must account for stigma effects, and that many cases of corruption are unaccounted for. Subsequently, corruption is fairly difficult to measure or quantify, making figures and statements mere estimates and perceived values, as discussed by Neiva de Figueiredo (2013). Furthermore, corruption can be defined as either collusive or extortive, where collusive is the most difficult to prove, as both parties gain from corruption, while there is a clear dominant and submissive role under extortive corruption (Brunetti & Weder, 2003).
Three conditions must be met in order for corruption to flourish (Aidt, 2011; Tanzi, 1998). The first condition is that public servants must possess a certain authority to design, bend, alter, or administer regulations in a discretionary manner. Secondly, when someone has discretionary power, he or she must be able to funnel money or gifts into his/her own account, through the regulations set by the institution. Lastly, the institutions must be weakly regulated or controlled, and the incentive to work without corruption must be low. In other words, as soon as an institution is weak, and a servant has an incentive to extract or create gifts by use of their discretionary powers, corruption can grow (Tanzi, 1998).
Because of the secrecy around corruption, it is almost impossible to measure objective actual corruption data, and therefore it is deemed unavoidable to base the analysis on subjective measures of corruption. Subjectivity in its turn, can be split into perceived and experienced corruption, both of which have their own distinct drawbacks. The major flaw with perceived values is that according to Lambsdorff (2005) there might be a significant gap between facts and perception. On the other hand, experience values might be problematic, mainly due to the reporting bias. Treisman (2007) takes it one step further, and argues that perceived and experienced values might measure factors other than corruption, in this case possibly the degree of public identification.
3

2.1.1 Corruption as determinant
Nowadays, it is commonly accepted that corruption hinders democracy, and amongst other things, stalls economic growth as also noted by Lambsdorff (1999). However, this was not always seen as straight forward. In the 1960s, corruption was seen as positive for underdeveloped countries, as it could boast innovation and efficiency (Leff, 1964; Leys, 1965). Nonetheless, Méon and Sekkat (2005) proved the opposite, and rather claim that corruption creates inefficiency, and lowers the efficacy of governmental institutions. Moreover, corruption contributes to fiscal deficits, non-alignment of markets, and political instability (Szeftel, 2000; Tanzi, 1998). Finally, even outside of the economic field the consequences of corruption can be seen. Esty and Porter (2005) find that high levels of corruption have a negative impact on environmental quality, in the sense of natural resource levels and pollution. Two years earlier, another study concluded that there is a negative correlation between corruption and biodiversity (Smith, Muir, Walpole, Balmford, & Leader-Williams, 2003).
2.1.2 Determinants of Corruption
Blended in the abovementioned conditions, one could allocate determinants of corruption to four groups of causes (Gunardi, 2008). These four groups are used in the methodology section as a basis to determine the control variables. First, there are the economic and demographic factors. Azfar and Nelson (2007) found that if salaries are low, people are more prone to corruption to make ends meet. Second is the group of political institutions, within which one could think of polarisation (left vs right wing) or civic involvement in politics. If civic involvement is low, the adherence to corruption is higher (Treisman, 2000). The third group, named the judicial and bureaucratic factors, includes the rule of law, and effectiveness of the government. If the rule of law is low in a country, and the efficacy of the government is low as well, then there is an increased risk of corruption (Aidt, 2011; Treisman, 2007). The last group comprises the geographical and cultural factors. Variables included in this group are for example the geographical location of a country or the primary religion of a country. For example, countries with a dominant Protestantism belief system are less prone to corruption then countries with other belief systems (Aidt, 2011; Gunardi, 2008), while Le (2013) concludes that a higher absolute geographical latitude results in higher wellbeing, which in turn results in a higher control of corruption.
2.2 Digitalisation
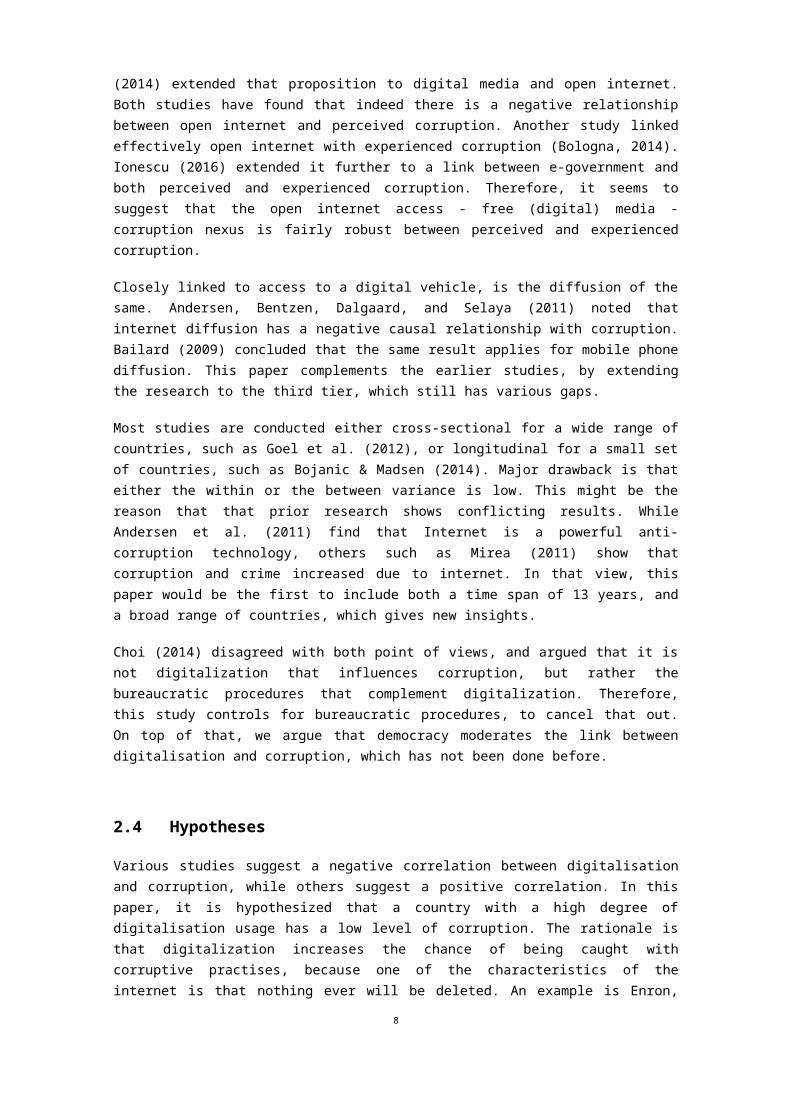
Digitalisation is a broad concept which results in various rather confusing and overlapping concepts. Oxford Dictionaries (2016) defines digitalization as: “The conversion of text, pictures, or sound into a digital form that can be processed by a computer”, while the academic concept is much broader. Khan (2016) describes three different concepts which are closely linked: digitization, digitalization, and digital transformation. The definition of Oxford Dictionaries comes close to the meaning of digitization, i.e. the conversion. Then, after conversion, tier two is digitalization, which might be seen as the access to a digital form. Finally, tier three is referred to as the usage (Gutiérrez & Gamboa, 2010). Figure 1 shows a schematically representation of the different tiers. Where tier three, the digital usage, is of interest of this study.
4

Figure 1: A model of digital technologies, adapted from van Dijk (2006)
In addition to corruption, digitalisation in its own domain has been studied extensively. Most notable studies are those where digitalization is explained through socio-economic variables, as shown for example by Gutiérrez & Gamboa (2010). They found that especially education drives ICT usage. On top of that, Stier (2015) noted that in democratic countries people use e-services more as compared to autocratic countries. Moreover, regulatory quality of the government largely explains the level of adoption of e-services in a country. Armstrong, Phillips, and Saling (2000) focused on the psychology of e-citizenship. They concluded that the adoption of e-citizenship is not only determined by IQ, but also by levels of self-esteem, and general wellbeing. As a determinant, digitalization is positively correlated with international trade and GDP, as noted by Meijers (2014), which is supported by Lera-lopez (2010).
2.3 Place in literature
This paper discusses the usage of digitalisation and the link with corruption, for which existing research has not yet come to an agreement, which results in a clear gap in theory. This paper fills this gap by addressing shortcomings of various studies.
Various studies focused on the relationship between corruption or an aspect of digitalization. Referring to figure 1, most of those studies are done in tier 1 and tier 2. For example, Brunetti and Weder (2003) studied the effect of free media on corruption. Bojanic and Madsen (2014) extended that proposition to digital media and open internet. Both studies have found that indeed there is a negative relationship between open internet and perceived corruption. Another study linked effectively open internet with experienced corruption (Bologna, 2014). Ionescu (2016) extended it further to a link between e-government and both perceived and experienced corruption. Therefore, it seems to suggest that the open internet access - free (digital) media -corruption nexus is fairly robust between perceived and experienced corruption.
Closely linked to access to a digital vehicle, is the diffusion of the same. Andersen, Bentzen, Dalgaard, and Selaya (2011) noted that internet diffusion has a negative causal relationship with corruption. Bailard (2009) concluded that the same result applies for mobile phone diffusion. This paper complements the earlier studies, by extending the research to the third tier, which still has various gaps.
Most studies are conducted either cross-sectional for a wide range of countries, such as Goel et al. (2012), or longitudinal for a small set of countries, such as Bojanic & Madsen (2014). Major drawback is that either the within or the between variance is low. This might be the reason that that prior research shows conflicting results. While Andersen et al. (2011) find that Internet is a powerful anti-corruption technology, others such as Mirea (2011) show that corruption and crime
5

increased due to internet. In that view, this paper would be the first to include both a time span of 13 years, and a broad range of countries, which gives new insights.
Choi (2014) disagreed with both point of views, and argued that it is not digitalization that influences corruption, but rather the bureaucratic procedures that complement digitalization. Therefore, this study controls for bureaucratic procedures, to cancel that out. On top of that, we argue that democracy moderates the link between digitalisation and corruption, which has not been done before.
2.4 Hypotheses
Various studies suggest a negative correlation between digitalisation and corruption, while others suggest a positive correlation. In this paper, it is hypothesized that a country with a high degree of digitalisation usage has a low level of corruption. The rationale is that digitalization increases the chance of being caught with corruptive practises, because one of the characteristics of the internet is that nothing ever will be deleted. An example is Enron, the whole basis of the corruption court case was electronic documents and transactions (Goel, Nelson, & Naretta, 2012).
Digitalisation usage data on its own is not measured. Therefore, the usage is split into two proxies, a usage measure on a population level and one on a government level. The population level proxy measures mobile telephone subscriptions, fixed broadband subscriptions, and number of individuals using internet. Together, it adds up as a normative constraint, as critical citizens can resort to digital means to base their opinion, and to hold other people accountable (Mungiu-pippidi & Dada, 2016). Due to its function as a constraint, one could argue that a higher level, and thus a higher constraint, would mean a higher risk of getting caught in a corruption act, and a higher probability of being held accountable.
The government level proxy is a compound measure of a multitude of other measures. Most importantly are functions such as tenders through internet tenders, e-ID, and tax returns through internet. But CCTV and RFID applications are also measures at a government level. Therefore, the government level acts as both a normative constraint and a legal constraint. The normative constraint works the same as explained above, while the legal constraints are resulting in an accountable and autonomous system, where there is less room to perform an act of corruption.
Consequently, we hypothesize that corruption would decline when either one of the proxies is increased. Therefore, the first hypothesis is:
Hypothesis 1: The level of digitalisation in a country, by proxy of (a) population level measure and (b) government level measure, relates negatively to the level of corruption in the same country.
Based upon earlier studies, it can be concluded that democracy in itself has as a significant effect on both corruption and digitalization (Bojanic & Madsen, 2014; Bologna, 2014). The rationale is that a democratic country is more transparent as compared to an autocratic country. Increased transparency results in an increased risk of exposure of corrupt practices (Bailard, 2009). Moreover, as Kalenborn and Lessmann (2013) claims, an autocratic country would not see an effect of media freedom on corruption simply because a corrupt official cannot be voted out the government by the people.
On top of that, Treisman (2000) discussed that the effect of digital access on corruption diminishes when there is low to none democratic environment. One could argue that an
6
autocratic country limits access to digital information. For example, North Korea has blocked access to all non-North Korean websites. Consequently, no critical information may be found about North Korea, which results in that corrupt officials cannot be held accountable by the public. This paper extents both arguments to the link between digitalisation usage and corruption. Therefore, it is expected that highly democratic countries show a stronger relationship between digitalisation and corruption, while a weaker relationship may be seen in highly autocratic countries.
Besides that, it has been argued by Bohara et al. (2004) that the effect is only significant if a country has a durable polity, and Rami et al. (2015) calculated that the cut-off point is 25 years. One could argue that when a country sees a regime change from autocratic to democratic, certain measures might take time to take effect. Combining those factors results in the following:
Hypothesis 2a: The effect of digitalization on reducing corruption is only positive when a country has a long-term democracy.
Hypothesis 2b: The effect of digitalization on reducing corruption is stronger in highly democratic countries as compared to low democratic countries.
Lastly, the income group a country belongs to has been reported to be linked with digitalisation (Vicente Cuervo & López Menéndez, 2006), and separately linked with corruption (Gunardi, 2008). It seems only logical, because people in high-income countries tend to have a higher disposable income, which can be used to purchase digital appliances or services (Lera-lopez, 2010). Moreover, if one has enough disposable income, then there is less incentive to perform corrupt practises (Meijers, 2014).
On top of that, Gunardi (2008) concludes that corruption is more severe in low-income countries because they are less integrated into the world economy. Bailard (2009) arguments that to be more integrated in the world economy, a country would need to resort to international trade, which is done mostly online. However, to be in a position of using digital means, people would need to have access to the internet or a mobile phone in the first place. Low-income might be an obstacle, thus as the income increases it also increases the number of individuals that can afford to use digital means.
This corruption-digitalisation-income nexus might be a simultaneity problem, as there could be a three-way feedback relationship involved. An increase in income might increase digitalisation, and at the same time may reduce corruption, while a lower level of corruption might lead to an increase of digitalisation, and may lead to an improvement in income, while higher usage of digitalisation might decrease corruption and increase income (Dzhumashev, 2014; Gunardi, 2008). Because of those relationships, one might first question if there is a moderating effect stemming from the income of countries. Various studies have tried to study this moderating effect, with mixed results. Dzhumashev (2014) argued that high income countries do show a significant moderating effect, while Morozumi and José (2016) argue that there is no significant difference between a low-income group of countries and a high-income group of countries. Other studies argue that it depends on other factors whether there is a significant moderating effect, such as the level of regulatory quality (Litina & Palivos, 2016). Gaskins (2013) noted that the mixed conclusions might be due to the arbitrary division of low-income versus high-income. One could argue that the large middle-income group is not represented well in such divisions. Therefore, in this paper, the figures from The World Bank are combined with a more extensive division by OECD. Therefore, this paper acknowledges four groups: low, lower-middle, upper-middle, and high-income. It is to be expected that the extensive division results in more reliable and significant results.
7

Moreover, following the conclusion of Kalenborn and Lessmann (2013) that the high-income group shows lower corruption as compared to the low-income group, combined with the result of Bologna (2014), that showed high-income groups are more digital literate when compared to low-income groups, we extent both arguments to digital usage and corruption. It is therefore expected that the low-income group barely adjusts the relationship between digital usage and corruption, and that the moderating effect grows progressively stronger along the groups, with a large, significant effect of the high-income group. Combining the abovementioned two arguments, the following two hypotheses are drafted:
Hypothesis 3a: There is a difference in the effect of digitalization on corruption between income groups of countries.
Hypothesis 3b: The relationship between digitalisation and corruption is stronger in high-income countries as compared to low-income countries.
8
3 Research Design & Methodology
The initial compiled dataset resulted in a collection of 219 countries, which were recorded in the time-period 2000-2015, along the range of nine variables. First, countries for which no corruption data is available, are deleted, which resulted in a dataset of 142 countries. Then, four countries are deleted because there were more than 70% of observations missing. These four countries are Cook Islands, Vatican City, Palestine, and South Sudan. Most likely, Cook Islands is too small to produce reliable statistics. Data from Vatican City and Palestine is sometimes added to either Italy or Israel. South Sudan is only a relative new country, which is still at war.
In the years 2000 and 2001 no (reliable) digitalization measures were recorded. On top of that, most datasets had not yet incorporated data for the year 2015. This rendered the final dataset of 138 countries, during a time span of 2002-2014. Nonetheless, every continent in the world is still incorporated in the analysis with at least two countries. The final dataset is analysed using Stata 13.0.
The following sections 3.1 through 3.3 present the key variables and descriptive statistics, for which additional details can be found in table B.1 in Appendix 1. Section 3.4 concludes with the econometric model.
3.1 Dependent Variables
By suggestion of Lambsdorff (1999), the Corruption Perception Index (CPI), as drawn up by Transparency International (2017), is used as the main dependent variable. CPI (μ=0.387, σ2=0.264) has 1716 recorded observations, which results in 78 missing observations. The years 2002-2004 are measured on a -2.5 to 2.5 scale, the years 2005-2010 on a 0-10 scale, and 2011-2014 on a 0-100 scale. To be able to compare over years, all the observations were transformed to the range [0:1]. A rough check for normality can be performed by Chebychev’s normality rule, which states that roughly 99% of all values should lie between the mean +/- 3σ. This gives us a theoretical 99% range of [-0.41:1.18], whose bounds falls even outside the real range, hence normality is assumed, however a light left skewness can be noticed.
We test for robustness against another corruption measure. By suggestion of Treisman (2007), the World Bank Control of Corruption (WBCC) measure is used as a robustness check, consequently named CorrWBCC in the model. The variable has no missing values, and is measured as well on different scales per year, hence the variable is transformed to a normal scale with mean 0 and a standard deviation of 1. This resulted in a range of [-1.8158:2.5568].
The 78 missing observations in CPI as compared to CorrWBCC, are mostly related to African Countries for the years 2002-2004 (36 observations). 29 missing observations are from Asian countries, and the rest is spread over Europe (8 missing), and Latin America (5 missing), all mostly for the years 2002-2003.
Although the correlation between CPI and CorrWBCC is quite high (0.9), there are some slight differences, which makes it perfect pair for robustness analysis. CPI is more rigorous and thus precise, because CPI needs at least three underlying sources, while CorrWBCC suffices with one (The World Bank, 2016b; Transparancy International, 2017). On the other hand, CorrWBCC is more comprehensive, as it includes both experience and perception measures, while CPI only focusses on perception (Kalenborn & Lessmann, 2013).
9

3.2 Independent Variables
Mentioned earlier, use is made of two proxies for digitalisation. First is the population level measure, which is labelled e-Citizenship. Besides e-Citizenship, a government level measure is used, which is labelled e-Government.
e-Citizenship is a compound variable which consists of (a) mobile telephone subscriptions (per 100 inhabitants), (b) fixed broadband subscriptions (per 100 inhabitants), and (c) number of individuals using internet (per 100 inhabitants). All three variables stem from the World Telecommunication / ICT Indicators Database (ITU, 2017). By suggestion of Mungiu-pippidi and Dada (2016) the variables are combined into one single variable. e-Citizenship is the simple mean of normalized values of the three variables, and has two missing observations. The range is roughly [0:148], with μ=42 and σ2=29. The within s.d. is almost as large as the between s.d., (19 vs 22) which indicates that there is a high degree of variation both across years and across countries.
e-Government is the second compound variable, which captures the degree of digitalisation within a government (i.e. to what degree is a government communicating over internet instead of by post). Suggested by Choi (2014), e-Government consists of the normalized simple mean of the e-Government Participation index and the e-Government Development Index, both obtained from the UN e-Government Survey (UNDESA, 2017). With a range of [0:1], the mean is 0.387 and the s.d. 0.214.
For both variables, a higher value means a higher level of digital usage. As the data are skewed to the left, it can be concluded that there are relatively more countries with a low form of digital usage. It is expected that both proxies are negatively related with the level of corruption.
3.3 Control Variables
In his seminal work, Gunardi (2008) analysed 68 indicators of corruption, of which only 12 passed robustness and sensitivity tests. A table of those 12 variables can be found in the appendix, table B.3. From that table, three variables are selected.
The first control variable is lngdp (μ=9.21, σ2=1.173), which is the natural logarithm of GDP per capita, which belongs in the economic and demographic group. Based upon Agostino et al. (2016) and Feenstra, Inklaar, and Timmer (2015), it is suggested to include real GDP per capita, taken from the Penn World Tables (Groningen Growth and Development Centre, 2017). The range is [6.021:12.003], and the within variation is again much lower in comparison to the between variation.
The second control variable included is Voice and Accountability, cva (μ=0.014, σ2=0.948), which belongs to the political institutions group. cva is compounded from 65 different variables, drawn from 31 different databases (The World Bank, 2016b). Both Kaufmann, Kraay and Mastruzzi (2009), and Mattozzi and Merlo (2007) stress the importance of a measure of accountability, because it creates a perception of more transparency, hence the possibility of lower corruption. Moreover, Erumban and de Jong (2006) found that countries with a high power distance, and thus a low public voice, have lower diffusion levels of digitalization. The range is [-2.218:1.826].
The last control variable in the analysis is Rule of Law, claw (μ=0.042, σ2=0.978), which belongs to the judicial and bureaucratic factors group (The World Bank, 2016b). Gunardi (2008) presented claw as one of the few most robust control variables, which performed well under the
10

strictest robust and sensitivity tests. It measures the strength and impartiality of the legal system. It is expected that all variables correlate negatively with the level of corruption.
3.4 Moderating & Classifying variables
As noted in section 2.5, the working hypothesis is that democracy moderates the effect of digitalization. This paper uses the broad and much more extensive database of Vanhanen’s measures of democracy (Finnish Social Science Data Archive, 2016), as this is seen as the most reliable democracy measure (Gutiérrez & Gamboa, 2010). The variable mdemoc is introduced which has no missing observations. The mean is at 18.23, the s.d. 12.23, and the values range from 0, which is the most autocratic country, to 47, which is the most democratic country.
On top of that, democracy is used to group countries, resulting in two groups. It would clarify and explain in greater detail the difference between democratic and autocratic countries. The division is made using data from Vanhanen’s measures of democracy (Finnish Social Science Data Archive, 2016), whom already made a distinction between democratic countries (value 1), and autocratic countries, which takes value 0.
Furthermore, Dzhumashev (2014) argued that there is a robust moderating effect stemming from the income of countries. Although GDP is already incorporated as a control variable, the interaction terms of eCIT*IncomeGroup and eGOV*IncomeGroup are added.
As slightly discussed earlier, government income is used as a grouping variable as well. Use is made of the World Bank Country and Lending Groups classification, which uses GNI to classify four groups (The World Bank, 2016c). Grouping in such a way clarifies the homogeneity among countries with the same level of income. The yearly changing classification can be found in the appendix, table B.2. As noted in the hypothesis section, it is expected that the high-income group is more negatively correlated with corruption as compared to the low-income group.
3.5 Econometric Models
The method of analysis used is a fixed-effects model. To test whether fixed effects is indeed the appropriate method, the Durbin-Watson-Hausman specificity test is performed, and a Mundlak approach to confirm. For both tests the null hypothesis is rejected, which suggests that indeed the fixed effects model is appropriate.
A joint test on time is performed, to verify if time dummies are needed to be incorporated in the model. The test statistic is significant; hence it is suggested that the time effects are equal to zero, thus time dummies are included into the model. Then, the Kleibergen-Paap rk LM test (Kleibergen & Paap, 2006) and Sargan-Hansen j statistic (Hansen, 1982) have been conducted, to test for either under-identifying variables or over-identifying restrictions. The statistics are reported in appendix 2, table B.3. For both tests, the null hypothesis is rejected at a 95% significance level, meaning that the included variables are relevant, and that there no variables that should be excluded.
The underlying relation of the variables in the previous sections is given by basic model (1):
Y ¿=β0 i+ β1 eCIT ¿+β2 eGOV ¿+β3 ln GDP¿+β4 claw¿+β5 cva¿+δ 1Year+u¿+ε¿ (1)
11

Note, that a legend for the symbols used is at the end of this section. With base equation (1) a preliminary analysis can be made for the first hypothesis. Moving on to moderated models results in additional equations. Equation 2 through 4 shows the addition of democracy, Equation 5 through 7 show the addition of income group. Denote the right-hand side of equation (1) as f (Z ¿¿¿)¿, then the added terms are:
Y ¿=f (Z¿¿¿)+β6 md emoc¿+ β7(eCIT¿¿¿∗mdemoc¿)¿¿ (2)
Y ¿=f (Z¿¿¿)+β6 mdemoc¿+β7(eGOV ¿¿¿∗mdemoc¿)¿¿ (3)
Y ¿=f (Z¿¿¿)+β6 mdemoc¿+β7(eCIT ¿¿¿∗mdemoc¿)+β8 ¿¿¿¿(4)
Separately, the effect of income group is added:
Y ¿=f (Z¿¿¿)+δ 2mginc¿+β6(eCIT¿¿ i t∗mginc¿)¿¿ (5)
Y ¿=f (Z¿¿¿)+δ 2mginc¿+β6(eGOV ¿¿¿∗mginc¿)¿¿(6)
Y ¿=f (Z¿¿¿)+δ 2mginc¿+β6(eCIT¿¿¿∗mginc¿)+β7(eGOV ¿¿¿∗mginc¿)¿¿¿ (7)
In equation 1 through 7 the following symbols are used:
i=Country ( N=138 );t=Year (T=13 ,[2002 ;2014]) ;X ¿
❑=Dependent+control variables β0=Overallmean intercept , β x=Parameter overallmean slopes ;δ 1=Year Dummy,δ 2=IncomeGroup Dummyu¿=Country specific errorε ¿=the idiosyncratic error term
Naturally, it is assumed that the error terms follow a natural distribution around mean of 0:
u¿ N (0 , σuit2 ) , ε N (0 , σ ε
2 ) (8)
12

4 Empirical Results
First, the analysis of the various models is shown in section 4.1. The groupings are discussed in section 4.2. In section 4.3 the post-analysis is discussed. Section 4.4 concludes this chapter with sensitivity and robustness analysis.
4.1 Basic Models
In the appendix, table B.10, the regression coefficients are shown of the basic model and model 2 through 7. Although not reported in the table, year dummies are included in model 2 through 7. It is noticeable that without year dummies, all variables are significant to a certain level, except the control voice & accountability. Moreover, all signs are as expected positive. However, when year dummies are included, the variables of interest are rendering insignificant. On top of that, the sign of e-Government is now negative, which is not an expected result.
When the moderating effect from the democracy index is included, which are models 2 through 4, the sign of e-Government returns to positive, however, no significant results are yielded. This is unexpected, as most literature suggest a significant result. Therefore, it is interesting to consider democracy more profoundly in the following section.
Separately, the interaction effect of the income group is added in models 5 through 7. In general, there are no significant changes to the general variables. However, it must be noted that income group 3, which groups the richest countries, is significantly different from the poorest countries, both for the interaction effect and the standalone effect. Although it is a somewhat expected result, it would be interesting to further discuss the differences between groups.
A simultaneous interaction of income group and democracy has been tested as well, however these results were significantly worsening the models. Therefore, it is ought not to further pursue that path. Considering the R2 and the adjusted R2, model 4 and model 7 outperform the others, both of which are the models where the interaction term is added to both e-Citizenship and e-Government.
4.2 Additional Models
From the basic models, two major, and a few minor implications can be drawn, which are open to further investigation. First, the effect of democracy is further explored. From the same database as the democracy index, we include now the long-term democracy effect. Table 1 shows the differences in coefficients when the interaction of a certain democracy measure is added to e-Citizenship.
Long-term democracy improves the model compared to the democracy index, as the R2 increases from 0.58 to 0.585. Now, both the interaction and the standalone measure of democracy is significant. Moreover, the p-value of e-Citizenship is nearing a significant relationship, however the effect become smaller.
13

Table 1: Democracy Coefficients
Democracy Index
Long-Term Democracy
e-Citizenship 0.000506 0.000342[0.000306] [0.000246]
e-Government -0.00884 -0.00511[0.0275] [0.0283]
ln(GDP) 0.122*** 0.113***[0.0313] [0.0313]
Voice & Accountability 0.00311 0.00357[0.0144] [0.0141]
Rule of Law 0.0917*** 0.0914***[0.0206] [0.0200]
Democracy Index 0.000833[0.000663]
Long Term Democracy 0.0716** [0.0254]
eCIT*Democracy Index -0.0000151[0.0000101]
eCIT*Long Term Democracy -0.000876** [0.000271]
Constant -0.762** -0.671* [0.280] [0.280]
N 1716 1716R-squared 0.58 0.585adjusted R-squared 0.575 0.58Standard errors in brackets * p<0.05, ** p<0.01, *** p<0.001
More interestingly, is that contrary to earlier studies, it seems that for the current dataset long term democracy outperforms the democracy index. Due to the nature of this interesting result, it would be necessary to dig deeper. On top that, various coefficients are that close to 0, that the confidence intervals indicate that the coefficients could be both minus and positive, depending on the country. As already is discovered that income group showed significant differences among groups, the following section explores it more deeply.
4.3 Grouped Analysis
First the base model without any moderating effect is grouped by income, for which results are presented in appendix 3, table B.8. It appears that the current model works especially well in the lower-middle, and to a lesser extent the upper-middle group. Although for both groups e-Citizenship is significant, the sign changes per group, which is also seen with other variables.
In general, one could argue that every group has other distinct needs. If a country is very poor, it seems like nothing adds to a predicting model. Then as soon as a country is growing, GDP, Law, and digitalisation become significant predictors of corruption. When the country enters the next stage, predictors are levelled off, as like a maturity stage in growth-theory.
14

Table 2: Grouped Coefficients
Income: Low Lower-Middle Upper-Middle High
e-Citizenship -0.000124 0.000961*** -0.000904***0.000644*
* [0.000344
] [0.000272] [0.000247] [0.000242] Long Term Democracy 0 0.0954*** 0.0481* -0.0217
[.] [0.0269] [0.0221] [0.0308] e-Cit*LT Democracy 0.0117 0.000241 -0.000218 -0.000428
[0.00950] [0.000496] [0.000356] [0.000255] e-Government 0.104* -0.0135 -0.0000866 0.0525*
[0.0484] [0.0263] [0.0293] [0.0252] ln(GDP) -0.0303 0.107*** 0.0876* -0.0364
[0.0263] [0.0242] [0.0405] [0.0350] Voice & Accountability -0.0203 0.0312* 0.0102 -0.0377
[0.0151] [0.0136] [0.0188] [0.0250] Rule of Law 0.0617*** 0.114*** 0.0950*** 0.173***
[0.0182] [0.0141] [0.0207] [0.0222] Constant 0.39 -0.626** -0.502 0.837*
[0.199] [0.208] [0.375] [0.362] N 342 455 396 523R-sq 0.68 0.769 0.694 0.289adj. R-sq 0.614 0.72 0.628 0.181Standard errors in brackets, * p<0.05, ** p<0.01, *** p<0.001
Table 2 shows it even more clear with the interaction effect of democracy included. The lower-middle and upper-middle are quite alike, resulting in basically three distinct stages of a country. Once again, in a poor country, e-Government is of importance. A country which belongs in the middle-income group, drifts away from e-Government, but rather digitalisation on a citizen level is of more importance, as is the long-term democracy. Also, Economic performance in the name of GDP becomes increasingly important, as is voice & accountability. The final stage turns back again to e-Government. It must be noted that although the interaction effect is not significant at a 95% level, it would be the significant at a 90% level.
One could argue that this three-stage process is quite logical. Whenever a country is very poor, citizens would in general not have enough disposable income to pay for digitalisation and its use. When the majority cannot afford digital means, then the digital means are of no importance to predict corruption. However, governments of poor countries are obliged to fulfil certain digital procedures when borrowing money from IMF or World Bank, such as posting tenders online, and accepting electronic bids. Consequently, the usage base of digitalisation is quite high among those governments. As noted in the research design, when information flows are transparent and digital, it would become increasingly difficult to perform corrupt practises, hence a higher e-Government would result in lower corruption.
As soon as the economy is picking up, and thus citizens would have more disposable income, people would start buying digital access, and thus digital usage would increase. Now, people can voice their thoughts, and read those of others online. In this middle section, the moral constraints are thus becoming increasingly important.
15

Finally, in the rich countries, e-citizenship becomes less important, because one could argue that in rich countries, all citizens would have access to digital means, and use them daily. There is a limit to the usage of digitalisation, as no one would have more than 2 broadband connections at home, or more than 2 mobile phones, etcetera. This could be the reason why the
R2 is much lower. On the other hand, government becomes important again to predict corruption. Rich governments have early access to new digital means, therefore growth in e-Government continues. One could think of biometrics identification for example.
Other measures of democracy have been tested, as well as three-way interactions of democracy and e-government, however those results were again worsening the prediction.
4.4 Post Analysis
Now the final models are known, additional tests are to be performed. First, a recap of the model. The coefficients differ per income group, resulting in actually 4 different models. From here on, the analysis is conducted for the lower-middle income group.
Y ¿=−0.626+0.001eCIT ¿−0.135 eGOV ¿+0.096 ltDemos¿+0.001interaction¿+0.107 ln GDP¿+0.114 claw¿+0.032cva¿+δ 1Year+u¿+ε¿
The cross-sectional dependence is tested by the Pesaran test. The result (0.08) suggests that the residuals are not correlated, and thus no cross-sectional dependence exists. Therefore, it is safe to assume that no contemporaneous correlation bias exists. The Modified Wald test suggest, as expected earlier, that some heteroskedasticity exists. It would not pose too much of a problem, since the model is estimated using robust standard errors, with the downside of increased standard errors. Furthermore, the Wooldridge autocorrelation test suggest that there is some autocorrelationx in the data. Once again, due to the cluster robust model, it would not pose a large problem.
As reported in appendix 2, table B.4 and B.5, it can be noticed that all Variance Inflation Factors (VIF) values are below the rule of thumb threshold of 10, with the highest VIF being 4.47. It is rather safe to state that there is thus no indication of multicollinearity (O’brien, 2007). On top of that, the residuals show a quite stable line, with a small deviation in the tails. Consequently, it is safe to assume normality of the residuals.
To verify if the results are robust to specification, the model is plotted against the other corruption measure: CorrWBCC. As can be noted in table B.10 in the appendix, the two measures operate quite similar in the middle-income groups. Roughly same variables are significant, and the sign is also the same. There are differences noted in the low and high income groups. Therefore, one could argue that the results are fairly robust for the middle-income groups, and not robust in the low and high income groups.
Both CPI and CorrWBCC have been tested with jackknife and bootstrap methods of resampling, to verify if standard errors change. The standard errors differed slightly for some variables, however the difference was smaller than 0.00001. Hence it is safe to conclude that in that, the model is robust.
16

5 Conclusion
This paper empirically analysed the relationship between digitalisation and corruption, and the role of several contextual determinants in this field by means of a set of fixed effects models. Moreover, the robustness of the results was verified against another measure of corruption and bootstrap and jackknife resampling methods.
In general, digitalisation by proxy of e-Citizenship plays not a significant role in determining corruption. If a country would increase on the e-Citizenship index, then ceteris paribus, the country would increase on the perceived corruption index as well, meaning thus lower corruption levels. On the other hand, e-Government was found to have an opposite effect. These relationships, although not significant, were also found when using the experienced corruption measure. Moreover, the coefficients were very close to 0, meaning that a 95% confidence interval shows that the coefficients could in the end turn positive or negative, depending on the country. Linking our result to hypothesis 1a and 1b, we argue that we must reject the hypothesis on a 95% confidence level.
However, we do establish a new insight on the effect of democracy, and a new theoretical basis concerning income group. Contrary to earlier theory, we have proven that a democracy index in the current model set has no significant influence, in the sense that both interaction as democracy as a standalone does not yield significant p-values. Therefore, hypothesis 2b is rejected on a 95% confidence level. However, we do show that a long-term democracy does have a significant influence on the relationship between digitalisation and corruption. Moreover, countries with a long-term democracy are behaving significantly different then countries wo are not a long-term democracy. We therefore argue that long-term democratic are in general less corrupt as compared to non-democratic countries. Consequently, we cannot reject the hypothesis 2a, that the effect of digitalization on reducing corruption is only positive when a country has a long-term democracy.
Even more interestingly is the theoretical basis concerning the differences among income groups. Contrary to earlier studies, which saw no significant difference at all, or a slight difference between low and high income groups, we prove another theorem. Indeed, on a general note, the high-income countries perform significantly better than low-income countries. Thus, indeed hypothesis 3b cannot be rejected. However, as per the economic growth model, the effect of digitalisation on corruption follows the same sort of growth. A low-income country has not adopted digitalisation at large, due to lack of money, hence e-citizenship is not a significant predictor. However, the same country must follow borrowing rules of IMF, hence digitalisation at a government is widely adopted. High adoption of e-Government results in constraints on performing corrupt practises. Consequently, e-Government is significantly decreasing corruption. The next stage of the curve is the middle-income. A country in these groups realizes economic growth, and thus disposable income. As a result, citizens can buy digital access, and thus increase digital usage. Now, e-Citizenship runs significant, and thus indeed lowering corruption. However, it appears that the curve reaches a sort of maturity stage at the level of upper-middle income, as the link slows down in the high-income group. Consequently, hypothesis 3a cannot be rejected as well. The evolution of this marginal effect would be an interesting follow-up study.
Finally, contrary to earlier studies where differences between measures of corruption were deemed insignificant, we prove that there exists a significant difference between WBCC and CPI. Modelling on CPI show significant better results, such as lower standard errors which in turn resulted in a more normal distribution of the residuals. Next to that, the model itself is
17

considered robust, since bootstrap and Jackknife resampling methods yield near identical results.
For now, it appears to be that the answer to the research question: “Does digitalisation significantly affect the level of corruption in a country?” remains inconclusive. Research shows that it highly depends on the income group of a country, and to the corruption measure used. If the CorrWBCC measure is used, then evidence does not support the statement. If the CPI measure is used, then evidence supports this statement. A possible argument as to why perception values are a better fit than experienced corruption, might be digitalisation itself. For instance, reading on the internet about a corrupt case increases the level of perceived corruption, while the majority would not experience it. In a way, one might argue that perceived values ought to be more reliable compared to experienced values. Follow-up studies are needed to review in detail the exact difference between CorrWBCC and CPI.
However, no research is flawless in the light of limitations and restrictions. The first major limitation concerns the time series included. The study consists of 13 years, which made the within-variation of 0.25 a little low, resulting in a limited fixed effects estimator. In a few years, when more data points can be included, stronger conclusions could be drawn.
Secondly, the study measures a time-period, within which a lot has happened in the world. These exogenous events may (or may not) have an indirect effect on the model. A simple example can make this abundantly clear: At the end of the 2000s we have seen an economic crisis unlike anything we have seen before the 1930s. Governments had no clear, structured solutions to the changed economic environment, resulting in mass layoffs in recent years. When in that period the perceived value of corruption is measured, it might be that instead of corruption levels of a government, the dissatisfaction with the government is being tested. If more data points become available, the significance of these exogenous events might be lowered.
Thirdly, there might be an issue with QMC (Quasi Multi Collinearity), as some variables possibly test the same concept. Although the robust fixed effects models are still unbiased, the standard errors are increased, and thus tests may be invalid or unreliable. On the other hand, almost any variable might show some QMC.
Lastly, due to time constraints, and because of a too wide scope of research, there are various restrictions on this research, which might be most interesting to follow up on in further studies. These may present another view on the topic, using another line of approach.
18

6 References
Agostino, G. D., Dunne, J. P., & Pieroni, L. 2016. Government Spending , Corruption and Economic Growth. World Development, 84(1997): 190–205.
Aidt, T. S. 2011. The Causes of Corruption. CESifo DICE Report, 10(2): 15–19.Andersen, T. B., Bentzen, J., Dalgaard, C.-J., & Selaya, P. 2011. Does the Internet
reduce corruption? Evidence from US states and across countries. The World Bank Economic Review, lhr025.
Armstrong, L., Phillips, J. G., & Saling, L. L. 2000. Potential determinants of heavier Internet usage. International Journal of Human-Computer Studies, 53(4): 537–550.
Azfar, O., & Nelson, W. R. 2007. Transparency, wages, and the separation of powers: An experimental analysis of corruption. Public Choice, 130(3–4): 471–493.
Bailard, C. S. 2009. Mobile Phone Diffusion and Corruption in Africa. Political Communication, 26(3): 333–353.
Bohara, A. K., Mitchell, N. J., & Mittendorff, C. F. 2004. Compound Democracy and the Control of Corruption : A Cross-Country Investigation, 32(4).
Bojanic, D., & Madsen, E. S. 2014, July. The Effect of Internet and Digital Media Freedom on Corruption. Aarhuis. http://pure.au.dk/portal-asb-student/files/79187961/The_Effect_of_Internet_and_Digital_Media_Freedom_on_Corruption.pdf.
Bologna, J. 2014. Is the Internet an effective mechanism for reducing corruption experience? Evidence from a cross-section of countries. Applied Economics Letters, 21(10): 687–691.
Brunetti, A., & Weder, B. 2003. A free press is bad news for corruption. Journal of Public Economics, 87(7): 1801–1824.
Choi, J. 2014. E-Government and Corruption : A Cross- Country Survey, 10(2): 217–236.
Dondjio, I., & Haafst, R. 2017. Managing Your Business – A Practical Guide (1st ed.). Groningen: Noordhoff Uitgevers.
Dzhumashev, R. 2014. Corruption and growth : The role of governance , public spending , and economic development ☆. Economic Modelling, 37: 202–215.
Erumban, A. A., & de Jong, S. B. 2006. Cross-country differences in ICT adoption: A consequence of Culture? Journal of World Business, 41(4): 302–314.
Esty, D. C. (Yale L. S. and Y. S. of F. and E. S., & Porter, M. (Harvard B. S. 2005. National environmental performance: an empirical analysis of policy results and determinants. Environment and Development Economics, 10(4): 391–434.
Feenstra, R. C., Inklaar, R., & Timmer, M. P. 2015. The Next Generation of the Penn World Table. American Economic Review, 105(10): 3150–3182.
Finnish Social Science Data Archive. 2016. Vanhanen, Tatu (University of Tampere): Measures of Democracy 1810-2014. http://urn.fi/urn:nbn:fi:fsd:T-FSD1289.
Gaskins, L. E. 2013. THE EFFECT OF (ICT) DIFFUSION ON CORRUPTION AND TRANSPARENCY. Texas A&M International University.
Goel, R. K., Nelson, M. A., & Naretta, M. A. 2012. The internet as an indicator of corruption awareness. European Journal of Political Economy, 28(1): 64–75.
Groningen Growth and Development Centre. 2017. Penn World Table version 9.0. https://doi.org/10.15141/S5J01T.
Gunardi, H. S. 2008. Corruption and Governance around the World: An Empirical Investigation. Rijksuniversiteit Groningen.
I

http://www.rug.nl/research/portal/publications/pub(f2c01b20-8c9f-4494-b9f0-b3031814eaea).html.
Gutiérrez, L. H., & Gamboa, L. F. 2010. Determinants of ICT Usage among Low-Income Groups in Colombia, Mexico, and Peru. The Information Society, 26(5): 346–363.
Hansen, L. P. 1982. Large Sample Properties of Generalized Method of Moments Estimators. Econometrica, 50(4): 1029.
International Monetary Fund. 2016a. Corruption: Costs and Mitigating Strategies. https://www.imf.org/en/Publications/Staff-Discussion-Notes/Issues/2016/12/31/Corruption-Costs-and-Mitigating-Strategies-43888.
International Monetary Fund. 2016b. World Economic Outlook Database. http://www.imf.org/external/pubs/ft/weo/2016/02/weodata/index.aspx.
Ionescu, L. 2016. E-Government and Social Media as Effective Tools in Controlling Corruption in Public Administration. Economics, Management, and Financial Markets, 11(1): 66–72.
ITU. 2017. World Telecommunication/ICT Indicators Database. http://www.itu.int/en/ITU-D/Statistics/Pages/stat/default.aspx.
Kalenborn, C., & Lessmann, C. 2013. The impact of democracy and press freedom on corruption: Conditionality matters. Journal of Policy Modeling, 35(6): 857–886.
Kaufmann, D., Kraay, A., & Mastruzzi, M. 2009. Governance Matters VIII Aggregate and Individual Governance Indicators 1996–2008. Policy Research Working Paper. no. WPS4978.
Khan, S. 2016. Leadership in the digital age – A study on the effects of digitalisation on top management leadership. Stockholm University, 54.
Kleibergen, F., & Paap, R. 2006. Generalized reduced rank tests using the singular value decomposition. Journal of Econometrics, 133(1): 97–126.
Klitgaard, R. 1991. Controlling Corruption. Berkely: University of California press.Lambsdorff, J. G. 1999. Corruption in empirical research: A review, 6: 17. Durban:
Transparency International, processed.Lambsdorff, J. G. 2005. What do We Know from a Cross-Section of Countries?
Consequences and Causes of Corruption, 63.Le, S. H. T. . 2013. Societal Trust and Geography. Cross-Cultural Research, WVS(4):
388–414.Leff, N. H. 1964. Economic development through bureaucratic corruption. The
American Behavioral Scientist, 8(3): 8–14.Lera-lopez, M. B. F. 2010. Differences in digitalization levels : a multivariate analysis
studying the global digital divide, 39–73.Leys, C. 1965. What is The Problem About Corruption? The Journal of Modern
African Studies, 3(2): 215.Litina, A., & Palivos, T. 2016. Journal of Economic Behavior & Organization
Corruption , tax evasion and social values. Journal of Economic Behavior and Organization, 124: 164–177.
Mattozzi, A., & Merlo, A. 2007. The Transparency of Politics and the Quality of Politicians. The American Economic Review, 97(2): 311–315.
Meijers, H. 2014. Does the internet generate economic growth , international trade , or both ? International Economics and Economic Policy, 11(1): 137–163.
Méon, P. G., & Sekkat, K. 2005. Does corruption grease or sand the wheels of growth? Public Choice, 122(1–2): 69–97.
Mirea, V. 2011. FRAUD , CORRUPTION AND CYBER CRIME IN A GLOBAL DIGITAL NETWORK, 6(2): 373–380.
Mo, P. H. 2001. Corruption and Economic Growth. Journal of Comparative II

Economics, 79(29): 66–79.Morozumi, A., & José, F. 2016. Public spending and growth : The role of government
accountability. European Economic Review, 89: 148–171.Mungiu-pippidi, A., & Dada, R. 2016. Measuring Control of Corruption by a New
Index of Public Integrity, 415–438.Neiva de Figueiredo, J. 2013. Are corruption levels accurately identified? The case of
U.S. states. Journal of Policy Modeling, 35(1): 134–149.O’brien, R. M. 2007. A Caution Regarding Rules of Thumb for Variance Inflation
Factors. Quality & Quantity, 41(5): 673–690.Rami, S., Jetter, M., & Montoya, A. 2015. The Effect of Democracy on Corruption :
Income is Key, 74: 286–304.Smith, R. J., Muir, R. D. J., Walpole, M. J., Balmford, A., & Leader-Williams, N. 2003.
Governance and the loss of biodiversity. Nature, 426(6962): 67–70.Stier, S. 2015. Political determinants of e-government performance revisited:
Comparing democracies and autocracies. Government Information Quarterly, 32(3): 270–278.
Szeftel, M. 2000. Clientelism, corruption & catastrophe. Review of African Political Economy, 27(85): 427–441.
Tanzi, V. 1998. Corruption Around the World: Causes, Consequences, Scope, and Cures. Staff Papers - International Monetary Fund, 45(4): 559.
The European Commission. 2016. The importance of the digital economy. Growth. https://ec.europa.eu/growth/sectors/digital-economy/importance_en.
The World Bank. 2016a. Anti-corruption. http://www.worldbank.org/en/topic/governance/brief/anti-corruption.
The World Bank. 2016b. The Worldwide Governance Indicators (WGI) project. http://info.worldbank.org/governance/wgi/index.aspx#home.
The World Bank. 2016c. World Bank Country and Lending Groups. https://datahelpdesk.worldbank.org/knowledgebase/articles/906519.
Transparancy International. 2017. CPI Research. http://www.transparency.org/research/cpi/.
Treisman, D. 2000. The causes of corruption: a cross-national study. Journal of Public Economics, vol. 76. https://doi.org/10.1016/S0047-2727(99)00092-4.
Treisman, D. 2007. What Have We Learned About the Causes of Corruption from Ten Years of Cross-National Empirical Research? Annual Review of Political Science, 10(1): 211–244.
UNDESA. 2017. UN E-Government Survey. https://publicadministration.un.org/egovkb/en-us/reports/un-e-government-survey-2016.
UNDP. 2008. Tackling Corruption: Transforming Lives, Accelerating Human Development in Asia and the Pacific. Accelerating Human Development in Asia and the Pacific. http://scholar.google.com/scholar?hl=en&btnG=Search&q=intitle:TACKLING+CORRUPTION+,+TRANSFORMING+LIVES+Accelerating+Human+Development+in+Asia+and+the+Pacific#0.
UNSD. 2016. Standard Country or Area Codes for Statistical Use. https://unstats.un.org/unsd/methodology/m49/.
van Dijk, J. A. G. M. 2006. Digital divide research, achievements and shortcomings. Poetics, 34(4–5): 221–235.
Vicente Cuervo, M. R., & López Menéndez, A. J. 2006. A multivariate framework for the analysis of the digital divide: Evidence for the European Union-15. Information & Management, 43(6): 756–766.
III

Appendix 1
Table B.1: Key Variables, Descriptive Statistics, and Sources
Variable Definition N Source
Descriptives ([min:max], mean;sd) n=138, T=13
Between sd; Within sd
CorrWBCC Control of Corruption measure 1794 Worldwide Governance Indicators, The World
Bank: [-1.816:2.557] 0.052; 1.019 1.008; 0.174 http://www.govindicators.org
CPI Corruption Perception Index 1716 Transparancy International
[0:1] 0.387; 0.264 0.254; 0.066 http://www.transparency.org/cpi2015eCIT e-Citizenship 1792 International Telecommunication Union
[0.049:148.565] 42.539; 29.609 22.044; 19.839 http://www.itu.inteGOV e-Government 1794 e-Government database, UN
[0:0.973] 0.387; 0.214 0.193; 0.095 https://publicadministration.un.org/en/
ltdem Longterm Democracy 1793 FSD Van Haanen Dataset
[0:1] 0.256; 0.264 https://services.fsd.uta.fi/catalogue/FSD1289lngdp Natural Logarithm of GDP per Capita 1794 Penn World Tables
[6.021:12.003] 9.21; 1.173 1.169; 0.137 http://www.rug.nl/ggdc/productivity/pwt/
cva Voice & Accountability 1794 Worldwide Governance Indicators, The World Bank:
[-2.218:1.826] 0.014; 0.948 0.941; 0.139 http://www.govindicators.org
claw Rule of Law 1794 Worldwide Governance Indicators, The World Bank:
[-1.91:2.12] 0.042; 0.978 0.968; 0.137 http://www.govindicators.org
I

Appendix 2
Table B.2: Under & Over identification
Test Statistic χ2(5) P-Value
Kleibergen-Paap rk LM test of under-identification 1633.16 0.000Sargan-Hansen j statistic of overidentification 89.275 0.000
Table B.3: Variable Inflation Factors
Variable VIF Tolerance
e-Citizenship 2.51 0.3985e-Government 2.96 0.3378
ln(GDP) 3.08 0.3250
Voice & Accountability 2.92 0.3421
Rule of Law 4.47 0.2239
Table B.4: Panel Unit Root Test
Variable t̄ p-value
Corruption 1.423 0.923e-Citizenship 7.446 1.000
e-Government -5.264 0.000
ln(GDP) -0.264 0.400
Voice & Accountability -2.944 0.002
Rule of Law 0.860 0.805
Table B.5: Robust determinants of Corruption, adapted from Seldadyo, 2005.
Variable Name Group Sign of Correlation Test 1 Test 2Government Effectiveness 3 (-) Yes Yes
Rule of Law 3 (-) Yes Yes
GDP/ Capita 1 (-) Yes No
Regulatory Quality 3 (-) Yes No
Political Polarization 2 (-) Yes No
Protestant fraction 4 (-) Yes No
Presidentialism 2 (-) No No
Absolute latitude 4 (-) No No
Voice & Accountability 2 (-) No No
Wage bill 3 (+) No No
Population size 1 (+) No No
Economic Freedom 1 (-) No No
II

Table B.6: Government Income Groups
Income Group 2002 2003 2004 2005 2006 2007
Low income (L) <= 735 <= 765 <= 825 <= 875 <= 905 <= 935Lower middle income (LM) 736-2,935 766-3,035 826-3,255 876-3,465 906-3,595 936-3,705
Upper middle income (UM)
2,936-9,075
3,036-9,385
3,256-10,065
3,466-10,725
3,596-11,115
3,706-11,455
High income (H) > 9,075 > 9,385 > 10,065 > 10,725 > 11,115 > 11,455
Income Group 2008 2009 2010 2011 2012 2013 2014
Low income (L) <= 975 <= 995 <= 1,005 <= 1,025 <= 1,035 <= 1,045 <= 1,045Lower middle income (LM) 976-3,855 996-3,945 1,006-
3,9751,026-4,035
1,036-4,085
1,046-4,125
1,046-4,125
Upper middle income (UM)
3,856-11,905
3,946-12,195
3,976-12,275
4,036-12,475
4,086-12,615
4,126-12,745
4,126-12,735
High income (H) > 11,905 > 12,195 > 12,275 > 12,475 > 12,615 > 12,745 > 12,735
III

Appendix 3
Table B.7: Model Coefficients Base Model 1 Model 2 Model 3 Model 4 Model 5 Model 6 Model 7e-Citizenship 0.00113*** 0.000294 0.000506 0.000225 0.000405 0.000922 0.000297 0.000871
[0.000167] [0.000237] [0.000306] [0.000224] [0.000279] [0.000484] [0.000224] [0.000476]e-Government 0.0523* -0.00476 -0.00884 0.0413 0.016 0.00213 0.0714 0.0259
[0.0258] [0.0281] [0.0275] [0.0503] [0.0480] [0.0271] [0.0632] [0.0603]ln(GDP) 0.136*** 0.122*** 0.122*** 0.124*** 0.123*** 0.0873** 0.106** 0.0855*
[0.0290] [0.0316] [0.0313] [0.0306] [0.0308] [0.0334] [0.0321] [0.0333]Voice & Accountability 0.00107 0.00505 0.00311 0.0034 0.0031 -0.00317 0.000545 -0.00332
[0.0161] [0.0145] [0.0144] [0.0146] [0.0145] [0.0133] [0.0138] [0.0133]Rule of Law 0.0898*** 0.0906*** 0.0917*** 0.0897*** 0.0908*** 0.0988*** 0.0927*** 0.0991***
[0.0220] [0.0206] [0.0206] [0.0204] [0.0205] [0.0201] [0.0201] [0.0199]Democracy 0.000833 0.00116 0.001134
[0.000663] [0.000863] [0.000864] eCIT*Democracy -0.0000151 -0.0000104
[0.000011] [0.00000975] eGOV*Democracy -0.00244 -0.00125
[0.00184] [0.00185] Dummy Income group 1 0.0038 0.00758 -0.000297
[0.0124] [0.0175] [0.0176]Dummy Income group 2 0.015 0.0408 0.0329
[0.0176] [0.0230] [0.0235]Dummy Income groep 3 0.0767* 0.0733 0.0864*
[0.0372] [0.0398] [0.0430]eGOV*Income group 1 0.0145 0.0246
[0.0642] [0.0635]eGOV*Income group 2 -0.111 -0.062
[0.0695] [0.0691]eGOV*Income group 3 -0.121 -0.0326
[0.0737] [0.0726]eCIT*Income group 1 -0.0000702 -0.000145
[0.000422] [0.000430]eCIT*Income group 2 -0.000735 -0.000582
IV
[0.000441] [0.000447]Table B.7: Continued
Base Model 1 Model 2 Model 3 Model 4 Model 5 Model 6 Model 7eCIT*Income group 3 -0.00119* -0.00111*
[0.000482] [0.000481]Constant -0.942*** -0.753** -0.762** -0.784** -0.775** -0.456 -0.633* -0.446
[0.260] [0.283] [0.280] [0.273] [0.274] [0.294] [0.286] [0.295]N 1716 1716 1716 1716 1716 1716 1716 1716R-sq 0.428 0.577 0.58 0.58 0.581 0.595 0.589 0.597adj. R-sq 0.427 0.573 0.575 0.575 0.576 0.589 0.584 0.59Standard errors in brackets, Year dummies absorbed, * p<0.05, ** p<0.01, *** p<0.001
Table B.8: Grouped Coefficients
Income: Low Lower-Middle Upper-Middle Highe-Citizenship -0.000116 0.000823* -0.000926* 0.000507
[0.000349] [0.000403] [0.000387] [0.000414] e-Government 0.101 -0.019 -0.0122 0.0499
[0.0685] [0.0356] [0.0450] [0.0391] ln(GDP) -0.028 0.115** 0.0902 -0.0405
[0.0436] [0.0373] [0.0599] [0.0980] Voice & Accountability -0.0212 0.0383 0.017 -0.049
[0.0218] [0.0234] [0.0250] [0.0470] Rule of Law 0.063 0.0974* 0.115*** 0.177***
[0.0430] [0.0394] [0.0272] [0.0485] Constant 0.373 -0.697* -0.518 0.883
[0.335] [0.319] [0.558] [1.011] N 342 455 396 523R-sq 0.678 0.753 0.683 0.277adj. R-sq 0.661 0.743 0.669 0.253Standard errors in brackets * p<0.05, ** p<0.01, *** p<0.001
V

Table 3.B: CPI vs CorrWBCC
Income: CPI Low CorrWBCC Low Lower-Middle CorrWBCC LM Upper-Middle CorrWBCC UM High CorrWBCC Highe-Citizenship -0.000124 0.00242 0.000961*** 0.000741 -0.000904*** -0.00126 0.000644** -0.0012
[0.000344] [0.00165] [0.000272] [0.00152] [0.000247] [0.00126] [0.000242] [0.00235] Long Term Democracy 0 0 0.0954*** 0.394*** 0.0481* 0.0378 -0.0217 -0.177
[.] [.] [0.0269] [0.0654] [0.0221] [0.0836] [0.0308] [0.159] e-Cit*LT Democracy 0.0117 0.0330* 0.000241 -0.00281 -0.000218 -0.00096 -0.000428 0.000652
[0.00950] [0.0131] [0.000496] [0.00155] [0.000356] [0.00141] [0.000255] [0.00203] e-Government 0.104* 0.138 -0.0135 0.103 -0.0000866 -0.248 0.0525* -0.00547
[0.0484] [0.315] [0.0263] [0.153] [0.0293] [0.162] [0.0252] [0.144] ln(GDP) -0.0303 -0.118 0.107*** 0.264* 0.0876* 0.493** -0.0364 0.076
[0.0263] [0.123] [0.0242] [0.110] [0.0405] [0.175] [0.0350] [0.201] Voice & Accountability -0.0203 0.132 0.0312* 0.379*** 0.0102 0.205** -0.0377 0.0455
[0.0151] [0.120] [0.0136] [0.0936] [0.0188] [0.0747] [0.0250] [0.212] Rule of Law 0.0617*** 0.645** 0.114*** 0.346*** 0.0950*** 0.402*** 0.173*** 0.780***
[0.0182] [0.210] [0.0141] [0.0921] [0.0207] [0.0951] [0.0222] [0.200] Constant 0.39 0.742 -0.626** -2.535** -0.502 -4.612** 0.837* -0.327
[0.199] [0.929] [0.208] [0.929] [0.375] [1.640] [0.362] [2.068] N 342 383 455 470 396 405 523 531R-sq 0.68 0.364 0.769 0.352 0.694 0.267 0.289 0.289adj. R-sq 0.614 0.332 0.72 0.325 0.628 0.231 0.181 0.262Standard errors in brackets, * p<0.05, ** p<0.01, *** p<0.001
VI

Press release
For immediate release
Digitalisation efforts are key in combatting corruption
Corruption is a major economic concern across the globe, hence it is no surprise that organizations such as Transparency International are trying to combat corruption. Recent research conducted at KU Leuven, Belgium shows that digitalisation might just be the key to lower corruption.
Researchers found out that e-Citizenship, i.e. the number of mobile phones or the number of internet users in a country, affects corruption. Moreover, if the number of internet users increases, then corruption decreases. Additionally, the same study showed that especially low-income countries could benefit also from increased e-Government practises. Digital ID, Government Internet Portals, online tenders, and so on, all result in lower corruption.
The reasoning behind it is quite straight forward. Researcher Robert Haafst explains: “Imagine a country with no internet, no mobile phones, no TV, nothing digital is available. Most likely corruption would flourish as people would want to increase their income. Moreover, in the unlikely case you are getting caught, not so many people would hear about it. So, there is no ‘moral’ pressure. Now, imagine the opposite, a country full of digitalisation. An act of corruption would be on the news, people read and discuss it on internet, etc. Most likely, someone would not want that kind of attention, especially since the internet has a tendency of not to forget.”
The same reasoning applies to e-Government. Robert: “Imagine a country where the government does everything by paper: creating an ID, purchasing goods, etc. A piece of paper is much easier to forge than a transparent digital system. On top of that, payments through secure digital channels reduces the risk that a government official asks you for a bribe, simply because it is not possible anymore”
The IMF estimates that the yearly cost of corruption is around $ 2.6 trillion. A huge cost, compared to the global economy of roughly $ 70 trillion. To put in perspective, only 5 countries in the world show a larger economy than the total cost of corruption. It comes as no surprise that various organizations are keen on lowering corruption.
Now, governments and organizations combatting corruption, are presented a tool with which it is possible to calculate policy effects regarding digitalisation. In the end, it all comes down to the following: If you want to lower corruption, provide enough digitalisation.
About KU Leuven: KU Leuven has been a centre of learning for almost six centuries. Founded in 1425, KU Leuven is one of the oldest and most renowned universities in Europe. With 11 campuses throughout Belgium, KU Leuven facilitates more than 58000 students and 7000 researchers. KU Leuven is a research-intensive, internationally oriented university that carries out both fundamental and applied research. It is strongly inter- and multidisciplinary in focus and strives for international excellence.
Press contact:Mr. Robert Haafst, KU [email protected] or [email protected] +31(0)6-30693833
VII

FACULTY OF ECONOMICS AND BUSINESSCAMPUS CAROLUS ANTWERP
KORTE NIEUWSTRAAT 332000 ANTWERP
PHONE. + 32 3 201 18 [email protected]