Embed Size (px)
Citation preview

i
TABLE OF CONTENTS1 INTRODUCTION............................................................................................12 LEADERSHIP IN SUSTAINABILITY.............................................................3
2.1 A UNIQUE CONTEXT........................................................................................................................................32.2 HIGH LEVEL OF CONTROL OVER ENERGY SYSTEM TRANSFORMATION.........................................................................32.3 A CHANGING CLIMATE.....................................................................................................................................4
3 SEATTLE URBAN CENTERS.......................................................................64 FOSTERING AN ENERGY SYSTEM TRANSFORMATION.........................8
4.1 BASELINE ENERGY AND EMISSIONS PROFILE..........................................................................................................8Energy Supply......................................................................................................................................................8Buildings.............................................................................................................................................................9Summary.............................................................................................................................................................9
4.2 TRANSFORMATION SCENARIO AND HIGH PRIORITY ACTIONS..................................................................................10Energy Supply....................................................................................................................................................11Buildings...........................................................................................................................................................13Summary...........................................................................................................................................................17
ii

1 INTRODUCTIONCities across the world are beginning to take climate change seriously, and are implementing a range of strategies, policies and programs to dramatically reduce their greenhouse gas emission (GHG) contributions into the atmosphere. To avoid a catastrophic level of global warming, these innovative urban centers have pledged to reduce their emissions by 80% by the year 2050, with a longer term target of relying on 100% renewable energy in all aspects of urban life.
To make this transition will require a considerable transformation in the way we work, live and get around, as well as a new way of thinking about and designing our cities. As a starting point, many local jurisdictions are focusing their efforts on the transformation of individual neighborhoods as a way of piloting novel planning tools, development models, and engagement methods. While many of the plans and policies required at the neighborhood scale are applicable to urban systems more broadly, others must be tailored to the unique context and circumstances of a particular area. Existing energy infrastructure, building types, transportation networks, and many other community dimensions need all be considered in weighing the various approaches to decarbonization to ensure the right fit and highest level of success.
With funding from the Carbon Neutral Cities Alliance (CNCA), Integral Group collaborated with the cities of Boulder, Minneapolis, and Seattle in 2016 to develop a step-by-step guide, the Energy System Transformation Playbook (Playbook), to help municipal governments develop an Energy System Transformation Strategy. These strategies are intended to help municipal governments take the steps necessary to foster a transition towards zero emission, resilient, equitable, and decentralized energy systems that can power cities long into the future (as characterized in Figure 1). More information on what comprises a city’s or neighborhood’s energy system and what it will take to foster a transition can be found in the Playbook.
1
From To
Energy Generation
mostly fossil fuels
mostly large central generators
100% zero GHG and/or renewable sources
a mix of central and local generators, energy storage, and other distributed energy
resources
Energy Distribution
one way energy delivery
a producer to consumer model
monthly metering to determine costs
multidirectional energy delivery
a multidirectional “prosumer” model
real-time metering to drive energy management
Energy Use
fossil fuel-based systems and technologies
design for conventional efficiency
inefficient energy use behaviors
the everyday purchase and use of fossil fuel-dependent assets
zero GHG-ready systems and technologies
design for much higher efficiency
highly efficient energy use behaviors
the everyday purchase and use of zero emission assets
Figure 1 The key dimensions of an energy system transformation Figure 1 The key dimensions of an energy system transformation, as taken from the Energy System Transformation Playbook. See the Playbook for more information.

To assist in the development of the Playbook, a draft version of the Playbook was applied to a neighborhood in each of the cities involved in the project. The purpose of applying the Playbook to these neighborhoods was to test its content and process, then collaboratively evaluate the application to determine required adjustments for usability and effectiveness. A stylized version of a Seattle Urban Center was used as the test neighborhood in Seattle, and this Seattle Urban Center Energy System Transformation Strategy is the result. The content of the Strategy, including energy and emissions projections, was developed by Integral Group with input from City staff. This Strategy is not intended to represent the City’s perspectives on how Urban Centers will develop (e.g. changes in density, development rates). The recommendations are based on Integral Group’s analysis and the guidance provided in the Playbook. The team did not conduct stakeholder engagement and the recommended strategies and actions are not intended to represent the perspectives or priorities of the City or other stakeholders.
Rather, this Strategy should be viewed as an example analysis of what it will take for a city or neighborhood to eliminate GHG emissions from its energy system (i.e. decarbonize), both in terms of the types of actions and the scale of effort required. The City of Seattle can use the Strategy and the associated Playbook to inform discussions among City staff and other stakeholders regarding what the City must achieve to transform its energy system to mitigate climate change, among other priorities. The Strategy includes an analysis of and resulting strategies and actions for two of the three urban systems that comprise a city’s energy system:1
Energy Supply, including both grid-supplied and smaller on-site or district scale energy sources; and,
Buildings, including both new construction and existing buildings.
The Strategy should be used in conjunction with existing plans and policies at both neighborhood and city scales. The contents of the Strategy include:
A description of the context of Seattle as it is relevant to the process of decarbonization, including any barriers or opportunities;
A description of an Urban Center neighborhood in Seattle, including current and projected development profiles;
A description of the neighborhood’s current energy and emissions profile, including the broad trajectory required to transition to zero carbon; and
A list and explanation of relevant strategies and actions to be taken over the next 5-10 years.
1 The third urban system comprising the energy system is transportation, but is not included in this Strategy.
2
2 LEADERSHIP IN SUSTAINABILITYSeattle has a long history of action on climate change and sustainability and is widely regarded as a leader in North America. Seattle’s typically progressive policies have afforded a strong history of climate action. In 2000, the City adopted a green building goal for all new municipal facilities, followed by a LEED incentive program for private projects in 2001. In 2005, Seattle City Light became the nation’s first large electric utility to be carbon neutral. In 2006, Seattle adopted one of the nation’s first Climate Action Plans (CAP), which has since been updated in 2013 to reflect the city’s continuing commitment towards a goal to be carbon neutral by 2050.
Current initiatives that have targeted energy efficiency and conservation in the built environment include the provision of density bonuses for LEED Silver certification or higher, PriorityGreen permitting, which provides faster building permit review and processing for projects that meet green building standards, as well as the Energy Benchmarking and Reporting Program, which requires owners of non-residential and multifamily buildings to track energy performance and annually report it to the City of Seattle.
2 . 1 A U N I Q U E C O N T E X T
Seattle also holds a unique set of circumstances that may both help and hinder efforts to achieve an energy system transformation. The city’s economy is characterized by both older industrial activities and new economic forces in the service sector, international trade, and the knowledge-based economy. Seattle also fosters green building and clean tech activity, and the creative and entrepreneurial business landscape has favored the start-up industry. As a major economic hub, Seattle has a rapidly growing population, and must densify to accommodate the growth, given it is a region that is already built-out.
Seattle boasts an extraordinary wealth in terms of technological capacity, including a substantial clean technology and green building industry. Seattle’s control over municipal building codes also affords the City the ability to implement innovative and rigorous strategies. Seattle’s energy code is among the most aggressive in the country. Seattle’s residential, commercial, and industrial electricity rates are also well below the national averages – credited in part to the large-scale capacity of the city’s public utility, which sources the majority of its energy supply from hydroelectric generation. The remaining portion of energy generation is sourced from nuclear, wind and a small fraction from coal and other fossil fuel sources; carbon neutrality is maintained through Seattle City Light’s investment in carbon offsets.
2 . 2 H I G H L E V E L O F C O N T R O L O V E R E N E R G Y S Y S T E M T R A N S F O R M AT I O N
The approaches a city selects to undertake an energy system transformation depend partly on the extent of their influence or control over the urban system component in question. Municipal powers over different assets, functions, or decision-making structures vary according to their jurisdiction and circumstances. While one city may have full control over their building code, others may be required to conform to state regulations over building form and energy efficiency.
The CNCA Playbook offers a sphere of influence mapping tool to help cities determine their priority energy system transformation strategies based on the level of control or influence they have over each of the key urban system components. The extent of a municipal government’s influence can be determined by placing it into one of three broad categories:
3

Control: Where a city has near-complete or full decision-making authority over components of the urban system or issue in question.
Influence: Where a city has no decision-making authority, but has access to resources and forums that can be used to influence decision-making by market actors or other levels of government.
Interest: Where a city has neither control nor direct influence over components of the urban system, but is interested in and possibly affected by the outcomes of decisions made by other actors.
Altogether, Seattle has a relatively high level of control over energy supply and buildings relative to other cities, offering the City greater opportunities to foster an energy system transformation more quickly. Figure2 on the next page indicates the City’s level of control over each component of each urban system designated by the cells with orange borders on the Playbook’s sphere of influence mapping tool. For each urban system component, Seattle can take action on the decarbonization priorities listed in the box with the orange border, as well as the cells in the same row to the left of the box. This tool thus provides insight on what the City can and should prioritize to progress the energy system transformation for each urban system component and was used to inform the priority actions presented in this Strategy. Refer to the Playbook for more information on sphere of influence mapping and the decarbonization phases in Figure 2.
2 . 3 A C H A N G I N G C L I M AT E
Finally, Seattle’s climate gives the city an advantage in improving the energy efficiency of the built environment. With its coastal location, cool, wet winters and warm, relatively dry summers, the average temperature in the coldest month is only 40.6°F, while the average temperature in August is 66.1°F. This relatively low variation in seasonal temperature provides an ideal environment for implementing building technology that minimizes both heating and cooling loads either through passive design or heat pump technology. Despite a total of only 152 sunny days during the year, (as compared to 205 for the U.S. more broadly), Seattle is still a viable location for solar energy generation. An increase in the frequency of extreme heat days in the summer, as well as increased nighttime temperatures and humidity, will require additional planning in terms of extreme weather events, as well as shifts in the timing of energy demand through building conditioning.
4
Energy System Transformation
Phases
Working without Control:Act where possible + Acquire more control where feasible + Lobby for
Implementation of Phases 1-3Phase 1:
Initiate Energy System TransformationPhase 2:
Strategically DecarbonizePhase 3:
Zero Emission Energy System
Level ofControl INTEREST INFLUENCE CONTROL
ENER
GY S
UPP
LY
Grid-Supplied Energy
(Imported)
• Increase purchases of clean energy where possible
• Conduct outreach campaigns
• Explore/develop MOU with electrical utility to increase clean energy supply
• Procure zero emission energy directly (e.g. power purchase agreements, community choice aggregation)or indirectly (e.g. renewable energy credits)
• Increase zero emission energy supply
• Phase out indirect purchases (e.g. renewable energy credits)
City runs on 100% zero emission energy
Neighborhood-Scale Energy(Local)
• Provide programs and incentives • Conduct outreach campaigns• Encourage organizations to procure
clean energy• Decarbonize city-owned generators• Increase internal capacity• Purchase clean energy where available
• Use existing powers (e.g. right-of-way) to leverage low emission DES
• Use zoning powers to compel low emission DES studies for large developments
• Develop or require development of low emission district energy systems
• Require certain new buildings to connect to district energy systems
• Transition from low emission to zero emission DES
• Prioritize connection of existing loads to direct energy systems
High intensity loads are served by zero emission
district energy as needed
On-Site Energy(Local)
• Provide programs and incentives • Conduct outreach campaigns • Offer bulk buy programs• Increase internal capacity • Install on-site generation at city
facilities
• Update regulations to support on-site energy generation
• Evaluate potential for zero emission on-site thermal systems
• Develop a renewable energy proliferation strategy
• Lobby for authority to allow peer-to-peer energy transactions
• Establish peer-to-peer energy transactions as a key part of the city’s energy market
• Implement an on-site renewable energy strategy
Grid-supplied and neighborhood-scale
energy supplemented by desired level of on-
site generation
Grid Modernizati
on
• Develop internal capacity to understand grid modernization and its relationship to achieving climate and energy objectives
• Work with utilities to install advanced metering infrastructure
• Require buildings to install advanced meters
• Study grid’s ability to host distributed energy resources (with utility)
• Lobby state and electric utility to incorporate distributed energy resources into planning
• Develop a location-based profile of energy and emissions
• Implement and support pilot projects
• Work with state to allow and develop a peer-to-peer energy market
Highly efficient grid capable of supporting
desired level of distributed energy
resources
BUIL
DIN
GS
New Buildings
• Offer incentives• Coordinate bulk buy programs• Support building sector training• Pilot technologies• Study thermal and industrial
decarbonization options
• Integrate GHG emissions performance into ‘up-zoning’ and programs
• Develop a roadmap to zero emission building (ZEB) codes
• Map trajectory to ZEB performance • Develop Incentive programs with utilities
for ZEBs
• Implement ZEB building codesAll new buildings
required to be zero emissions
Existing Buildings
• Provide decarbonization and efficiency programs and incentives
• Support building sector training• Pilot technologies• Study thermal and industrial
decarbonization options• Implement municipal energy
management program • Increase internal capacity
• Explore/develop MOU with utilities to decarbonize buildings
• Offer incentives for decarbonization• Enact a building energy reporting and
benchmarking policy• Integrate GHG emissions into retrofit
requirements• Develop incentive programs with utilities
for ZEBs• Offer decarbonization incentives
• Retrofit all existing buildings to eliminate fossil fuel dependency
All existing buildings retrofitted to operate on
zero emission energy
Figure 2 Seattle’s level of control for each urban system component according to the Playbook’s sphere of influence mapping tool.
5
3 SEATTLE URBAN CENTERSThe City of Seattle conducts comprehensive planning to accommodate future population and job growth and help guide city planning policies. Seattle's Comprehensive Plan is centered on the Urban Village Strategy which encourages most future job and housing growth to specific areas in the city that are best able to absorb and capitalize on that growth, while providing essential public services and making amenities available to residents. These growth areas are broken down into urban centers, urban villages, and manufacturing/industrial areas.
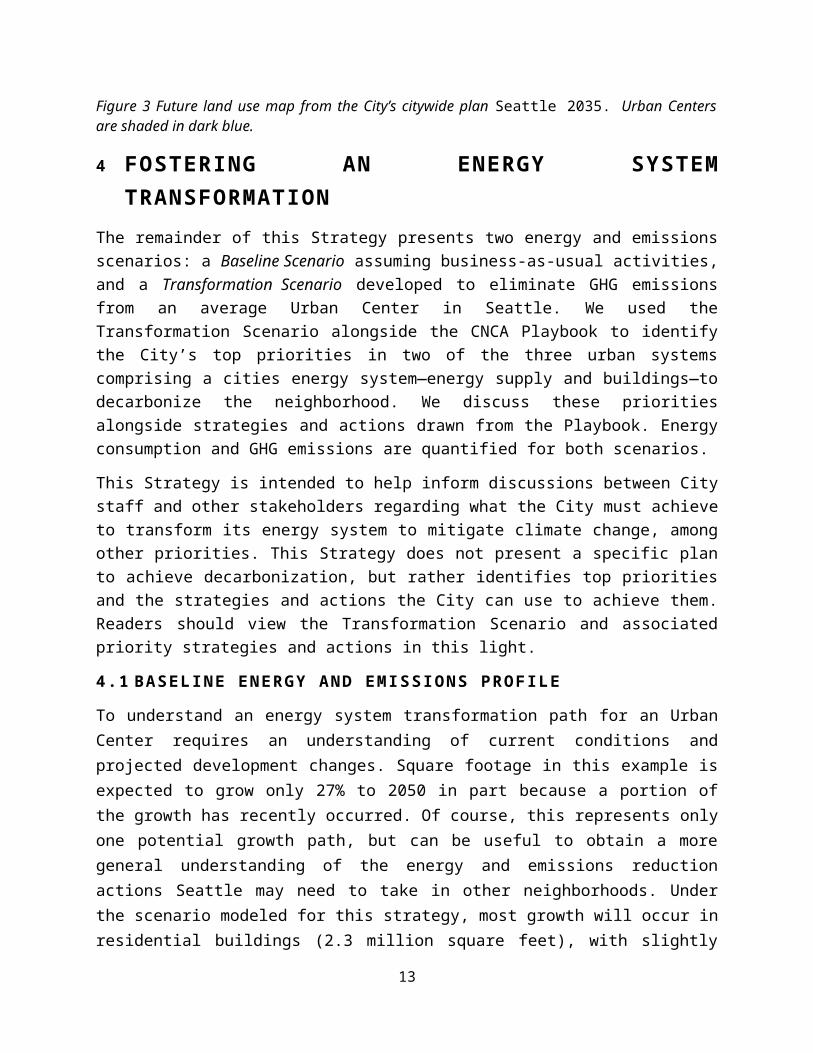
Urban Centers are the densest neighborhoods and provide a diverse mix of uses, housing, and employment opportunities. There are six urban centers in Seattle, which meet planning criteria related to: accessibility to regional transit; accommodating a broad mix of commercial and residential activities; pedestrian and/or bicycle connections to surrounding neighborhoods; and zoning for new development to create one of Seattle’s higher densities of households and employment. Figure 3 shows the locations of Seattle’s urban centers in dark blue, alongside other land use designations.
A mixture of residential and commercial uses and mixture of heights and densities create an opportunity for a variety of clean energy solutions. There is also an opportunity to for clean energy choices to be embedded into new construction as urban centers continue to grow.
The metrics analyzed in this study are modeled after one urban center, the University District, but are intended to apply broadly to urban centers and development of this level of density and mixture of uses.
6
Figure 3 Future land use map from the City’s citywide plan Seattle 2035. Urban Centers are shaded in dark blue.
7

4 FOSTERING AN ENERGY SYSTEM TRANSFORMATIONThe remainder of this Strategy presents two energy and emissions scenarios: a Baseline Scenario assuming business-as-usual activities, and a Transformation Scenario developed to eliminate GHG emissions from an average Urban Center in Seattle. We used the Transformation Scenario alongside the CNCA Playbook to identify the City’s top priorities in two of the three urban systems comprising a cities energy system—energy supply and buildings—to decarbonize the neighborhood. We discuss these priorities alongside strategies and actions drawn from the Playbook. Energy consumption and GHG emissions are quantified for both scenarios.
This Strategy is intended to help inform discussions between City staff and other stakeholders regarding what the City must achieve to transform its energy system to mitigate climate change, among other priorities. This Strategy does not present a specific plan to achieve decarbonization, but rather identifies top priorities and the strategies and actions the City can use to achieve them. Readers should view the Transformation Scenario and associated priority strategies and actions in this light.
4 . 1 B A S E L I N E E N E R G Y A N D E M I S S I O N S P R O F I L E
To understand an energy system transformation path for an Urban Center requires an understanding of current conditions and projected development changes. Square footage in this example is expected to grow only 27% to 2050 in part because a portion of the growth has recently occurred. Of course, this represents only one potential growth path, but can be useful to obtain a more general understanding of the energy and emissions reduction actions Seattle may need to take in other neighborhoods. Under the scenario modeled for this strategy, most growth will occur in residential buildings (2.3 million square feet), with slightly less in commercial, industrial, and institutional buildings (2.0 million square feet). As a result, the neighborhood will undergo a small shift in composition, from approximately 35% to 39% residential by 2050. The steady growth and relatively stable composition of the neighborhood means that the energy and emissions mix will not change in any significant way. The resulting energy consumption and GHG emissions are presented in Table 1 on the next page.
In addition to new development, the neighborhood’s energy and emissions will be affected by existing policies and programs, as well as assumptions about the future electricity mix.
ENERGY SUPPLY
Seattle City Light, Seattle’s electric utility, generates the majority of its power from hydro and wind, and purchases a very small amount from the market. The utility maintains a carbon neutral commitment by purchasing offsets for the small amount of electricity from fossil fuel sources.
8
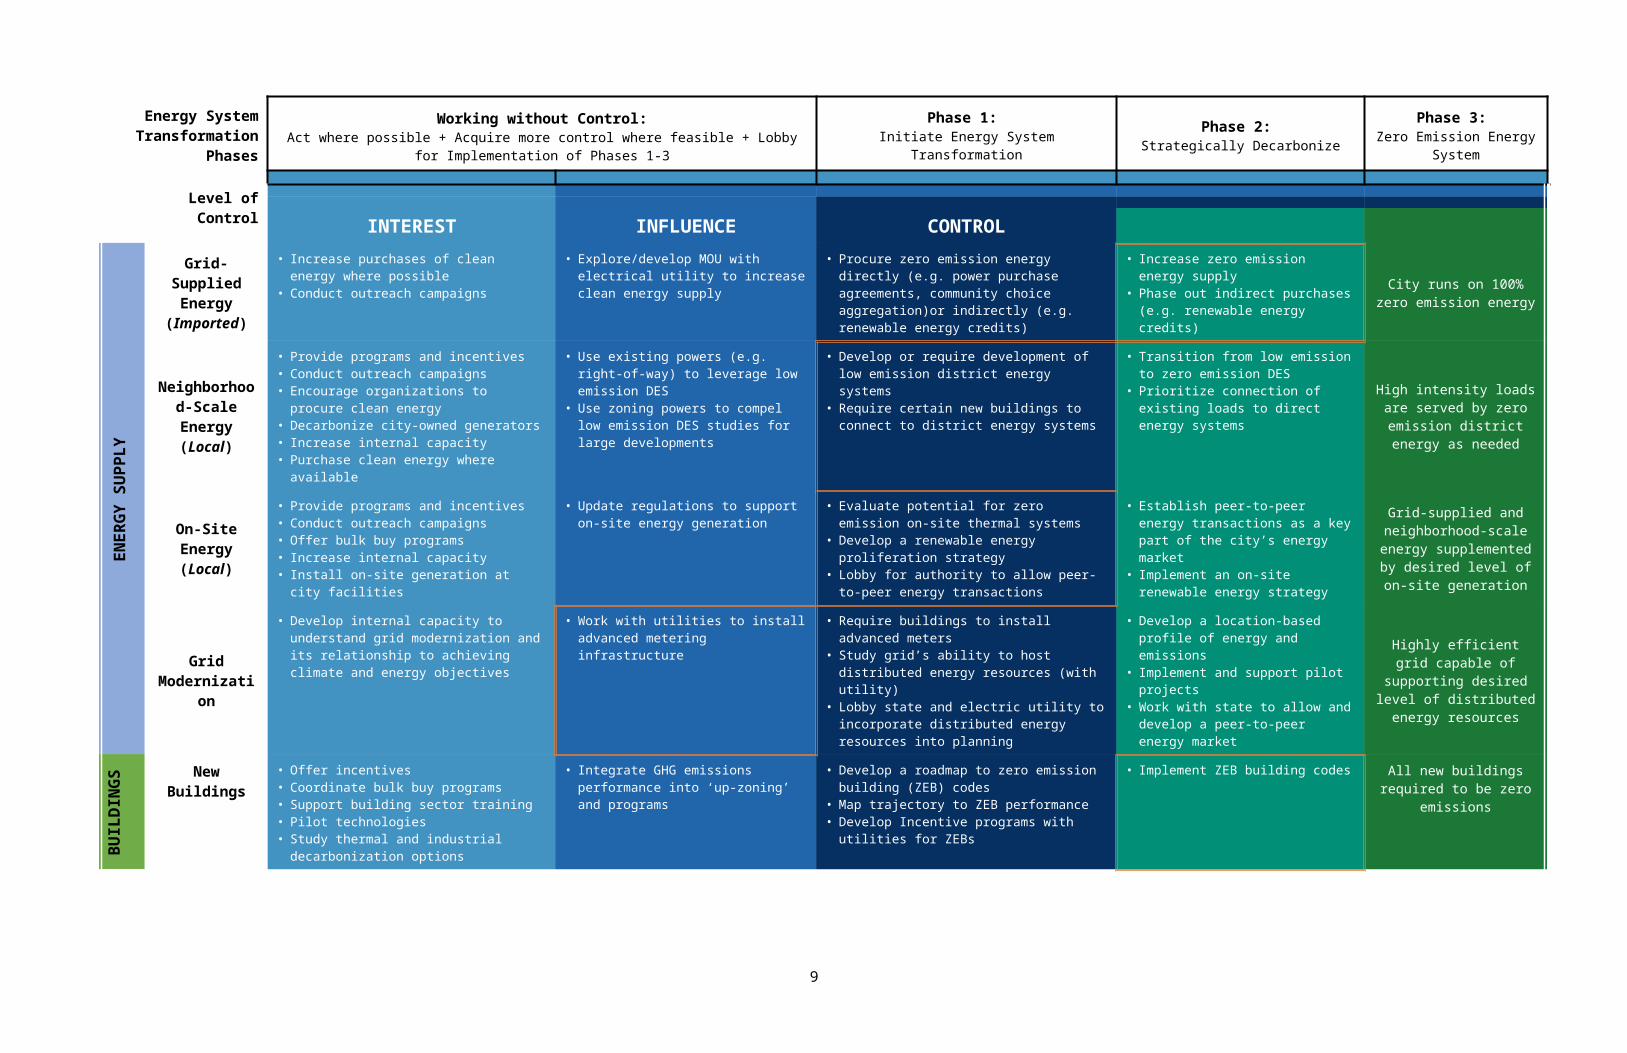
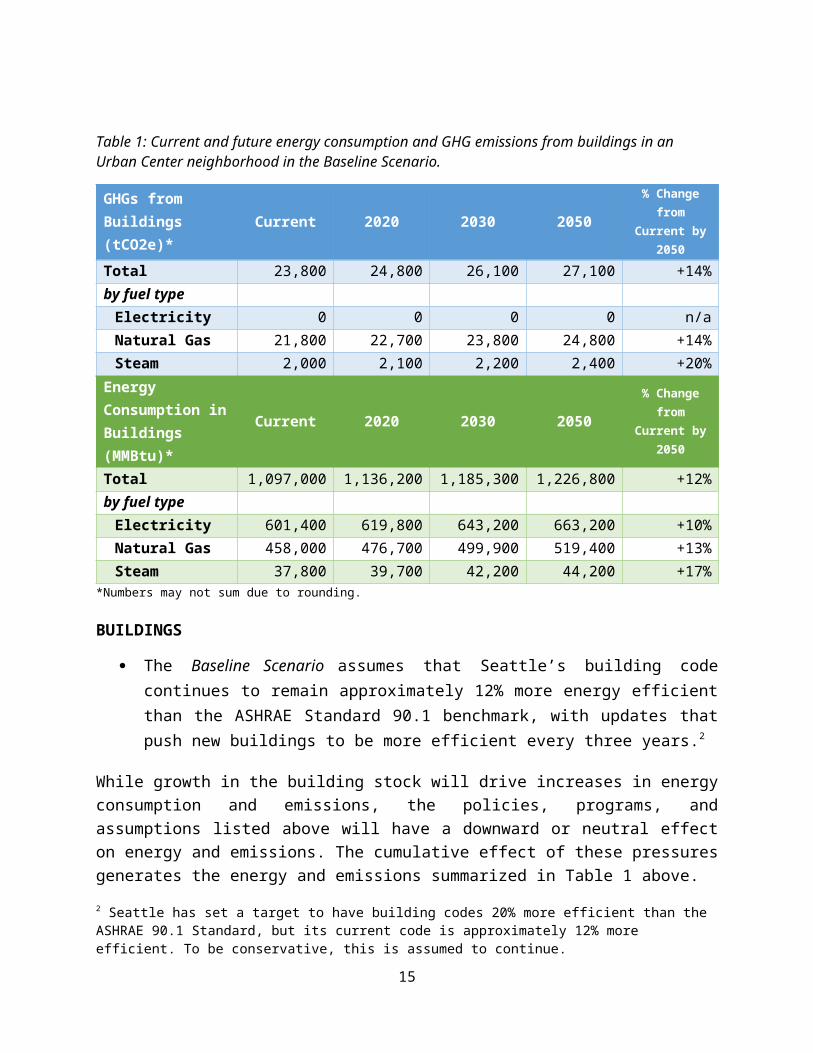
Table 1: Current and future energy consumption and GHG emissions from buildings in an Urban Center neighborhood in the Baseline Scenario.
GHGs from Buildings (tCO2e)* Current 2020 2030 2050 % Change from
Current by 2050
Total 23,800 24,800 26,100 27,100 +14%by fuel type
Electricity 0 0 0 0 n/aNatural Gas 21,800 22,700 23,800 24,800 +14%Steam 2,000 2,100 2,200 2,400 +20%
Energy Consumption in Buildings (MMBtu)* Current 2020 2030 2050 % Change from
Current by 2050
Total 1,097,000 1,136,200 1,185,300 1,226,800 +12%by fuel type
Electricity 601,400 619,800 643,200 663,200 +10%Natural Gas 458,000 476,700 499,900 519,400 +13%Steam 37,800 39,700 42,200 44,200 +17%
*Numbers may not sum due to rounding.
BUILDINGS
The Baseline Scenario assumes that Seattle’s building code continues to remain approximately 12% more energy efficient than the ASHRAE Standard 90.1 benchmark, with updates that push new buildings to be more efficient every three years.2
While growth in the building stock will drive increases in energy consumption and emissions, the policies, programs, and assumptions listed above will have a downward or neutral effect on energy and emissions. The cumulative effect of these pressures generates the energy and emissions summarized in Table 1 above.
SUMMARY
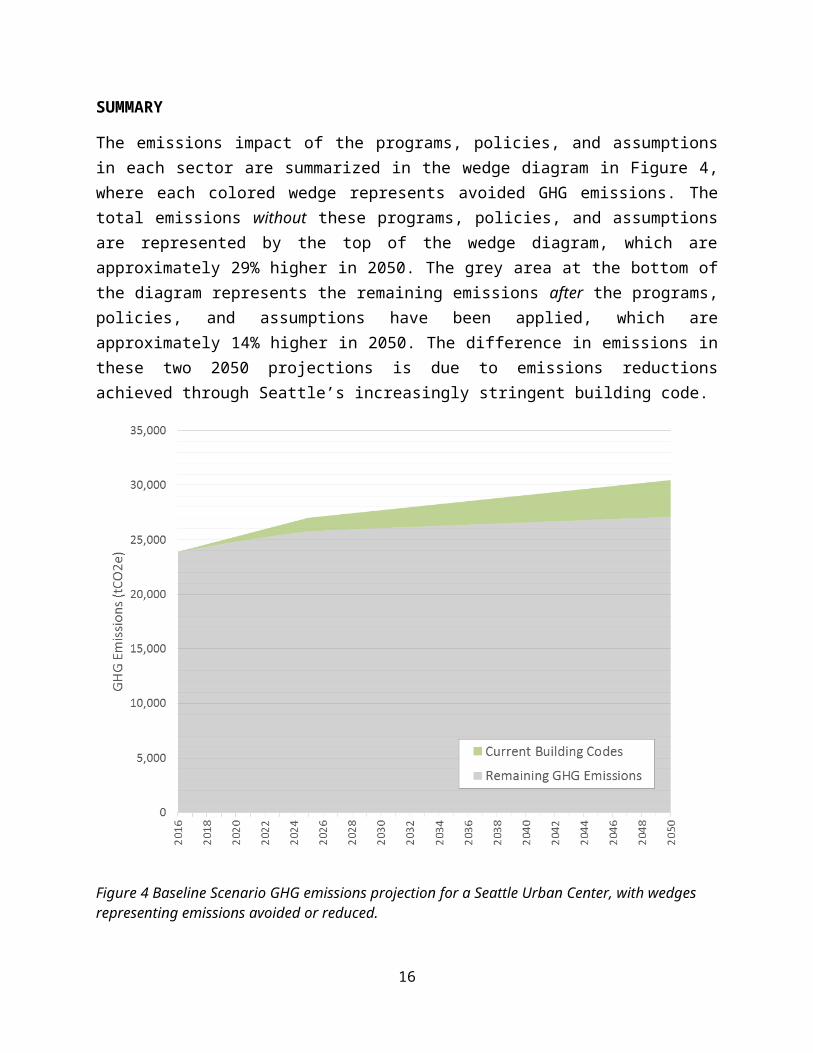
The emissions impact of the programs, policies, and assumptions in each sector are summarized in the wedge diagram in Figure 4, where each colored wedge represents avoided GHG emissions. The total emissions without these programs, policies, and assumptions are represented by the top of the wedge diagram, which are approximately 29% higher in 2050. The grey area at the bottom of the diagram represents the remaining emissions after the programs, policies, and assumptions have been applied, which are approximately 14% higher in 2050. The difference in emissions in these two 2050 projections is due to emissions reductions achieved through Seattle’s increasingly stringent building code.
2 Seattle has set a target to have building codes 20% more efficient than the ASHRAE 90.1 Standard, but its current code is approximately 12% more efficient. To be conservative, this is assumed to continue.
9
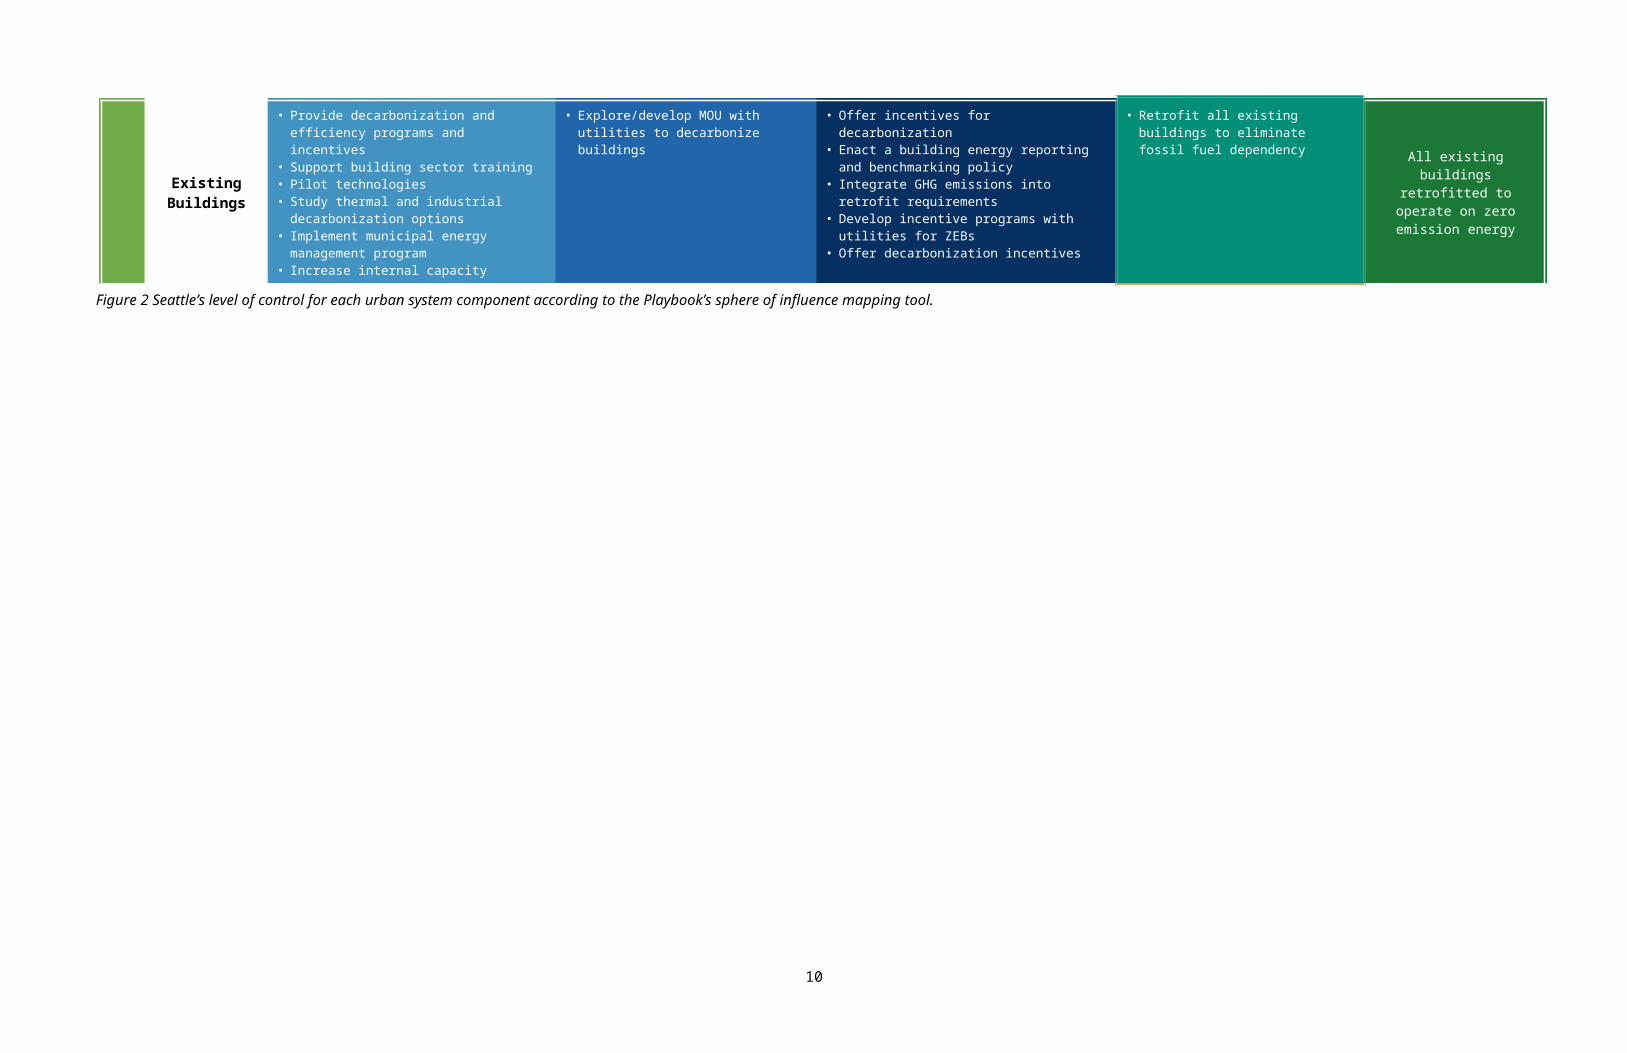
Figure 4 Baseline Scenario GHG emissions projection for a Seattle Urban Center, with wedges representing emissions avoided or reduced.
4 . 2 T R A N S F O R M AT I O N S C E N A R I O A N D H I G H P R I O R I T Y A C T I O N S
Based on the assumptions modeled above, GHG emissions are projected to increase under business-as-usual policies and programs due to an increase in population. New action is required to place Seattle’s Urban Centers on a path to zero emissions. To better understand what actions are required, a set of new policies, programs, and assumptions were modeled to decarbonize electricity supply, eliminate fossil fuel dependency in buildings, and improve energy efficiency. The projected energy and emissions of this Transformation Scenario are summarized in Table 2. The remainder of the section identifies priority focus areas for each urban system, discusses the Transformation Scenario, and lists relevant strategies and actions from the Playbook that can help the City decarbonize the neighborhood.
10

Table 2 Summary of current and future energy consumption and GHG emissions from buildings in the Transformation Scenario.
GHGs from Buildings (tCO2e)* Current 2020 2030 2050 % Change from
Current by 2050
Total 23,800 21,800 15,100 0 -100%by fuel type
Electricity 0 0 0 0 m/aNatural Gas 21,800 19,900 13,800 0 -100%Steam 2,000 1,900 1,300 0 -100%
Energy Consumption in Buildings (MMBtu)* Current 2020 2030 2050 % Change from
Current by 2050
Total 1,097,000 1,079,900 985,300 722,400 -34%by fuel type
Electricity** 601,400 627,300 671,400 722,400 +20%Natural Gas 458,000 416,600 289,000 0 -100%Steam*** 37,800 36,000 25,000 0 -100%
*Numbers may not sum due to rounding.**Part of the increase in electricity consumption is due to fuel switching away from natural gas to electricity in buildings. A one-to-one conversion rate is applied, meaning 1 kBtu of natural gas becomes 1 kBtu of electricity after the fuel switch. The one-to-one conversion rate does not account for the fact that electrical appliances and systems (e.g. for cooking, heating) are more efficient than those using natural gas. In actuality, 1 kBtu of natural gas would convert to somewhere between 0.5 and 0.25 kBtu of electricity, depending on the appliance or building system and climate zone, among other things. However, not enough data about energy use and fuel mix was available to calculate the proper conversion rate. Therefore, a one-to-one ratio is used and can be considered a conservative assumption that causes electricity use to be overestimated.***This study assumes that all district steam systems (reliant on fossil fuels) are converted to zero carbon sources (e.g. wastewater).
ENERGY SUPPLY
Priority Focus to Achieve Decarbonization Use district energy to eliminate need for fossil fuels Pursue local renewable energy development to generate non-GHG reduction benefits (e.g.
resilience, local economic development, energy independence) and to increase support for energy system transformation
Seattle’s electricity supply is already considered “carbon neutral”, so the City’s resources can be dedicated to other aspects of its energy supply: district-scale and on-site energy generation.
As discussed in the next section, the City will need to eliminate fossil fuel dependency in all buildings to decarbonize an Urban Center (or any other neighborhood). The Transformation Scenario modeled here assumes that fuel switching retrofits can be used to switch all building systems and technologies using natural gas and steam to systems and technologies that use electricity or zero emission district energy systems. However, there may be as yet undetermined building energy requirements that prevent electrification (e.g. building thermal systems, industrial energy needs). As such, the City’s primary energy supply focus should be to establish any energy supply investments required to eliminate fossil fuels from the building stock. Although not modeled here (as noted above, building fuel switch retrofits to electricity were modeled instead), an Urban Center very likely has a high enough density that it could support a district energy system. The City may need to invest in a new district energy system—or connect to an existing system if its supply were decarbonized—to achieve full decarbonization. Moving forward, the City
11

should focus first on understanding what energy end uses cannot be electrified, then investigate how to satisfy that demand, and whether a district energy system is the best energy supply option.
On-site energy generation (e.g. solar panels) is not required to decarbonize an Urban Center, but can yield other benefits that may be priorities for the City or other stakeholders (e.g. resilience, energy independence, local economic development). Installing local renewable energy generators (e.g. solar panels) may also increase support for the overall energy system transformation. As such, the City should consider where increasing on-site energy generation aligns with its overall priorities (and those of its residents and businesses) and how on-site generation may support the overall energy system transformation. If valuable benefits exist, the City should increase on-site renewable energy generation as part of its overall energy system transformation. However, where resources are limited, the City should prioritize its efforts on other parts of its energy system (buildings and transportation). Note also that where opting to increase local distributed energy generation, the City will need to consider impacts on the electricity grid and undertake grid modernization actions to accommodate the distributed energy resources (these are not discussed in this Strategy).
If district energy and on-site renewable energy generation emerge as priorities for the City, the Playbook offers several strategies and actions that can help decarbonize its Urban Centers, as follows.
Recommended Playbook Strategies
E.3 – Coordinate discount purchase opportunities for citizens and businesses
E.3.1. Allocate City staff time to coordinate and manage discount purchase opportunities (e.g. bulk buy programs) for strategically important technologies (e.g. solar panels, air source heat pumps)
E.7 – Implement a Renewable Electricity Proliferation Strategy
E.7.1. Invest in a city-run program to increase renewable energy generation by strategically targeting buildings, neighbourhoods, businesses, and homeowners based on generation opportunities (e.g. rooftop suitability, electricity distribution capacity)
E.8 – Develop a District Energy Strategy
E.8.1. Assess district energy demand and low carbon supply opportunities and use the results to develop a district energy strategy that can inform other city policies and regulations and support specific infrastructure projects (e.g. energy system installations)
E.9 – Invest in renewable supply
E.9.1. Invest in large- and medium-scale distributed generation (district energy for heating and cooling, micro-grids, CHP, tri-generation districts), or in public-private partnerships)
12
E.12 – Mandate decarbonization of central supply
E.12.4. Require the phasing out/conversion of buildings’ fossil-fuel heating systems (and provide technical and financial assistance for owners/managers) toward waste heat, biomass or geothermal energy systems
E.14 – Mandate renewable energy generation in buildings
E.14.1. Require new buildings and major renovations to be capable of supporting a minimum amount of on-site renewable energy generation (e.g. roof design, electrical system capabilities)
E.14.2. Require new buildings and major renovations to generate a minimum amount of renewable energy on-site, with exceptions (e.g. shading on rooftops)
Box 1 lists other actions the City could consider to support its energy supply priorities. As noted above, the City will also need to modernize its grid if adding significant amounts of renewable energy generation (e.g. solar panels) to the neighborhood. The Playbook provides strategies and actions the City can consider to support grid modernization. Action numbers (e.g. E.2.1) correspond to the strategies and actions table found in the Appendix of the Playbook.
Box 1 Other Relevant Energy Supply Actions from the PlaybookE.2.1. Implement a media, outreach, and communications strategy focused on increasing public awareness of efforts and specific programs and increasing adoption of programs E.4.1. Provide financial incentives for on-site and off-site renewable generation (e.g. property tax breaks)E.5.1. Reduce regulatory barriers to zero emission neighborhood-scale energy systems (e.g. microgrids, district energy, tri-generation)E.9.2. Invest in converting city-owned fossil-fuel power generating facilities to zero emission generatorsE.9.4. Invest in “community solar” projectsE.10.1. Install distributed renewable energy generation on city facilitiesE.11.1. Establish or commission a city department or office separate from the city government to manage and implement renewable energy and energy performance programsE.11.2. Provide a centralized online clean energy and energy efficiency commerce system that provides information on programs, access to financing and permits, and connection to support staff
BUILDINGS
Priority Focus to Achieve Decarbonization Develop an innovative fuel switch retrofit program that eliminates fossil fuel dependency
from all existing buildings Implement zero emission building codes that eliminate building dependence on fossil fuels Investigate building thermal and industrial energy needs and decarbonization options
The major focus for buildings in Seattle’s Urban Centers should be on retrofits that eliminate fossil fuel dependency in buildings (i.e. fuel switching retrofits), while making buildings more energy efficient (i.e. energy efficiency retrofits). Because Seattle already has a carbon neutral electricity supply, actions that reduce electricity consumption will not have a GHG reduction benefit, but will reduce energy bills in buildings and the requirement for new zero emission electricity generation. The Transformation Scenario assumes 100% of natural gas and gas-powered steam is eliminated from buildings through retrofit programs affecting approximately 2% of the building stock per year between 2017 and 2050. For most buildings in the neighborhood, this can likely be achieved through a shift to electricity; however, as noted in
13
the previous section, some buildings may require other low carbon energy sources to satisfy certain operational requirements.
This scenario also assumes that all natural gas and steam will be shifted to electricity at a one-to-one rate, which likely causes an overestimation in projected electricity consumption due to the higher efficiency of electricity-powered building systems over natural gas-powered systems (as noted under Table 2).3 On top of fuel switching retrofits, this scenario assumes that the City will implement an energy efficiency retrofit program that reduces building EUIs by 30% to 50% in 2.5% of the building stock per year between 2017 and 2050.
Given the modest amount of development projected for the neighborhood, policies and programs that target existing buildings will be of greater importance than those for new construction. However, any new development with a built-in dependency on natural gas (or any other fossil fuel) will necessitate additional future investments in retrofits to decarbonize the Urban Center. In the Transformation Scenario modeled here, the City follows a path to net zero energy building codes by 2030, but does not take steps to eliminate natural gas use from codes. The resulting retrofit requirements (discussed above) provides a sense of the work necessary to retrofit all buildings if zero emission building codes are not put in place in the near future. Control over its own building code coupled with its extensive array of existing building programs and policies make Seattle among the current leaders in the building energy transformation. However, to achieve an energy system transformation, the City will need to decarbonize its building codes.
Key challenges in eliminating GHG emissions from the built stock will include:
The achievement of the drop in EUIs as proposed under NZE code for new construction, and; The achievement of aggressive retrofit rates in existing buildings that target both energy efficiency
and fossil fuel dependency, as well as the need to run an effective fuel switching retrofit program.
The City can use the strategies and actions from the Playbook listed below to take action on the priorities discussed above.
Recommended Playbook Strategies
B.13 – Mandate no- to low-carbon standards for new construction
B.13.1. Adopt/phase-in building and energy conservation and GHG emissions-based codes based on carbon neutral, zero net energy, PassivHaus, Living Buildings, and other cost-effective high-efficiency approaches
3 The natural gas-to-electricity conversion rate can be updated with additional information on energy end uses in buildings and equipment energy factors. See here for a discussion of how fuel switching can lead to overall energy use reductions depending on building systems: http://cleantechnica.com/2016/05/23/fuel-switching-essential-step-towards-decarbonized-future/.
14
Example: Retrofit ProgramsEnergiesprong is a program with its roots in the Netherlands that aggregates demand to deliver net-zero energy retrofit packages to existing social housing. The program organizes homeowners, contractors, and housing associations to provide a fully integrated platform – renovations can be completed in under a week and homeowners pay a monthly fee similar to their previous energy utility bill – all while eliminating home-sourced emissions, providing a return on investment, as well as a long term (30+ years) energy performance guarantee.
The New York City retrofit accelerator is another exemplary program that offers independent, customized technical assistant and advisory services at no charge to building owners to help facilitate the process of energy and water efficiency upgrades.
B.13.2. Relax certain energy performance requirements for buildings utilizing low carbon district energy systems – supportive
B.13.3. Implement a program or office to increase code compliance
B.14 – Mandate performance improvement of existing buildings
B.14.1. Require targeted buildings to improve performance or take specific steps to improve performance if below a minimum standard (based on benchmarked data)
B.14.2. Require “deep” retrofitting of buildings at designated intervention points: time of sale/purchase, permitting, financing, major renovation of building or space, rebuilding, and tenant turnover
B.14.3. Require upgrades to commercial/industrial buildings’ lighting systems
B.14.4. Require higher standards for energy efficiency of appliances
B.14.5. Require energy performance check-ins and/or improvement actions (e.g. audit, recommissioning) at designated time intervals (e.g. every 5 years)
B14.6. Require certification of building operators
Box 2 lists other actions the City could consider to support its building priorities. Action numbers (e.g. B.1.1) correspond to the strategies and actions table found in the Appendix of the Playbook.
Box 2 Other Relevant Energy Supply Actions from the PlaybookB.1.1. Conduct building energy performance challengesB.1.2. Promote building energy rating systems (commercial and residential)B.1.4. Promote voluntary “stretch” building energy conservation codes and green-building principles by providing information and technical assistanceB.1.5. Promote “cool roofs”, air tightness testing, and other low-cost energy conservation approachesB.1.6. Support best practice information sharing among building ownersB.2.1. Work with utilities to improve customer access to energy-use dataB.2.2. Conduct public education programs and campaigns that promote energy-saving measures B.2.3. Promote green leasing for commercial buildings that enable a fair proportion of costs/benefits to be allocated to both tenants and landlordsB.3.1. Coordinate and manage discount purchase opportunities (e.g. bulk buy programs) to increase consumer access to strategically important technologies (e.g. solar panels, electric vehicles, ASHPs)B.4.1. Offer financial incentives to increase adoption of specific, strategically important technologies (e.g. to enable decarbonization)B.5.1. Improve access to specialized financing to pay for efficiency improvements (e.g. green bank, PACE financing, carbon tax with distribution fund)B.6.1. Provide regulatory and zoning relief (e.g. increased FAR, accelerated permitting) for projects meeting certifiable high standards (e.g. LEED)B.6.2. Promote supportive market mechanisms such as building appraisal and mortgage underwriting that capture the value of investments in energy efficiencyB.7.1. Support efforts to train building operators in energy efficiency best practices B.7.2. Invest in the sustainable buildings sector to improve the capacity of local or regional industry members to market, install, and maintain the technologies necessary for decarbonization B.8.2. Pilot new building technologies on city buildingsB.9.1. Conduct a study to evaluate options to decarbonize thermal energy systems in buildings (both air and water)
15
Example: Zero Emissions Building CodeBrussels provides an example of a successful regulatory process that shifted the Capital Region from among the lowest building insulation standards in the early 2000s, to one of the most stringent building energy codes in Europe today. The affordability and feasibility of Passive House standards were first demonstrated through the Exemplary Buildings pilot program (2007-2009), leading to the adoption of the Passive House ordinance in 2009, which mandated all new public construction to follow Passive House standards by 2010, and all new construction and all retrofits to follow as of January 2015. This commitment by the local government was supported by the broader Energy Performance and Indoor Environment in Buildings Regulation, which adopted the targets of the European Energy Performance of Buildings Directive, requesting all buildings to be Nearly-Zero Energy Buildings by the end of 2020.
Dún Laoghaire-Rathdown, a county in the Dublin Region of Ireland, adopted its county development plan for 2016-2022, including an ordinance requiring all new buildings to be constructed to the Passive House standard. This standard restricts space heating and cooling energy demands, provides air tightness and thermal comfort requirements, and limits the primary energy demand of the entire building. These standards are achieved through a variety of building efficiency strategies, including: thermal insulation, passive house windows, ventilation heat recovery, airtightness of the building, absence of thermal bridges, and other innovative approaches, such as the solar orientation of the building, or the use of deciduous trees to provide shade in the summer and allow sunlight in the winter.
B.10.1. Implement Municipal Strategic Energy Management programs to decrease energy consumption and GHG emissions in municipal government buildingsB.10.2. Conduct deep retrofitting combined with installation of on-site renewable energy supplyB.11.2. Provide a centralized online commerce system that provides information on programs, access to financing and permits, and connection to support staffB.12.3. Require sub-metering
16
SUMMARY
The impact these programs, policies, and assumptions have on emissions from each sector is summarized in Table 2 above and in the wedge diagram in Figure 5. As in Figure 4 above, each colored wedge represents the GHG emissions avoided or reduced by a set of policies, programs, or assumptions. In the Baseline Scenario, total GHG emissions are approximately 14% higher in 2050 than in 2016 due to population growth. The grey area at the bottom of the diagram represents those emissions that will remain after all existing programs, policies, and assumptions have been applied. In the Transformation Scenario, GHG emissions are completely eliminated from Seattle’s Urban Center by 2050 (note that this does not include transportation, which was not considered in developing this Strategy). Calculated from the top of the wedge in 2050, projected emissions reductions stem from eliminating fossil fuel dependency in buildings through existing building programs (83%) and improving the energy performance of new buildings (17%).
Figure 5 GHG emissions projection for an example Urban Center in Seattle under the Transformation Scenario, with wedges representing emissions avoided or reduced.
17