Embed Size (px)
Citation preview
Introduction to the Vernier Photogate Using Logger Pro Software
The purpose of this document is to provide a tutorial on the use of Vernier Photogates with Vernier Logger Pro software. This combination of hardware and software has many applications in physics and physical science. The equipment can be used to study the motion of toy cars, dynamics carts, and objects in freefall. It can be used to measure the initial launch velocity of a projectile or to accurately measure the period of a pendulum. The wide variety of applications makes the sensor extremely valuable in the classroom.
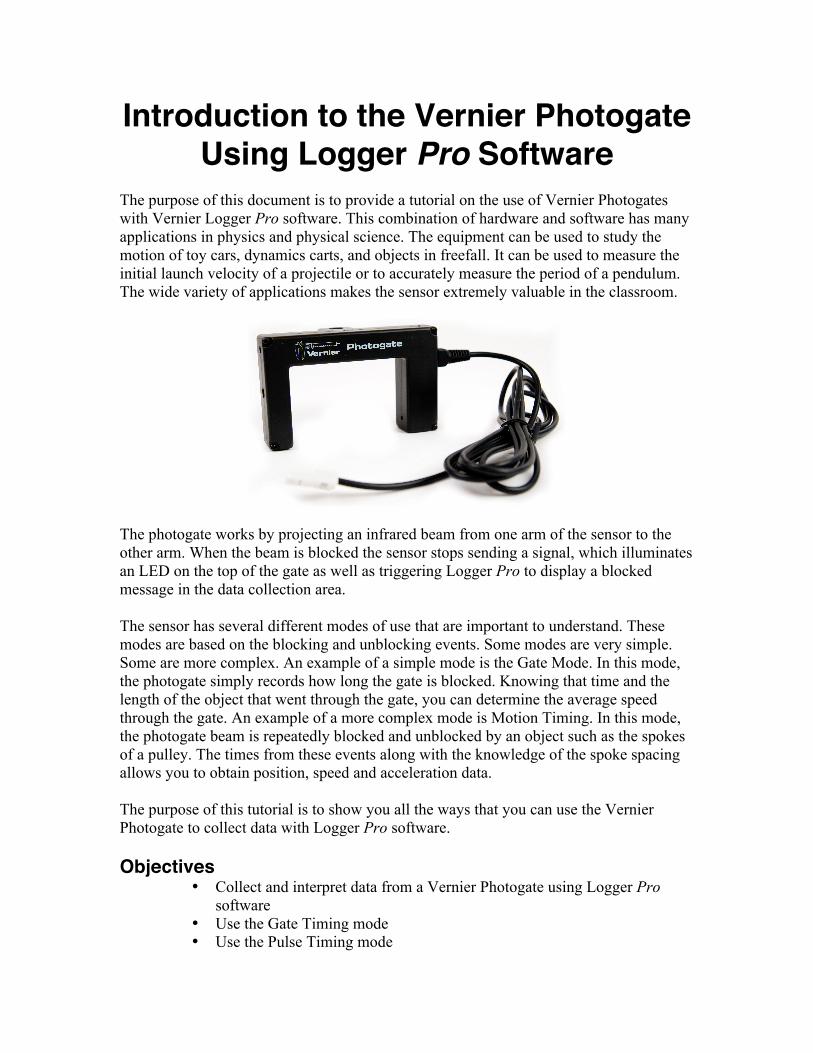
The photogate works by projecting an infrared beam from one arm of the sensor to the other arm. When the beam is blocked the sensor stops sending a signal, which illuminates an LED on the top of the gate as well as triggering Logger Pro to display a blocked message in the data collection area. The sensor has several different modes of use that are important to understand. These modes are based on the blocking and unblocking events. Some modes are very simple. Some are more complex. An example of a simple mode is the Gate Mode. In this mode, the photogate simply records how long the gate is blocked. Knowing that time and the length of the object that went through the gate, you can determine the average speed through the gate. An example of a more complex mode is Motion Timing. In this mode, the photogate beam is repeatedly blocked and unblocked by an object such as the spokes of a pulley. The times from these events along with the knowledge of the spoke spacing allows you to obtain position, speed and acceleration data. The purpose of this tutorial is to show you all the ways that you can use the Vernier Photogate to collect data with Logger Pro software. Objectives
• Collect and interpret data from a Vernier Photogate using Logger Pro software
• Use the Gate Timing mode • Use the Pulse Timing mode
• Use the Pendulum Timing mode • Use the Gate and Pulse Timing mode • Use the Motion Timing mode • Use Digital Events mode
Materials computer Vernier computer interface Logger Pro Vernier Photogates Vernier Picket Fence (optional) meter stick Part I Gate Timing
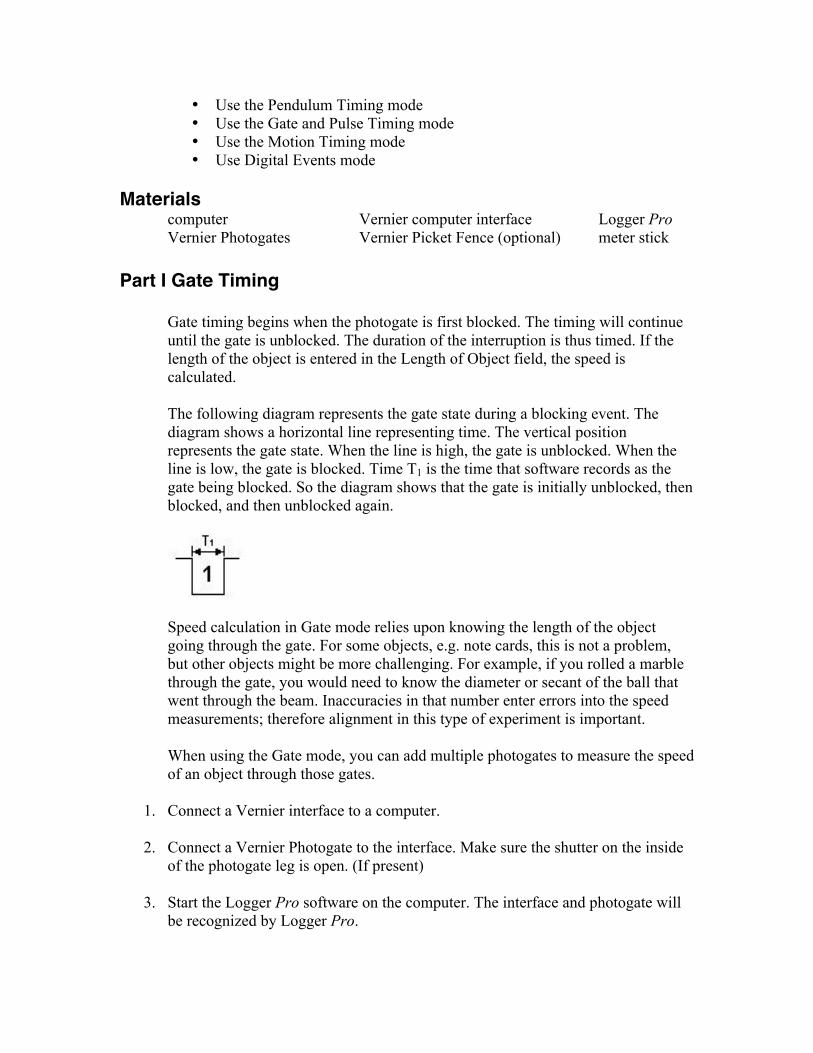
Gate timing begins when the photogate is first blocked. The timing will continue until the gate is unblocked. The duration of the interruption is thus timed. If the length of the object is entered in the Length of Object field, the speed is calculated. The following diagram represents the gate state during a blocking event. The diagram shows a horizontal line representing time. The vertical position represents the gate state. When the line is high, the gate is unblocked. When the line is low, the gate is blocked. Time T1 is the time that software records as the gate being blocked. So the diagram shows that the gate is initially unblocked, then blocked, and then unblocked again.
Speed calculation in Gate mode relies upon knowing the length of the object going through the gate. For some objects, e.g. note cards, this is not a problem, but other objects might be more challenging. For example, if you rolled a marble through the gate, you would need to know the diameter or secant of the ball that went through the beam. Inaccuracies in that number enter errors into the speed measurements; therefore alignment in this type of experiment is important. When using the Gate mode, you can add multiple photogates to measure the speed of an object through those gates.
1. Connect a Vernier interface to a computer.
2. Connect a Vernier Photogate to the interface. Make sure the shutter on the inside
of the photogate leg is open. (If present)
3. Start the Logger Pro software on the computer. The interface and photogate will be recognized by Logger Pro.
4. First verify that the photogate and software is working by placing your hand in the photogate beam. The red LED on the top of the gate should illuminate and Logger Pro should display Blocked next to GateState above the data table in the data collection area. If this does not happen, check all of your connections and restart Logger Pro and your interface if necessary.
5. Select Open from the File menu. Open the Probes & Sensors folder and then open the photogates folder. Open the One Gate Timer file.
6. The file contains a box labeled “Photogate Distance”. The box is a Parameter
Control object. Parameter controls are very useful in Logger Pro. You can use the box to control the value of a parameter defined by the user. In this file the parameter is the length of the object going through the photogate, to be used for speed calculations.
7. Right click on the box and choose Parameter Controls Options. In the data collection window, change the field labeled Value to 1 m and click OK.
8. Start data collection and use your thumb to block the photogate beam for a count of one. e.g. “one thousand one.” Unblock the photogate. Wait momentarily, and then block it again for a count of two. Unblock the photogate, block it again for a count of three, and unblock it. Click the Stop button.
9. Examine the data table. The third column shows the Gate Time, i.e. how long the gate was blocked. How close were you to blocking the gate for 1 s, 2, and 3 s?
10. The Velocity column assumes that the object length was 1 m. Use that length and the Gate Time to calculate what would have been the speed of a 1 m object going through the gate. How do your calculations compare to the Velocity column of the data table?
11. Measure the width of your index finger at the first knuckle in meters and enter the value in the Photogate Distance parameter control object. Invert the photogate, open side up, and practice passing your finger through the photogate. Try to keep your first knuckle in the beam as it passes through the photogate.
12. Start data collection. Pass your finger through the gate. Continue for a total of 10 trials, trying different speeds. After 10 trials stop data collection. Data will be collected in terms of time and then a calculated speed will be displayed in the data table as well. Real time graphs will show your velocities as you pass your finger through. (Click the Autoscale button in the menu bar above the graphs, to see all of your times and velocities.)
Part II Pulse Timing
Pulse Timing refers to the measurement from one blocking event to the next.
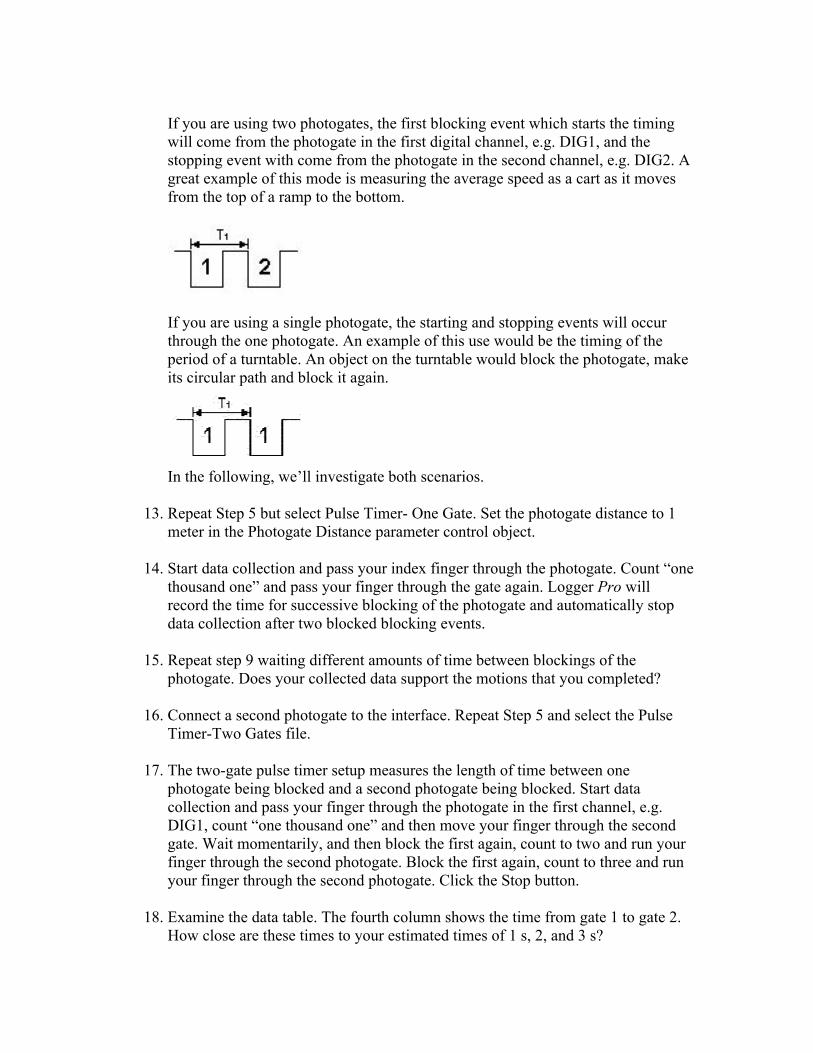
If you are using two photogates, the first blocking event which starts the timing will come from the photogate in the first digital channel, e.g. DIG1, and the stopping event with come from the photogate in the second channel, e.g. DIG2. A great example of this mode is measuring the average speed as a cart as it moves from the top of a ramp to the bottom.
If you are using a single photogate, the starting and stopping events will occur through the one photogate. An example of this use would be the timing of the period of a turntable. An object on the turntable would block the photogate, make its circular path and block it again.
In the following, we’ll investigate both scenarios.
13. Repeat Step 5 but select Pulse Timer- One Gate. Set the photogate distance to 1 meter in the Photogate Distance parameter control object.
14. Start data collection and pass your index finger through the photogate. Count “one thousand one” and pass your finger through the gate again. Logger Pro will record the time for successive blocking of the photogate and automatically stop data collection after two blocked blocking events.
15. Repeat step 9 waiting different amounts of time between blockings of the photogate. Does your collected data support the motions that you completed?
16. Connect a second photogate to the interface. Repeat Step 5 and select the Pulse Timer-Two Gates file.
17. The two-gate pulse timer setup measures the length of time between one photogate being blocked and a second photogate being blocked. Start data collection and pass your finger through the photogate in the first channel, e.g. DIG1, count “one thousand one” and then move your finger through the second gate. Wait momentarily, and then block the first again, count to two and run your finger through the second photogate. Block the first again, count to three and run your finger through the second photogate. Click the Stop button.
18. Examine the data table. The fourth column shows the time from gate 1 to gate 2. How close are these times to your estimated times of 1 s, 2, and 3 s?
Part III Pendulum Timing
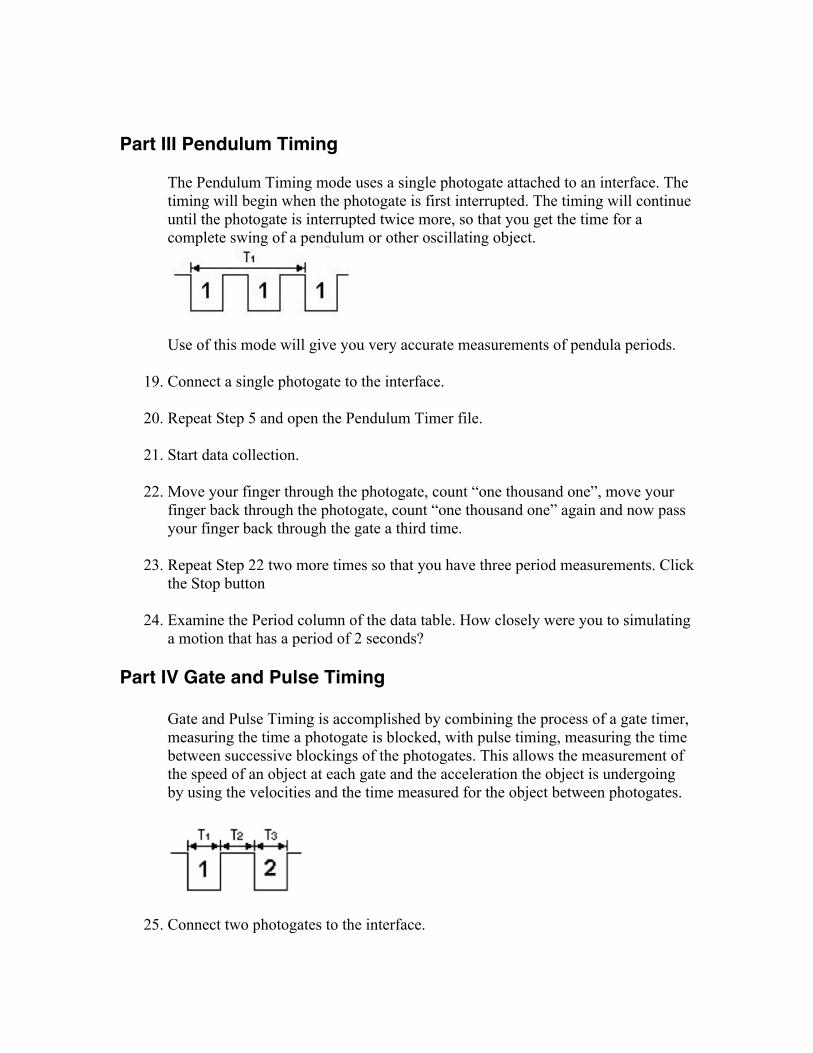
The Pendulum Timing mode uses a single photogate attached to an interface. The timing will begin when the photogate is first interrupted. The timing will continue until the photogate is interrupted twice more, so that you get the time for a complete swing of a pendulum or other oscillating object.
Use of this mode will give you very accurate measurements of pendula periods.
19. Connect a single photogate to the interface. 20. Repeat Step 5 and open the Pendulum Timer file.
21. Start data collection. 22. Move your finger through the photogate, count “one thousand one”, move your
finger back through the photogate, count “one thousand one” again and now pass your finger back through the gate a third time.
23. Repeat Step 22 two more times so that you have three period measurements. Click the Stop button
24. Examine the Period column of the data table. How closely were you to simulating a motion that has a period of 2 seconds?
Part IV Gate and Pulse Timing
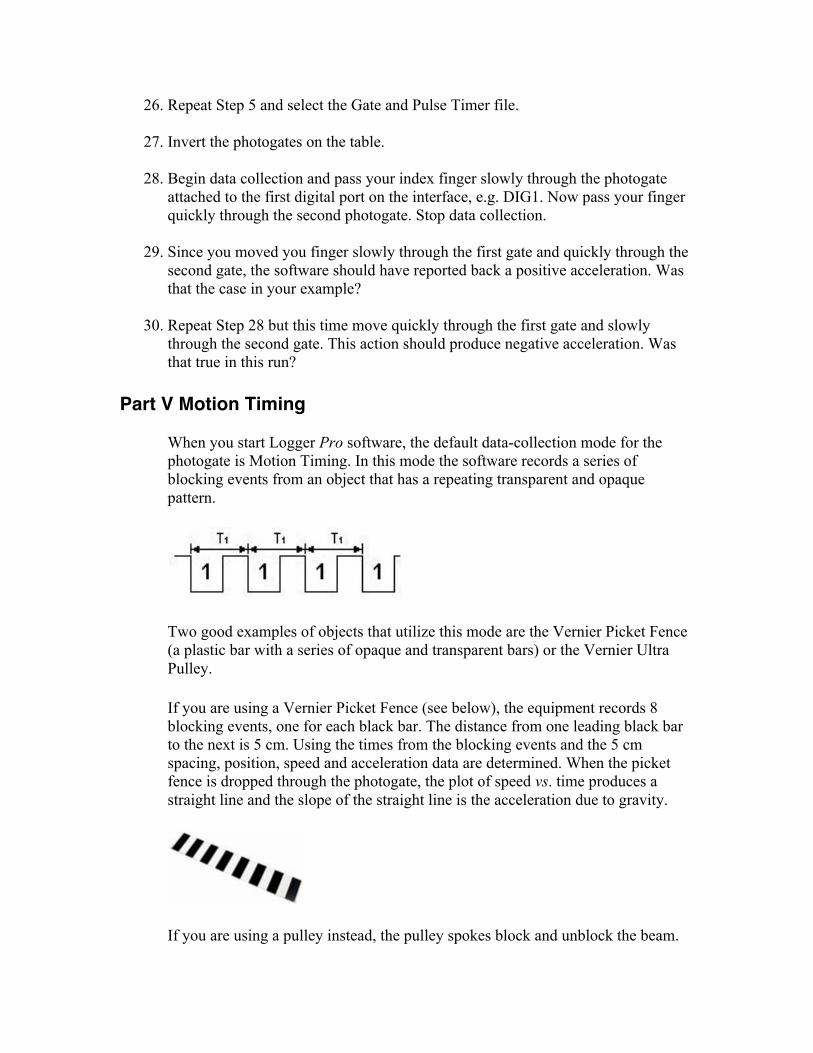
Gate and Pulse Timing is accomplished by combining the process of a gate timer, measuring the time a photogate is blocked, with pulse timing, measuring the time between successive blockings of the photogates. This allows the measurement of the speed of an object at each gate and the acceleration the object is undergoing by using the velocities and the time measured for the object between photogates.
25. Connect two photogates to the interface.
26. Repeat Step 5 and select the Gate and Pulse Timer file.
27. Invert the photogates on the table. 28. Begin data collection and pass your index finger slowly through the photogate
attached to the first digital port on the interface, e.g. DIG1. Now pass your finger quickly through the second photogate. Stop data collection.
29. Since you moved you finger slowly through the first gate and quickly through the second gate, the software should have reported back a positive acceleration. Was that the case in your example?
30. Repeat Step 28 but this time move quickly through the first gate and slowly through the second gate. This action should produce negative acceleration. Was that true in this run?
Part V Motion Timing
When you start Logger Pro software, the default data-collection mode for the photogate is Motion Timing. In this mode the software records a series of blocking events from an object that has a repeating transparent and opaque pattern.
Two good examples of objects that utilize this mode are the Vernier Picket Fence (a plastic bar with a series of opaque and transparent bars) or the Vernier Ultra Pulley.
If you are using a Vernier Picket Fence (see below), the equipment records 8 blocking events, one for each black bar. The distance from one leading black bar to the next is 5 cm. Using the times from the blocking events and the 5 cm spacing, position, speed and acceleration data are determined. When the picket fence is dropped through the photogate, the plot of speed vs. time produces a straight line and the slope of the straight line is the acceleration due to gravity.
If you are using a pulley instead, the pulley spokes block and unblock the beam.
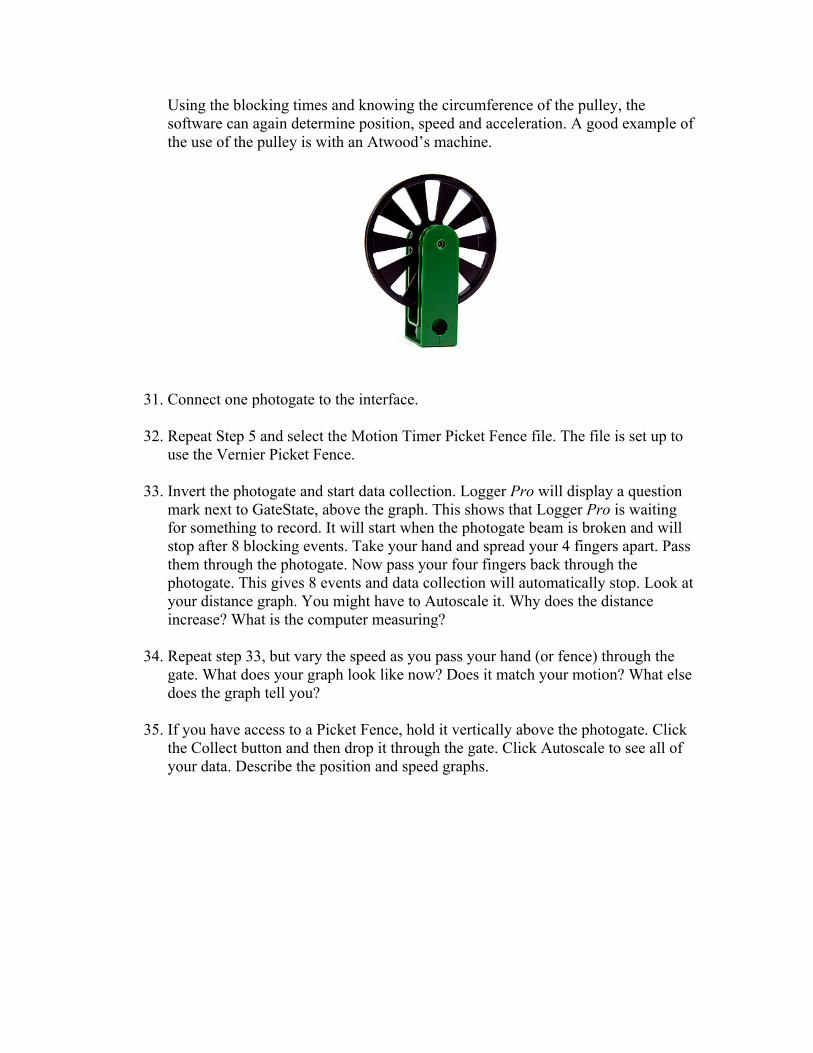
Using the blocking times and knowing the circumference of the pulley, the software can again determine position, speed and acceleration. A good example of the use of the pulley is with an Atwood’s machine.
31. Connect one photogate to the interface. 32. Repeat Step 5 and select the Motion Timer Picket Fence file. The file is set up to
use the Vernier Picket Fence.
33. Invert the photogate and start data collection. Logger Pro will display a question mark next to GateState, above the graph. This shows that Logger Pro is waiting for something to record. It will start when the photogate beam is broken and will stop after 8 blocking events. Take your hand and spread your 4 fingers apart. Pass them through the photogate. Now pass your four fingers back through the photogate. This gives 8 events and data collection will automatically stop. Look at your distance graph. You might have to Autoscale it. Why does the distance increase? What is the computer measuring?
34. Repeat step 33, but vary the speed as you pass your hand (or fence) through the
gate. What does your graph look like now? Does it match your motion? What else does the graph tell you?
35. If you have access to a Picket Fence, hold it vertically above the photogate. Click the Collect button and then drop it through the gate. Click Autoscale to see all of your data. Describe the position and speed graphs.
Part VI Digital Events
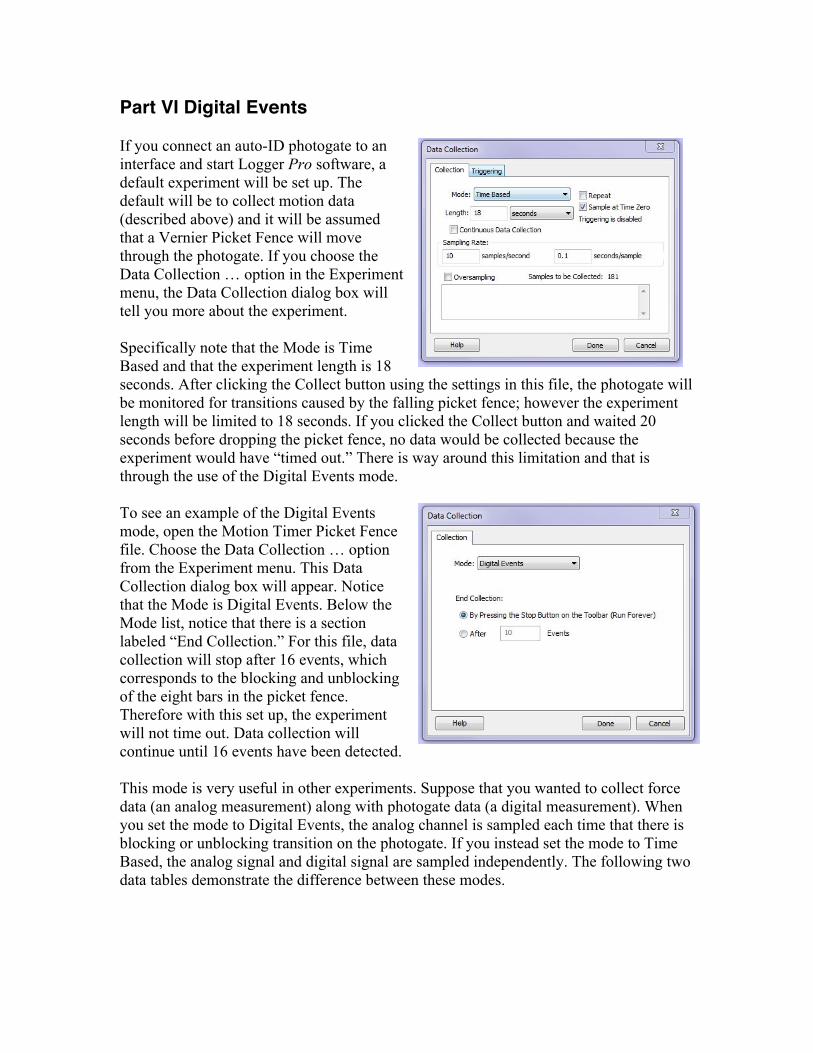
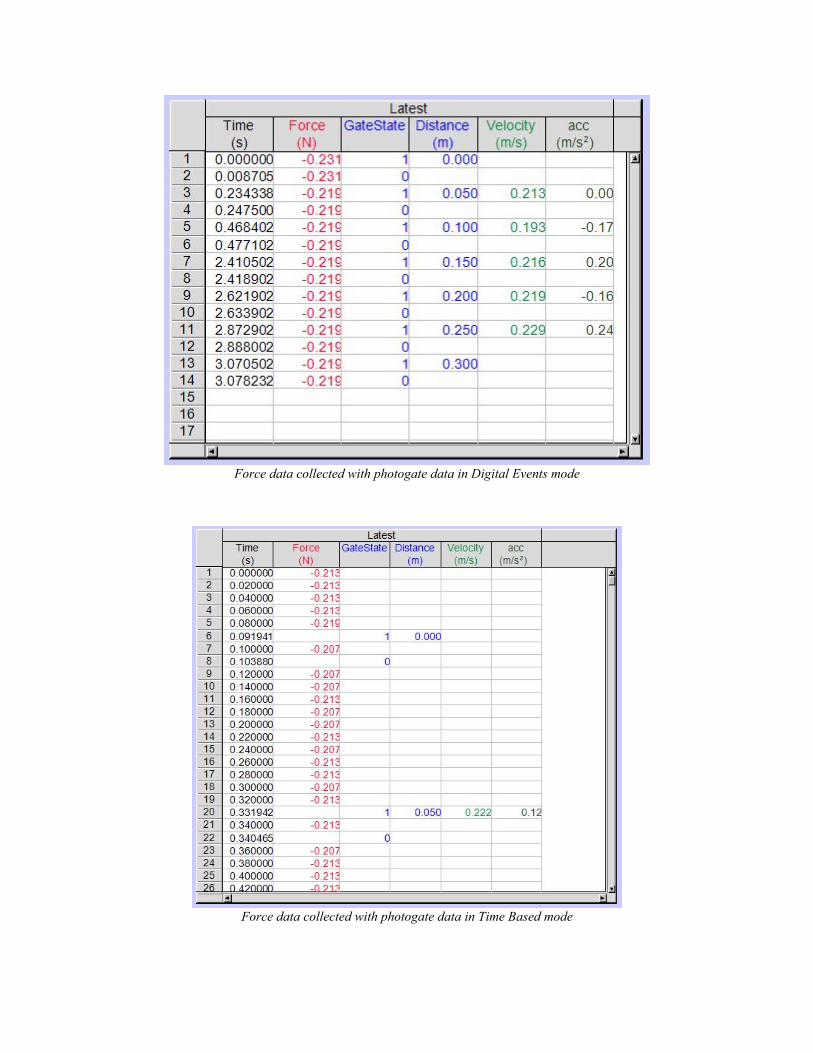
If you connect an auto-ID photogate to an interface and start Logger Pro software, a default experiment will be set up. The default will be to collect motion data (described above) and it will be assumed that a Vernier Picket Fence will move through the photogate. If you choose the Data Collection … option in the Experiment menu, the Data Collection dialog box will tell you more about the experiment. Specifically note that the Mode is Time Based and that the experiment length is 18 seconds. After clicking the Collect button using the settings in this file, the photogate will be monitored for transitions caused by the falling picket fence; however the experiment length will be limited to 18 seconds. If you clicked the Collect button and waited 20 seconds before dropping the picket fence, no data would be collected because the experiment would have “timed out.” There is way around this limitation and that is through the use of the Digital Events mode. To see an example of the Digital Events mode, open the Motion Timer Picket Fence file. Choose the Data Collection … option from the Experiment menu. This Data Collection dialog box will appear. Notice that the Mode is Digital Events. Below the Mode list, notice that there is a section labeled “End Collection.” For this file, data collection will stop after 16 events, which corresponds to the blocking and unblocking of the eight bars in the picket fence. Therefore with this set up, the experiment will not time out. Data collection will continue until 16 events have been detected. This mode is very useful in other experiments. Suppose that you wanted to collect force data (an analog measurement) along with photogate data (a digital measurement). When you set the mode to Digital Events, the analog channel is sampled each time that there is blocking or unblocking transition on the photogate. If you instead set the mode to Time Based, the analog signal and digital signal are sampled independently. The following two data tables demonstrate the difference between these modes.
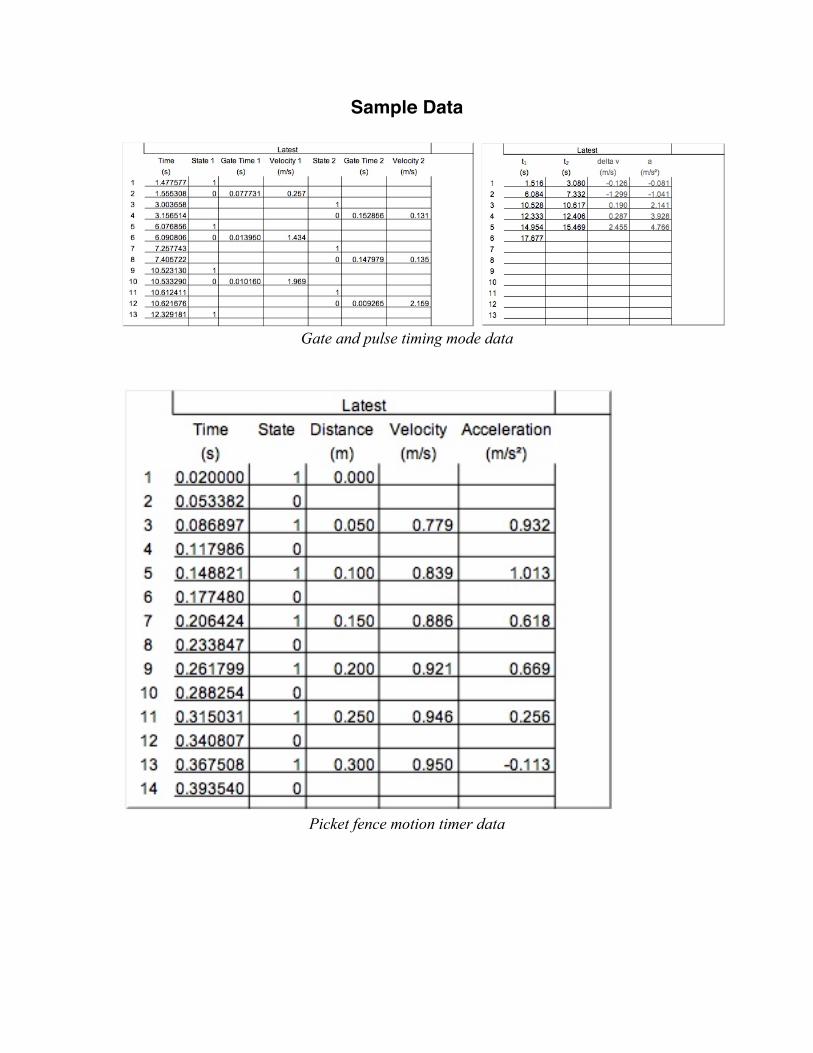
Force data collected with photogate data in Digital Events mode
Force data collected with photogate data in Time Based mode
Sample Data
Gate and pulse timing mode data
Picket fence motion timer data
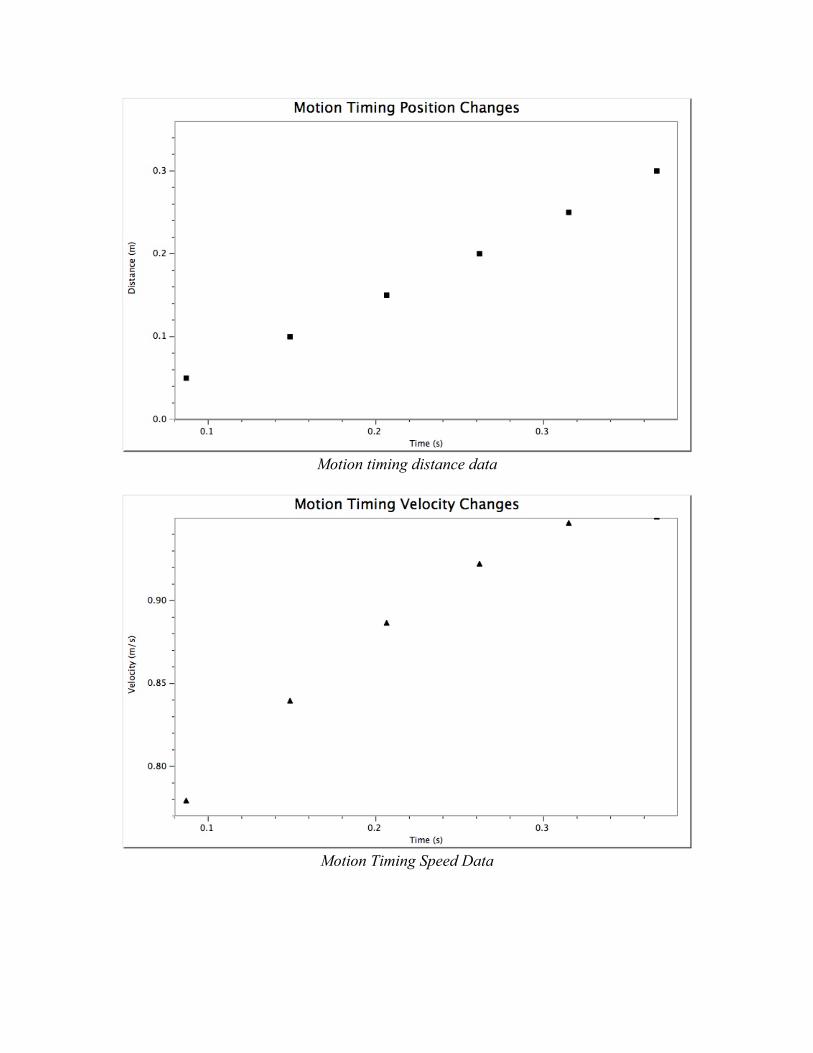
Motion timing distance data
Motion Timing Speed Data
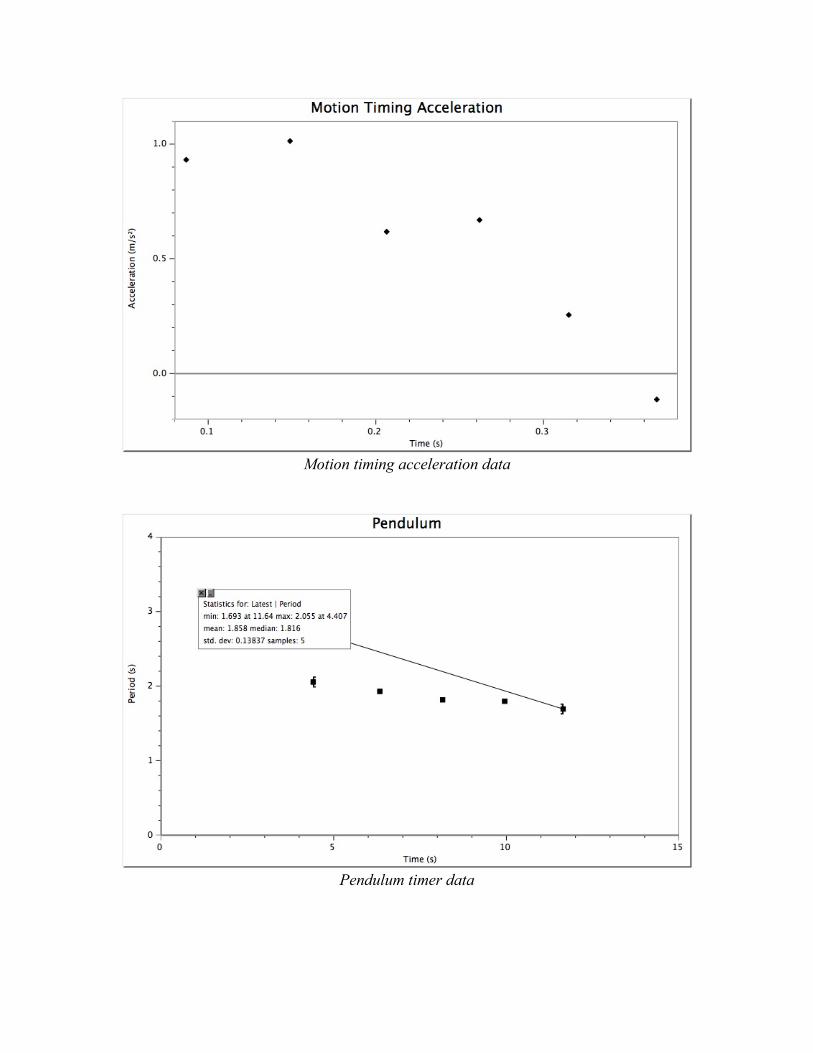
Motion timing acceleration data
Pendulum timer data
TIPS Experiment Information
1. The photogate can also be used as a laser gate. A mechanical shutter, located on the inside of the photogate arm is used to block the internal gate, making the use of the outside gate possible. A laser is needed to provide the signal for the photogate. This enables you to make a gate as large as you need it.
2. The experiment files for the different modes of photogate timing are included with Logger Pro. It is recommended that you use these files to ensure correct setup of the photogate(s).
Sensor Information
1. The photogate may have a mechanical shutter on the inside of the arm of the gate. If the photogate is not registering blocking and unblocking events, check to see that this shutter is open, and not closed.