Embed Size (px)
Citation preview
Introduction to Theory of Constraints
Competitive Manufacturing Management
Where it all began• In 1984, Eli Goldratt wrote an international
best seller on operations management -- The Goal. In this text, which was written in the form of a novel, he outlined his views of operations management -- specifically, finite capacity scheduling.
• Since it was first published, he and others have continued to expand the systems thinking he laid out in The Goal.
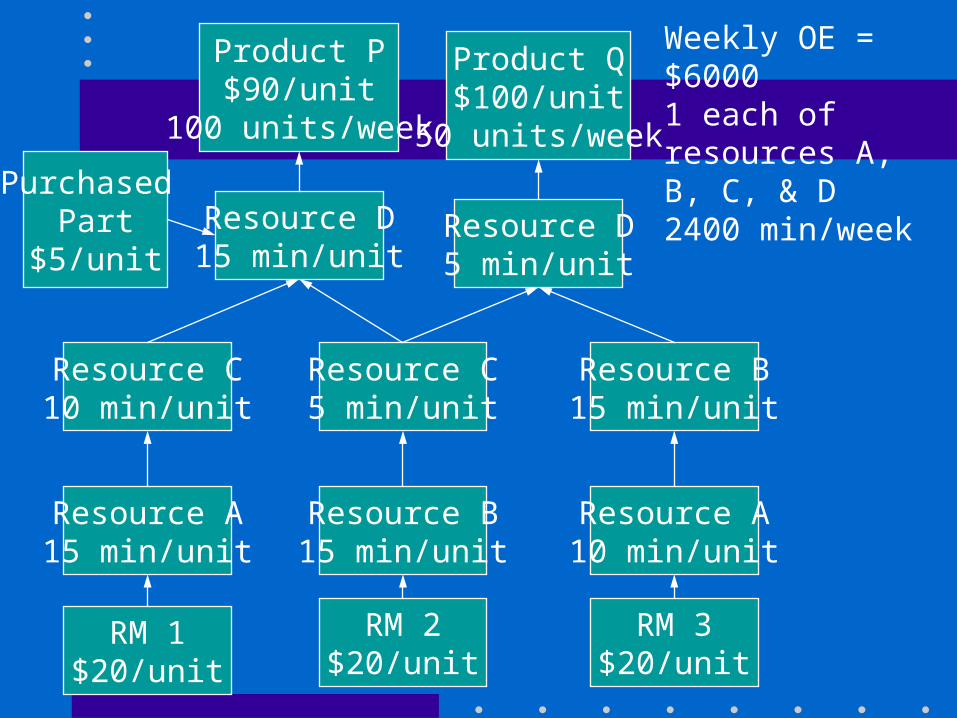
Product P$90/unit
100 units/week
Product Q$100/unit
50 units/week
Resource D15 min/unit
Resource D5 min/unit
Resource C5 min/unit
Resource C10 min/unit
Resource B15 min/unit
Resource A15 min/unit
Resource B15 min/unit
Resource A10 min/unit
RM 1$20/unit
RM 2$20/unit
RM 3$20/unit
Purchased Part
$5/unit
Weekly OE = $60001 each of resources A, B, C, & D2400 min/week
Base Scenario
• What is the most profitable product mix?
• How much money can be made in 1 week given the above information?
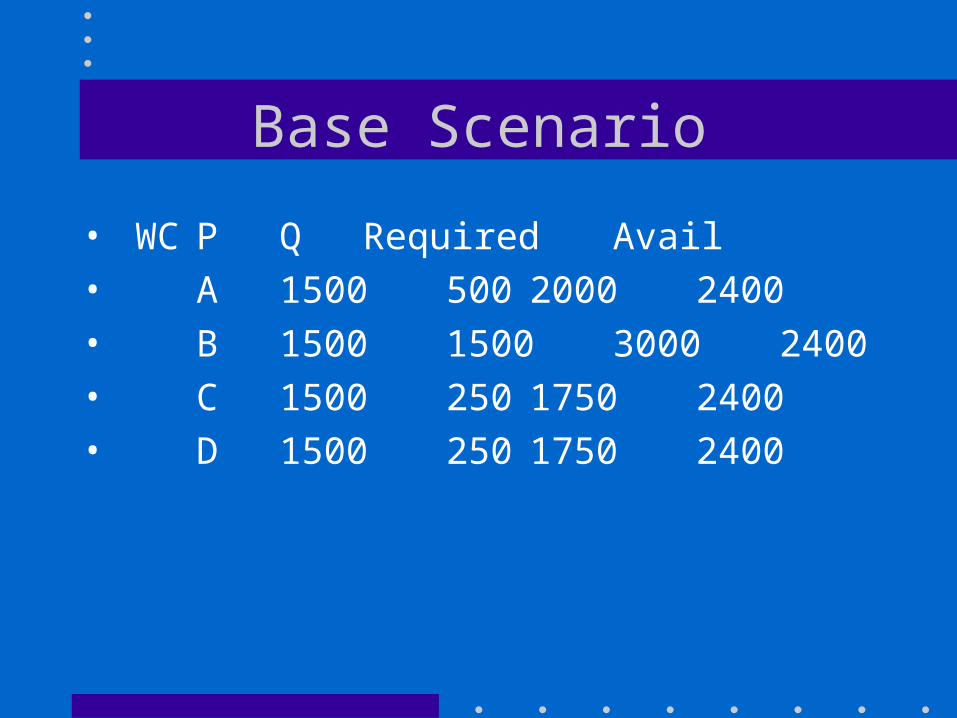
Base Scenario
• WC P Q Required Avail
• A 1500 500 2000 2400
• B 1500 1500 3000 2400
• C 1500 250 1750 2400
• D 1500 250 1750 2400
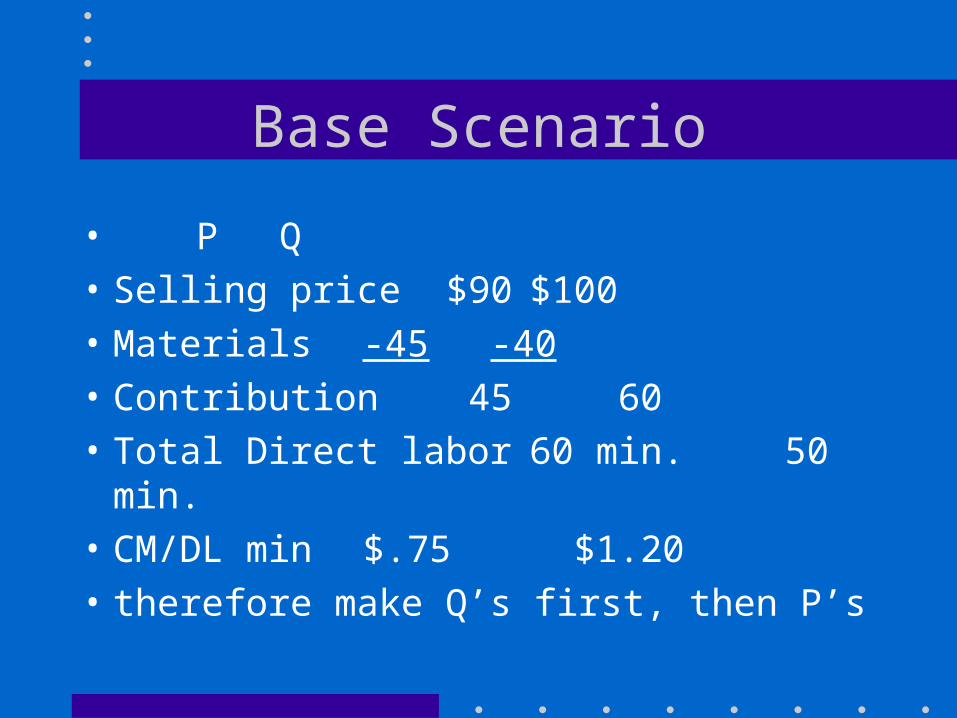
Base Scenario
• P Q
• Selling price $90 $100
• Materials -45 -40
• Contribution 45 60
• Total Direct labor 60 min. 50 min.
• CM/DL min $.75 $1.20
• therefore make Q’s first, then P’s
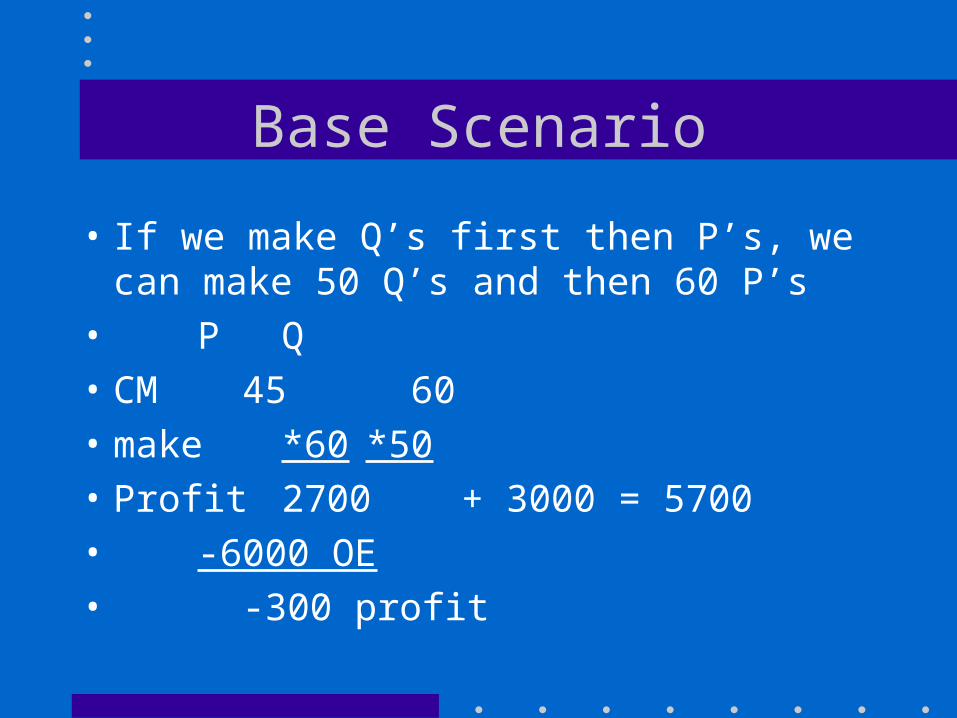
Base Scenario
• If we make Q’s first then P’s, we can make 50 Q’s and then 60 P’s
• P Q
• CM 45 60
• make*60 *50
• Profit 2700 + 3000 = 5700
• -6000 OE
• -300 profit
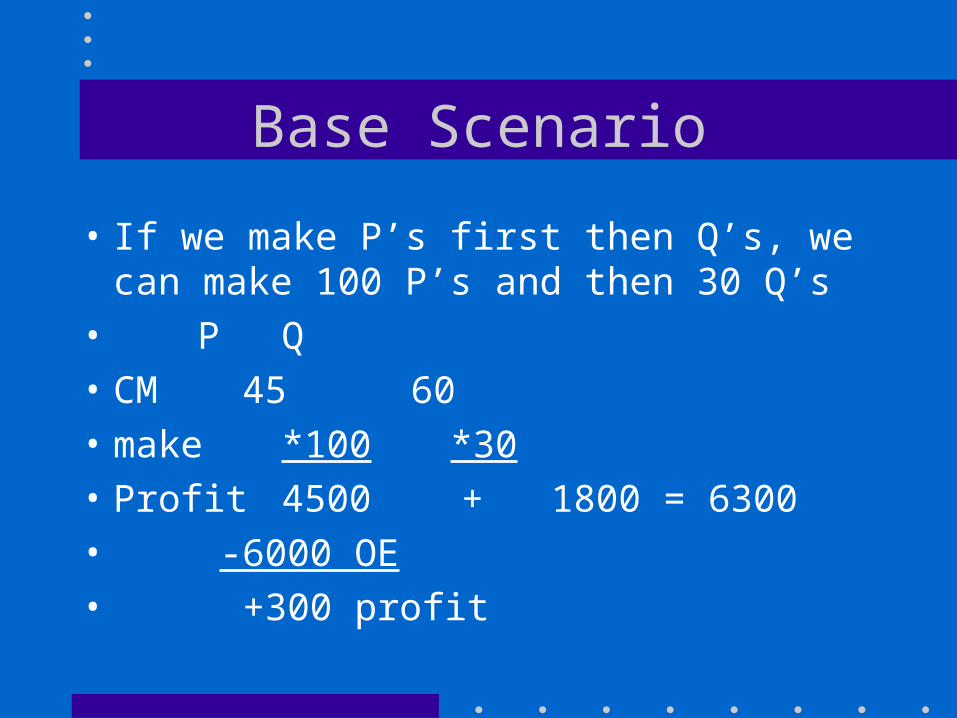
Base Scenario
• If we make P’s first then Q’s, we can make 100 P’s and then 30 Q’s
• P Q
• CM 45 60
• make*100 *30
• Profit 4500 + 1800 = 6300
• -6000 OE
• +300 profit
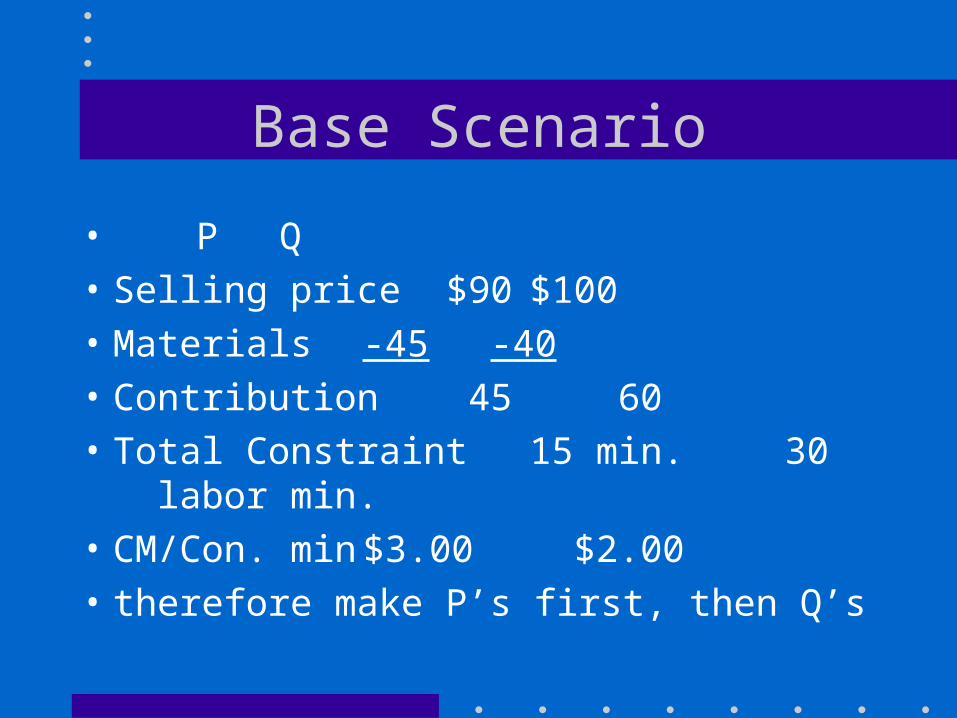
Base Scenario
• P Q
• Selling price $90 $100
• Materials -45 -40
• Contribution 45 60
• Total Constraint 15 min. 30 labor min.
• CM/Con. min $3.00 $2.00
• therefore make P’s first, then Q’s
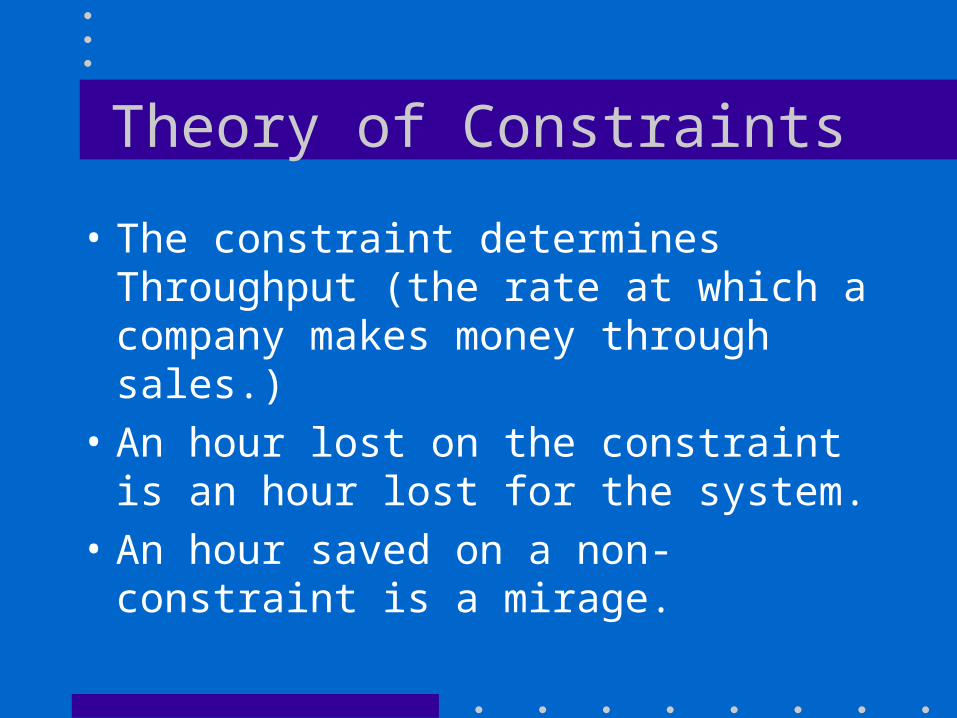
Theory of Constraints
• The constraint determines Throughput (the rate at which a company makes money through sales.)
• An hour lost on the constraint is an hour lost for the system.
• An hour saved on a non-constraint is a mirage.
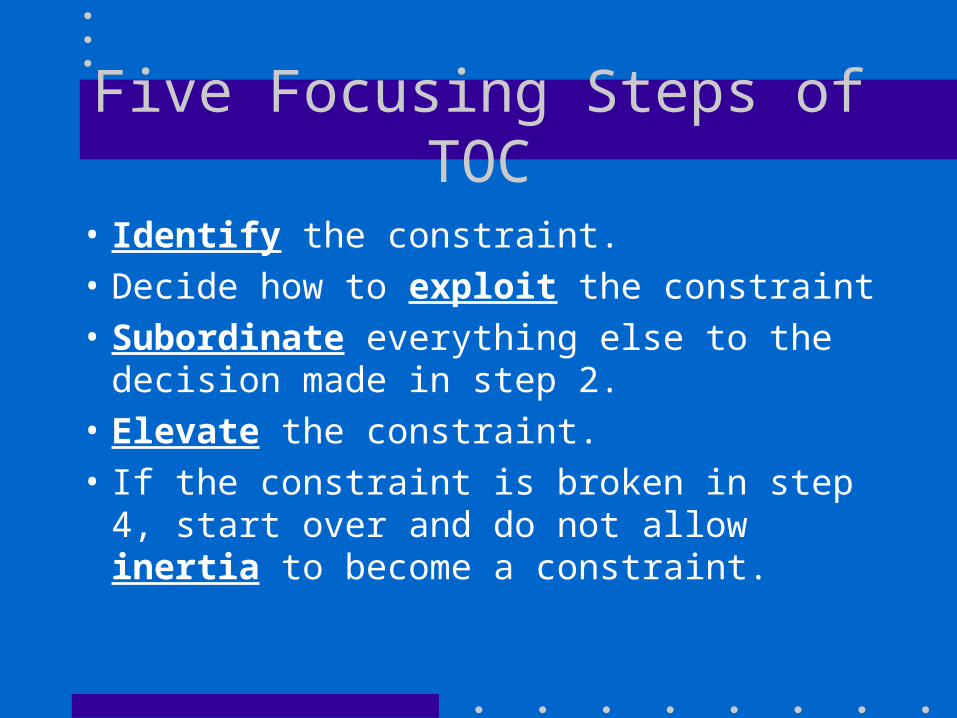
Five Focusing Steps of TOC
• Identify the constraint.
• Decide how to exploit the constraint
• Subordinate everything else to the decision made in step 2.
• Elevate the constraint.
• If the constraint is broken in step 4, start over and do not allow inertia to become a constraint.
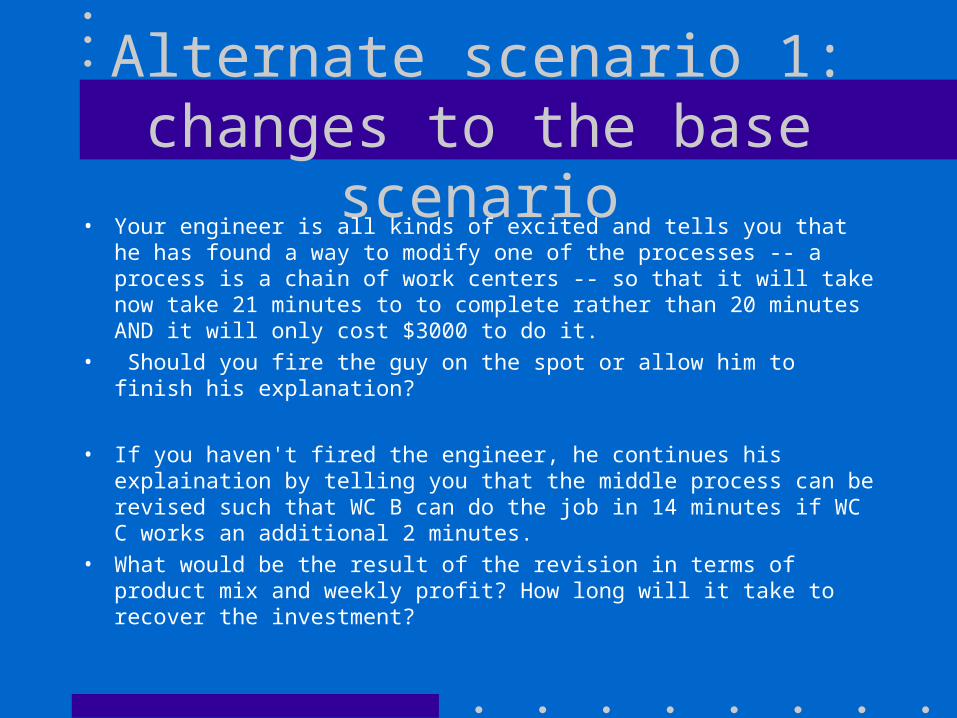
Alternate scenario 1: changes to the base scenario
• Your engineer is all kinds of excited and tells you that he has found a way to modify one of the processes -- a process is a chain of work centers -- so that it will take now take 21 minutes to to complete rather than 20 minutes AND it will only cost $3000 to do it.
• Should you fire the guy on the spot or allow him to finish his explanation?
• If you haven't fired the engineer, he continues his explaination by telling you that the middle process can be revised such that WC B can do the job in 14 minutes if WC C works an additional 2 minutes.
• What would be the result of the revision in terms of product mix and weekly profit? How long will it take to recover the investment?
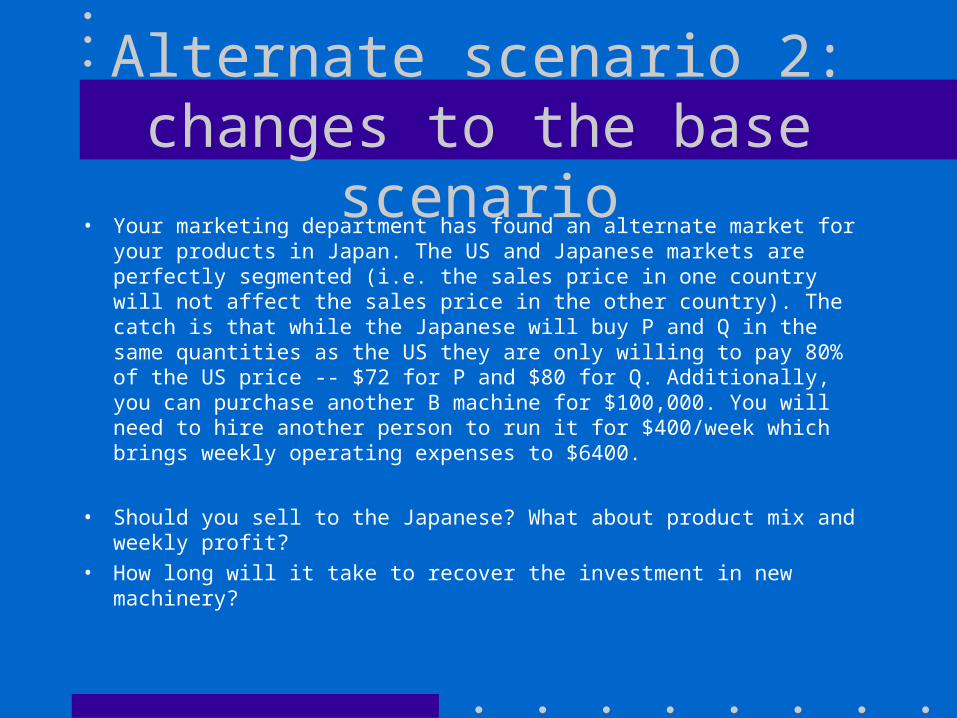
Alternate scenario 2: changes to the base scenario
• Your marketing department has found an alternate market for your products in Japan. The US and Japanese markets are perfectly segmented (i.e. the sales price in one country will not affect the sales price in the other country). The catch is that while the Japanese will buy P and Q in the same quantities as the US they are only willing to pay 80% of the US price -- $72 for P and $80 for Q. Additionally, you can purchase another B machine for $100,000. You will need to hire another person to run it for $400/week which brings weekly operating expenses to $6400.
• Should you sell to the Japanese? What about product mix and weekly profit?
• How long will it take to recover the investment in new machinery?
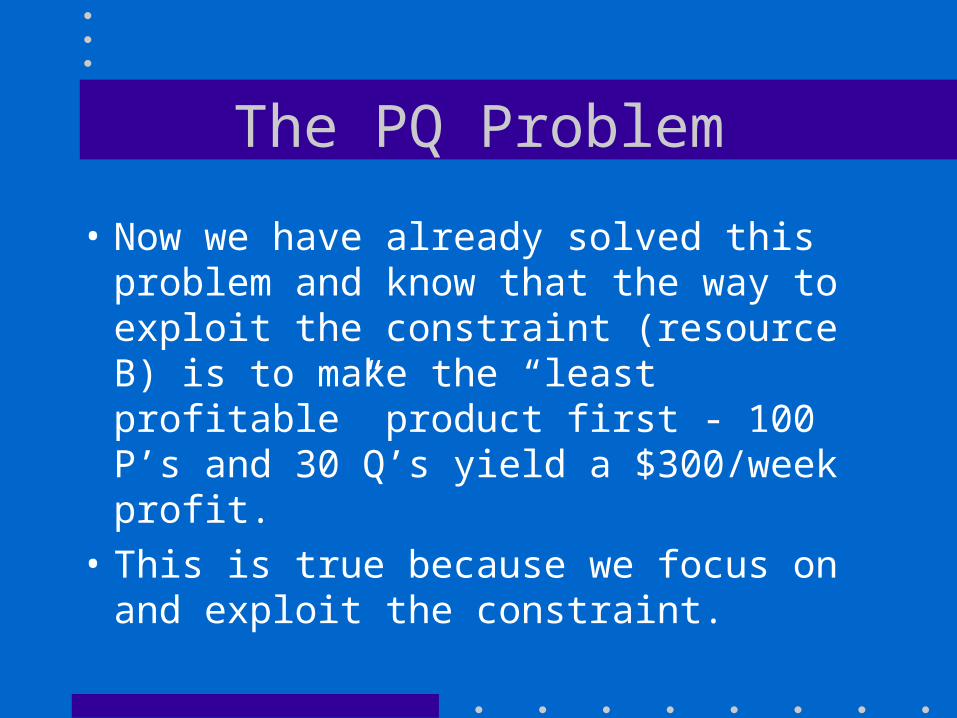
The PQ Problem
• Now we have already solved this problem and know that the way to exploit the constraint (resource B) is to make the “least profitable” product first - 100 P’s and 30 Q’s yield a $300/week profit.
• This is true because we focus on and exploit the constraint.

Y
Y
Y YY
Z
Z
$5
6 min/unit 8 min/unit
10 min/unit
20 min/unit
$5$5
$5$10$10
$10
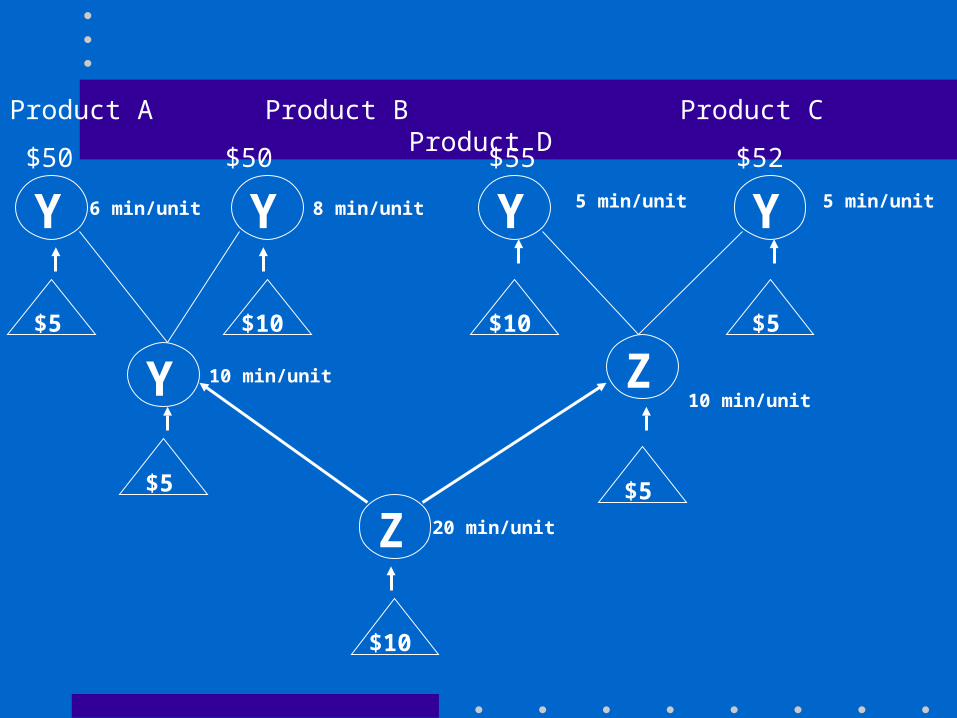
$52$55$50$50
Product A Product B Product C Product D
10 min/unit
5 min/unit 5 min/unit
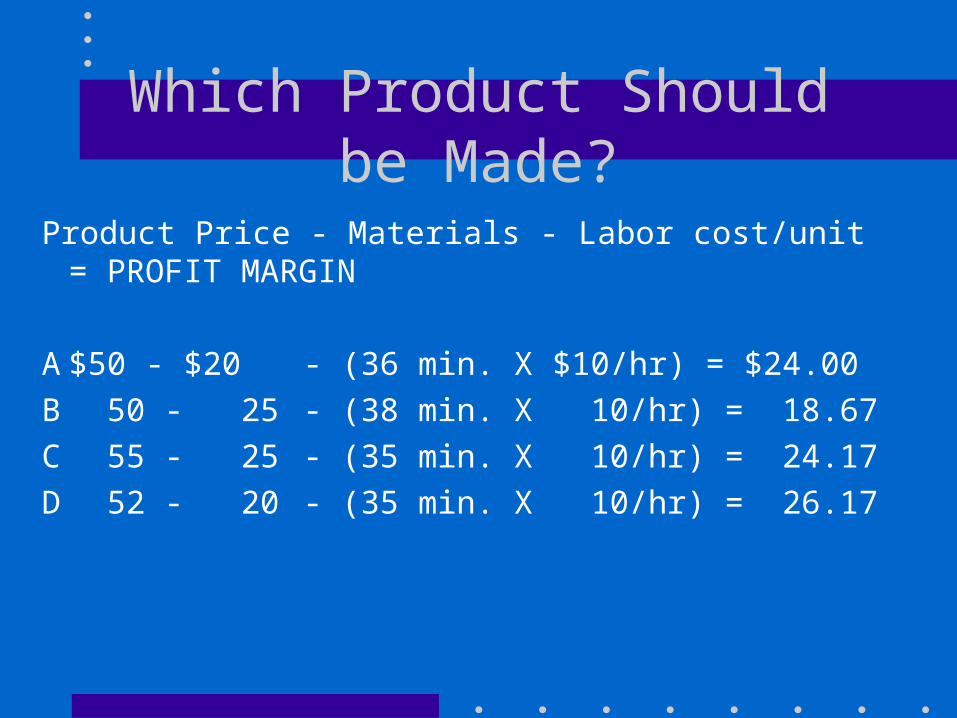
Which Product Should be Made?
Product Price - Materials - Labor cost/unit = PROFIT MARGIN
A $50 - $20 - (36 min. X $10/hr) = $24.00
B 50 - 25 - (38 min. X 10/hr) = 18.67
C 55 - 25 - (35 min. X 10/hr) = 24.17
D 52 - 20 - (35 min. X 10/hr) = 26.17
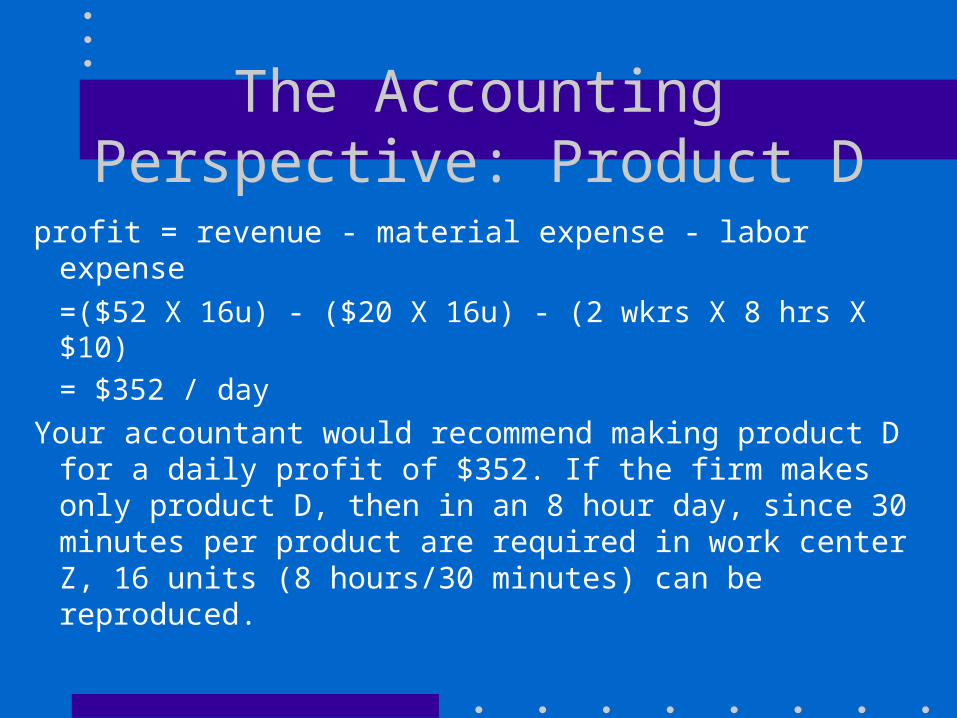
The Accounting Perspective: Product D
profit = revenue - material expense - labor expense
=($52 X 16u) - ($20 X 16u) - (2 wkrs X 8 hrs X $10)
= $352 / day
Your accountant would recommend making product D for a daily profit of $352. If the firm makes only product D, then in an 8 hour day, since 30 minutes per product are required in work center Z, 16 units (8 hours/30 minutes) can be reproduced.
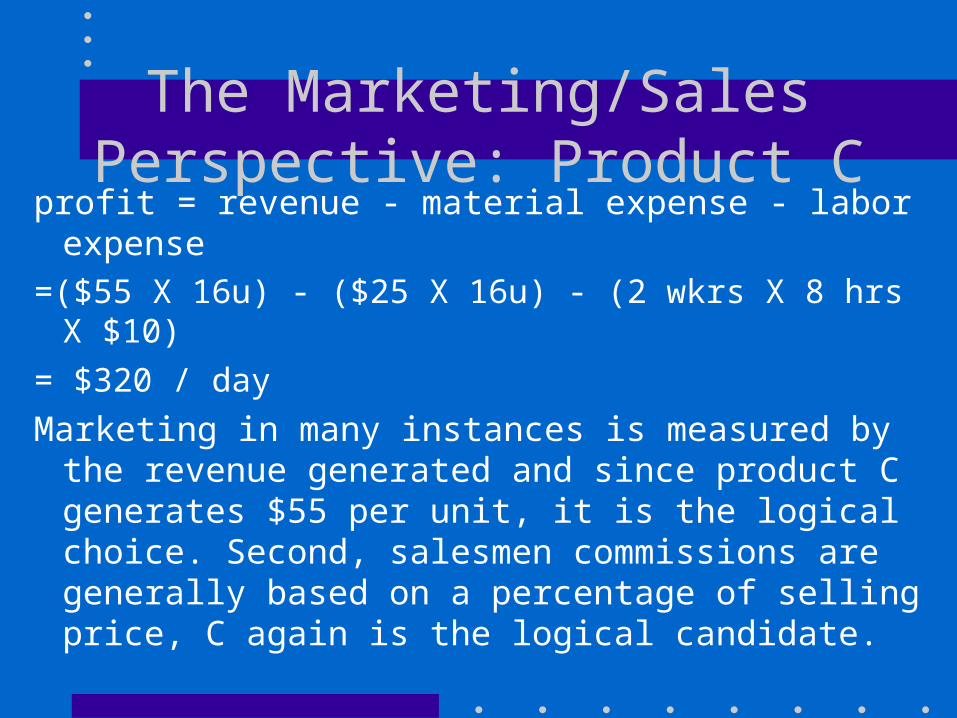
The Marketing/Sales Perspective: Product C
profit = revenue - material expense - labor expense
=($55 X 16u) - ($25 X 16u) - (2 wkrs X 8 hrs X $10)
= $320 / day
Marketing in many instances is measured by the revenue generated and since product C generates $55 per unit, it is the logical choice. Second, salesmen commissions are generally based on a percentage of selling price, C again is the logical candidate.
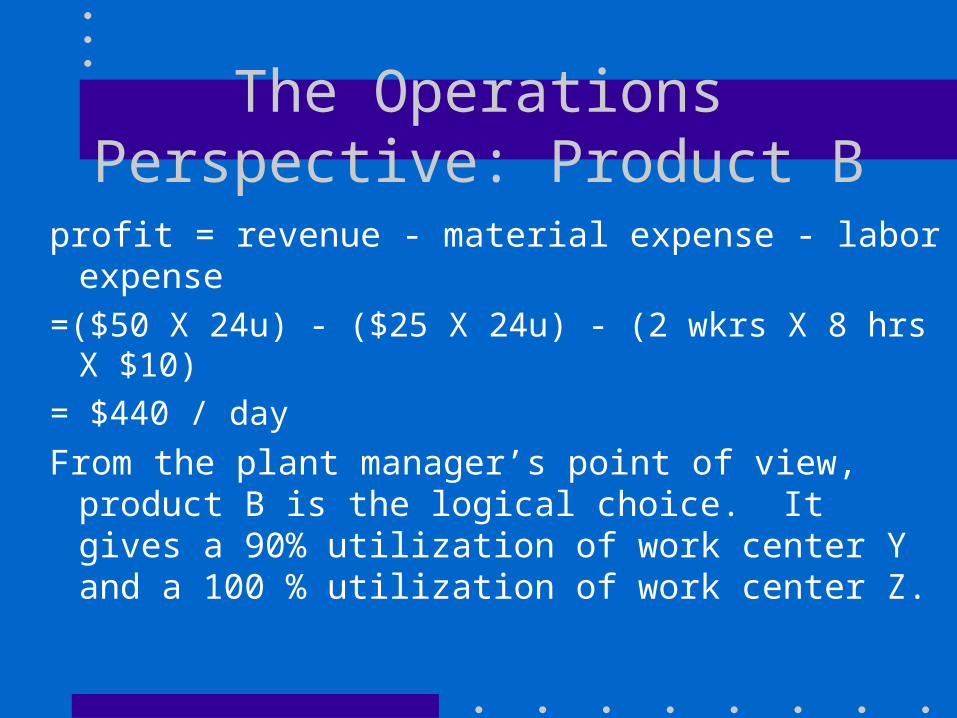
The Operations Perspective: Product B
profit = revenue - material expense - labor expense
=($50 X 24u) - ($25 X 24u) - (2 wkrs X 8 hrs X $10)
= $440 / day
From the plant manager’s point of view, product B is the logical choice. It gives a 90% utilization of work center Y and a 100 % utilization of work center Z.
Traditional Performance Measures: Limitations
• Standards and Variances, Direct Labor productivity, and Machine Utilization place emphasis on achieving goals in and of themselves.
• Overhead Allocation by direct labor investment is also inappropriate. When this method was developed, DL comprised most of a product’s cost; now the percentage is usually less than 10%.
Traditional Performance Measures: Limitations
• Traditional measures also tend to:– ignore inventory status and lead time;– be organized by functional silos;– and, emphasize past and near-future (short-term)
results.
• Many of the tools and processes we have discussed this term tend to increase (rather than decrease) costs in the short-term, but the long-term benefits are undeniable.
Enlightened Measures: Productivity
• Traditional measures tend to separate OH (IL) and DL, causing managers to focus on DL reduction. As world-class companies embrace empowerment, etc., many IL duties are shifted to DL employees.
Enlightened Measures:Principles
• Competitive Focus
• Emphasis on Clear, Common Sense Measures
• Emphasis on Trends and Long-Term Improvement
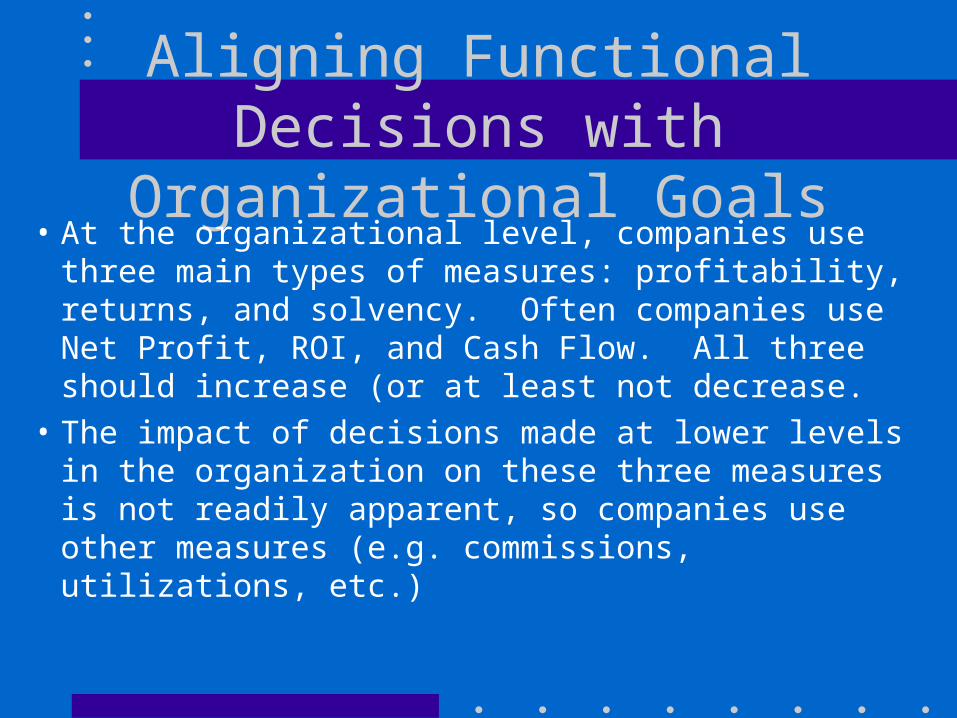
Aligning Functional Decisions with Organizational Goals
• At the organizational level, companies use three main types of measures: profitability, returns, and solvency. Often companies use Net Profit, ROI, and Cash Flow. All three should increase (or at least not decrease.
• The impact of decisions made at lower levels in the organization on these three measures is not readily apparent, so companies use other measures (e.g. commissions, utilizations, etc.)
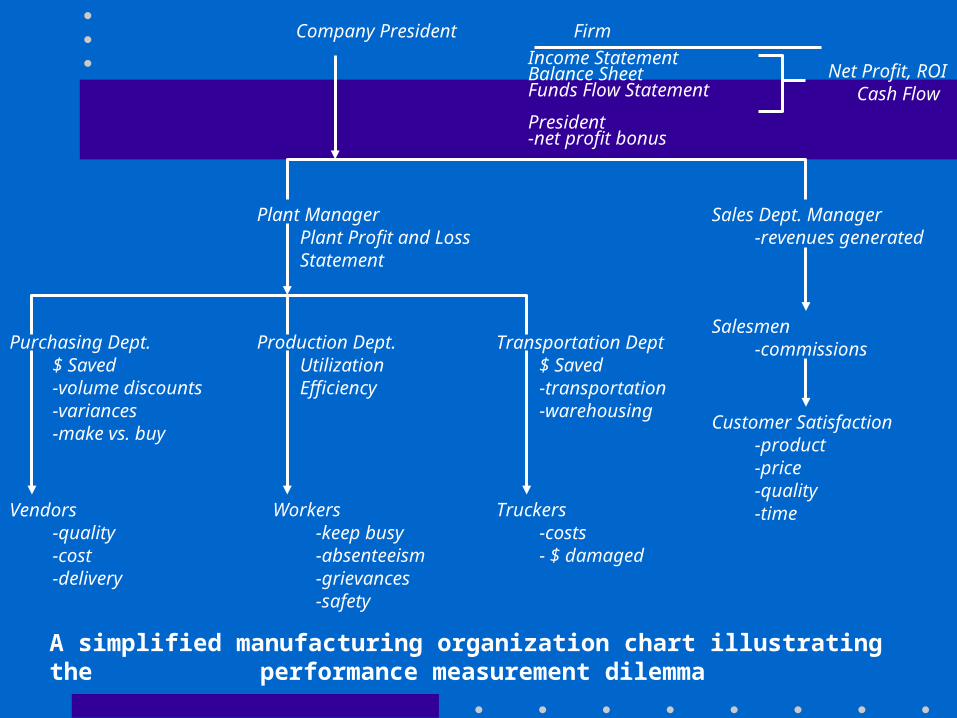
Company President Firm
Plant Manager Plant Profit and Loss Statement
Vendors -quality -cost -delivery
Purchasing Dept. $ Saved -volume discounts -variances -make vs. buy
Production Dept. Utilization Efficiency
Workers -keep busy -absenteeism -grievances -safety
Transportation Dept $ Saved -transportation -warehousing
Truckers -costs - $ damaged
Income StatementBalance SheetFunds Flow Statement
President-net profit bonus
Sales Dept. Manager -revenues generated
Salesmen -commissions
Customer Satisfaction -product -price -quality -time
A simplified manufacturing organization chart illustrating the performance measurement dilemma
Net Profit, ROI Cash Flow
Y
Y
Y YY
Z
Z
$5
6 min/unit 8 min/unit
10 min/unit
20 min/unit
$5$5
$5$10$10
$10
$52$55$50$50
Product A Product B Product C Product D
10 min/unit
5 min/unit 5 min/unit
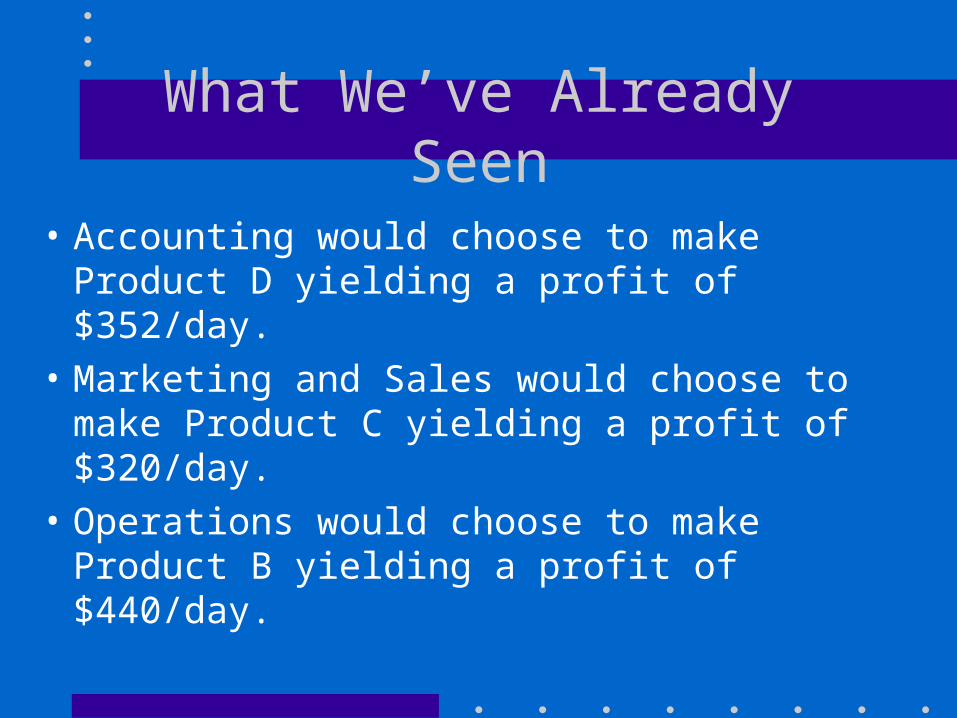
What We’ve Already Seen
• Accounting would choose to make Product D yielding a profit of $352/day.
• Marketing and Sales would choose to make Product C yielding a profit of $320/day.
• Operations would choose to make Product B yielding a profit of $440/day.
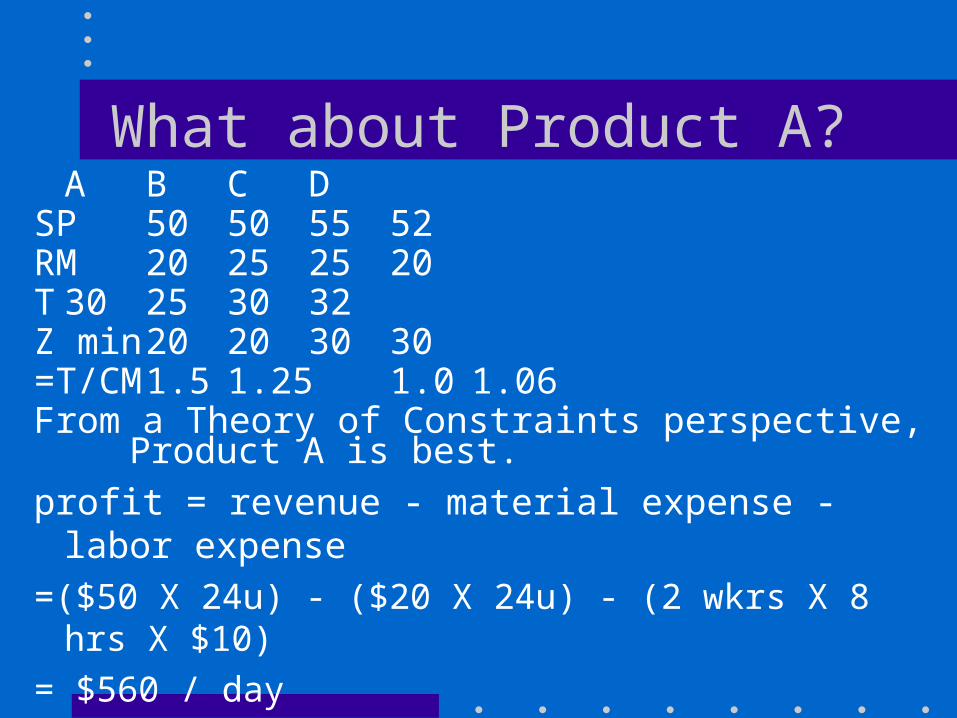
What about Product A?A B C D
SP 50 50 55 52RM 20 25 25 20T 30 25 30 32Z min 20 20 30 30=T/CM1.5 1.25 1.0 1.06From a Theory of Constraints perspective,
Product A is best.
profit = revenue - material expense - labor expense
=($50 X 24u) - ($20 X 24u) - (2 wkrs X 8 hrs X $10)
= $560 / day
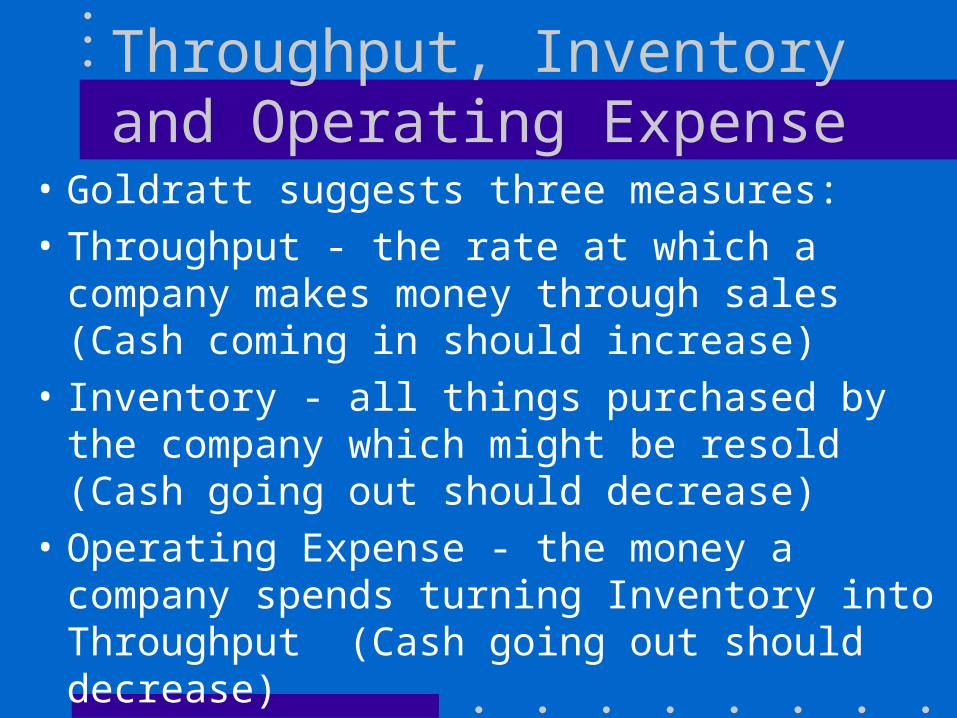
Throughput, Inventory and Operating Expense
• Goldratt suggests three measures:
• Throughput - the rate at which a company makes money through sales (Cash coming in should increase)
• Inventory - all things purchased by the company which might be resold (Cash going out should decrease)
• Operating Expense - the money a company spends turning Inventory into Throughput (Cash going out should decrease)
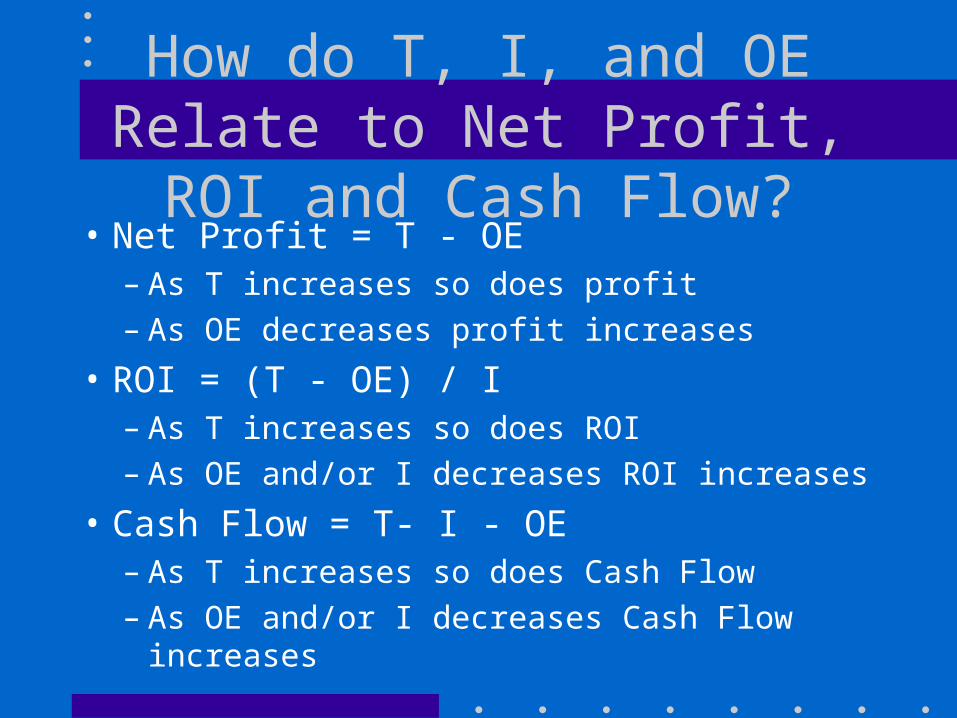
How do T, I, and OE Relate to Net Profit, ROI and Cash Flow?
• Net Profit = T - OE– As T increases so does profit– As OE decreases profit increases
• ROI = (T - OE) / I– As T increases so does ROI– As OE and/or I decreases ROI increases
• Cash Flow = T- I - OE– As T increases so does Cash Flow– As OE and/or I decreases Cash Flow increases
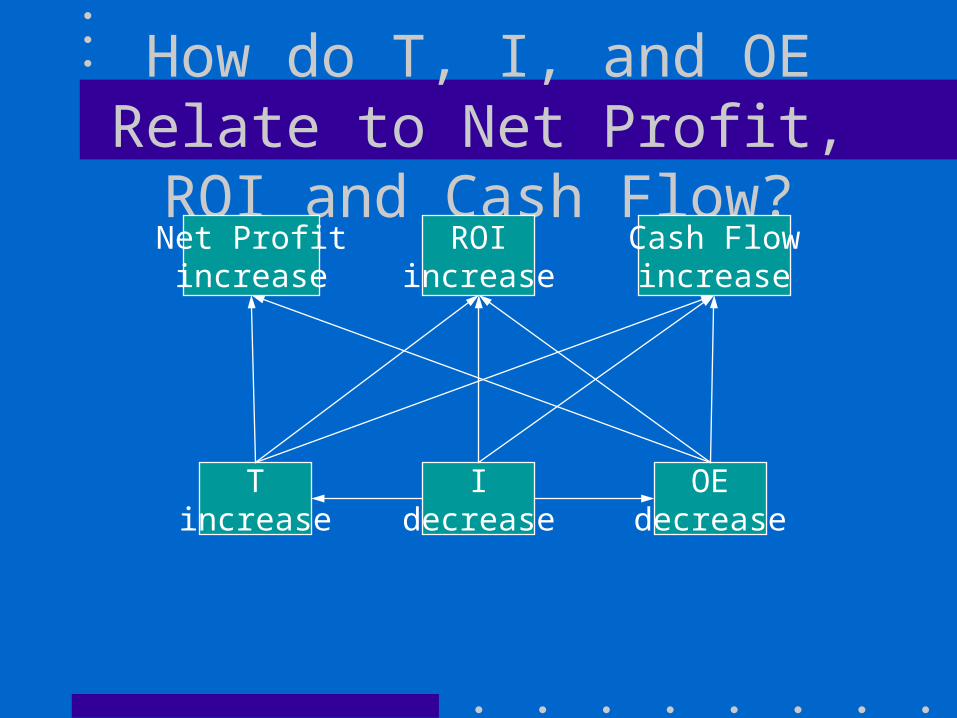
How do T, I, and OE Relate to Net Profit, ROI and Cash Flow?
Net Profitincrease
ROIincrease
Cash Flowincrease
Tincrease
Idecrease
OEdecrease
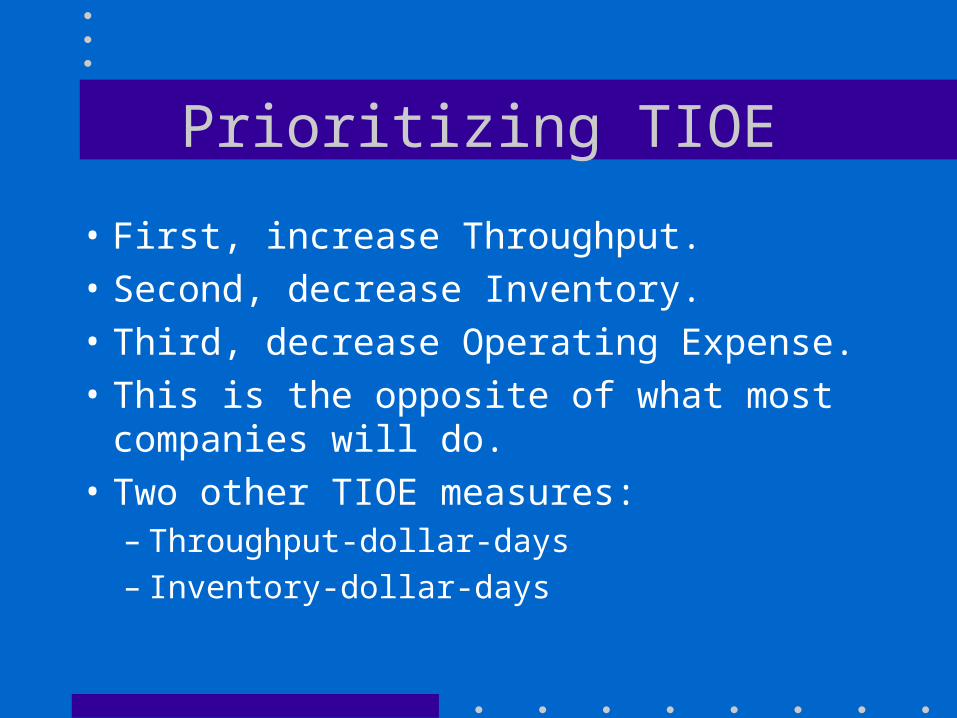
Prioritizing TIOE
• First, increase Throughput.
• Second, decrease Inventory.
• Third, decrease Operating Expense.
• This is the opposite of what most companies will do.
• Two other TIOE measures:– Throughput-dollar-days– Inventory-dollar-days
Paradigm Shifts
• Cost accounting and T, I, OE are different paradigms. You should be able to see the world through both. You will certainly encounter cost accounting where you work, and you should know how to tell when it is misleading.
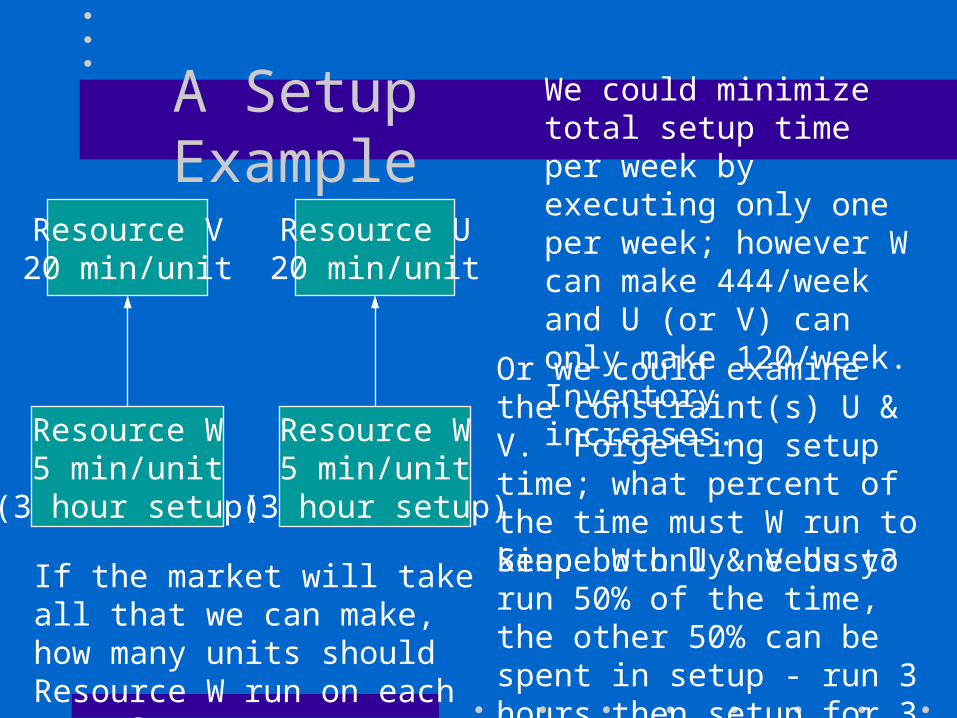
A Setup Example
Resource V20 min/unit
Resource U20 min/unit
Resource W5 min/unit
(3 hour setup)
If the market will take all that we can make, how many units should Resource W run on each setup?
We could minimize total setup time per week by executing only one per week; however W can make 444/week and U (or V) can only make 120/week. Inventory increases.
Or we could examine the constraint(s) U & V. Forgetting setup time; what percent of the time must W run to keep both U & V busy?Since W only needs to run 50% of the time, the other 50% can be spent in setup - run 3 hours then setup for 3 hours - 36 units.
Resource W5 min/unit
(3 hour setup)
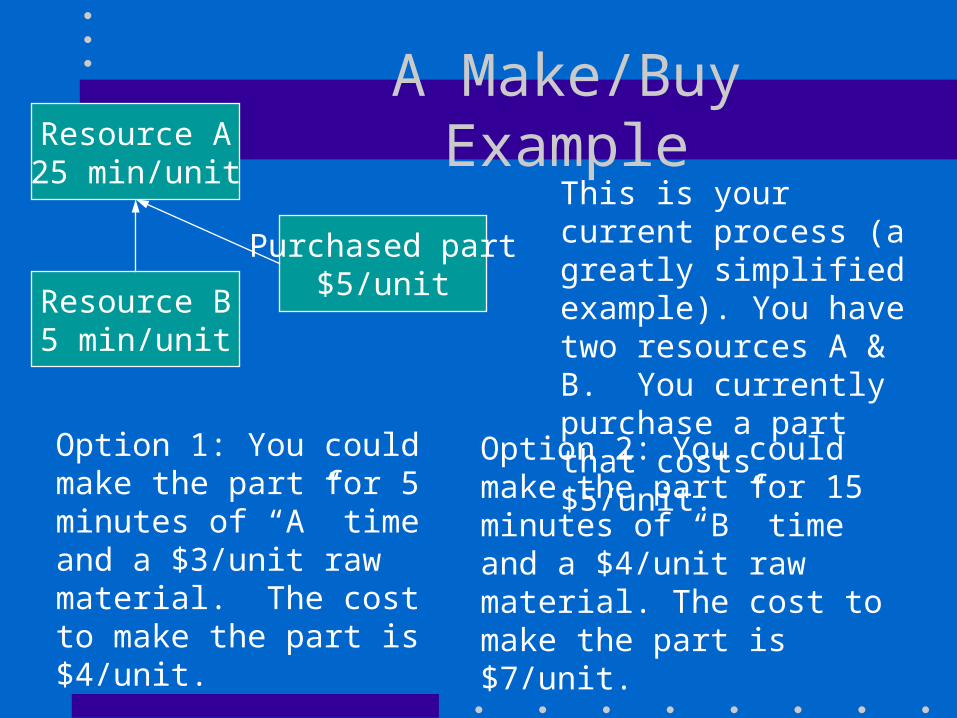
A Make/Buy ExampleResource A25 min/unit
Resource B5 min/unit
Purchased part$5/unit
This is your current process (a greatly simplified example). You have two resources A & B. You currently purchase a part that costs $5/unit.
Option 1: You could make the part for 5 minutes of “A” time and a $3/unit raw material. The cost to make the part is $4/unit.
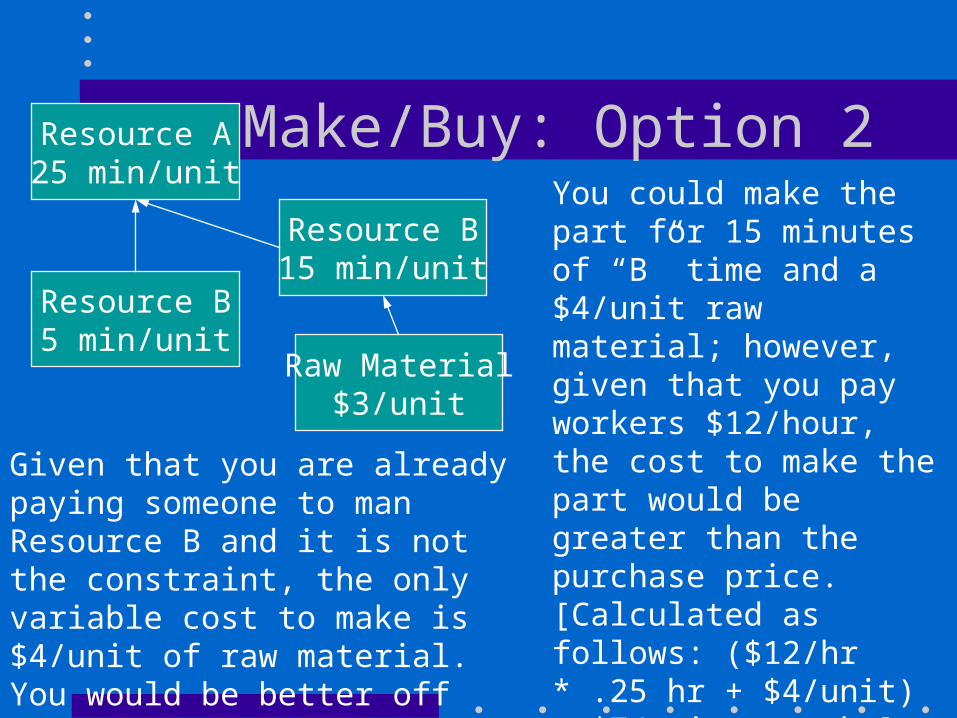
Option 2: You could make the part for 15 minutes of “B” time and a $4/unit raw material. The cost to make the part is $7/unit.
Which is the better decision?
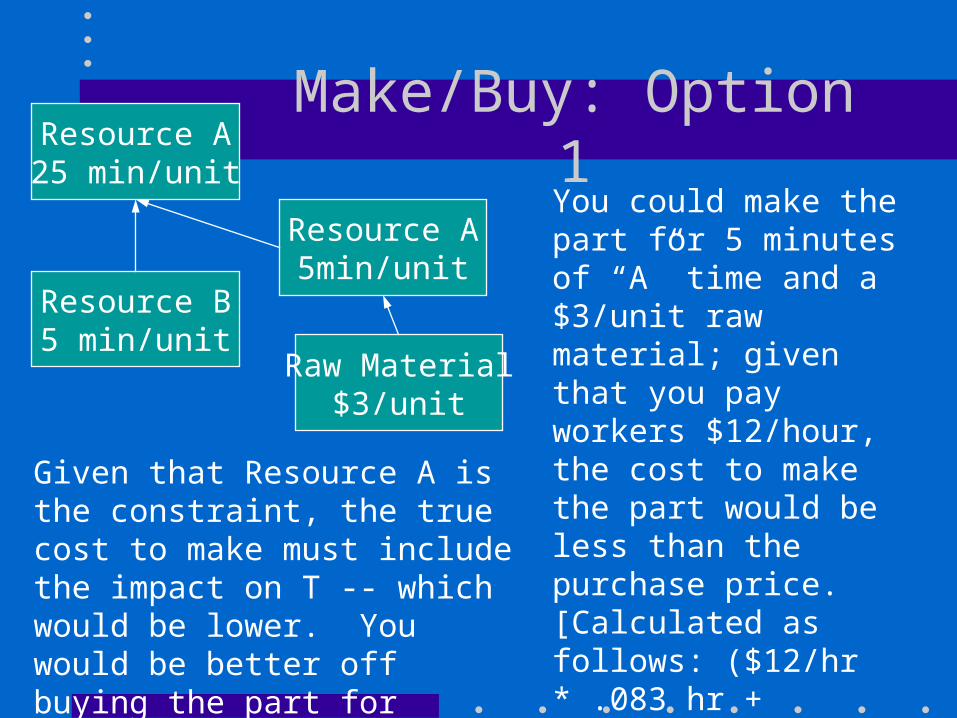
Make/Buy: Option 1You could make the part for 5 minutes of “A” time and a $3/unit raw material; given that you pay workers $12/hour, the cost to make the part would be less than the purchase price. [Calculated as follows: ($12/hr * .083 hr + $3/unit) = $4/unit to make].
Shouldn’t you make the part?
Resource A25 min/unit
Resource B5 min/unit
Resource A5min/unit
Raw Material$3/unit
Given that Resource A is the constraint, the true cost to make must include the impact on T -- which would be lower. You would be better off buying the part for $5/unit.
Make/Buy: Option 2Resource A25 min/unit
Resource B5 min/unit
Resource B15 min/unit
Given that you are already paying someone to man Resource B and it is not the constraint, the only variable cost to make is $4/unit of raw material. You would be better off making the material -- T would increase.
You could make the part for 15 minutes of “B” time and a $4/unit raw material; however, given that you pay workers $12/hour, the cost to make the part would be greater than the purchase price. [Calculated as follows: ($12/hr * .25 hr + $4/unit) = $7/unit to make].
Shouldn’t you buy the part?
Raw Material$3/unit
Constraint Management
• The constraint determines Throughput (the rate at which a company makes money through sales.)
• An hour lost on the constraint is an hour lost for the system.
• An hour saved on a non-constraint is a mirage.
How do we Exploit the Constraint on the Shop Floor?
• We now know that the constraint must run at 100% efficiency to make the most money.
• Question: Should the non-constraints be required to run at 100% capacity?
• The answer is: NO! If non-constraint resources run at 100% capacity, then WIP is increased.
Drum-Buffer-Rope
• Production scheduling system following TOC principles.
• It is a hybrid push/pull system.
• The purpose DBR is to exploit the constraint.
The Drum• The constraint determines the throughput of
a plant.
• If we have an internal resource constraint, how do we maximize throughput? – Manage the constraint closely.
• If the constraint has such a significant effect on our operations, shouldn’t we consider it when we prepare the master production schedule (MPS)?
The Drum (con’t)
• The pace of the whole plant is determined by the pace of the constraint
• Therefore, we base the MPS on maximizing the constraint.
• Where do we want to minimize setups?
• We may want to try to group similar batches on the constraint to save setups
• We can use lot-for-lot (LFL) on non-constraints
Buffers
• We want to protect the throughput of the system from inevitable variability
• Inventory is a form of buffer, as is time.
• Location of buffers is critical– What points in the system need protection?
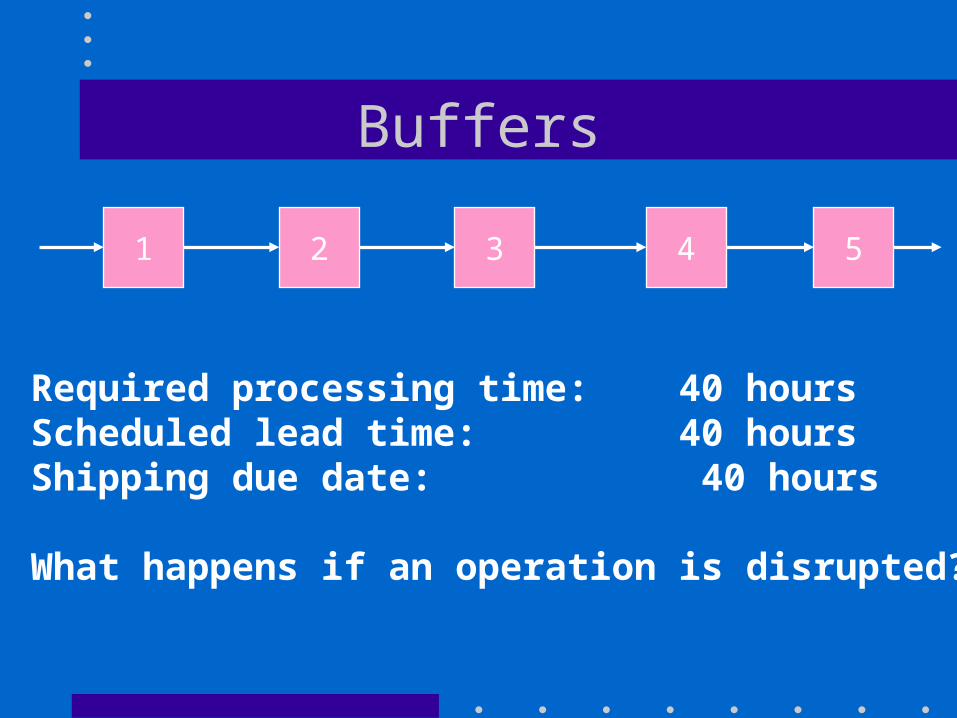
Buffers
1 2 3 4 5
Required processing time: 40 hoursScheduled lead time: 40 hoursShipping due date: 40 hours
What happens if an operation is disrupted?
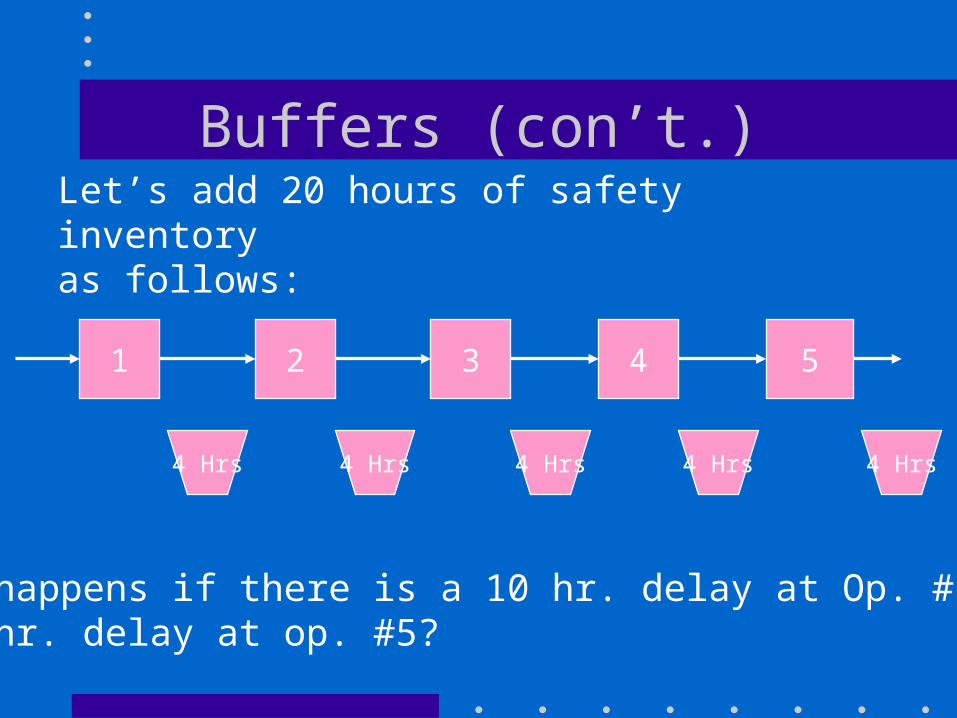
Buffers (con’t.)
1 2 3 4 5
4 Hrs
Let’s add 20 hours of safety inventoryas follows:
What happens if there is a 10 hr. delay at Op. #1?A 10 hr. delay at op. #5?
4 Hrs4 Hrs4 Hrs4 Hrs
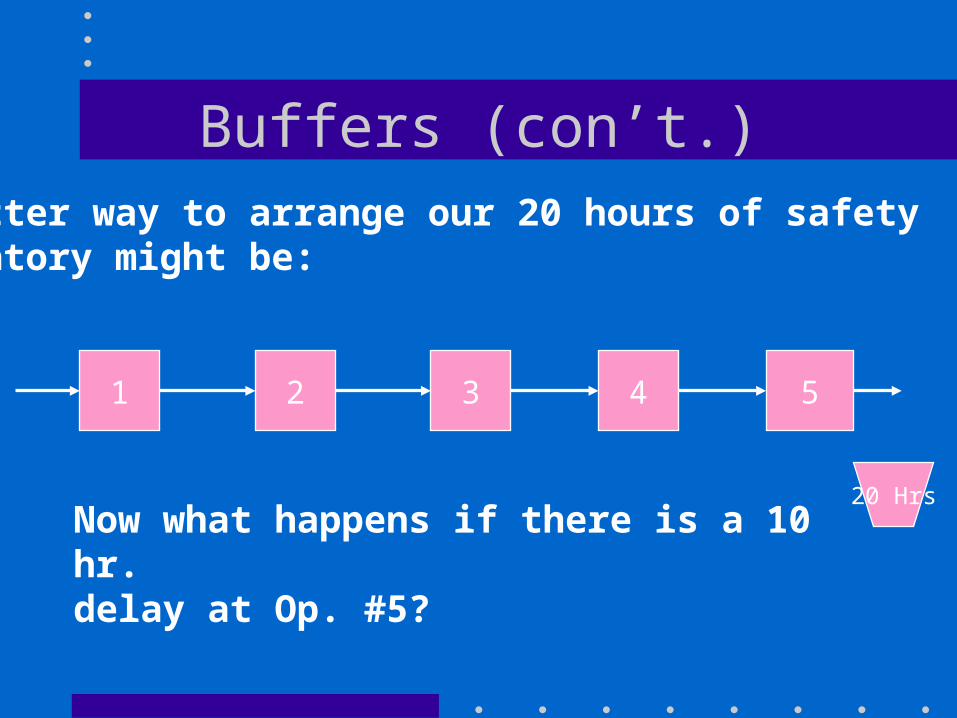
Buffers (con’t.)
1 2 3 4 5
20 Hrs
A better way to arrange our 20 hours of safetyinventory might be:
Now what happens if there is a 10 hr. delay at Op. #5?
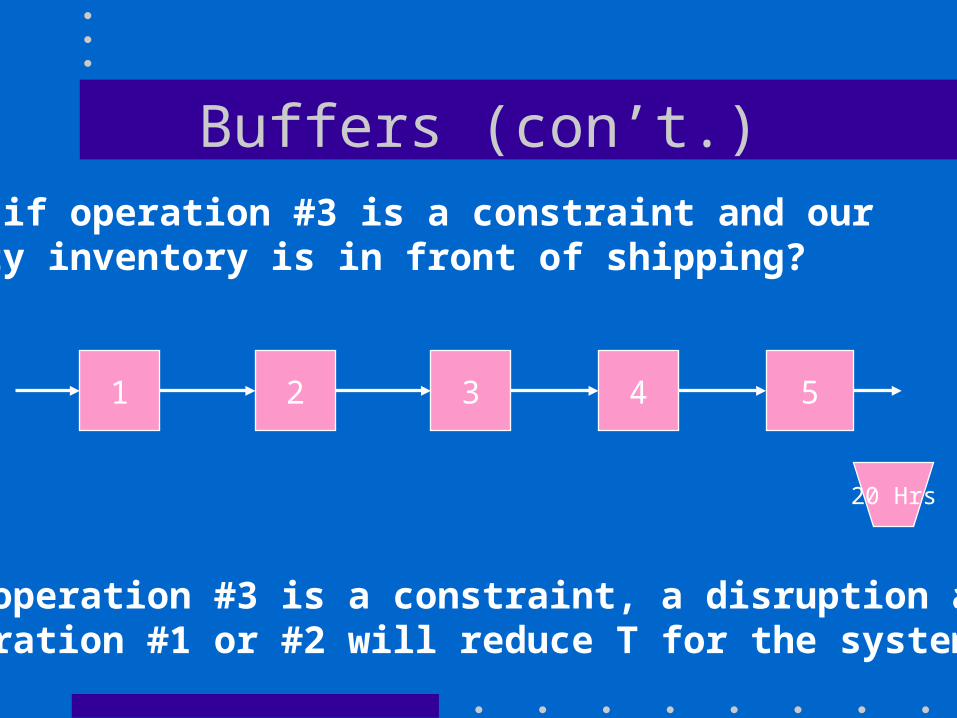
Buffers (con’t.)
1 2 3 4 5
20 Hrs
What if operation #3 is a constraint and our safety inventory is in front of shipping?
If operation #3 is a constraint, a disruption atoperation #1 or #2 will reduce T for the system
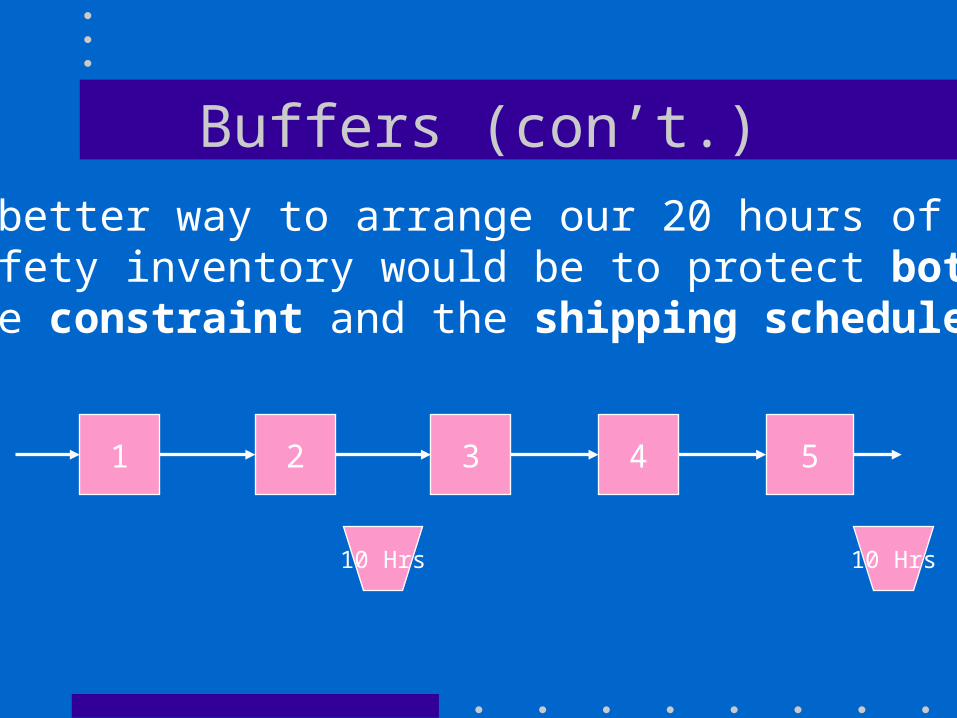
Buffers (con’t.)
1 2 3 4 5
10 Hrs
A better way to arrange our 20 hours of safety inventory would be to protect both the constraint and the shipping schedule:
10 Hrs
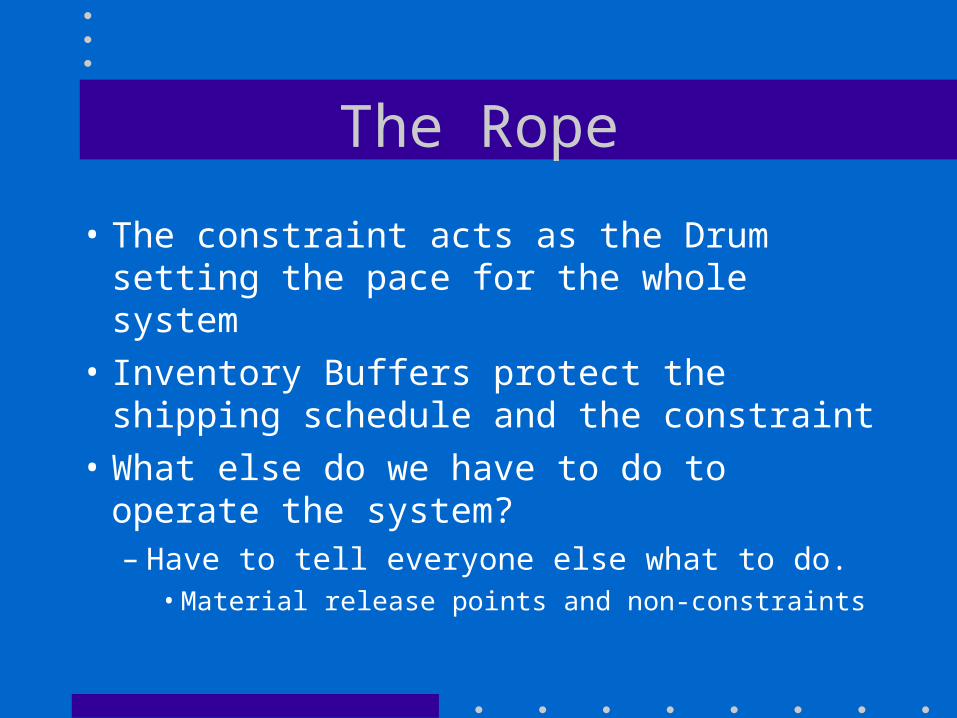
The Rope
• The constraint acts as the Drum setting the pace for the whole system
• Inventory Buffers protect the shipping schedule and the constraint
• What else do we have to do to operate the system?– Have to tell everyone else what to do.
• Material release points and non-constraints
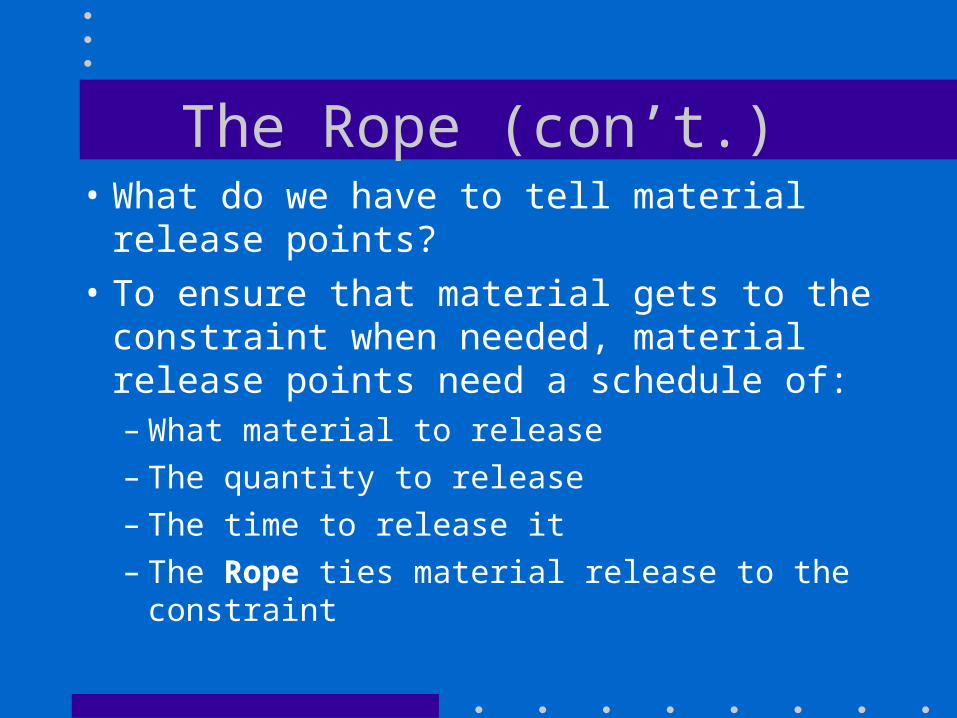
The Rope (con’t.)• What do we have to tell material release
points?
• To ensure that material gets to the constraint when needed, material release points need a schedule of:– What material to release
– The quantity to release
– The time to release it
– The Rope ties material release to the constraint
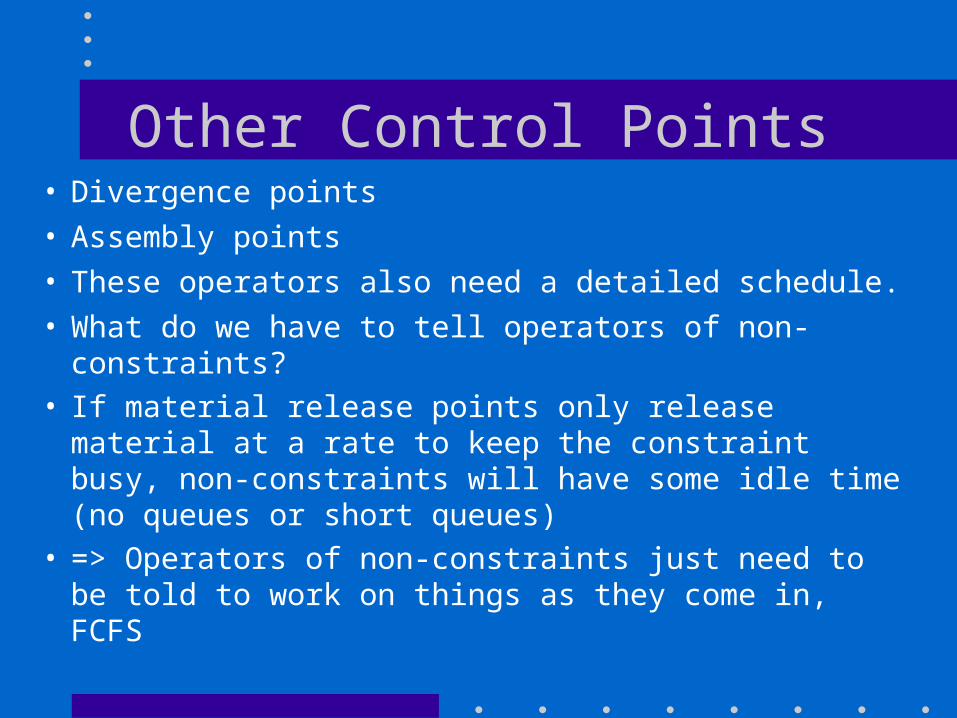
Other Control Points• Divergence points
• Assembly points
• These operators also need a detailed schedule.
• What do we have to tell operators of non-constraints?• If material release points only release material at a rate
to keep the constraint busy, non-constraints will have some idle time (no queues or short queues)
• => Operators of non-constraints just need to be told to work on things as they come in, FCFS