Embed Size (px)
Citation preview
Introduction to the Process of Science
September 9, 2008
What are we doing today?
• Example: Why Humans have abnormally large heads
• Scientific paper as syllogism• Introduction to correlation in Microsoft Excel• GPS and depression data• Homework
My first Experience with the Process of Science
• My first year of graduate school I was handed a project– initially I was happy to have my own project.– Given my envy of the harder sciences I was happy
to be working on the learning processes of the organism Aplysia Californica (a.k.a. the california sea hare).
– I was in essence in charge of my own wet lab.
Reality Hit
• I didn’t really care about the learning mechanisms of the California Sea Hare
• I didn’t have the type of talent it takes to run my own wet lab. – I am not good at paying attention to detail when I
don’t care about what I’m working on.
• Although I had some funding it wasn’t nearly enough to do a good job.
Inspiration Hits• One day I was reading a book called The Mating Mind
– Why humans have abnormally large brains• In the background I was listening to NPR
– Some guy was talking about the ice ages and the variability which defines the
• My project on the California Sea Hare was about how variable environments should produce adaptations which increase plasticity – Theoretically plastic behaviors should have a more complex neuronal
network underlying them than non-plastic behaviors• The AHA moment
– Variability during the Pleistocene/Quaternary (the Ice Ages) were variable
– This variability could have caused humans to evolve more complex neuronal architecture in order to support more plasticity
How do I test?
• First I need to start with measurement1. Climatic variability2. Brain complexity3. Both over evolutionary time
Climate Measures
• How is climate measured over time?– I ended up taking a few years of geology/paleo-
anthropology courses to find out.• Climate change is inferred through changes in the chemical
and structural makeup of soil, rock, sea beds, and ice strata.
• Half way through taking these courses I came to the conclusion that ice core data would be the most appropriate for my research question.
Why Ice Core Data?
• I am primarily interested in recent geologic history.– For this study, I don’t care about the Precambrian ,
Paleozoic, or even Mesozoic climate change.• I care about the late Pleistocene when our
ancestors were evolving.– Ice core data has strata which are deposited on a
yearly basis during the late Pleistocene– This is extremely high resolution data in geologic
terms.
What exactly am I measuring
• I am not measuring climate– What is climate?
• I am measuring the proportion of Oxygen 16 to Oxygen 18, and Hydrogen to Deuterium in air bubbles trapped in ice – What about these proportions has anything to do
with climate?– What about climate change over time?

Physics
• All of these chemicals are stable isotopes.– The relative proportion of each of them on Earth
is constant
• The proportion of each of these changes inside the ice sheets– The change in this proportion between the strata
is what is being measured.

More Physics• The lower in the Ice sheet a stratum is the older it
is.• The more oxygen 18 vs. oxygen 16 there is in a
stratum in comparison to another the colder it was at that time.– Water containing oxygen 16 is preferentially absorbed
into the atmosphere due to its lower atomic weight– The more oxygen 18 in the ice the less oxygen 16
there is in the ocean– The more water stored as ice on the Earth’s surface
the colder it was.
Measuring Neuronal Complexity
• Here I was lazy and couldn’t think of a better way to do it.
• The best I could do was go to the fossil record and use the size of our ancestor’s cranial cavity.

Scientific Papers are a Syllogism
• Syllogism- All men are mortal, Socrates is a man, therefore Socrates is mortal.
• Scientific papers are special kinds of syllogisms.– The introduction and methods contain your major
premises.• All men are mortal
– The results are your minor premises• Socrates is a man.
– Discussion section contains the conclusion• Socrates is mortal.
My Syllogism• Major Premises– Introduction-We have theoretical reasons to believe that
the evolution of human cranial capacity was causally influenced by climatic variability.
– Methods- Collected climatic variability data and cranial capacity data
• Minor Premises– Results- Correlation between climatic variability variable
and cranial capacity variable• Conclusion- This pattern in the data support a climatic
variability hypothesis when it comes to the evolution of human cranial capacity.
Today’s Syllogism
• Major Premises –– Introduction- According to current theory
depressed people should stay at home more often and for longer periods of time than non or less-depressed people
– Methods- • Measures- Beck Depression Inventory scores.• GPS tracking data.
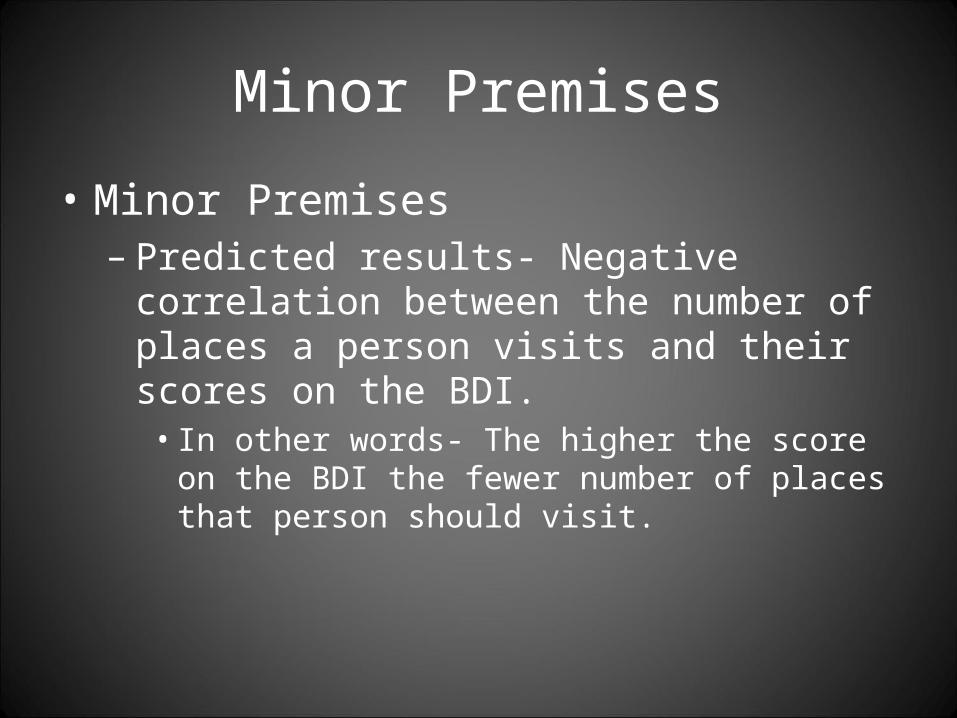
Minor Premises
• Minor Premises– Predicted results- Negative correlation between
the number of places a person visits and their scores on the BDI.• In other words- The higher the score on the BDI the
fewer number of places that person should visit.
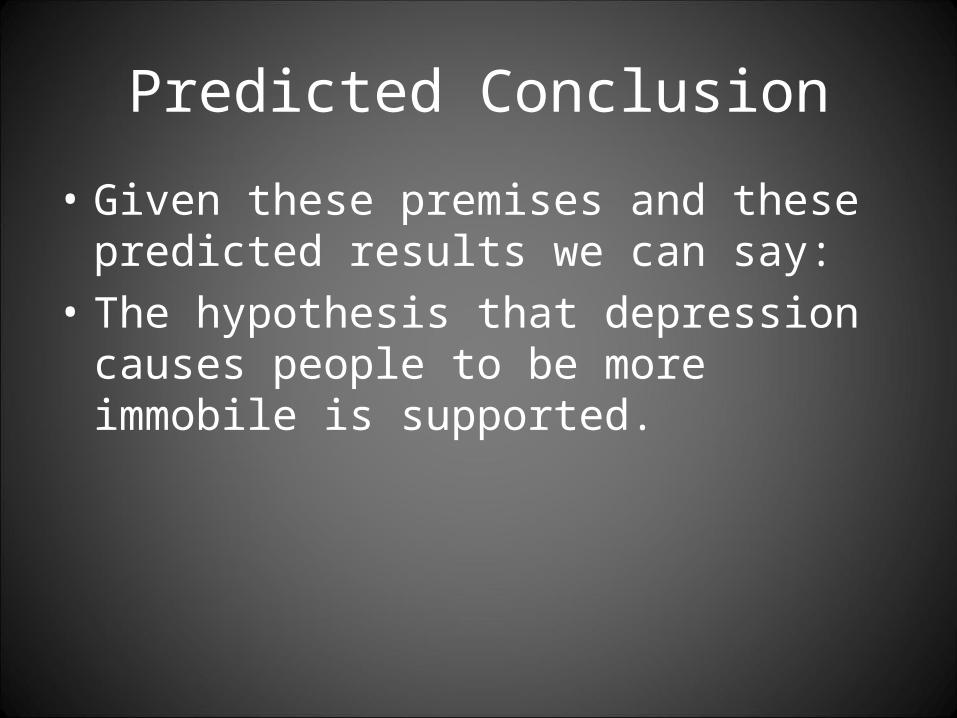
Predicted Conclusion
• Given these premises and these predicted results we can say:
• The hypothesis that depression causes people to be more immobile is supported.
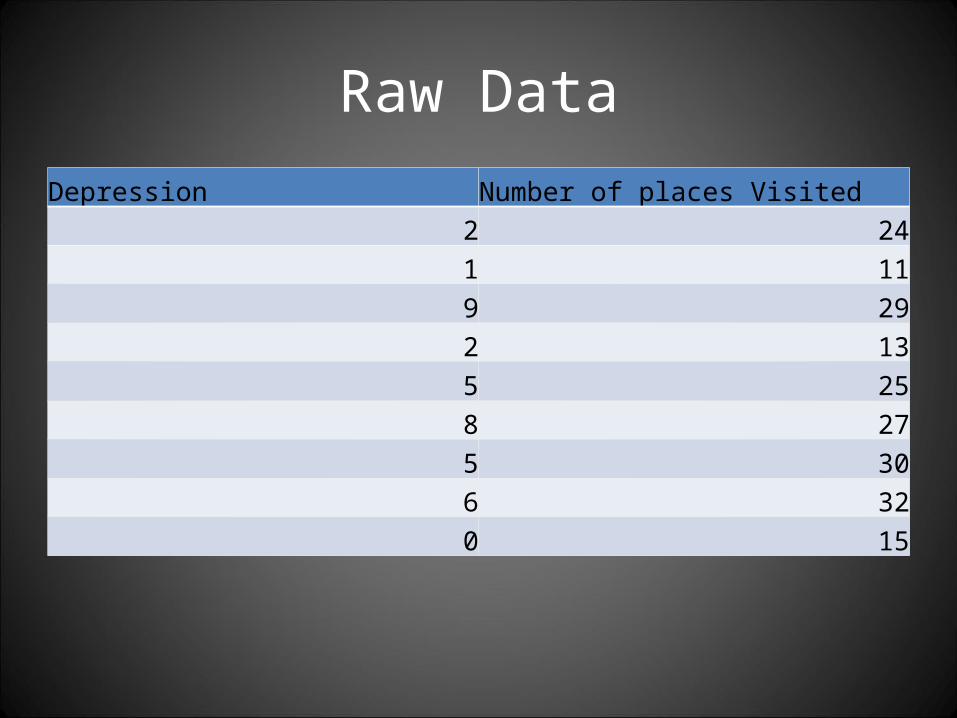
Raw DataDepression Number of places Visited
2 241 119 292 135 258 275 306 320 15

Calculating a Correlation
• Open Microsoft Excel.• Enter the following pages raw data
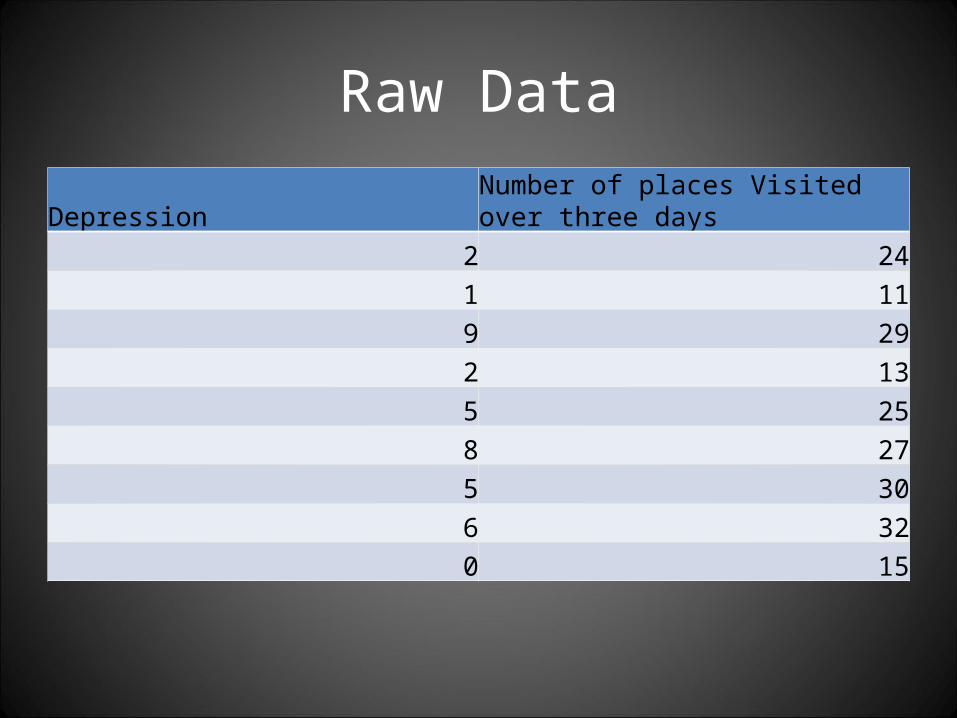
Raw Data
Depression Number of places Visited over three days
2 241 119 292 135 258 275 306 320 15

Calculating a Correlation• Open Microsoft Excel.• Enter the following pages raw data• After entering the raw data type the following in
an empty cell: =correl(• Then highlight all the numbers which make up
the depression variable.– =CORREL(A2:A10
• Now enter a “ ,” and then highlight the number of places visited variable, and close the parenthesis.-=CORREL(A2:A10, B2:B10)

Let’s Plot the Data

What about our syllogism
• The minor premise does not match our data.• In fact it contradicts what we found in our
data.• This is why we do science instead of pure
logic.• We connect our logic to the real world in
order to test it.• What do we put into our conclusion?
Your assignment
• By midnight next Monday I want a writing sample from you.
• You will write a discussion section for the analysis we just did.
More Instructions
• In this discussion section I want you to start with our major premises.
• Then write about our minor premises– Both our predicted and observed results
• From these I want more than one conclusion.– Support of alternative hypotheses:• The major premises are wrong• The measurement sucks
– The bdi doesn’t measure depression• Whatever, be creative.