Embed Size (px)
Citation preview

Introduction to MTPredictor Page 1
Trade at your own risk. There is risk of loss when trading speculative markets. This document is for information and educational purposes only and should not be considered trading recommendations. You should seek appropriate advice from your broker, or licensed
investment advisor, before taking any action. All trading decisions are your own sole responsibility, and MTPredictor or S. E. Griffiths or anybody working with MTPredictor Ltd cannot be held responsible for any losses that are incurred as a result. Past performance is no
guarantee of future results. © MTPredictor - www.MTPredictor.com 2001 - 2018.
Introduction to MTPredictor
By: Steve Griffiths, MTPredictor developer April 2018
Welcome to this introduction to MTPredictor, where I would like to take a look at the automatic routines and advanced manual tools that are available for you in the MTPredictor software. Throughout this document, I will be using examples from MTPredictor 8 and the MTP RT add-ons for NinjaTrader 8. But first I would like to remind you all that there is risk in trading, losses can and will happen as such I need to start with our Risk Disclaimer: Risk Disclaimer and Disclosure. Trade at your own risk. The information provided here is of the nature of a general comment only and neither purports nor intends to be, specific trading advice. It has been prepared without regard to any particular person's investment objectives, financial situation and particular needs. Information should not be considered as an offer or enticement to buy, sell or trade. You should seek appropriate advice from your broker, or licensed investment advisor, before taking any action. Hypothetical or simulated performance results have certain inherent limitations. Unlike an actual performance track record, simulated results do not represent actual trading. Also, since the trades have not actually been executed, the results may have under or over compensated for the impact of certain market factors, such as the lack of liquidity. Simulated training programs in general are also subject to the fact that they are designed with the benefit of hindsight. No representation is being made that any account will or is likely to achieve profitable trades similar to those shown. All trades shown in this document are hypothetical, they were not executed. They are just shown for illustration and training purposes only. There is risk of loss in trading and investing. All trade decisions are your own sole responsibility. In particular: I would like to stress that all trade decisions are your own sole responsibility. MTPredictor is not a Black Box System to be followed blindly, each Trader must take responsibility for deciding on whether their own Analysis is clear and fits in with their own (personal and unique) Trading Plan. OK, now we can move on, before we start looking at what MTPredictor can do for you, I would like to give a quick introduction and discuss what successful trading involves and, more importantly, does not involve… Continued on the next page……………

Introduction to MTPredictor Page 2
Trade at your own risk. There is risk of loss when trading speculative markets. This document is for information and educational purposes only and should not be considered trading recommendations. You should seek appropriate advice from your broker, or licensed
investment advisor, before taking any action. All trading decisions are your own sole responsibility, and MTPredictor or S. E. Griffiths or anybody working with MTPredictor Ltd cannot be held responsible for any losses that are incurred as a result. Past performance is no
guarantee of future results. © MTPredictor - www.MTPredictor.com 2001 - 2018.
Introduction The concept behind successful trading is relatively simple: it is about making money. As we all know, trading involves making both profits and losses. So, put bluntly, all you have to do to make money (over time) is to put more money into your trading account (from profits) than you take out (from losses). Sounds simple, doesn’t it...? One of the most common approaches to this is using technical analysis, which tries to predict or forecast where a market will be at some point in the future. The idea is that if you know where a market is headed, then you can profit from that movement, However, and it is a big however, what most analysts do not fully appreciate is that the future is uncertain and, again put bluntly, trying to “forecast” the future is not as reliable as most software vendors or gurus would have you believe. Also, because the future has not happened yet, how it unfolds is out of your control. This is why trading is often called speculation because it involves speculating on an uncertain future outcome. Gambling, in other words… So why do I put such a negative slant on all this? Well over 95% - 97% of amateur traders fail in this business and the main reason is that they go after the wrong thing – mostly the unachievable desire to predict the future - and work with something that is out of their control. So is there a better way? Yes, and this is the approach most successful professional traders take. Most successful professional traders realise that it is useless pursuing something that is out of their control, so they focus on what they can control - the initial risk on their trades. Correctly done, this keeps their losses (which do happen) small and under control. If you remember from earlier, I said that to be successful you must take out of your account (by the way of losses) less than you put in (by the way of profits). Well, keeping the initial risk small achieves this first part – in other words, keeping your losses small. Professional traders also employ trade management strategies that maximise their profits on their good trades. This is the second part of the equation – large profits. They do this by letting their successful trades run. But what most amateurs do not realise is that to do this they do not need to forecast the future or predict anything – professionals simply employ good trade management strategies that let markets unfold naturally and make the most of what the market gives them. This is a very important lesson. When you ask a professional trader where they think the market will go they say “I have no idea”. All the professional trader is interested in is what he or she can control and that is their initial risk on the trade and then their trade management strategy. They have no desire to waste their time on something that they cannot control – the future. Compare this with the losing amateur, who is always desperately seeking what will happen tomorrow or next week. I wish I had a dollar for each amateur trader who thought they knew where a market would go, so felt that they had no need for stops or trade management to protect profits. This is why most amateurs lose…they think they can control the future and, as such, do not control their losses and maximise their profits…

Introduction to MTPredictor Page 3
Trade at your own risk. There is risk of loss when trading speculative markets. This document is for information and educational purposes only and should not be considered trading recommendations. You should seek appropriate advice from your broker, or licensed
investment advisor, before taking any action. All trading decisions are your own sole responsibility, and MTPredictor or S. E. Griffiths or anybody working with MTPredictor Ltd cannot be held responsible for any losses that are incurred as a result. Past performance is no
guarantee of future results. © MTPredictor - www.MTPredictor.com 2001 - 2018.
Okay, let’s look at how MTPredictor can help you. Basically each trader must be able to answer 4 key questions:
• How to find a trade
• How to assess the Risk/Reward
• How to determine the Position Size
• How to manage the trade MTPredictor has been designed to help you answer these questions. First, this comes by way of the standard and automatic trade set-ups that are included in the software MTPredictor can be broken down into two main sections, the first is for the standard (or those new to MTPredictor) traders and then advanced. The reason we divide MTPredictor into two sections like this, is so we can give people who are new to the software an easy way into the software, this allows you to get used to what the software can do and introduces the Risk/ Reward concepts behind the software. Then, as you become more experienced we can move you up to higher levels and such start to use the more advanced features of the software. This is where you will fully appreciate the true power of the software! OK, let’s start with the first section, for the standard trader, where we have the 6 main automatic trade set-ups: the TS1, TS2, TS3, TS4, DP and VS, of which the TS1, TS3 and TS4 also have a Wave 3 variation. Please also see the section in a few pages time on the Cyclical nature of Trading. Although the software has automatic signals, they are not to be followed blindly – they are there to alert you to a potential trade setup, they need to be filtered with the larger degree trend and then must fit in with your own (personal) trading style and risk tolerance. Once you are comfortable with the automatic routines in the software we can start to take things to higher level. The first advanced concept (and probably the most important), is how to use MTPredictor on multiple frames. In other words, we start to use the higher time frame chart to filter our trades. The reason we do this is that now you are more experienced we can use leading tools (like our DP) to anticipate in advance areas of larger degree support and resistance. There is a lot more that very experienced users can do with the software, above and beyond the automatic set-ups – this is taught in our regular Training Room session for MTPredictor customers. Continued on the next page………………….

Introduction to MTPredictor Page 4
Trade at your own risk. There is risk of loss when trading speculative markets. This document is for information and educational purposes only and should not be considered trading recommendations. You should seek appropriate advice from your broker, or licensed
investment advisor, before taking any action. All trading decisions are your own sole responsibility, and MTPredictor or S. E. Griffiths or anybody working with MTPredictor Ltd cannot be held responsible for any losses that are incurred as a result. Past performance is no
guarantee of future results. © MTPredictor - www.MTPredictor.com 2001 - 2018.
Which markets and timeframes can you trade? The answer is basically everything, as long it is a liquid market that is actively traded and has clear, simple swings. The market or timeframe must not be too choppy. We have customers who trade on daily and weekly charts as well as 3min, 5min, 15min and sometimes even very short-term 1min charts (although this is reserved for only the most experienced trader) The choice of timeframe depends on your market of choice and your experience as a trader. For example, anyone new to day-trading is not advised to go shorter than a 5min chart on, say, index futures. But if you are more experienced and good at what you do, then some good profits can be made on 1, 2 and 3 min charts, but again only when you have a good, clear and clean setup. The main exception to this is Forex. Because Forex charts can be choppy on the shorter timeframes, but this depends on your data vendor, as such, we suggest common sense, if your short-term charts are choppy, then use a longer time frame, for example 15min or 60min. Stocks can be in a similar position. Only consider the very short timeframes on the few most liquid stocks in the major markets - the rest should be traded on slightly longer timeframes. Please study your local markets and look at different timeframes, then use common sense. If the chart and timeframe have simple, clean swings…then trade it. If it is very choppy with lots of whipsaws…then avoid it. This is pure common sense. Again, we have customers trading on virtually every market in the world, from futures through stocks to Forex, from India through the Middle East, Australia, and Europe to the USA. It does not matter, as long as your chosen market (and timeframe) is liquid, has good volume and makes clear, clean swings, and then it can be traded with MTPredictor … Continued on the next page……………

Introduction to MTPredictor Page 5
Trade at your own risk. There is risk of loss when trading speculative markets. This document is for information and educational purposes only and should not be considered trading recommendations. You should seek appropriate advice from your broker, or licensed
investment advisor, before taking any action. All trading decisions are your own sole responsibility, and MTPredictor or S. E. Griffiths or anybody working with MTPredictor Ltd cannot be held responsible for any losses that are incurred as a result. Past performance is no
guarantee of future results. © MTPredictor - www.MTPredictor.com 2001 - 2018.
Cyclical Nature of Trading Many people say that Markets are random, while technical analysis implies some level of order and predictably. So, which is correct? Well, both, in reality, markets go through Cycles where about 50% of the time the pattern is clear, and as such we can perform analysis, but also about 50% of the time, the markets are random, and the pattern is unclear so any form of analysis is unreliable. This is why so many purely mechanical trading systems do not do well over time, because they try to trade all of the time and fail to take account of the underlying cycles in the markets. What does this mean for using MTPredictor? My advice is to only look to trade when the pattern is clear, and clear to you. In reality all of you are different, all of you will have different levels of experience and different levels of risk tolerance. As such you should only trade when the picture is clear to you. In reality this will only be part of the time. The other part, you should have the patience and discipline to either wait for the picture to become clear or look to another market and time frame. This means that MTPredictor should not be treated as a mechanical black box system where you look to take all the signals all of the time. The signals are there to alert you to a potential trade setup, that needs to be filtered with the larger degree trend and then must fit in with your own (personal) trading style and risk tolerance. In other words, MTPredictor is a tool box that allows you to find, then assess potential trade setups, with the view to controlling your initial risk (keeping losses small) and maximising your Profits. Isolation Approach to Elliott Wave Analysis Because the market Pattern is only clear about 50% of the time, this lead onto me developing my own unique approach to Elliot Wave Analysis, where we look at the market pattern in isolation. In other words, we do not try and place an Elliott Wave count on the chart all the time. I believe that this is the reason standard (or traditional) Elliott Wave Analysis falls down and fails to work so often. As such MTPredictor only calculates its Elliott Wave patterns (and automatic setups) in isolation, in other words it does not try and fit in the current pattern with what has come before. Please remember, we are only ever using Analysis (both automatic and manual) to uncover and then evaluate a potential trade setup. Trying to project the future does not work and is a fruitless exercise, the main reason is that markets are cyclical so no sooner than you have a good pattern, the markets go out of phase and your projections become meaningless. You cannot control the future, it is far better to work with what you can control, which is the current setup, the entry and stop levels, in other words your initial risk. Continued on the next page………….

Introduction to MTPredictor Page 6
Trade at your own risk. There is risk of loss when trading speculative markets. This document is for information and educational purposes only and should not be considered trading recommendations. You should seek appropriate advice from your broker, or licensed
investment advisor, before taking any action. All trading decisions are your own sole responsibility, and MTPredictor or S. E. Griffiths or anybody working with MTPredictor Ltd cannot be held responsible for any losses that are incurred as a result. Past performance is no
guarantee of future results. © MTPredictor - www.MTPredictor.com 2001 - 2018.
Contents Section 1 - Automatic trade set-ups for Standard Traders
• TS3, general ABC correction
• TS1, abc as part of Elliott Wave 2 correction
• TS2, abc as part of Elliott Wave 4 correction
• TS4, larger-degree ABC correction (uses fewer earlier swings)
• DP (Decision Point), trend termination
• [VS] (High Volume Spike)
• [W3] (Wave 3)
• Losses
• MTPTrend – Larger degree trend Section 2 - Advanced Analysis
• Using the higher time frame Charts
• Manual Elliott Wave Tool
• Manual WPT (Wave Price Targets) Tool
• Manual Analysis using the Risk/Reward Tool Section 3 - Other Topics
• Trade management
• History Signals
• Position Sizing
• Do you have to be right to make money (% of winners)?
• Summary Okay, on to the individual sections now … Continued on the next page …

Introduction to MTPredictor Page 7
Trade at your own risk. There is risk of loss when trading speculative markets. This document is for information and educational purposes only and should not be considered trading recommendations. You should seek appropriate advice from your broker, or licensed
investment advisor, before taking any action. All trading decisions are your own sole responsibility, and MTPredictor or S. E. Griffiths or anybody working with MTPredictor Ltd cannot be held responsible for any losses that are incurred as a result. Past performance is no
guarantee of future results. © MTPredictor - www.MTPredictor.com 2001 - 2018.
Section 1 – Automatic trade Set-ups TS3 automatic trade set-up The TS3 automatic trade set-up is based on an ABC (3-swing) correction to the prior impulsive move. It does not matter whether the correction is down or up, for example against a prior upswing or a prior downswing - the approach is exactly the same. Let’s take a look at an example:
In this example, the market was moving up, then made a 3-swing (ABC) correction to reverse right at one of the coloured WPT (Wave Price Target) support zones (orange coloured rectangles on the chart above), where a blue (buy) reversal bar unfolded. This suggested that the ABC correction was over and signalled a new long trade. Once complete, the prior trend normally resumes, which meant a continued move to new highs in this example. As you can see, this would have allowed you to enter a new long trade just as the correction was ending, to take full advantage of a possible rally. Specifically, the initial risk on the trade (how much you would lose if the trade went wrong) was small in relation to the potential profit on the trade. This is a very important point and one I will go into more detail later…
Introduction to MTPredictor Page 8
Trade at your own risk. There is risk of loss when trading speculative markets. This document is for information and educational purposes only and should not be considered trading recommendations. You should seek appropriate advice from your broker, or licensed
investment advisor, before taking any action. All trading decisions are your own sole responsibility, and MTPredictor or S. E. Griffiths or anybody working with MTPredictor Ltd cannot be held responsible for any losses that are incurred as a result. Past performance is no
guarantee of future results. © MTPredictor - www.MTPredictor.com 2001 - 2018.
The important points to check before trade entry:
• The reversal is at one of our price support/resistance areas (we call these WPTs, Wave Price Targets).
• There is a good Risk/Reward at the first profit target (the software will calculate this automatically for you). Ideally, we are looking for a minimum of 2:1.
• The trade is in the direction of the larger-degree trend. Advanced Traders can use DP and/or WPT levels on the higher time frame chart.
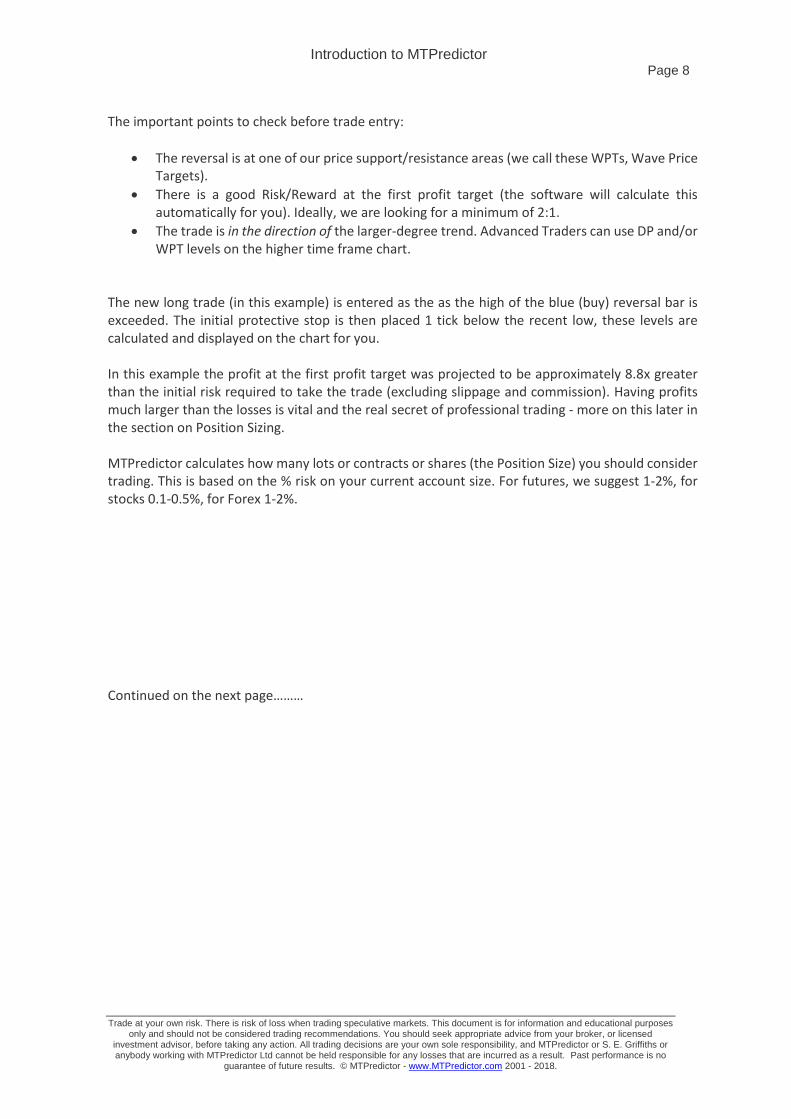
The new long trade (in this example) is entered as the as the high of the blue (buy) reversal bar is exceeded. The initial protective stop is then placed 1 tick below the recent low, these levels are calculated and displayed on the chart for you. In this example the profit at the first profit target was projected to be approximately 8.8x greater than the initial risk required to take the trade (excluding slippage and commission). Having profits much larger than the losses is vital and the real secret of professional trading - more on this later in the section on Position Sizing. MTPredictor calculates how many lots or contracts or shares (the Position Size) you should consider trading. This is based on the % risk on your current account size. For futures, we suggest 1-2%, for stocks 0.1-0.5%, for Forex 1-2%. Continued on the next page………

Introduction to MTPredictor Page 9
Trade at your own risk. There is risk of loss when trading speculative markets. This document is for information and educational purposes only and should not be considered trading recommendations. You should seek appropriate advice from your broker, or licensed
investment advisor, before taking any action. All trading decisions are your own sole responsibility, and MTPredictor or S. E. Griffiths or anybody working with MTPredictor Ltd cannot be held responsible for any losses that are incurred as a result. Past performance is no
guarantee of future results. © MTPredictor - www.MTPredictor.com 2001 - 2018.
Once in a new trade, we move onto trade management:
Once the trade reaches the initial target we then look at how strong the current swing is. For this we see whether the MTPTrend indicator has exceeded its strength band. If it has not (as in this example) we assume the market is weak and we should come out at the first profit target, banking a Profit of +8.8R in this example. Or if the market was strong (the MTPTrend had exceeded its strength band) we would trail with our ATRStop indicator. Summary - TS3 automatic trade set-up The important points to note for the TS3 trade set-up are:
• The reversal is at one of our WPT support/resistance areas
• There is a good Risk/Reward at the first profit target, ideally a minimum of 2:1
• The trade is in the direction of the larger-degree trend. Advanced Traders can use DP and/or WPT levels on the higher time frame chart).
• Once the first Profit target has been reached, then manage the trade accordingly based on whether the MTPTrend Indicator is strong or weak.

Introduction to MTPredictor Page 10
Trade at your own risk. There is risk of loss when trading speculative markets. This document is for information and educational purposes only and should not be considered trading recommendations. You should seek appropriate advice from your broker, or licensed
investment advisor, before taking any action. All trading decisions are your own sole responsibility, and MTPredictor or S. E. Griffiths or anybody working with MTPredictor Ltd cannot be held responsible for any losses that are incurred as a result. Past performance is no
guarantee of future results. © MTPredictor - www.MTPredictor.com 2001 - 2018.
TS1 automatic trade set-up The TS1 trade set-up is similar to the TS3 in that we are still looking for an ABC correction, but the difference is that the abc correction in the TS1 trade set-up is on a smaller degree. In essence, it catches a similar trade set-up to the TS3 we just saw but with a smaller (lesser-degree) abc pattern. Also, the minor abc correction unfolds early in a new trend. Let’s look at an example:
Summary - TS1 automatic trade set-up The important points to check before trade entry for the TS1 trade set-up are:
• The reversal is at one of our price support/resistance areas (WPTs, Wave Price Targets).
• There is a good Risk/Reward at the first profit target, (the software will calculate this automatically for you). Ideally, we are looking for a minimum of 2:1
• The trade is in the direction of the larger-degree trend. Advanced Traders can use DP and/or WPT levels on the higher time frame chart.

Introduction to MTPredictor Page 11
Trade at your own risk. There is risk of loss when trading speculative markets. This document is for information and educational purposes only and should not be considered trading recommendations. You should seek appropriate advice from your broker, or licensed
investment advisor, before taking any action. All trading decisions are your own sole responsibility, and MTPredictor or S. E. Griffiths or anybody working with MTPredictor Ltd cannot be held responsible for any losses that are incurred as a result. Past performance is no
guarantee of future results. © MTPredictor - www.MTPredictor.com 2001 - 2018.
Once the Trade moves in your favour, you can move onto trade management, which is the same as for the TS3 setup, which we covered in the last example
As with the TS3 setup, once the trade reaches the initial target we then look at how strong the market is. For this we see whether the MTPTrend indicator has exceeded its strength band. If it has not (as in this example) we assume the market is weak and we should come out at the first profit target, banking a Profit of +2.4R in this example. We will look in more detail later in this document about when to use the ATRStop to run Profits, as well as looking in more depth at Position Sizing. Now onto the TS2 set-up. Continued on the next page……………………….

Introduction to MTPredictor Page 12
Trade at your own risk. There is risk of loss when trading speculative markets. This document is for information and educational purposes only and should not be considered trading recommendations. You should seek appropriate advice from your broker, or licensed
investment advisor, before taking any action. All trading decisions are your own sole responsibility, and MTPredictor or S. E. Griffiths or anybody working with MTPredictor Ltd cannot be held responsible for any losses that are incurred as a result. Past performance is no
guarantee of future results. © MTPredictor - www.MTPredictor.com 2001 - 2018.
TS2 automatic trade set-up The TS2 trade set-up is similar to the TS1 in that we are still looking for a minor abc correction, but the difference is that the abc correction in the TS2 trade set-up unfolds later in the trend. For the Elliott Wave experts among you, this is in a Wave (4) type correction. Let’s take a look at an example:
I have added the Elliott Wave labels on the chart for the Elliott Wave experts. For everyone else, there is no need to worry about this…all you need to know is, how do you trade it? The approach is the same as with the TS1 and TS3 trade set-up… Continued on the next page…

Introduction to MTPredictor Page 13
Trade at your own risk. There is risk of loss when trading speculative markets. This document is for information and educational purposes only and should not be considered trading recommendations. You should seek appropriate advice from your broker, or licensed
investment advisor, before taking any action. All trading decisions are your own sole responsibility, and MTPredictor or S. E. Griffiths or anybody working with MTPredictor Ltd cannot be held responsible for any losses that are incurred as a result. Past performance is no
guarantee of future results. © MTPredictor - www.MTPredictor.com 2001 - 2018.
Summary - TS2 automatic trade set-up The important points to check before trade entry for the TS2 trade set-up are:
• The reversal is at one of our WPT price support/resistance areas.
• There is a good Risk/Reward at the first profit target, ideally a minimum of 2:1.
• The trade is in the direction of the larger-degree trend.
In this example, the long trade was entered as the high of the blue (buy) bar was exceeded. The initial protective stop was then placed 1 tick below the recent low. These levels are automatically displayed on the chart for you, along with the number of lots, shares or contracts to trade (The Position Size), in a similar way to the TS3 and TS1 automatic trade set-ups… As you can see, this TS2 sell set-up met all of these initial criteria. In fact the market rallied into the initial projected profit target where a profit of approximately 4.4x the initial risk (excluding slippage and commission) was available (see chart above). Okay, now on to the next set-up, the TS4.

Introduction to MTPredictor Page 14
Trade at your own risk. There is risk of loss when trading speculative markets. This document is for information and educational purposes only and should not be considered trading recommendations. You should seek appropriate advice from your broker, or licensed
investment advisor, before taking any action. All trading decisions are your own sole responsibility, and MTPredictor or S. E. Griffiths or anybody working with MTPredictor Ltd cannot be held responsible for any losses that are incurred as a result. Past performance is no
guarantee of future results. © MTPredictor - www.MTPredictor.com 2001 - 2018.
TS4 automatic trade set-up The TS4 trade set-up is again based on a 3-swing (ABC) correction. In fact, it is very similar to a TS3 trade set-up as it uses the same degree of swing, however the difference is that the TS4 trade set-up does not look back to see the prior intermediate degree swing, so we have to use the major degree swings to judge whether it is corrective in relation to the prior pivots. Let’s take a look at an example on this Daily Chart of the EUR/USD:
Here the minor wiggles in the pattern earlier in the chart would have invalidated this as an automatic TS3 trade set-up, when the rally from the low has still unfolded in a 3-swing (ABC) pattern. This is the kind of pattern the automatic TS4 trade set-up is designed to find for you. Continued on the next page…………….

Introduction to MTPredictor Page 15
Trade at your own risk. There is risk of loss when trading speculative markets. This document is for information and educational purposes only and should not be considered trading recommendations. You should seek appropriate advice from your broker, or licensed
investment advisor, before taking any action. All trading decisions are your own sole responsibility, and MTPredictor or S. E. Griffiths or anybody working with MTPredictor Ltd cannot be held responsible for any losses that are incurred as a result. Past performance is no
guarantee of future results. © MTPredictor - www.MTPredictor.com 2001 - 2018.
Here we can see that the Wave C pivot (TS4 set-up) fell below (for a short trade) the prior main high. Reverse for a long trade, so the ABC swing was still corrective in relation to the prior major swing:
In this way, the 3-swing (ABC) pattern is correcting the prior downswing because the whole correction ends below the start of the prior decline. This high is circled in the chart above. Can you see how the Wave C (TS4 set-up) is below this prior main low? There is no need to worry about this, because the software will do all of this for you. Continued on the next page …

Introduction to MTPredictor Page 16
Trade at your own risk. There is risk of loss when trading speculative markets. This document is for information and educational purposes only and should not be considered trading recommendations. You should seek appropriate advice from your broker, or licensed
investment advisor, before taking any action. All trading decisions are your own sole responsibility, and MTPredictor or S. E. Griffiths or anybody working with MTPredictor Ltd cannot be held responsible for any losses that are incurred as a result. Past performance is no
guarantee of future results. © MTPredictor - www.MTPredictor.com 2001 - 2018.
So, now the software has confirmed that the TS4 trade set-up is corrective, you now need to check that the reversal is at one of our price support/resistance areas (WPTs, Wave Price Targets).
The short trade was entered as the low of the red (sell) bar was exceeded. The initial protective stop was then placed 3 pips (we use 3 full pips for Forex to give the market some more wiggle room, this can be changed in the software settings if you wish.) above the recent high. The initial profit target is the DP (Decision Point) from the prior main swing low. This is because we are assuming that once the ABC correction is complete, we should get at least a move to new lows (in this short example). Summary – TS4 automatic trade set-up The important points to check before trade entry for the TS4 trade set-up are:
• The reversal is at one of our WPT price support/resistance areas.
• There is a good Risk/Reward at the first profit target, ideally a minimum of 2:1.
• The trade is in the direction of the larger-degree trend.

Introduction to MTPredictor Page 17
Trade at your own risk. There is risk of loss when trading speculative markets. This document is for information and educational purposes only and should not be considered trading recommendations. You should seek appropriate advice from your broker, or licensed
investment advisor, before taking any action. All trading decisions are your own sole responsibility, and MTPredictor or S. E. Griffiths or anybody working with MTPredictor Ltd cannot be held responsible for any losses that are incurred as a result. Past performance is no
guarantee of future results. © MTPredictor - www.MTPredictor.com 2001 - 2018.
DP automatic trade set-up The DP automatic trade set-up is designed to catch the end of an impulsive move as the impulsive trend runs out of steam:
The basic ingredients here are that the market is making a strong impulsive swing, and then makes a correction to the prior impulsive swing, followed by another weaker swing to new price extremes. However, this new price extreme is not supported by the MTPtrend oscillator as the MTPTrend peaks diverge from the price peaks on the main chart. This is standard divergence as taught in general technical analysis books… However, the important addition that we at MTPredictor have made is the price level - where this second price extreme is most likely to reverse. This is the DP (Decision Point) level – the light blue zone in the chart above. This allows us to enter a trade with a small controlled risk to take advantage as the market starts to move in the opposite direction (new trend). Important: Because this is a trend termination setup, caution is advised. The reason is that you can get a few “false” attempts as the trend is ending. So my advice is that the DP setup is best used when you have added support / resistance from the higher time frame charts as well. This adds weight to the setup.

Introduction to MTPredictor Page 18
Trade at your own risk. There is risk of loss when trading speculative markets. This document is for information and educational purposes only and should not be considered trading recommendations. You should seek appropriate advice from your broker, or licensed
investment advisor, before taking any action. All trading decisions are your own sole responsibility, and MTPredictor or S. E. Griffiths or anybody working with MTPredictor Ltd cannot be held responsible for any losses that are incurred as a result. Past performance is no
guarantee of future results. © MTPredictor - www.MTPredictor.com 2001 - 2018.
The initial profit target for the DP set-up is the opposing DP level taken from the prior swing high:
This is the lower light blue zone in the 3min YM Chart above. As you can see, the Risk/Reward at this initial target was approximately 3.7x the initial risk. As you will know from earlier, we consider anything above 2:1 a good risk/reward. Summary - DP automatic trade set-up The important ingredients for a DP trade set-up are:
• The reversal is at the DP (Decision Point) support/resistance zone.
• There is divergence on the MTPTrend oscillator (the software calculates this for you).
• Good R/R (above 2:1) at the first profit target (the opposing DP level).
• Use caution as this is a trend termination setup -Always check the higher time frame for added confirmation that the current trend is indeed ending (DP and/or WPT levels on the higher time frame).
Continued on the next page …

Introduction to MTPredictor Page 19
Trade at your own risk. There is risk of loss when trading speculative markets. This document is for information and educational purposes only and should not be considered trading recommendations. You should seek appropriate advice from your broker, or licensed
investment advisor, before taking any action. All trading decisions are your own sole responsibility, and MTPredictor or S. E. Griffiths or anybody working with MTPredictor Ltd cannot be held responsible for any losses that are incurred as a result. Past performance is no
guarantee of future results. © MTPredictor - www.MTPredictor.com 2001 - 2018.
VS (Volume Spike) automatic trade set-up VS or Volume spike analysis is where we are looking for the market to make a break beyond an important psychological level on an high volume spike. This normally signals a continuation of the break, however if the market reverses immediately, it suggests that the professionals are in the opposite direction - this often leads to a strong reversal. This method is enhanced by using the DP to pinpoint the price level at which this reversal occurs. Let’s take a look at an example on a 5min chart of the ES:
Here we can see how the ES made a new swing low on high volume. But, rather than the decline continuing, the market found support right at our DP support level. This was the sign that an important low was in the process of unfolding but, even more important, this low was backed by professional buying as signalled by the failure of the high volume break to continue lower. Support at the DP level allows you to enter a new long trade with a small controlled risk. Continued on the next page………

Introduction to MTPredictor Page 20
Trade at your own risk. There is risk of loss when trading speculative markets. This document is for information and educational purposes only and should not be considered trading recommendations. You should seek appropriate advice from your broker, or licensed
investment advisor, before taking any action. All trading decisions are your own sole responsibility, and MTPredictor or S. E. Griffiths or anybody working with MTPredictor Ltd cannot be held responsible for any losses that are incurred as a result. Past performance is no
guarantee of future results. © MTPredictor - www.MTPredictor.com 2001 - 2018.
Here is the result:
The ES then rallied sharply, leaving this VS setup nailing the low of the day. The ES continued to rally into the close where a Profit of approximately 5x the initial risk (ignoring slippage and commission) required to take the trade. What I like about these types of trades is because initial setup is backed by Professional buying or selling, the resulting moves tend to be large. The reversal on a high volume (VS) spike at DP support / resistance is a favourite set-up of mine and works especially well on intraday charts, so is well worth keeping a close eye out for.... Summary - VS automatic trade set-up The important ingredients for a DP trade set-up are:
• The reversal is at the DP (Decision Point) support/resistance zone.
• Good R/R (above 2:1) at the first profit target (the opposing DP level).
• Because this setup is with the professional money very often they result in a large, and quick move.
Continued on the next page …

Introduction to MTPredictor Page 21
Trade at your own risk. There is risk of loss when trading speculative markets. This document is for information and educational purposes only and should not be considered trading recommendations. You should seek appropriate advice from your broker, or licensed
investment advisor, before taking any action. All trading decisions are your own sole responsibility, and MTPredictor or S. E. Griffiths or anybody working with MTPredictor Ltd cannot be held responsible for any losses that are incurred as a result. Past performance is no
guarantee of future results. © MTPredictor - www.MTPredictor.com 2001 - 2018.
[W3] or Wave 3 automatic trade set-up This is my personal favourite trade setup as it represents the best trade I know of because the Profits are usually very large in relation to the initial risk. In fact, this very setup was the main reason I developed MTPredictor in the first place over 18 years ago now! A Wave 3 setup is when a market makes a major high or low, which is followed by an initial decline or an initial rally, but then I am particularly interested to see how the pattern of the correction to this initial move from the high / low unfolds, if this is a minor abc then we could be looking at a Wave (2). Why is this important? After a Wave (2) correction is complete a market will normally make a Wave (3) swing, and because Wave (3) is usually the strongest and longest of all the Elliott Wave sequence, trading this swing represents the best and largest profit potential in relation to the smallest initial risk. So for me, this is the best trade you can find! This is not a new trade setup, W.D. Gann also said – “the best place to buy is on the initial correction after the start of the new trend”. In Elliott Wave terms, this is the end of the Wave (2). Let’s take a look at an example
Here we had a major low that was followed by an initial rally that was followed by an initial correction that sub divided into a lesser degree abc.

Introduction to MTPredictor Page 22
Trade at your own risk. There is risk of loss when trading speculative markets. This document is for information and educational purposes only and should not be considered trading recommendations. You should seek appropriate advice from your broker, or licensed
investment advisor, before taking any action. All trading decisions are your own sole responsibility, and MTPredictor or S. E. Griffiths or anybody working with MTPredictor Ltd cannot be held responsible for any losses that are incurred as a result. Past performance is no
guarantee of future results. © MTPredictor - www.MTPredictor.com 2001 - 2018.
In Elliott wave terms, we have a Wave (1) rally off a Major low, which was then followed by a Wave (2) correction, so what should we anticipate from here?
This is the exciting part, because now we should be anticipating a Wave (3) type swing: The reason this is so exciting is that the Wave (3) is usually the strongest and longest wave in any completed 5 wave sequence, that means it has the highest profit potential! Continued on the next page ….

Introduction to MTPredictor Page 23
Trade at your own risk. There is risk of loss when trading speculative markets. This document is for information and educational purposes only and should not be considered trading recommendations. You should seek appropriate advice from your broker, or licensed
investment advisor, before taking any action. All trading decisions are your own sole responsibility, and MTPredictor or S. E. Griffiths or anybody working with MTPredictor Ltd cannot be held responsible for any losses that are incurred as a result. Past performance is no
guarantee of future results. © MTPredictor - www.MTPredictor.com 2001 - 2018.
Lest take a look at the end result:
As you can see, the GBPUSD did indeed rally sharply from this low, reaching the Typical Wave 3 WPT target, where a profit of approximately +10R (excluding spread) was available. Or put another way, this turned an initial risk of approximately $384 (2% Risk on a $20,000 sample account) into a profit of approximately $3,966. This is why this is one of my favourite setups, not because it has a high % of winners, but when the winners come through their Profits can be much larger than the losses. The Wave 3 trade setup can unfold in 3 variations, the TS1[W3], TS3[W3] and the TS4[W3]. Summary – Wave 3 automatic trade set-up
• First we need an important high or low to unfold (Major swing in the software).
• Then we look for the initial decline or initial rally from this important high or low.
• Then we look for the initial correction to this initial decline (or rally) to unfold as a minor abc.
• Our target is then the Typical Wave 3 WPT.
• The software can calculate all of this for you.

Introduction to MTPredictor Page 24
Trade at your own risk. There is risk of loss when trading speculative markets. This document is for information and educational purposes only and should not be considered trading recommendations. You should seek appropriate advice from your broker, or licensed
investment advisor, before taking any action. All trading decisions are your own sole responsibility, and MTPredictor or S. E. Griffiths or anybody working with MTPredictor Ltd cannot be held responsible for any losses that are incurred as a result. Past performance is no
guarantee of future results. © MTPredictor - www.MTPredictor.com 2001 - 2018.
Losses Question – do all trades end up Profitable? Answer – of course not, any professional trader will know (and understand) that all trading comes with losses. But the trick to being successful over time is to keep the losses small and the Profits large. That is what MTPredictor are designed to do:
Here we can see a valid automatic TS3 sell setup on this Daily Chart of the British Pound (GBPUSD). But, as you can as you can see, the trade did not work out as anticipated and the trade was stopped out for a loss. But, the important point was that this loss was kept small at only -1R, or one risk unit, (more on this later). Keeping your losses small, while still retaining big Profits, is the key to long term trading success.

Introduction to MTPredictor Page 25
Trade at your own risk. There is risk of loss when trading speculative markets. This document is for information and educational purposes only and should not be considered trading recommendations. You should seek appropriate advice from your broker, or licensed
investment advisor, before taking any action. All trading decisions are your own sole responsibility, and MTPredictor or S. E. Griffiths or anybody working with MTPredictor Ltd cannot be held responsible for any losses that are incurred as a result. Past performance is no
guarantee of future results. © MTPredictor - www.MTPredictor.com 2001 - 2018.
MTPTrend oscillator - larger-degree trend So far we have looked at just the individual trade setups, but what about the larger degree trend, for these we have developed the MTPTrend indicator. This is calculated using our Major Pivots and then seeing where the market is in relation to DP support / Resistance zones using these Major Pivots Let’s take a look at an example:
Here we can see how the market declined into DP support (off the prior Major Low Pivot), support was found in this area, which was followed by a rally. The rally lasted until the market reached DP resistance (from the prior Major Swing High Pivot). The software then uses where the market is in relation to these Major DP support resistance zones to calculate the MTPTrend Indicator. As such the MTPTrend gives you guidance of the larger-degree trend. We have made this very easy to use – simply look at the colour of the oscillator (not whether it is above or below the 0 line). Blue is a strong uptrend, red is a strong downtrend, black is a flat or neutral trend where a reversal could be in the process of unfolding. Continued on the next page…………

Introduction to MTPredictor Page 26
Trade at your own risk. There is risk of loss when trading speculative markets. This document is for information and educational purposes only and should not be considered trading recommendations. You should seek appropriate advice from your broker, or licensed
investment advisor, before taking any action. All trading decisions are your own sole responsibility, and MTPredictor or S. E. Griffiths or anybody working with MTPredictor Ltd cannot be held responsible for any losses that are incurred as a result. Past performance is no
guarantee of future results. © MTPredictor - www.MTPredictor.com 2001 - 2018.
You can then consider trades that are in the direction of the MTPtrend Indicator, i.e. consider Buys when the Indicator is Blue and consider Sells when it is red. When the MTPTrend is black, the Market is at a DP support / Resistance zone so could be in the process of reversing, when this happens, you can consider both Buys and Sells. Because the prior trend could be about to reverse the preference should be for trades in the new trend direction.
In the example above you can see how this TS3 Buy setup was in the same direction as the blue MTPtrend Indicator. Continued on the next page………..

Introduction to MTPredictor Page 27
Trade at your own risk. There is risk of loss when trading speculative markets. This document is for information and educational purposes only and should not be considered trading recommendations. You should seek appropriate advice from your broker, or licensed
investment advisor, before taking any action. All trading decisions are your own sole responsibility, and MTPredictor or S. E. Griffiths or anybody working with MTPredictor Ltd cannot be held responsible for any losses that are incurred as a result. Past performance is no
guarantee of future results. © MTPredictor - www.MTPredictor.com 2001 - 2018.
This also means that you should avoid trades that are against the MTPTrend, ie avoid sells that are in an UpTrend, when the MTPTrend is blue, in the Chart below it would have helped you avoid what would have otherwise been two losing trades that were against the MTPTrend colour.
Please do remember that MTPredictor is not a “black box” system where all the setups are to be followed blindly. This is because of the Cyclical nature of Trading, which was covered at the start of this document. The automatic setups are best used when there is a clear picture (particularly on the higher time frame Chart) as well as being in the same direction as the MTPTrend colour. Summary – MTPTrend Oscillator
1. Use the MTPTrend colour for guidance of the larger-degree trend - blue is a strong uptrend, red is a strong downtrend, and black is a flat or neutral trend where a reversal could be in the process of unfolding.
2. It does not matter whether the oscillator is above or below 0, it is just it’s colour that we use.
Now onto the more advanced aspects of the MTPredictor software……. Continued on the next page…………………..

Introduction to MTPredictor Page 28
Trade at your own risk. There is risk of loss when trading speculative markets. This document is for information and educational purposes only and should not be considered trading recommendations. You should seek appropriate advice from your broker, or licensed
investment advisor, before taking any action. All trading decisions are your own sole responsibility, and MTPredictor or S. E. Griffiths or anybody working with MTPredictor Ltd cannot be held responsible for any losses that are incurred as a result. Past performance is no
guarantee of future results. © MTPredictor - www.MTPredictor.com 2001 - 2018.
Section 2 - Advanced Analysis In this section I would like to start to take you to higher levels with the MTPredictor software. Larger degree trend using the higher time frame chart In the first section (for standard traders) we used the colour of the MTPTrend indicator for guidance of the larger degree trend, however, as you become more experienced you can also start looking at the higher time frame charts to see whether there are times when you can overrule the MTPTrend colour on the current cart time frame by using the larger degree picture on the higher time frame chart. For this we can use more advanced tools in the software and the main one will be will be using is the manual DP. The DP (or decision point) tool is a leading indicator, in that it can project support and resistance zone in advance of the market reaching them. Let’s take a look at an example:
Here you can see we had a valid TS4 but setup on this 3min Chart of the ES, because it was in the same direction the blue MTPtrend Indicator, but it did not reach its first Profit Target. Let’s now look at the higher time frame chart to see whether there was any larger degree support and resistance that could have helped the more experienced user. The higher time frame chart would be a time frame between 3-5 time frames higher than the one you are trading on. So, for this 3min Chart, the higher time frame would be the 15min Chart. If you were on a 15min Chart, the higher time frame would be the 1hr, for a Daily Chart, the higher time frame would be the weekly Chart.

Introduction to MTPredictor Page 29
Trade at your own risk. There is risk of loss when trading speculative markets. This document is for information and educational purposes only and should not be considered trading recommendations. You should seek appropriate advice from your broker, or licensed
investment advisor, before taking any action. All trading decisions are your own sole responsibility, and MTPredictor or S. E. Griffiths or anybody working with MTPredictor Ltd cannot be held responsible for any losses that are incurred as a result. Past performance is no
guarantee of future results. © MTPredictor - www.MTPredictor.com 2001 - 2018.
So now let’s put on the 15min DP support zones and see what difference it makes.
Moving back to the 3min chart at the time of the automatic TS4 buy setup:

Introduction to MTPredictor Page 30
Trade at your own risk. There is risk of loss when trading speculative markets. This document is for information and educational purposes only and should not be considered trading recommendations. You should seek appropriate advice from your broker, or licensed
investment advisor, before taking any action. All trading decisions are your own sole responsibility, and MTPredictor or S. E. Griffiths or anybody working with MTPredictor Ltd cannot be held responsible for any losses that are incurred as a result. Past performance is no
guarantee of future results. © MTPredictor - www.MTPredictor.com 2001 - 2018.
Now we get a very different picture, where the market was now starting to decline off this 15min resistance zone, so the TS4 buy setup was no longer in a clear uptrend, it was against a possible new down trend. With this new information, the more experienced MTPredictor user could either avoid this buy setup or amend its trade management, for example moving the protective stop to break-even quicker, or looking to take Profits at a closer target (for example the DP from the minor Wave b swing high or low). In other words, we can now use the DP’s on the larger degree chart to give us larger degree support and resistance zones, these can then be used to gauge the larger degree trend direction. So does this mean that we should no longer use the MTPtrend colour by itself ? No, this is a very good Indicator that can help the less experienced user, mainly because it is easy to use (blue for up, red for down and black for flat) and works on the current time frame chart. The higher time frame analysis can help the more experienced user by enhancing their larger degree trend analysis. Elliott Wave patterns: MTPredictor can also automatically find the main common Elliott Wave patterns, for example MTPredictor identified a Wave 5 high on this Daily Chart of the GBPUSD:
But, the Elliott Wave module is capable of far more, because not only does it use my unique Isolation Approach™ to Elliott wave (which reduces the confusion from less-than-ideal patterns), but the module also automatically places the WPTs (Wave Price Targets) on the chart for you. These are the most likely Price zones where each wave is most likely to end. This, combined with the coloured reversal bars, nailed the Wave (5) high to the very bar !

Introduction to MTPredictor Page 31
Trade at your own risk. There is risk of loss when trading speculative markets. This document is for information and educational purposes only and should not be considered trading recommendations. You should seek appropriate advice from your broker, or licensed
investment advisor, before taking any action. All trading decisions are your own sole responsibility, and MTPredictor or S. E. Griffiths or anybody working with MTPredictor Ltd cannot be held responsible for any losses that are incurred as a result. Past performance is no
guarantee of future results. © MTPredictor - www.MTPredictor.com 2001 - 2018.
The Elliott Wave module is in MTPredictor v7.5, MTPredictor 8 and the MTP RT add-ons for NinjaTrader 7 and NinjaTrader 8. Here is another example, this time on a US Stock, VRSK on a Daily Chart:
Here the module automatically identified the ABC correction which unfolded before VRSK rallied to new highs. As with the example on the prior page, the Elliott Wave Module not only found the ABC pattern but also placed the WPT (Wave Price Target) zones on the chart for you. These are the most likely areas where all the main Elliott Wave patterns are most likely to end. As you can see in this example, the Wave C low ended right in the minimum Wave C WPT, with a blue (buy) bar before the rally continued. The Elliott Wave tool will only find a pattern if there is a valid pattern on the current swing high or low. In this way, it avoids placing less reliable and confusing wave counts on the chart all the time. This is my unique isolation approach to Elliott Wave analysis and avoids the confusion often associated with traditional Elliott Wave Analysis. We only work with the main simple Elliott Wave patterns, (Waves, 1, 2 ,3, 4, 5 and the ABC correction). we are not interested in complex corrections or alternate counts, all of which, as their name suggest are complex and confusing, so should be avoided.

Introduction to MTPredictor Page 32
Trade at your own risk. There is risk of loss when trading speculative markets. This document is for information and educational purposes only and should not be considered trading recommendations. You should seek appropriate advice from your broker, or licensed
investment advisor, before taking any action. All trading decisions are your own sole responsibility, and MTPredictor or S. E. Griffiths or anybody working with MTPredictor Ltd cannot be held responsible for any losses that are incurred as a result. Past performance is no
guarantee of future results. © MTPredictor - www.MTPredictor.com 2001 - 2018.
WPT Tool: In the last section, we saw how MTPredictor could find a valid Elliot Wave Pattern by picking a Pivot high or low. But what if the current Elliott Wave pattern was not complete and you wanted to get a projection of possible future targets for the current wave that was correctly unfolding. For this we have our WPT (Wave Price Target) tool. Let’s look at an example on the Daily GBPUSD from earlier. If we go back in time a bit, back to when the Wave 4 low unfolded.
So the question would be where would a possible Wave 5 rally go to, in other words what are the possible Wave 5 targets for this next swing ? Continued on the next page……

Introduction to MTPredictor Page 33
Trade at your own risk. There is risk of loss when trading speculative markets. This document is for information and educational purposes only and should not be considered trading recommendations. You should seek appropriate advice from your broker, or licensed
investment advisor, before taking any action. All trading decisions are your own sole responsibility, and MTPredictor or S. E. Griffiths or anybody working with MTPredictor Ltd cannot be held responsible for any losses that are incurred as a result. Past performance is no
guarantee of future results. © MTPredictor - www.MTPredictor.com 2001 - 2018.
Using the WPT tool, we can perform a series of Mouse clicks, on the prior swings. This projects the possible future Price targets for where the Wave 5 swing could end. For ease of use these are labelled, minimum, typical and maximum.
No need to do multiple individual Fibonacci Price projections, and then struggling with trying to decide which projections cluster together, all this work is done for you by the software. You are just presented with easy to understand, coloured coded price levels on the chart. The WPT price projections zones are available for the main Elliott Wave patterns. Continued on the next page
Introduction to MTPredictor Page 34
Trade at your own risk. There is risk of loss when trading speculative markets. This document is for information and educational purposes only and should not be considered trading recommendations. You should seek appropriate advice from your broker, or licensed
investment advisor, before taking any action. All trading decisions are your own sole responsibility, and MTPredictor or S. E. Griffiths or anybody working with MTPredictor Ltd cannot be held responsible for any losses that are incurred as a result. Past performance is no
guarantee of future results. © MTPredictor - www.MTPredictor.com 2001 - 2018.
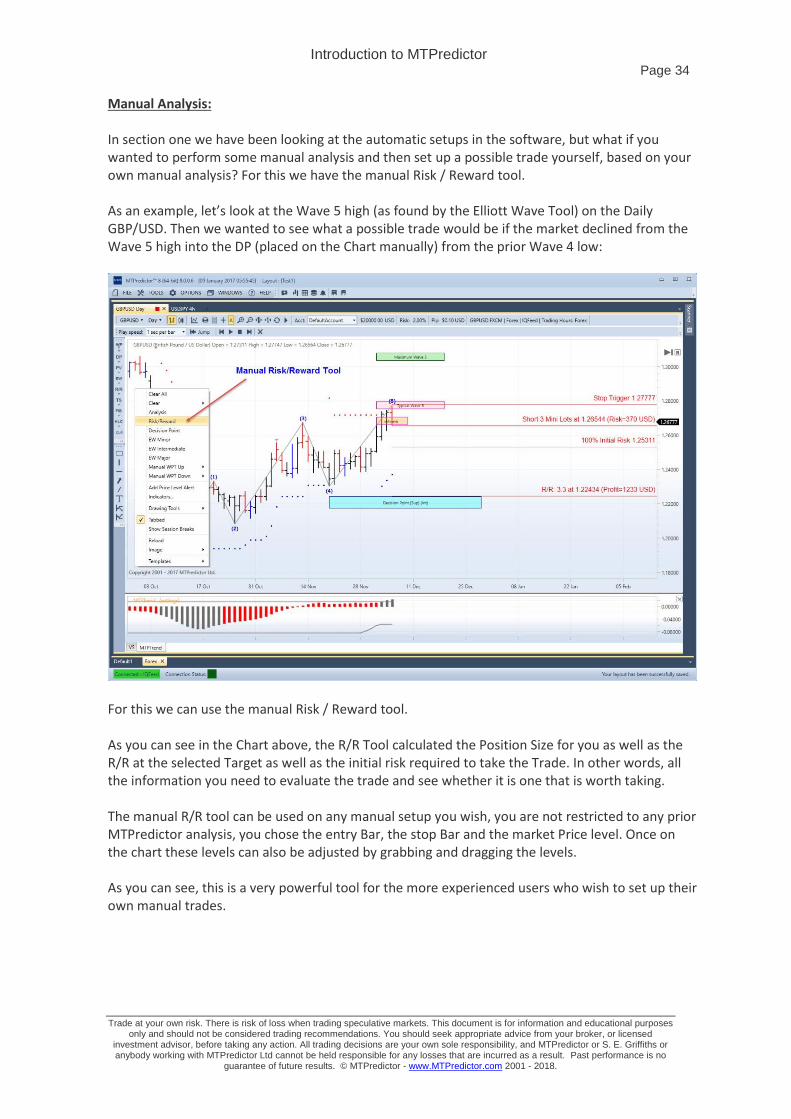
Manual Analysis: In section one we have been looking at the automatic setups in the software, but what if you wanted to perform some manual analysis and then set up a possible trade yourself, based on your own manual analysis? For this we have the manual Risk / Reward tool. As an example, let’s look at the Wave 5 high (as found by the Elliott Wave Tool) on the Daily GBP/USD. Then we wanted to see what a possible trade would be if the market declined from the Wave 5 high into the DP (placed on the Chart manually) from the prior Wave 4 low:
For this we can use the manual Risk / Reward tool. As you can see in the Chart above, the R/R Tool calculated the Position Size for you as well as the R/R at the selected Target as well as the initial risk required to take the Trade. In other words, all the information you need to evaluate the trade and see whether it is one that is worth taking. The manual R/R tool can be used on any manual setup you wish, you are not restricted to any prior MTPredictor analysis, you chose the entry Bar, the stop Bar and the market Price level. Once on the chart these levels can also be adjusted by grabbing and dragging the levels. As you can see, this is a very powerful tool for the more experienced users who wish to set up their own manual trades.

Introduction to MTPredictor Page 35
Trade at your own risk. There is risk of loss when trading speculative markets. This document is for information and educational purposes only and should not be considered trading recommendations. You should seek appropriate advice from your broker, or licensed
investment advisor, before taking any action. All trading decisions are your own sole responsibility, and MTPredictor or S. E. Griffiths or anybody working with MTPredictor Ltd cannot be held responsible for any losses that are incurred as a result. Past performance is no
guarantee of future results. © MTPredictor - www.MTPredictor.com 2001 - 2018.
Section 3 – other topics In this section I would like to start with trade management. Trade Management The basic ingredient for a good trading system is that it has small losses - achieved by the tight trade entries already discussed - and that the profits are large. For this, we must have a good trade management strategy. However, markets are very dynamic and, from my 30 years’ experience, I have found that to get the best results over time it is difficult to use a single trade management strategy. The reason is that the market does not unfold the same way each day. Some days have wide ranges, when the market runs a long way, whereas other days are narrower, with small, choppy swings. The same applies to daily charts. Sometimes the market is in an impulsive phase and the trend runs a long time, while at other times the swings are shorter and choppier. Trying to have just one trade management strategy to cope with both situations is impossible. This is why we have two strategies specifically designed to maximise your profits in each of these scenarios. First, there are the standard profit targets (WPTs) - the coloured zones displayed on the chart for you and used for our initial R/R calculations. These do a great job of taking profits slightly earlier and, as such, are ideal for maximising your profits on narrow range choppy days (for day-trading) or during the small, choppy periods (when using daily bar charts). Second, there is the trailing ATRStop, specifically designed to let trades run further when a big move is underway… Okay, the question I hear you ask is – “how do I know which method to use?” The answer to this is simple – look at how the current peak in the MTPTrend oscillator relates to the position of its strength band. This show you where the current swing is in relation to prior swings, so you can gauge whether the current swing is strong or weak compared with recent history. You can then use this information to decide whether to take profits earlier (using the WPTs) if the current swing is weak or look to use the ATR stop to run your trade further if the strength band on the MTPTrend Indicator has been breached and the current swing is strong. Let’s take a look at some examples …

Introduction to MTPredictor Page 36
Trade at your own risk. There is risk of loss when trading speculative markets. This document is for information and educational purposes only and should not be considered trading recommendations. You should seek appropriate advice from your broker, or licensed
investment advisor, before taking any action. All trading decisions are your own sole responsibility, and MTPredictor or S. E. Griffiths or anybody working with MTPredictor Ltd cannot be held responsible for any losses that are incurred as a result. Past performance is no
guarantee of future results. © MTPredictor - www.MTPredictor.com 2001 - 2018.
Weak MTPTrend example – use WPTs to bank profit early:
In this example, we had a good TS3 buy on this 4hr Crude Oil chart. And as you can see, the market rallied nicely to reach the first projected profit target. But, should you look to bank profits here or run the trade further ? The answer is to look at the current value of the MTPTrend oscillator and see where this is in realtion to its strength band (grey line on the oscillator). As you can see from the chart above, in this example the MTPTrend had not reached its strength band, suggesting that the current swing was weak (in relation to prior moves) - so you should consider taking profits earlier (using the WPTs or DPs) rather than looking to run this trade. As you can see, this would have banked a very nice +8R profit. Now, let’s look at another example. Continued on the next page ....

Introduction to MTPredictor Page 37
Trade at your own risk. There is risk of loss when trading speculative markets. This document is for information and educational purposes only and should not be considered trading recommendations. You should seek appropriate advice from your broker, or licensed
investment advisor, before taking any action. All trading decisions are your own sole responsibility, and MTPredictor or S. E. Griffiths or anybody working with MTPredictor Ltd cannot be held responsible for any losses that are incurred as a result. Past performance is no
guarantee of future results. © MTPredictor - www.MTPredictor.com 2001 - 2018.
Strong MTPtrend example – use ATRStop to run trades further: Lets take a look at a VS (Volume Spike) long tarde on a Daily US Stock, COL (Rockwell Collins Inc):
Can you see the difference here as the market reached the first project profit target? In this example, the MTPTrend has reached (in fact had already exceeded) its strength band. This indicated that the current move was strong (in relation to prior moves) and you should switch to using the ATRStop to let this trade run. Continued on the next page......

Introduction to MTPredictor Page 38
Trade at your own risk. There is risk of loss when trading speculative markets. This document is for information and educational purposes only and should not be considered trading recommendations. You should seek appropriate advice from your broker, or licensed
investment advisor, before taking any action. All trading decisions are your own sole responsibility, and MTPredictor or S. E. Griffiths or anybody working with MTPredictor Ltd cannot be held responsible for any losses that are incurred as a result. Past performance is no
guarantee of future results. © MTPredictor - www.MTPredictor.com 2001 - 2018.
The result:
As you can see, COL did continue higher as the rally gained strength. Using the ATRStop enabled you to run this trade, enabling you to maximise the profit. Again, this technique is only applicable when the market makes a strong move. This does not happen all the time - sometimes the market is in a sideways and choppy period, therefore having two exit strategies designed to take account of either a sideways choppy market or a strong trending market is vital...and something that most other trading approaches do not have. Continued on the next page……………..

Introduction to MTPredictor Page 39
Trade at your own risk. There is risk of loss when trading speculative markets. This document is for information and educational purposes only and should not be considered trading recommendations. You should seek appropriate advice from your broker, or licensed
investment advisor, before taking any action. All trading decisions are your own sole responsibility, and MTPredictor or S. E. Griffiths or anybody working with MTPredictor Ltd cannot be held responsible for any losses that are incurred as a result. Past performance is no
guarantee of future results. © MTPredictor - www.MTPredictor.com 2001 - 2018.
History Signals When you first look at an MTPredictor chart, you can see the automatic trade setups, as well as small triangles. So far I have talked about the automatic setups, but have not mentioned these small triangles. These are potential historical setups that unfolded at the time. They are not just losing trades, they are automatic trades that would have been filled on the next Bar, so should be considered as filled trades and not just failed trades. For a more detailed explanation of this, please see the help video on the web site. But for now, these show you past potential trades that would have unfolded on the chart at the time:
Continued on the next page.........

Introduction to MTPredictor Page 40
Trade at your own risk. There is risk of loss when trading speculative markets. This document is for information and educational purposes only and should not be considered trading recommendations. You should seek appropriate advice from your broker, or licensed
investment advisor, before taking any action. All trading decisions are your own sole responsibility, and MTPredictor or S. E. Griffiths or anybody working with MTPredictor Ltd cannot be held responsible for any losses that are incurred as a result. Past performance is no
guarantee of future results. © MTPredictor - www.MTPredictor.com 2001 - 2018.
You can place the Analysis on any of these triangles (on the correctly coloured reversal Bar) for you to take a closer look at the setup and then decide how it would have been traded at the time. These show you all the normal entry, and stop levels. This allows you to see whether a trade was filled and then whether it was stopped out or not.
In this way, it gives you confidence that you can see, and then analyse, all the past historical setups that would have unfolded at the time. Continued on the next page........

Introduction to MTPredictor Page 41
Trade at your own risk. There is risk of loss when trading speculative markets. This document is for information and educational purposes only and should not be considered trading recommendations. You should seek appropriate advice from your broker, or licensed
investment advisor, before taking any action. All trading decisions are your own sole responsibility, and MTPredictor or S. E. Griffiths or anybody working with MTPredictor Ltd cannot be held responsible for any losses that are incurred as a result. Past performance is no
guarantee of future results. © MTPredictor - www.MTPredictor.com 2001 - 2018.
Position Sizing Correct Position Sizing is one of the most important parts to a successful trading approach, however is not used in the vast majority of trading software or mentioned by most trading gurus. So this material may be new to you. Position Sizing uses a selected % risk on each of your trades, so sizes the position to take account of the difference in the trade entry and initial protective stop levels for different trades. Different trades have different trade entries and different stop levels - sometimes the entry is close to the initial stop level, sometimes it is further away. If you always traded in a set number of lots, shares or contracts, your initial risks between these different set-ups would vary. If your initial risk varies from trade to trade, it is impossible to keep your losses small and constant. The only way to achieve this is by the use of correct Position Sizing. You will have heard of the phrase keep your losses small and your profits large to succeed in trading. But what this fails to address is exactly how to achieve it when you have different initial risks on different set-ups and across different markets. More importantly, this is the only way to get your profits to relate directly to your losses. This is vital if you are truly to have profits that are large in relation to your small losses. This may seem complicated but the solution is simple. All you have to do is apply the same % of your trading account to each trade. To do this, you will have to vary the number of lots, shares or contracts you trade - to keep this initial % risk constant from trade to trade. For example, we suggest a maximum risk of 1-2% for trading futures, 0.1-0.5% for stocks, 1-3% for Forex and 1-2% if you day trade. So, for a 2% risk on a US $20,000 account, this would mean an initial risk of approximately $400 for each of your trade set-ups. You then have to calculate how many lots, shares or contracts to trade for this $400 initial risk, based on the trade entry price and the price of your initial protective stop. This may seem complicated but MTPredictor makes it very easy and performs this calculation for you. Let’s take a look at an example …

Introduction to MTPredictor Page 42
Trade at your own risk. There is risk of loss when trading speculative markets. This document is for information and educational purposes only and should not be considered trading recommendations. You should seek appropriate advice from your broker, or licensed
investment advisor, before taking any action. All trading decisions are your own sole responsibility, and MTPredictor or S. E. Griffiths or anybody working with MTPredictor Ltd cannot be held responsible for any losses that are incurred as a result. Past performance is no
guarantee of future results. © MTPredictor - www.MTPredictor.com 2001 - 2018.
Let’s take a look at an example on a 3min Chart of the NQ index future using a 2% risk on a sample $20,000 account
As you can see, at the time of the initial set-up, the number of lots, shares or contracts is calculated for you - this is the variable from trade to trade - to keep and maintain your small, constant % risk from trade to trade. Here you can see, based on the trade entry level and the level of the initial protective stop, the software suggests you trade 7 contracts for a 2% risk on this sample $20,000 account. This kept the initial risk just below our $400 (2% of $20,000) level. This is what we refer to as one risk unit or 1R. But now comes the really important part…how the profit relates to this initial risk… Too many traders just look at profits in pure money terms and have no idea how this relates to their losses. This is what I was talking about on the prior page, and is one of the reasons most amateur traders are unable to make profits that are truly large in relation to their losses. In this example, when this trade was stopped out the profit was approximately +6.5R or 6.5x the size of the initial risk. This is what is important - not the $2,485 profit but how this $2,485 related to the $385 (excluding slippage and commission) initial risk required to take the trade. In other words, you should look at all your profits in risk units, not just money terms.
Introduction to MTPredictor Page 43
Trade at your own risk. There is risk of loss when trading speculative markets. This document is for information and educational purposes only and should not be considered trading recommendations. You should seek appropriate advice from your broker, or licensed
investment advisor, before taking any action. All trading decisions are your own sole responsibility, and MTPredictor or S. E. Griffiths or anybody working with MTPredictor Ltd cannot be held responsible for any losses that are incurred as a result. Past performance is no
guarantee of future results. © MTPredictor - www.MTPredictor.com 2001 - 2018.
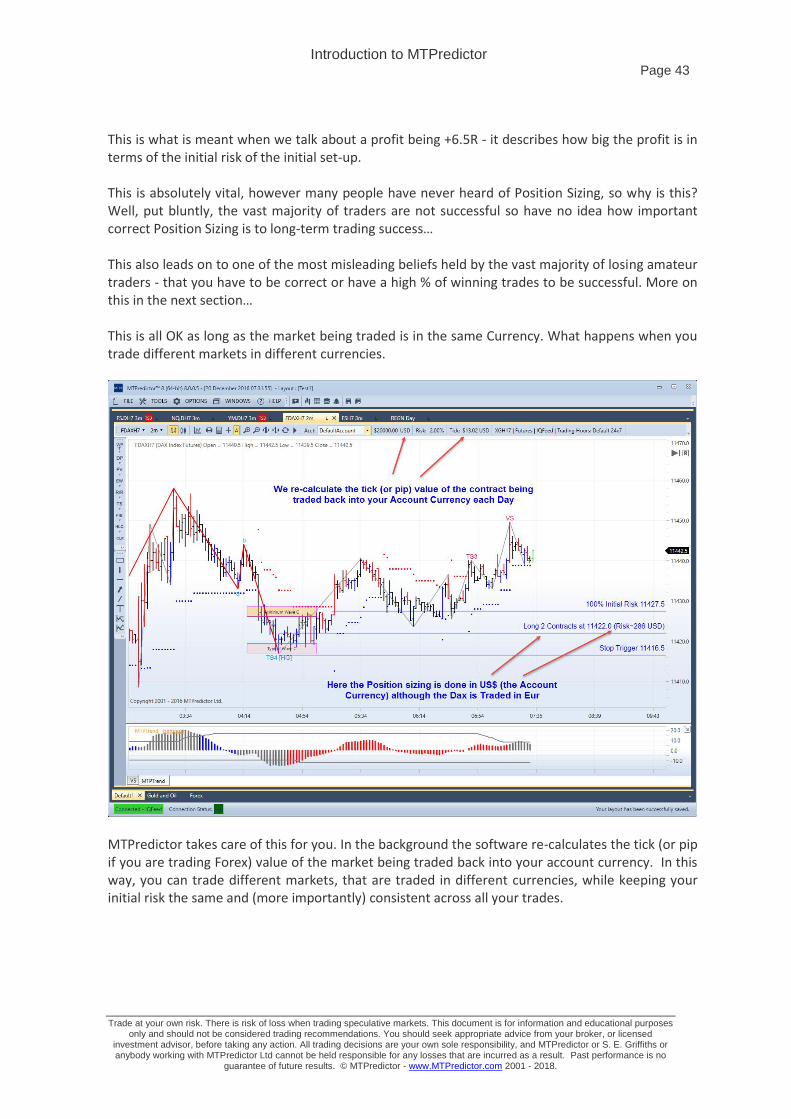
This is what is meant when we talk about a profit being +6.5R - it describes how big the profit is in terms of the initial risk of the initial set-up. This is absolutely vital, however many people have never heard of Position Sizing, so why is this? Well, put bluntly, the vast majority of traders are not successful so have no idea how important correct Position Sizing is to long-term trading success… This also leads on to one of the most misleading beliefs held by the vast majority of losing amateur traders - that you have to be correct or have a high % of winning trades to be successful. More on this in the next section… This is all OK as long as the market being traded is in the same Currency. What happens when you trade different markets in different currencies.
MTPredictor takes care of this for you. In the background the software re-calculates the tick (or pip if you are trading Forex) value of the market being traded back into your account currency. In this way, you can trade different markets, that are traded in different currencies, while keeping your initial risk the same and (more importantly) consistent across all your trades.

Introduction to MTPredictor Page 44
Trade at your own risk. There is risk of loss when trading speculative markets. This document is for information and educational purposes only and should not be considered trading recommendations. You should seek appropriate advice from your broker, or licensed
investment advisor, before taking any action. All trading decisions are your own sole responsibility, and MTPredictor or S. E. Griffiths or anybody working with MTPredictor Ltd cannot be held responsible for any losses that are incurred as a result. Past performance is no
guarantee of future results. © MTPredictor - www.MTPredictor.com 2001 - 2018.
You can also setup MTPredictor with different Accounts in different Currencies, depending on where in the world you live:
This is available in MTPredictor v7.5, MTPredictor 8 and the MTP RT add-ons for NinjaTrader 7 and NinjaTrader 8. Summary - Position Sizing To apply correct Position Sizing to your trades you start by risking the same % of your trading account on each trade. To do this, you will have to vary the number of lots, shares or contracts you trade to keep this initial % risk constant from trade to trade. We suggest a maximum risk of 1-3% for trading futures, 0.1-0.5% for stocks, 1-3% for Forex and 1-2% if you day-trade. So, for a 2% risk on a US $20,000 account, this would mean an initial risk of approximately $400 for each of your trade set-ups. You then have to calculate how many lots, shares or contracts to trade for this $400 initial risk, based on the trade entry price and the price of your initial protective stop. As you have already seen, MTPredictor automatically makes this calculation for you.

Introduction to MTPredictor Page 45
Trade at your own risk. There is risk of loss when trading speculative markets. This document is for information and educational purposes only and should not be considered trading recommendations. You should seek appropriate advice from your broker, or licensed
investment advisor, before taking any action. All trading decisions are your own sole responsibility, and MTPredictor or S. E. Griffiths or anybody working with MTPredictor Ltd cannot be held responsible for any losses that are incurred as a result. Past performance is no
guarantee of future results. © MTPredictor - www.MTPredictor.com 2001 - 2018.
Do you have to be right to make money? This is a very interesting question and one of the most misunderstood aspects to successful trading. First, a little background, as human beings, we have grown up with the idea that we have to be right to get on in life. At school, 70% was always regarded as the typical A grade pass rate and a fail was typically set at 40%. So, from an early age we have been taught that the higher the success rate the better we are. However, in trading things are very, very different and we cannot apply what we have learnt in our life so far... There is a side message here, which blocks most traders’ progress. There are far too many software vendors and gurus preying on the amateur trader’s desire to be right by selling software that they claim is designed to give the amateur what they want – a high success rate or high % of winning trades. But all is not what it seems on the surface. Put bluntly again, trading is not about anticipating what is going to happen in the future. By definition, the future has not happened yet. So, no matter what many people may tell you, it is impossible, (or if not impossible, very very hard) to predict the future with any accuracy over a long period of time. If it were easy then 97% of amateur traders would not fail…but they do! Basically there are two ways to design a system: Firstly, look to take profits early. This has the effect of giving a higher % of winners because you are not trying to look too far into the future. However, most such systems have a major drawback - the profits are usually only small in relation to the losses. So, just a small upset in the system (such as bad fills) can send it into a loss. This is why most back-tested profitable systems fail in the real word… Secondly, design a system that works in tune with how the markets really unfold. Typically, markets can unfold in three basic ways: they can go up; they can go down; they can move sideways. Most of us are familiar with rising markets and falling markets but in reality a sideways market is far more common. Typically, markets will spend about 2/3 of their time moving sideways and about 1/3 of their time in a trend (moving either strongly up or down). Most trading strategies rely on a market moving, either in an uptrend or a downtrend - to make money. So, what should you really anticipate as far as profits and losses are concerned? Over the last 30 years that I have been involved in the markets and from seeing hundreds of different trading systems, I have seen that profits and losses and breakeven (no profit or loss) trades tend to unfold in approximately equal 1/3 segments. Put another way, about 1/3 of the time, losses should be unfolding, about 1/3 of the time, breakeven trades should be unfolding and about 1/3 of the time, profits should be unfolding. But is that where the story ends? Well, not quite...because the profitable 1/3 often splits down into 1/2, where the profitable trades are small profits (such as +2R or +3R) and 1/2 where the large profits (+5R and above) fall. What this means is that the largest profits only unfold about 1/6 (1/2 of the profitable 1/3) of the time! This is precisely where most amateur traders fall down.

Introduction to MTPredictor Page 46
Trade at your own risk. There is risk of loss when trading speculative markets. This document is for information and educational purposes only and should not be considered trading recommendations. You should seek appropriate advice from your broker, or licensed
investment advisor, before taking any action. All trading decisions are your own sole responsibility, and MTPredictor or S. E. Griffiths or anybody working with MTPredictor Ltd cannot be held responsible for any losses that are incurred as a result. Past performance is no
guarantee of future results. © MTPredictor - www.MTPredictor.com 2001 - 2018.
Let’s look at this in a picture:
As such, 2/3 of the time either losses (albeit small) and breakeven trades should be unfolding, and only about 1/6 of the time should the large Profits be unfolding. Most amateur traders find it very difficult to deal with this psychologically because most amateur traders - this is basic human nature - want to be right all the time and have big profits all the time. So, what happens in practice is that the amateur trader will have 2, 3 or 4 losing or breakeven trades... then, as soon as they get one winner, they will exit that winner too early. By not managing it correctly, they cut one of their big profitable winners into a small winner. This can have a devastating impact on their overall profitability because the big winners are necessary to make the money in the longer term. I am sure that you can understand that by not allowing these big winners to develop, and banking profits too early, you miss out on the big winners. This is where MTPredictor can help, because the software has been designed to keep the losses small, while still allowing you to maximise Profits. Exactly what all successful traders wish to achieve! Continued on the next page………….

Introduction to MTPredictor Page 47
Trade at your own risk. There is risk of loss when trading speculative markets. This document is for information and educational purposes only and should not be considered trading recommendations. You should seek appropriate advice from your broker, or licensed
investment advisor, before taking any action. All trading decisions are your own sole responsibility, and MTPredictor or S. E. Griffiths or anybody working with MTPredictor Ltd cannot be held responsible for any losses that are incurred as a result. Past performance is no
guarantee of future results. © MTPredictor - www.MTPredictor.com 2001 - 2018.
SUMMARY Right at the start of this document I outlined how all traders must be able to answer the four main questions:
• How to find a trade
• How to assess the Risk/Reward
• How to determine the Position Size
• How to manage the trade
As you have seen from the examples throughout this document, the MTPredictor software has been designed to do exactly that, help you find, then assess, then manage your trades, and, with the correct use of Position Sizing, to keep your losses small. When you first start with the software and you are new to MTPredictor, please just focus on the automatic trade set-ups, making sure you are in the direction of the larger degree trend and only when the picture is clear. While MTPredictor has automatic setups, we do not suggest that you just follow these blindly as if it were a black box mechanical system, judgment is needed in filtering the automatic setups, particularly with respect a clear larger degree trend. Then, once you become more experienced, you can start to move onto more advanced Analysis and manual trade set-ups that are available within the software. You can also pick and choose which setups you wish to follow; my personal favourites are the [W3] Wave 3 and [VS] (Volume Spike) setups. But there is no rush…the markets will be here tomorrow, so please take your time, use the setups that work for you, and fit in with your own personal Trading plan. Trade in a SIM Account (no live money) until you are comfortable and can make money on the Sim Account. Lastly, please be realistic with your trading expectations – there are too many software vendors promising untold riches with little or no effort. Common sense tells you this is nonsense – trading is a professional business so please treat it professionally. This includes your expectations of profits and how long it will take to become proficient at trading. Also be realistic about how much trading capital is required. US$10,000 should be an absolute minimum – US$20,000 is a more realistic minimum, remember losses can and will unfold, so you need to have enough capital to cope. Thanks and good trading . . . Steve Griffiths Managing Director and Developer of MTPredictor MTPredictor Ltd. www.mtpredictor.com ________________________________________________________________________________________
Risk Disclaimer and Disclosure Statement No offer or solicitation to buy or sell securities, securities derivative, futures products or off-exchange foreign
currency (Forex) transactions of any kind, or any type of trading or investment advice, recommendation or
strategy, is made, given or in any manner endorsed by any MTPredictor Ltd, or anybody associated with
MTPredictor Ltd.
Past performance, whether actual or indicated by historical results, is no guarantee of future performance or success. There is a possibility that you may sustain a loss equal to or greater than your entire investment
regardless of which asset class you trade (Equities, Options Futures or Forex); therefore, you should not invest
or risk money that you cannot afford to lose. Please read the full Risk Disclaimer and Disclosed and full Terms
and Conditions.
All trades shown in this document are hypothetical, they were not executed. They are shown for illustration and
training purposes only. © MTPredictor Ltd. All rights reserved. 2001-2018
There is risk of loss in trading and investing. All trade decisions are your own sole responsibility.